Burna, KY Map & Demographics
Burna Map
Burna Overview
$201,437
PER CAPITA INCOME
0.80
INEQUALITY / GINI INDEX
101
TOTAL POPULATION
32
MALE POPULATION
69
FEMALE POPULATION
46.38
MALES / 100 FEMALES
215.62
FEMALES / 100 MALES
51.9
MEDIAN AGE
3.9
AVG FAMILY SIZE
2.1
AVG HOUSEHOLD SIZE
38
LABOR FORCE [ PEOPLE ]
40.0%
PERCENT IN LABOR FORCE
Burna Zip Codes
Burna Area Codes
Income in Burna
Income Overview in Burna
| Characteristic | Number | Measure |
| Per Capita Income | 101 | $201,437 |
| Median Family Income | 18 | $0 |
| Mean Family Income | 18 | $446,806 |
| Median Household Income | 48 | $0 |
| Mean Household Income | 48 | $173,296 |
| Income Deficit | 18 | $0 |
| Wage / Income Gap (%) | 101 | 0.00% |
| Wage / Income Gap ($) | 101 | 100.00¢ per $1 |
| Gini / Inequality Index | 101 | 0.80 |
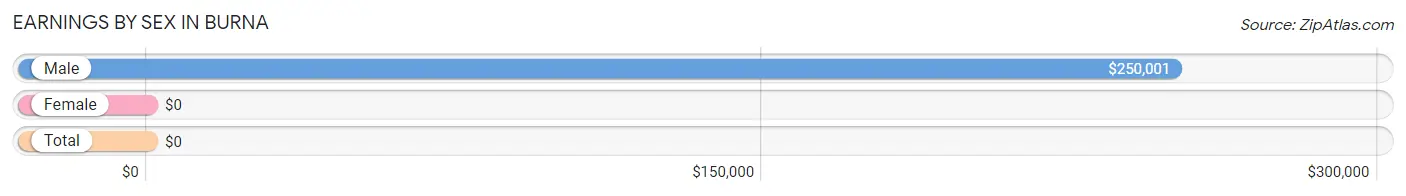
Earnings by Sex in Burna
| Sex | Number | Average Earnings |
| Male | 26 (68.4%) | $250,001 |
| Female | 12 (31.6%) | $0 |
| Total | 38 (100.0%) | $0 |
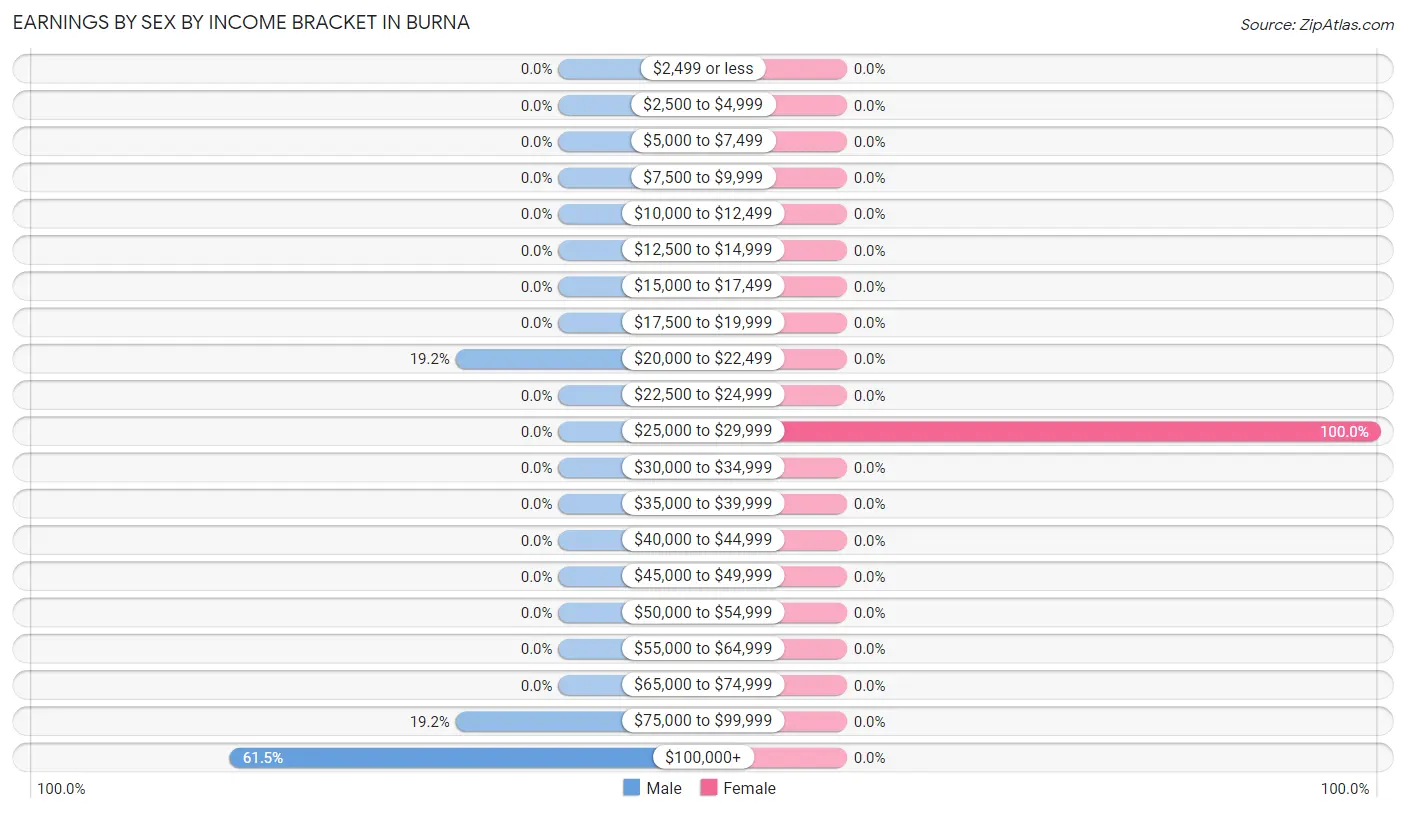
Earnings by Sex by Income Bracket in Burna
The most common earnings brackets in Burna are $100,000+ for men (16 | 61.5%) and $25,000 to $29,999 for women (12 | 100.0%).
| Income | Male | Female |
| $2,499 or less | 0 (0.0%) | 0 (0.0%) |
| $2,500 to $4,999 | 0 (0.0%) | 0 (0.0%) |
| $5,000 to $7,499 | 0 (0.0%) | 0 (0.0%) |
| $7,500 to $9,999 | 0 (0.0%) | 0 (0.0%) |
| $10,000 to $12,499 | 0 (0.0%) | 0 (0.0%) |
| $12,500 to $14,999 | 0 (0.0%) | 0 (0.0%) |
| $15,000 to $17,499 | 0 (0.0%) | 0 (0.0%) |
| $17,500 to $19,999 | 0 (0.0%) | 0 (0.0%) |
| $20,000 to $22,499 | 5 (19.2%) | 0 (0.0%) |
| $22,500 to $24,999 | 0 (0.0%) | 0 (0.0%) |
| $25,000 to $29,999 | 0 (0.0%) | 12 (100.0%) |
| $30,000 to $34,999 | 0 (0.0%) | 0 (0.0%) |
| $35,000 to $39,999 | 0 (0.0%) | 0 (0.0%) |
| $40,000 to $44,999 | 0 (0.0%) | 0 (0.0%) |
| $45,000 to $49,999 | 0 (0.0%) | 0 (0.0%) |
| $50,000 to $54,999 | 0 (0.0%) | 0 (0.0%) |
| $55,000 to $64,999 | 0 (0.0%) | 0 (0.0%) |
| $65,000 to $74,999 | 0 (0.0%) | 0 (0.0%) |
| $75,000 to $99,999 | 5 (19.2%) | 0 (0.0%) |
| $100,000+ | 16 (61.5%) | 0 (0.0%) |
| Total | 26 (100.0%) | 12 (100.0%) |
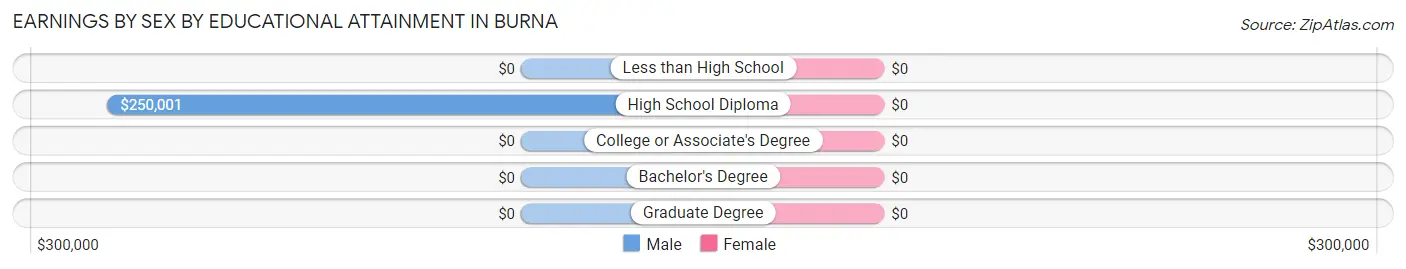
Earnings by Sex by Educational Attainment in Burna
| Educational Attainment | Male Income | Female Income |
| Less than High School | - | - |
| High School Diploma | $250,001 | $0 |
| College or Associate's Degree | - | - |
| Bachelor's Degree | - | - |
| Graduate Degree | - | - |
| Total | $250,001 | $0 |
Family Income in Burna
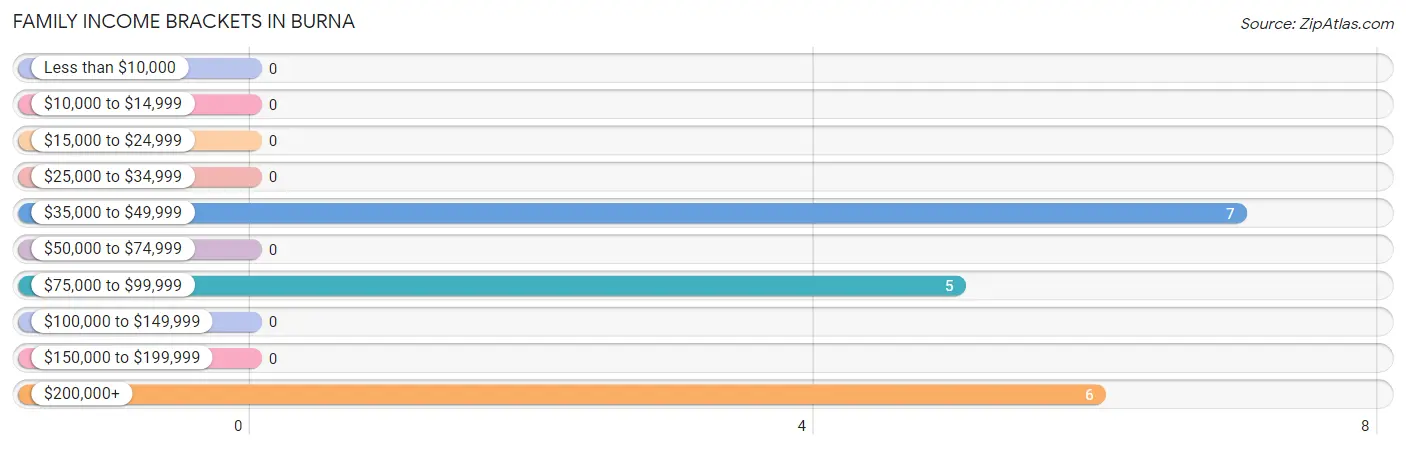
Family Income Brackets in Burna
According to the Burna family income data, there are 7 families falling into the $35,000 to $49,999 income range, which is the most common income bracket and makes up 38.9% of all families.
| Income Bracket | # Families | % Families |
| Less than $10,000 | 0 | 0.0% |
| $10,000 to $14,999 | 0 | 0.0% |
| $15,000 to $24,999 | 0 | 0.0% |
| $25,000 to $34,999 | 0 | 0.0% |
| $35,000 to $49,999 | 7 | 38.9% |
| $50,000 to $74,999 | 0 | 0.0% |
| $75,000 to $99,999 | 5 | 27.8% |
| $100,000 to $149,999 | 0 | 0.0% |
| $150,000 to $199,999 | 0 | 0.0% |
| $200,000+ | 6 | 33.3% |
Family Income by Famaliy Size in Burna
| Income Bracket | # Families | Median Income |
| 2-Person Families | 5 (27.8%) | $0 |
| 3-Person Families | 6 (33.3%) | $0 |
| 4-Person Families | 7 (38.9%) | $0 |
| 5-Person Families | 0 (0.0%) | $0 |
| 6-Person Families | 0 (0.0%) | $0 |
| 7+ Person Families | 0 (0.0%) | $0 |
| Total | 18 (100.0%) | $0 |
Family Income by Number of Earners in Burna
| Number of Earners | # Families | Median Income |
| No Earners | 0 (0.0%) | $0 |
| 1 Earner | 11 (61.1%) | $0 |
| 2 Earners | 7 (38.9%) | $0 |
| 3+ Earners | 0 (0.0%) | $0 |
| Total | 18 (100.0%) | $0 |
Household Income in Burna
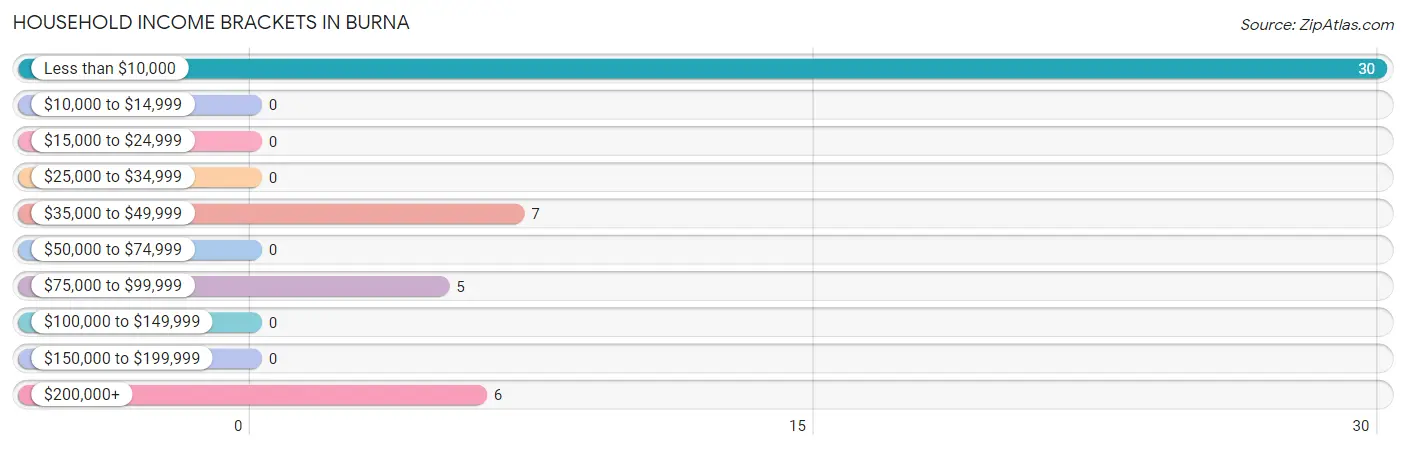
Household Income Brackets in Burna
With 30 households falling in the category, the less than $10,000 income range is the most frequent in Burna, accounting for 62.5% of all households.
| Income Bracket | # Households | % Households |
| Less than $10,000 | 30 | 62.5% |
| $10,000 to $14,999 | 0 | 0.0% |
| $15,000 to $24,999 | 0 | 0.0% |
| $25,000 to $34,999 | 0 | 0.0% |
| $35,000 to $49,999 | 7 | 14.6% |
| $50,000 to $74,999 | 0 | 0.0% |
| $75,000 to $99,999 | 5 | 10.4% |
| $100,000 to $149,999 | 0 | 0.0% |
| $150,000 to $199,999 | 0 | 0.0% |
| $200,000+ | 6 | 12.5% |
Household Income by Householder Age in Burna
| Income Bracket | # Households | Median Income |
| 15 to 24 Years | 7 (14.6%) | $0 |
| 25 to 44 Years | 0 (0.0%) | $0 |
| 45 to 64 Years | 5 (10.4%) | $0 |
| 65+ Years | 36 (75.0%) | $0 |
| Total | 48 (100.0%) | $0 |
Poverty in Burna
Income Below Poverty by Sex and Age in Burna
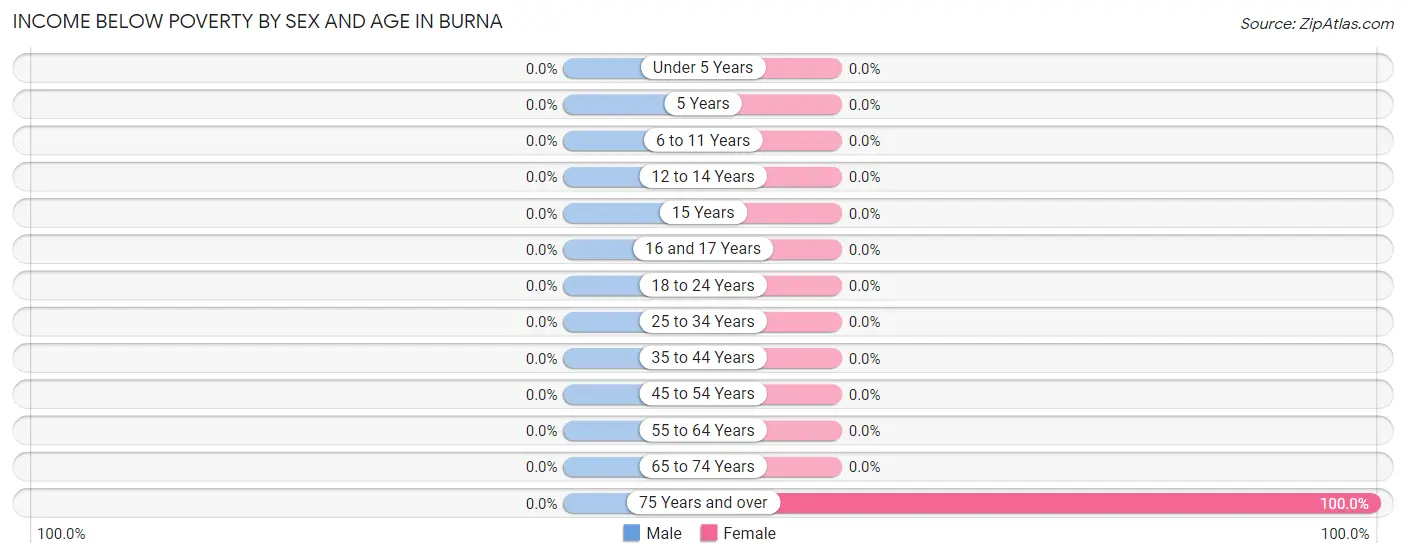
| Age Bracket | Male | Female |
| Under 5 Years | 0 (0.0%) | 0 (0.0%) |
| 5 Years | 0 (0.0%) | 0 (0.0%) |
| 6 to 11 Years | 0 (0.0%) | 0 (0.0%) |
| 12 to 14 Years | 0 (0.0%) | 0 (0.0%) |
| 15 Years | 0 (0.0%) | 0 (0.0%) |
| 16 and 17 Years | 0 (0.0%) | 0 (0.0%) |
| 18 to 24 Years | 0 (0.0%) | 0 (0.0%) |
| 25 to 34 Years | 0 (0.0%) | 0 (0.0%) |
| 35 to 44 Years | 0 (0.0%) | 0 (0.0%) |
| 45 to 54 Years | 0 (0.0%) | 0 (0.0%) |
| 55 to 64 Years | 0 (0.0%) | 0 (0.0%) |
| 65 to 74 Years | 0 (0.0%) | 0 (0.0%) |
| 75 Years and over | 0 (0.0%) | 30 (100.0%) |
| Total | 0 (0.0%) | 30 (43.5%) |
Income Above Poverty by Sex and Age in Burna
According to the poverty statistics in Burna, males aged 25 to 34 years and females aged 6 to 11 years are the age groups that are most secure financially, with 100.0% of males and 100.0% of females in these age groups living above the poverty line.
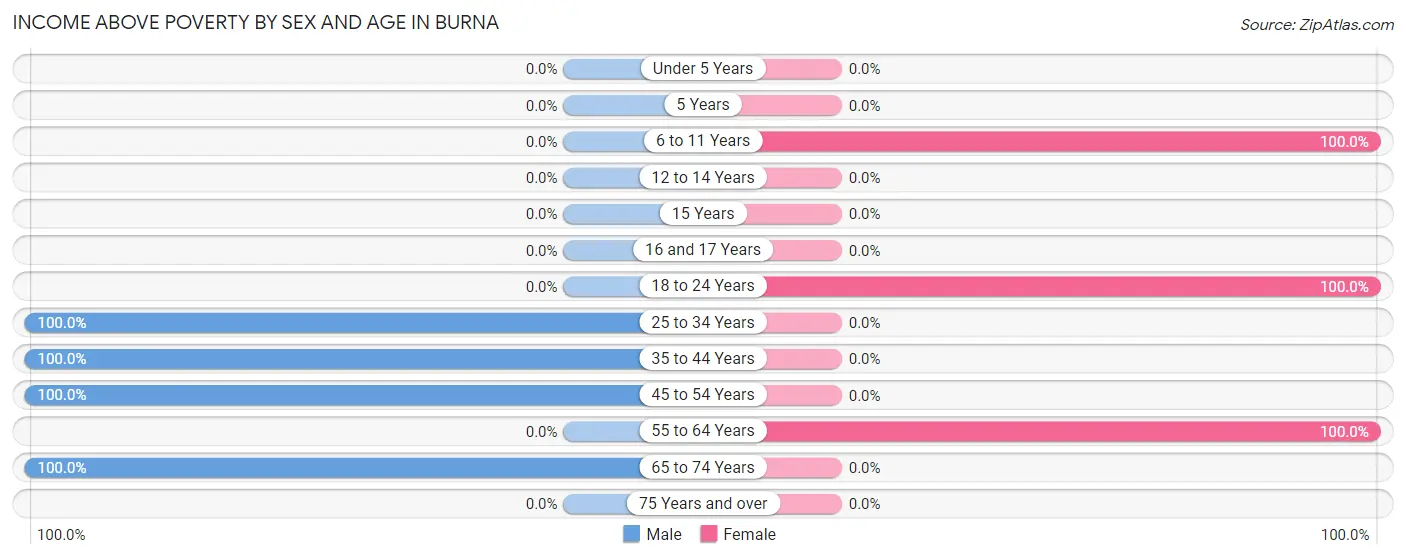
| Age Bracket | Male | Female |
| Under 5 Years | 0 (0.0%) | 0 (0.0%) |
| 5 Years | 0 (0.0%) | 0 (0.0%) |
| 6 to 11 Years | 0 (0.0%) | 6 (100.0%) |
| 12 to 14 Years | 0 (0.0%) | 0 (0.0%) |
| 15 Years | 0 (0.0%) | 0 (0.0%) |
| 16 and 17 Years | 0 (0.0%) | 0 (0.0%) |
| 18 to 24 Years | 0 (0.0%) | 19 (100.0%) |
| 25 to 34 Years | 5 (100.0%) | 0 (0.0%) |
| 35 to 44 Years | 16 (100.0%) | 0 (0.0%) |
| 45 to 54 Years | 5 (100.0%) | 0 (0.0%) |
| 55 to 64 Years | 0 (0.0%) | 14 (100.0%) |
| 65 to 74 Years | 6 (100.0%) | 0 (0.0%) |
| 75 Years and over | 0 (0.0%) | 0 (0.0%) |
| Total | 32 (100.0%) | 39 (56.5%) |
Income Below Poverty Among Married-Couple Families in Burna
| Children | Above Poverty | Below Poverty |
| No Children | 11 (100.0%) | 0 (0.0%) |
| 1 or 2 Children | 7 (100.0%) | 0 (0.0%) |
| 3 or 4 Children | 0 (0.0%) | 0 (0.0%) |
| 5 or more Children | 0 (0.0%) | 0 (0.0%) |
| Total | 18 (100.0%) | 0 (0.0%) |
Income Below Poverty Among Single-Parent Households in Burna
| Children | Single Father | Single Mother |
| No Children | 0 (0.0%) | 0 (0.0%) |
| 1 or 2 Children | 0 (0.0%) | 0 (0.0%) |
| 3 or 4 Children | 0 (0.0%) | 0 (0.0%) |
| 5 or more Children | 0 (0.0%) | 0 (0.0%) |
| Total | 0 (0.0%) | 0 (0.0%) |
Income Below Poverty Among Married-Couple vs Single-Parent Households in Burna
| Children | Married-Couple Families | Single-Parent Households |
| No Children | 0 (0.0%) | 0 (0.0%) |
| 1 or 2 Children | 0 (0.0%) | 0 (0.0%) |
| 3 or 4 Children | 0 (0.0%) | 0 (0.0%) |
| 5 or more Children | 0 (0.0%) | 0 (0.0%) |
| Total | 0 (0.0%) | 0 (0.0%) |
Race in Burna
The most populous races in Burna are , and White / Caucasian (101 | 100.0%).
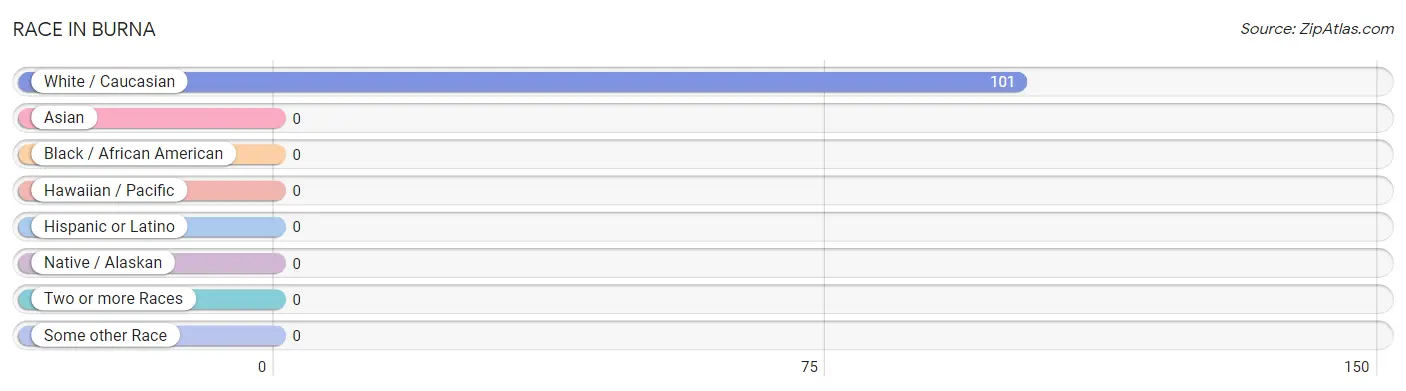
| Race | # Population | % Population |
| Asian | 0 | 0.0% |
| Black / African American | 0 | 0.0% |
| Hawaiian / Pacific | 0 | 0.0% |
| Hispanic or Latino | 0 | 0.0% |
| Native / Alaskan | 0 | 0.0% |
| White / Caucasian | 101 | 100.0% |
| Two or more Races | 0 | 0.0% |
| Some other Race | 0 | 0.0% |
| Total | 101 | 100.0% |
Ancestry in Burna
The most populous ancestries reported in Burna are American (59 | 58.4%), and Portuguese (6 | 5.9%), together accounting for 64.4% of all Burna residents.
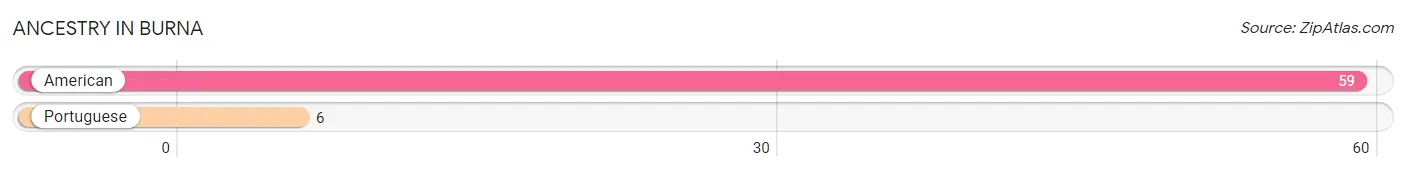
| Ancestry | # Population | % Population |
| American | 59 | 58.4% |
| Portuguese | 6 | 5.9% | View All 2 Rows |
Immigrants in Burna

| Immigration Origin | # Population | % Population | View All 0 Rows |
Sex and Age in Burna
Sex and Age in Burna
The most populous age groups in Burna are 35 to 39 Years (16 | 50.0%) for men and 85 Years and over (30 | 43.5%) for women.
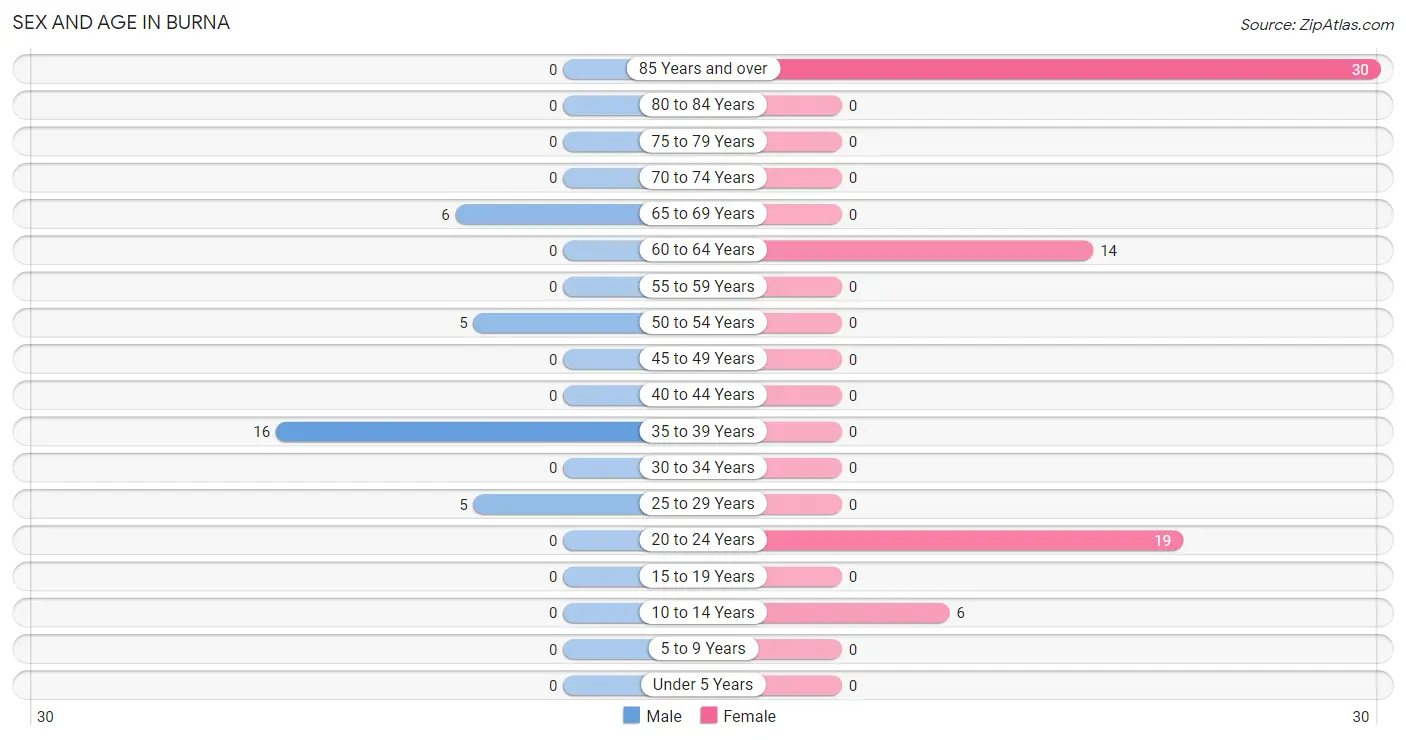
| Age Bracket | Male | Female |
| Under 5 Years | 0 (0.0%) | 0 (0.0%) |
| 5 to 9 Years | 0 (0.0%) | 0 (0.0%) |
| 10 to 14 Years | 0 (0.0%) | 6 (8.7%) |
| 15 to 19 Years | 0 (0.0%) | 0 (0.0%) |
| 20 to 24 Years | 0 (0.0%) | 19 (27.5%) |
| 25 to 29 Years | 5 (15.6%) | 0 (0.0%) |
| 30 to 34 Years | 0 (0.0%) | 0 (0.0%) |
| 35 to 39 Years | 16 (50.0%) | 0 (0.0%) |
| 40 to 44 Years | 0 (0.0%) | 0 (0.0%) |
| 45 to 49 Years | 0 (0.0%) | 0 (0.0%) |
| 50 to 54 Years | 5 (15.6%) | 0 (0.0%) |
| 55 to 59 Years | 0 (0.0%) | 0 (0.0%) |
| 60 to 64 Years | 0 (0.0%) | 14 (20.3%) |
| 65 to 69 Years | 6 (18.8%) | 0 (0.0%) |
| 70 to 74 Years | 0 (0.0%) | 0 (0.0%) |
| 75 to 79 Years | 0 (0.0%) | 0 (0.0%) |
| 80 to 84 Years | 0 (0.0%) | 0 (0.0%) |
| 85 Years and over | 0 (0.0%) | 30 (43.5%) |
| Total | 32 (100.0%) | 69 (100.0%) |
Families and Households in Burna
Median Family Size in Burna
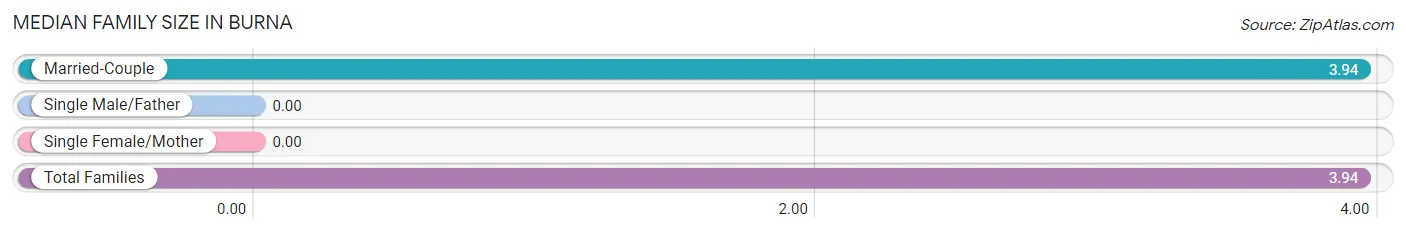
| Family Type | # Families | Family Size |
| Married-Couple | 18 (100.0%) | 3.94 |
| Single Male/Father | 0 (0.0%) | - |
| Single Female/Mother | 0 (0.0%) | - |
| Total Families | 18 (100.0%) | 3.94 |
Median Household Size in Burna
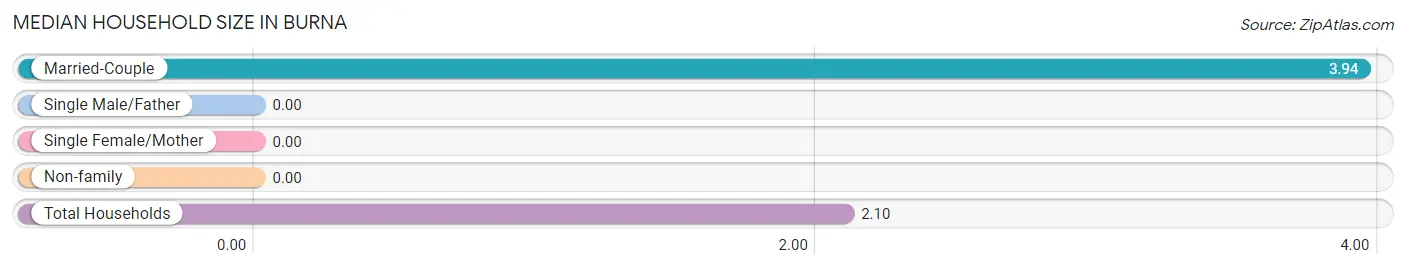
| Household Type | # Households | Household Size |
| Married-Couple | 18 (37.5%) | 3.94 |
| Single Male/Father | 0 (0.0%) | - |
| Single Female/Mother | 0 (0.0%) | - |
| Non-family | 30 (62.5%) | - |
| Total Households | 48 (100.0%) | 2.10 |
Household Size by Marriage Status in Burna
Out of a total of 48 households in Burna, 18 (37.5%) are family households, while 30 (62.5%) are nonfamily households. The most numerous type of family households are 4-person households, comprising 7, and the most common type of nonfamily households are 1-person households, comprising 30.
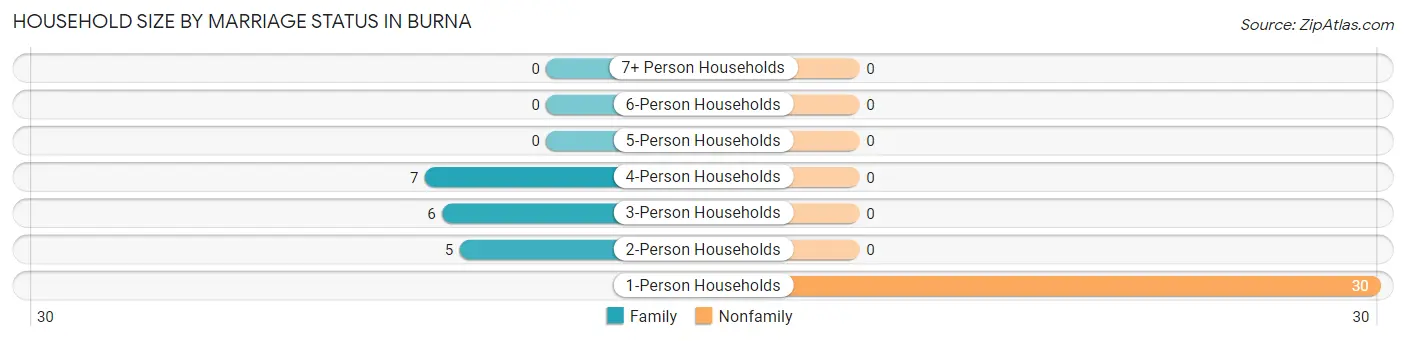
| Household Size | Family Households | Nonfamily Households |
| 1-Person Households | - | 30 (62.5%) |
| 2-Person Households | 5 (10.4%) | 0 (0.0%) |
| 3-Person Households | 6 (12.5%) | 0 (0.0%) |
| 4-Person Households | 7 (14.6%) | 0 (0.0%) |
| 5-Person Households | 0 (0.0%) | 0 (0.0%) |
| 6-Person Households | 0 (0.0%) | 0 (0.0%) |
| 7+ Person Households | 0 (0.0%) | 0 (0.0%) |
| Total | 18 (37.5%) | 30 (62.5%) |
Female Fertility in Burna
Fertility by Age in Burna
| Age Bracket | Women with Births | Births / 1,000 Women |
| 15 to 19 years | 0 (0.0%) | 0.0 |
| 20 to 34 years | 0 (0.0%) | 0.0 |
| 35 to 50 years | 0 (0.0%) | 0.0 |
| Total | 0 (0.0%) | 0.0 |
Fertility by Age by Marriage Status in Burna
| Age Bracket | Married | Unmarried |
| 15 to 19 years | 0 (0.0%) | 0 (0.0%) |
| 20 to 34 years | 0 (0.0%) | 0 (0.0%) |
| 35 to 50 years | 0 (0.0%) | 0 (0.0%) |
| Total | 0 (0.0%) | 0 (0.0%) |
Fertility by Education in Burna
| Educational Attainment | Women with Births | Births / 1,000 Women |
| Less than High School | 0 (0.0%) | 0.0 |
| High School Diploma | 0 (0.0%) | 0.0 |
| College or Associate's Degree | 0 (0.0%) | 0.0 |
| Bachelor's Degree | 0 (0.0%) | 0.0 |
| Graduate Degree | 0 (0.0%) | 0.0 |
| Total | 0 (0.0%) | 0.0 |
Fertility by Education by Marriage Status in Burna
| Educational Attainment | Married | Unmarried |
| Less than High School | 0 (0.0%) | 0 (0.0%) |
| High School Diploma | 0 (0.0%) | 0 (0.0%) |
| College or Associate's Degree | 0 (0.0%) | 0 (0.0%) |
| Bachelor's Degree | 0 (0.0%) | 0 (0.0%) |
| Graduate Degree | 0 (0.0%) | 0 (0.0%) |
| Total | 0 (0.0%) | 0 (0.0%) |
Employment Characteristics in Burna
Employment by Class of Employer in Burna
Among the 38 employed individuals in Burna, private company employees (22 | 57.9%), and local government employees (16 | 42.1%) make up the most common classes of employment.
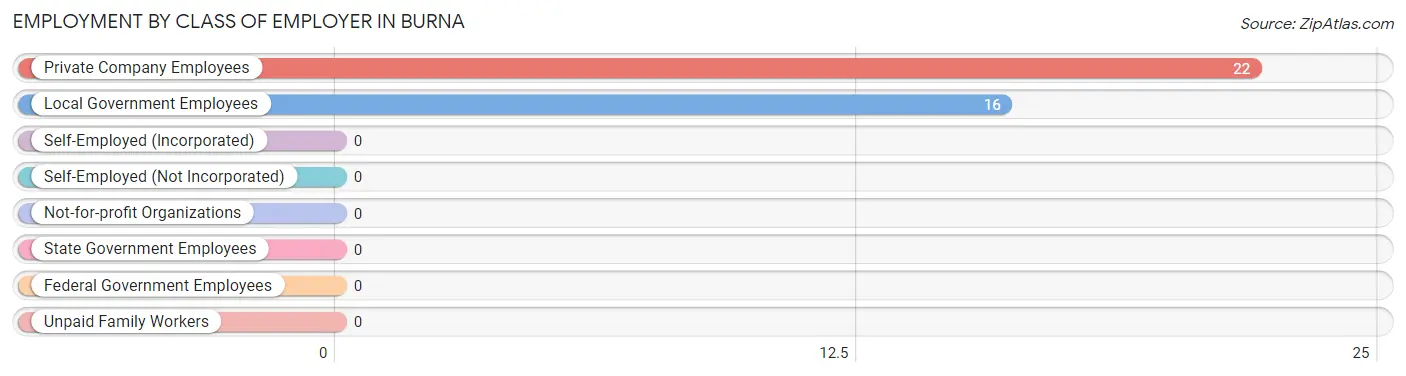
| Employer Class | # Employees | % Employees |
| Private Company Employees | 22 | 57.9% |
| Self-Employed (Incorporated) | 0 | 0.0% |
| Self-Employed (Not Incorporated) | 0 | 0.0% |
| Not-for-profit Organizations | 0 | 0.0% |
| Local Government Employees | 16 | 42.1% |
| State Government Employees | 0 | 0.0% |
| Federal Government Employees | 0 | 0.0% |
| Unpaid Family Workers | 0 | 0.0% |
| Total | 38 | 100.0% |
Employment Status by Age in Burna
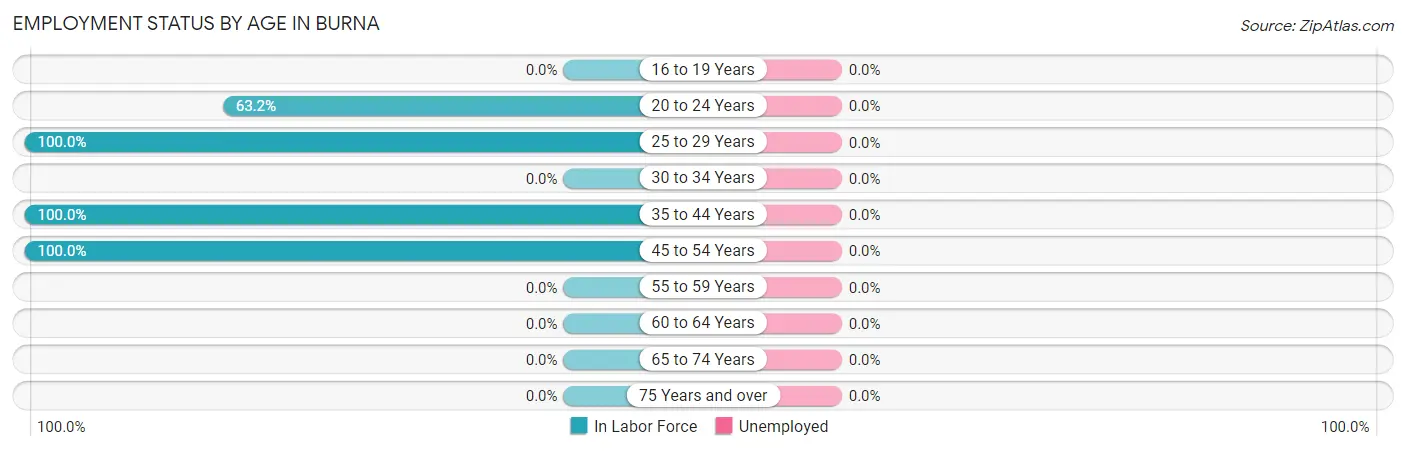
| Age Bracket | In Labor Force | Unemployed |
| 16 to 19 Years | 0 (0.0%) | 0 (0.0%) |
| 20 to 24 Years | 12 (63.2%) | 0 (0.0%) |
| 25 to 29 Years | 5 (100.0%) | 0 (0.0%) |
| 30 to 34 Years | 0 (0.0%) | 0 (0.0%) |
| 35 to 44 Years | 16 (100.0%) | 0 (0.0%) |
| 45 to 54 Years | 5 (100.0%) | 0 (0.0%) |
| 55 to 59 Years | 0 (0.0%) | 0 (0.0%) |
| 60 to 64 Years | 0 (0.0%) | 0 (0.0%) |
| 65 to 74 Years | 0 (0.0%) | 0 (0.0%) |
| 75 Years and over | 0 (0.0%) | 0 (0.0%) |
| Total | 38 (40.0%) | 0 (0.0%) |
Employment Status by Educational Attainment in Burna
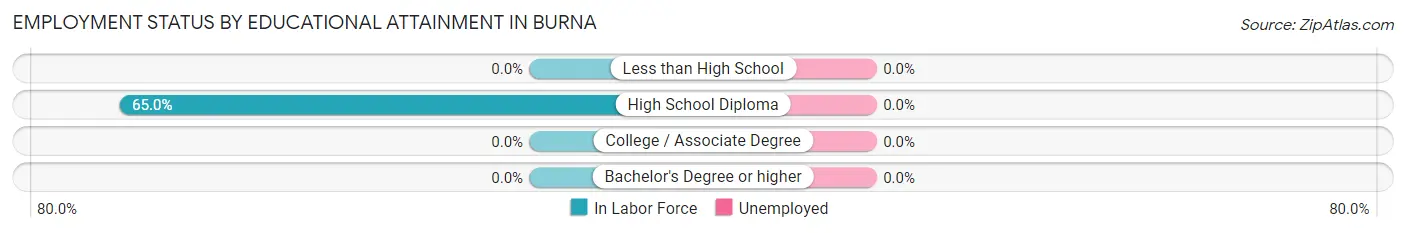
| Educational Attainment | In Labor Force | Unemployed |
| Less than High School | 0 (0.0%) | 0 (0.0%) |
| High School Diploma | 26 (65.0%) | 0 (0.0%) |
| College / Associate Degree | 0 (0.0%) | 0 (0.0%) |
| Bachelor's Degree or higher | 0 (0.0%) | 0 (0.0%) |
| Total | 26 (65.0%) | 0 (0.0%) |
Employment Occupations by Sex in Burna
Management, Business, Science and Arts Occupations
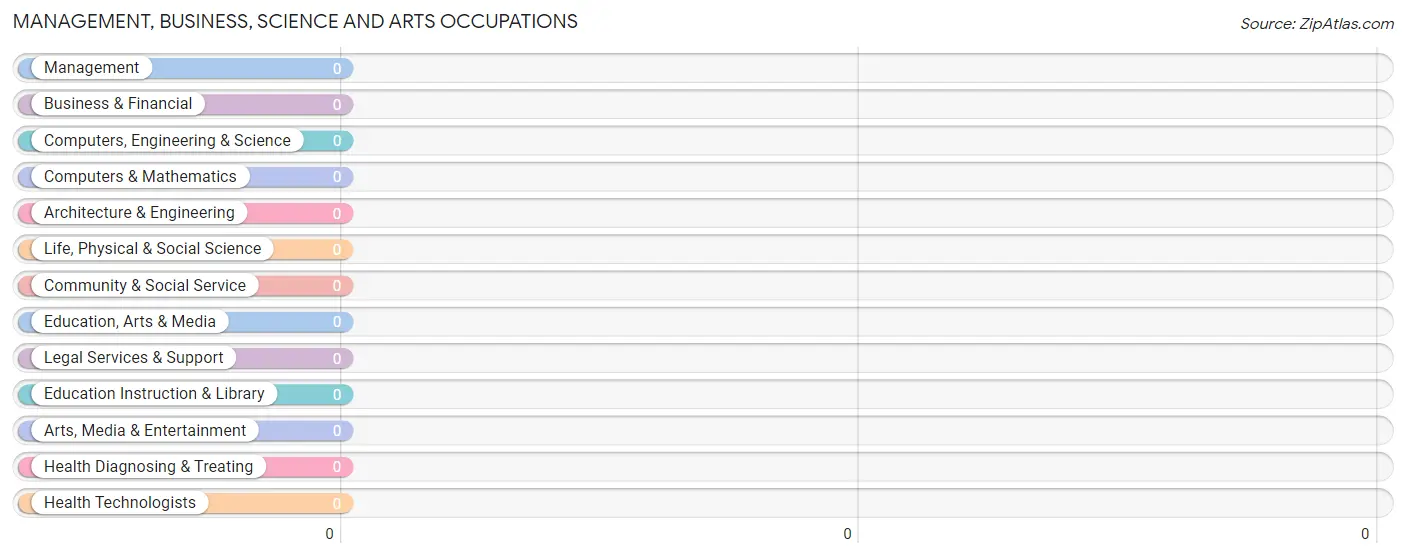
Management, Business, Science and Arts Occupations by Sex
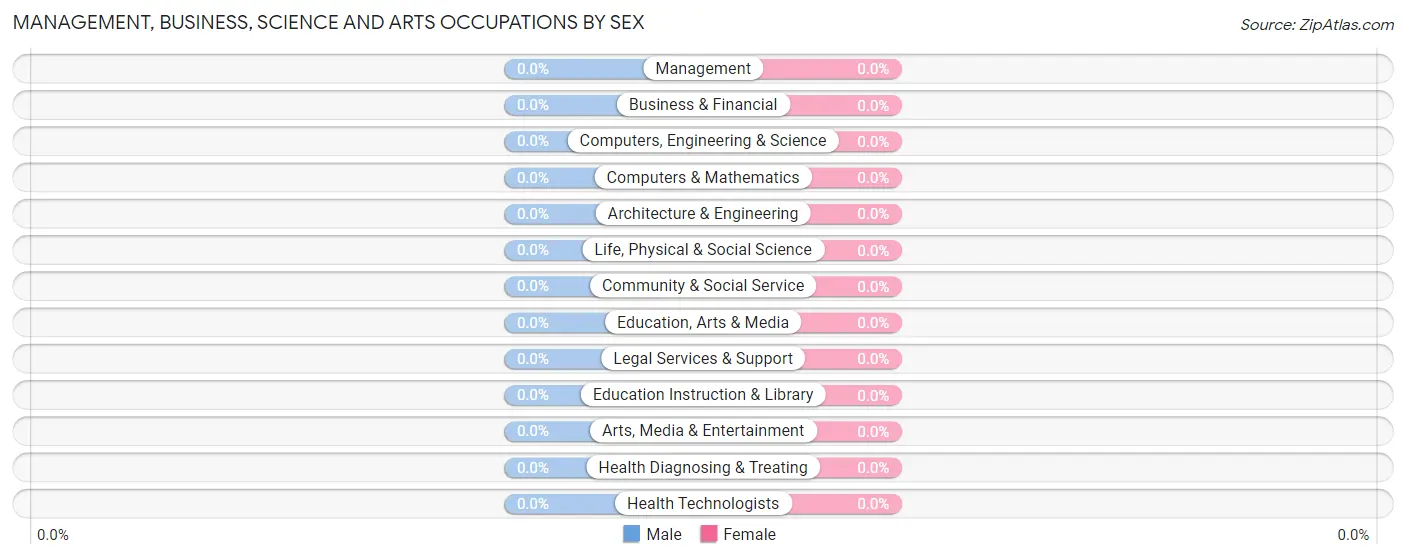
| Occupation | Male | Female |
| Management | 0 (0.0%) | 0 (0.0%) |
| Business & Financial | 0 (0.0%) | 0 (0.0%) |
| Computers, Engineering & Science | 0 (0.0%) | 0 (0.0%) |
| Computers & Mathematics | 0 (0.0%) | 0 (0.0%) |
| Architecture & Engineering | 0 (0.0%) | 0 (0.0%) |
| Life, Physical & Social Science | 0 (0.0%) | 0 (0.0%) |
| Community & Social Service | 0 (0.0%) | 0 (0.0%) |
| Education, Arts & Media | 0 (0.0%) | 0 (0.0%) |
| Legal Services & Support | 0 (0.0%) | 0 (0.0%) |
| Education Instruction & Library | 0 (0.0%) | 0 (0.0%) |
| Arts, Media & Entertainment | 0 (0.0%) | 0 (0.0%) |
| Health Diagnosing & Treating | 0 (0.0%) | 0 (0.0%) |
| Health Technologists | 0 (0.0%) | 0 (0.0%) |
| Total (Category) | 0 (0.0%) | 0 (0.0%) |
| Total (Overall) | 26 (68.4%) | 12 (31.6%) |
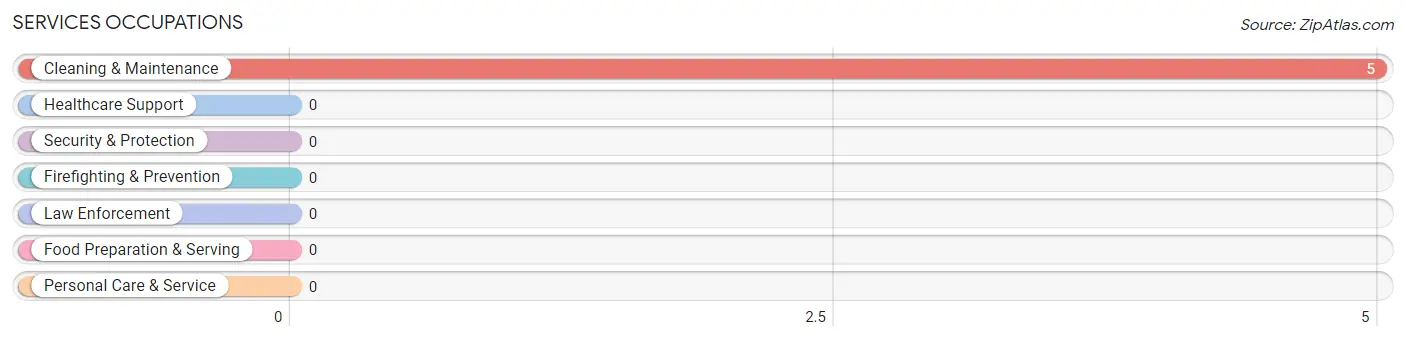
Services Occupations
The most common Services occupations in Burna are , and Cleaning & Maintenance (5 | 13.2%).
Services Occupations by Sex
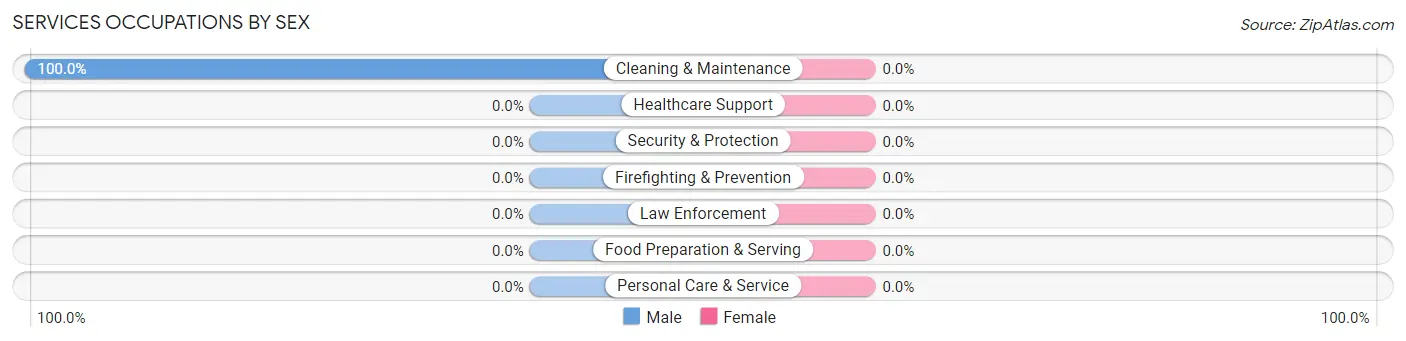
| Occupation | Male | Female |
| Healthcare Support | 0 (0.0%) | 0 (0.0%) |
| Security & Protection | 0 (0.0%) | 0 (0.0%) |
| Firefighting & Prevention | 0 (0.0%) | 0 (0.0%) |
| Law Enforcement | 0 (0.0%) | 0 (0.0%) |
| Food Preparation & Serving | 0 (0.0%) | 0 (0.0%) |
| Cleaning & Maintenance | 5 (100.0%) | 0 (0.0%) |
| Personal Care & Service | 0 (0.0%) | 0 (0.0%) |
| Total (Category) | 5 (100.0%) | 0 (0.0%) |
| Total (Overall) | 26 (68.4%) | 12 (31.6%) |
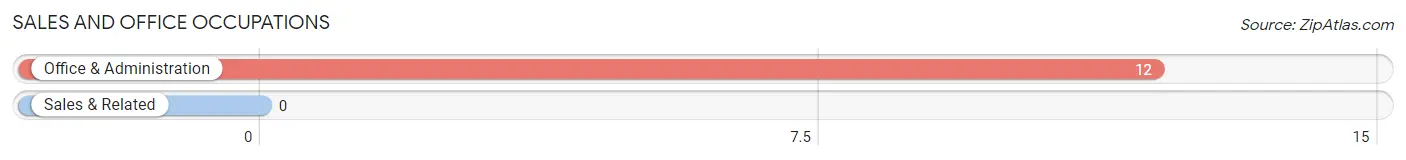
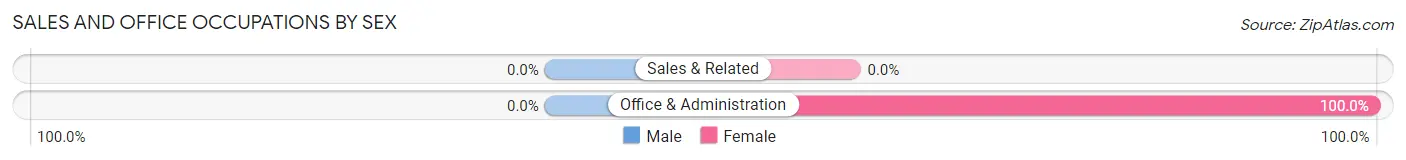
Sales and Office Occupations
The most common Sales and Office occupations in Burna are , and Office & Administration (12 | 31.6%).
Sales and Office Occupations by Sex
| Occupation | Male | Female |
| Sales & Related | 0 (0.0%) | 0 (0.0%) |
| Office & Administration | 0 (0.0%) | 12 (100.0%) |
| Total (Category) | 0 (0.0%) | 12 (100.0%) |
| Total (Overall) | 26 (68.4%) | 12 (31.6%) |
Natural Resources, Construction and Maintenance Occupations
Natural Resources, Construction and Maintenance Occupations by Sex
| Occupation | Male | Female |
| Farming, Fishing & Forestry | 0 (0.0%) | 0 (0.0%) |
| Construction & Extraction | 0 (0.0%) | 0 (0.0%) |
| Installation, Maintenance & Repair | 0 (0.0%) | 0 (0.0%) |
| Total (Category) | 0 (0.0%) | 0 (0.0%) |
| Total (Overall) | 26 (68.4%) | 12 (31.6%) |
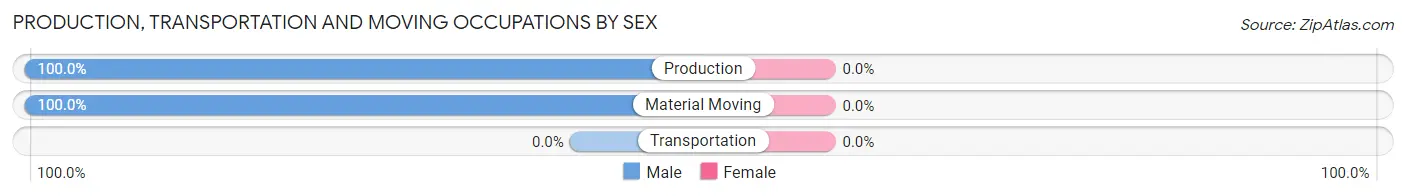
Production, Transportation and Moving Occupations
The most common Production, Transportation and Moving occupations in Burna are Material Moving (16 | 42.1%), and Production (5 | 13.2%).
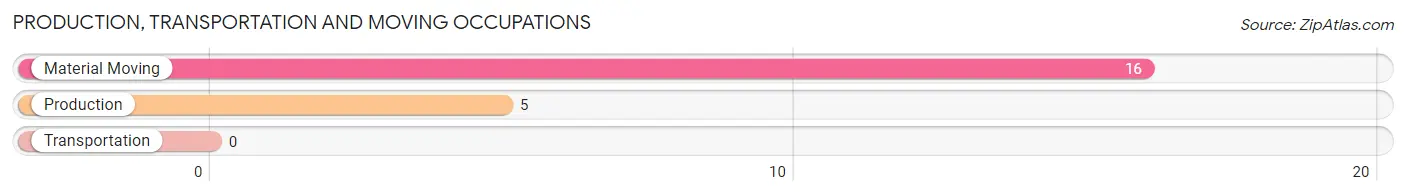
Production, Transportation and Moving Occupations by Sex
| Occupation | Male | Female |
| Production | 5 (100.0%) | 0 (0.0%) |
| Transportation | 0 (0.0%) | 0 (0.0%) |
| Material Moving | 16 (100.0%) | 0 (0.0%) |
| Total (Category) | 21 (100.0%) | 0 (0.0%) |
| Total (Overall) | 26 (68.4%) | 12 (31.6%) |
Employment Industries by Sex in Burna
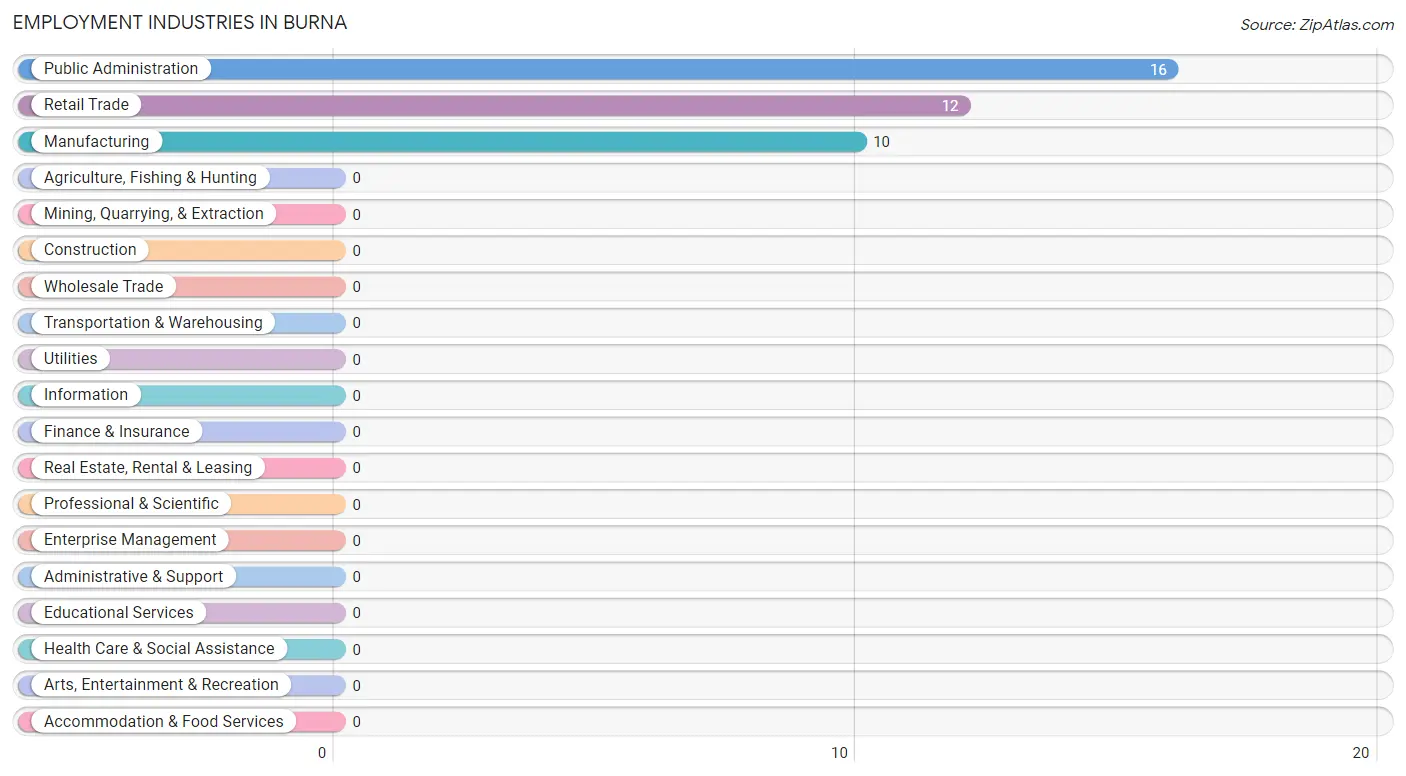
Employment Industries in Burna
The major employment industries in Burna include Public Administration (16 | 42.1%), Retail Trade (12 | 31.6%), and Manufacturing (10 | 26.3%).
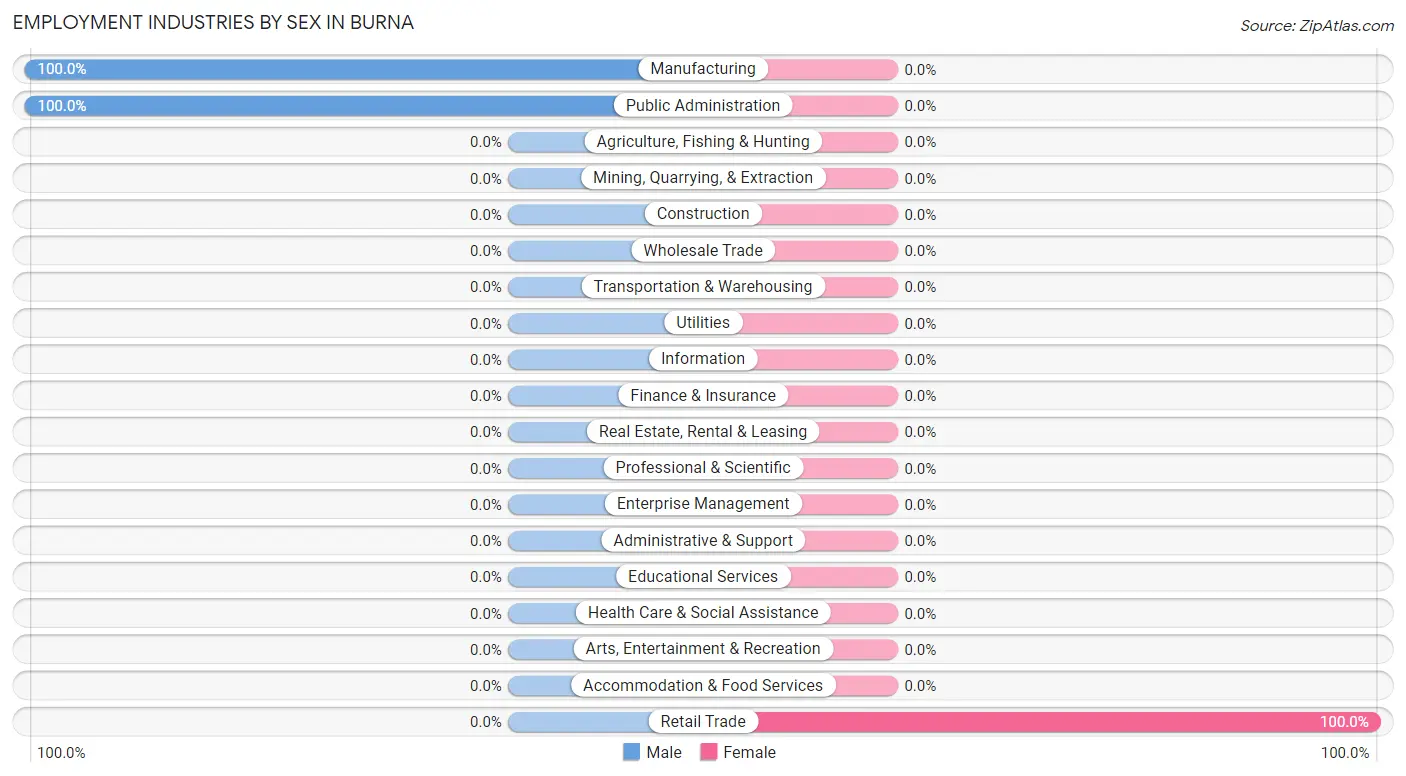
Employment Industries by Sex in Burna
| Industry | Male | Female |
| Agriculture, Fishing & Hunting | 0 (0.0%) | 0 (0.0%) |
| Mining, Quarrying, & Extraction | 0 (0.0%) | 0 (0.0%) |
| Construction | 0 (0.0%) | 0 (0.0%) |
| Manufacturing | 10 (100.0%) | 0 (0.0%) |
| Wholesale Trade | 0 (0.0%) | 0 (0.0%) |
| Retail Trade | 0 (0.0%) | 12 (100.0%) |
| Transportation & Warehousing | 0 (0.0%) | 0 (0.0%) |
| Utilities | 0 (0.0%) | 0 (0.0%) |
| Information | 0 (0.0%) | 0 (0.0%) |
| Finance & Insurance | 0 (0.0%) | 0 (0.0%) |
| Real Estate, Rental & Leasing | 0 (0.0%) | 0 (0.0%) |
| Professional & Scientific | 0 (0.0%) | 0 (0.0%) |
| Enterprise Management | 0 (0.0%) | 0 (0.0%) |
| Administrative & Support | 0 (0.0%) | 0 (0.0%) |
| Educational Services | 0 (0.0%) | 0 (0.0%) |
| Health Care & Social Assistance | 0 (0.0%) | 0 (0.0%) |
| Arts, Entertainment & Recreation | 0 (0.0%) | 0 (0.0%) |
| Accommodation & Food Services | 0 (0.0%) | 0 (0.0%) |
| Public Administration | 16 (100.0%) | 0 (0.0%) |
| Total | 26 (68.4%) | 12 (31.6%) |
Education in Burna
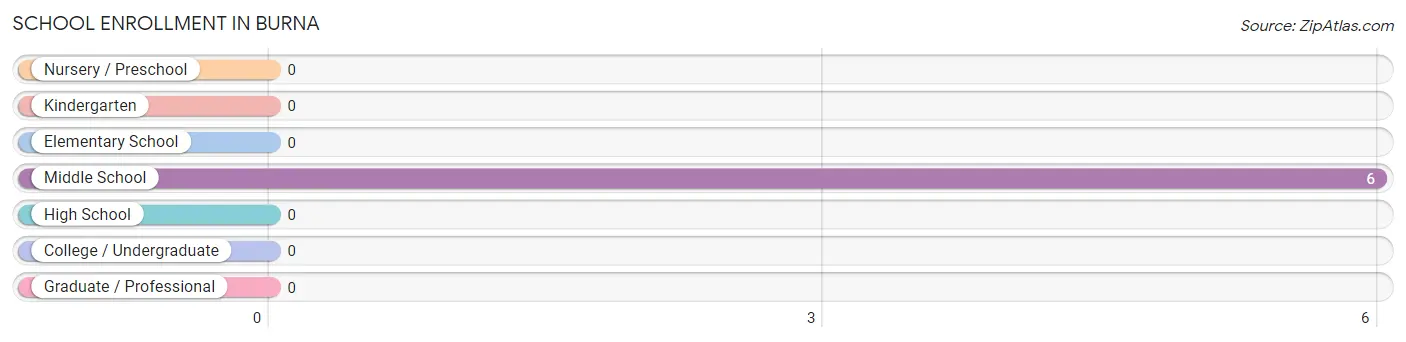
School Enrollment in Burna
| School Level | # Students | % Students |
| Nursery / Preschool | 0 | 0.0% |
| Kindergarten | 0 | 0.0% |
| Elementary School | 0 | 0.0% |
| Middle School | 6 | 100.0% |
| High School | 0 | 0.0% |
| College / Undergraduate | 0 | 0.0% |
| Graduate / Professional | 0 | 0.0% |
| Total | 6 | 100.0% |
School Enrollment by Age by Funding Source in Burna
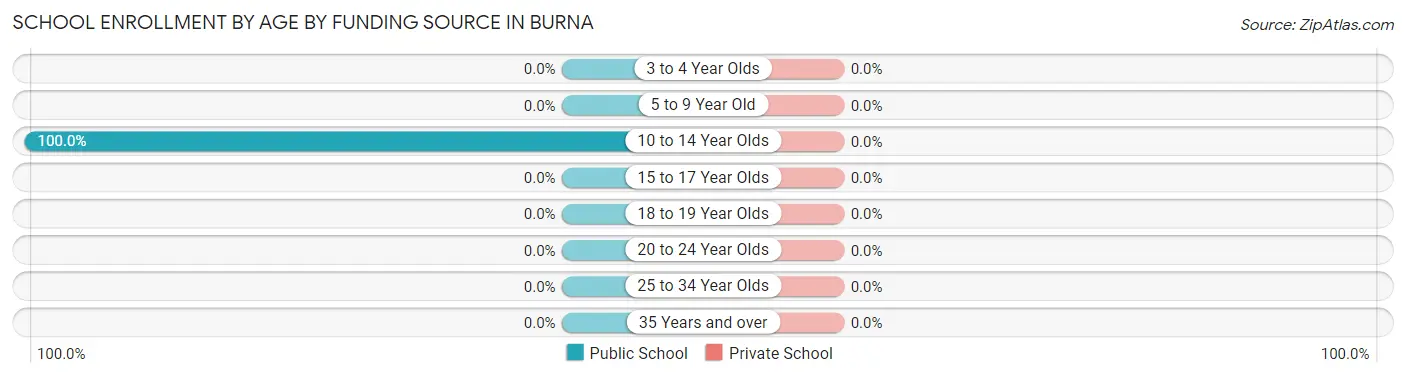
| Age Bracket | Public School | Private School |
| 3 to 4 Year Olds | 0 (0.0%) | 0 (0.0%) |
| 5 to 9 Year Old | 0 (0.0%) | 0 (0.0%) |
| 10 to 14 Year Olds | 6 (100.0%) | 0 (0.0%) |
| 15 to 17 Year Olds | 0 (0.0%) | 0 (0.0%) |
| 18 to 19 Year Olds | 0 (0.0%) | 0 (0.0%) |
| 20 to 24 Year Olds | 0 (0.0%) | 0 (0.0%) |
| 25 to 34 Year Olds | 0 (0.0%) | 0 (0.0%) |
| 35 Years and over | 0 (0.0%) | 0 (0.0%) |
| Total | 6 (100.0%) | 0 (0.0%) |
Educational Attainment by Field of Study in Burna
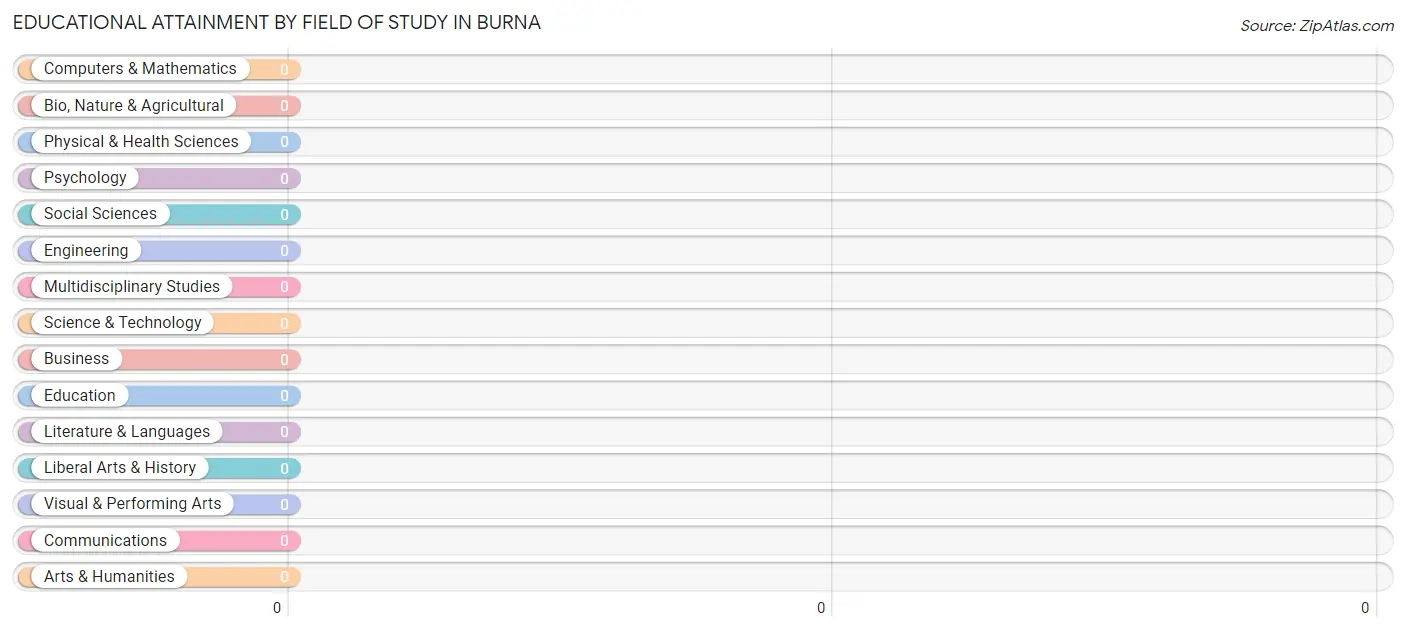
| Field of Study | # Graduates | % Graduates |
| Computers & Mathematics | 0 | 0.0% |
| Bio, Nature & Agricultural | 0 | 0.0% |
| Physical & Health Sciences | 0 | 0.0% |
| Psychology | 0 | 0.0% |
| Social Sciences | 0 | 0.0% |
| Engineering | 0 | 0.0% |
| Multidisciplinary Studies | 0 | 0.0% |
| Science & Technology | 0 | 0.0% |
| Business | 0 | 0.0% |
| Education | 0 | 0.0% |
| Literature & Languages | 0 | 0.0% |
| Liberal Arts & History | 0 | 0.0% |
| Visual & Performing Arts | 0 | 0.0% |
| Communications | 0 | 0.0% |
| Arts & Humanities | 0 | 0.0% |
| Total | 0 | 0.0% |
Transportation & Commute in Burna
Vehicle Availability by Sex in Burna
The most prevalent vehicle ownership categories in Burna are males with 4 vehicles (16, accounting for 61.5%) and females with 4 vehicles (0, making up 133.3%).
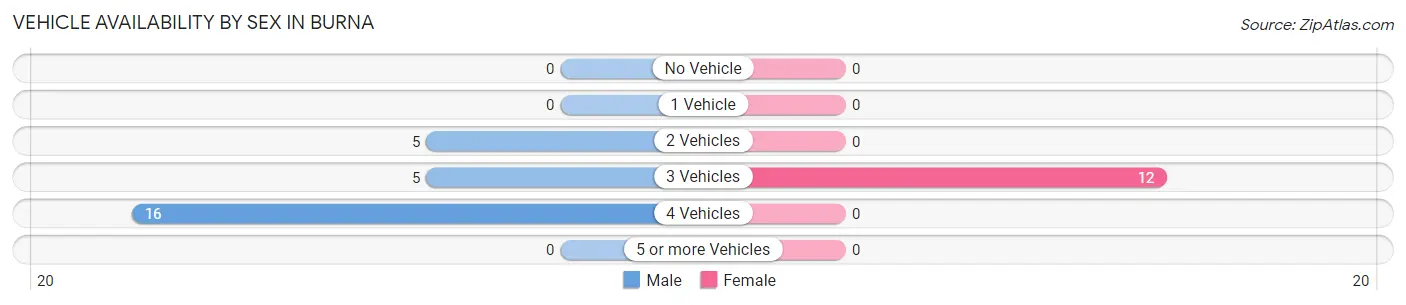
| Vehicles Available | Male | Female |
| No Vehicle | 0 (0.0%) | 0 (0.0%) |
| 1 Vehicle | 0 (0.0%) | 0 (0.0%) |
| 2 Vehicles | 5 (19.2%) | 0 (0.0%) |
| 3 Vehicles | 5 (19.2%) | 12 (100.0%) |
| 4 Vehicles | 16 (61.5%) | 0 (0.0%) |
| 5 or more Vehicles | 0 (0.0%) | 0 (0.0%) |
| Total | 26 (100.0%) | 12 (100.0%) |
Commute Time in Burna
The most frequently occuring commute durations in Burna are 45 to 59 minutes (21 commuters, 55.3%), 20 to 24 minutes (12 commuters, 31.6%), and 35 to 39 minutes (5 commuters, 13.2%).
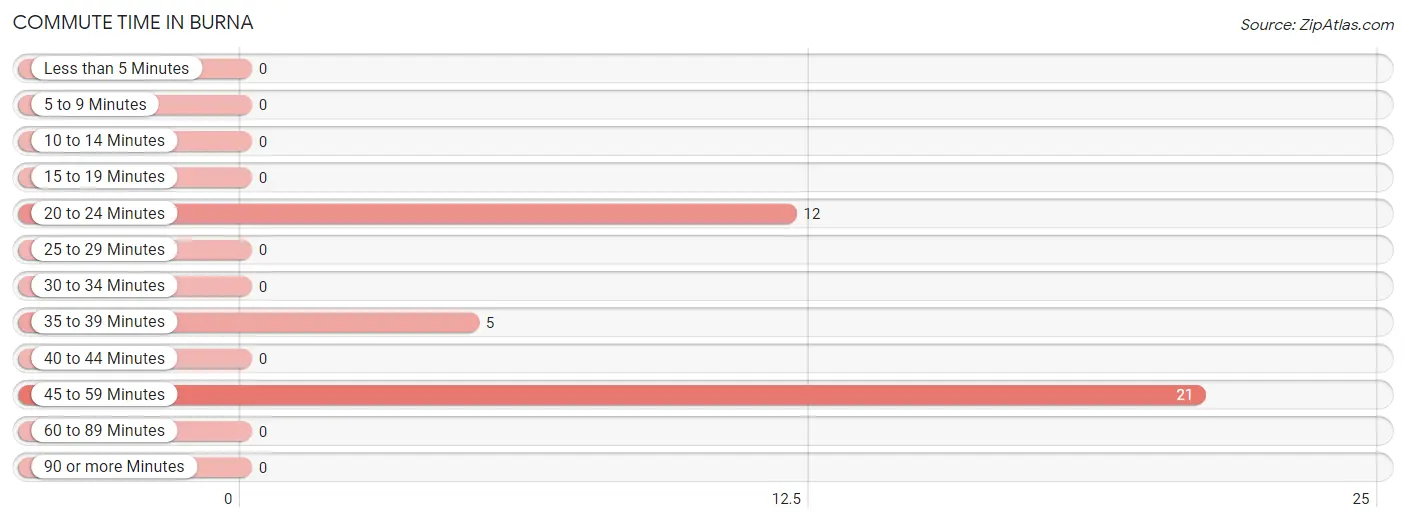
| Commute Time | # Commuters | % Commuters |
| Less than 5 Minutes | 0 | 0.0% |
| 5 to 9 Minutes | 0 | 0.0% |
| 10 to 14 Minutes | 0 | 0.0% |
| 15 to 19 Minutes | 0 | 0.0% |
| 20 to 24 Minutes | 12 | 31.6% |
| 25 to 29 Minutes | 0 | 0.0% |
| 30 to 34 Minutes | 0 | 0.0% |
| 35 to 39 Minutes | 5 | 13.2% |
| 40 to 44 Minutes | 0 | 0.0% |
| 45 to 59 Minutes | 21 | 55.3% |
| 60 to 89 Minutes | 0 | 0.0% |
| 90 or more Minutes | 0 | 0.0% |
Commute Time by Sex in Burna
The most common commute times in Burna are 45 to 59 minutes (21 commuters, 80.8%) for males and 20 to 24 minutes (12 commuters, 100.0%) for females.
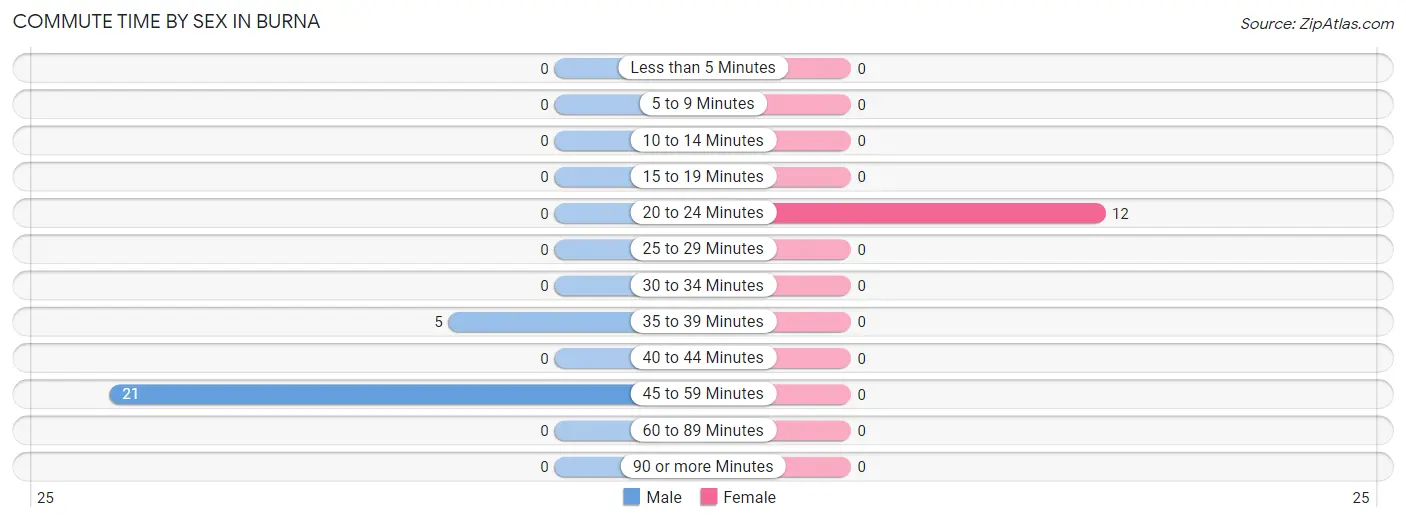
| Commute Time | Male | Female |
| Less than 5 Minutes | 0 (0.0%) | 0 (0.0%) |
| 5 to 9 Minutes | 0 (0.0%) | 0 (0.0%) |
| 10 to 14 Minutes | 0 (0.0%) | 0 (0.0%) |
| 15 to 19 Minutes | 0 (0.0%) | 0 (0.0%) |
| 20 to 24 Minutes | 0 (0.0%) | 12 (100.0%) |
| 25 to 29 Minutes | 0 (0.0%) | 0 (0.0%) |
| 30 to 34 Minutes | 0 (0.0%) | 0 (0.0%) |
| 35 to 39 Minutes | 5 (19.2%) | 0 (0.0%) |
| 40 to 44 Minutes | 0 (0.0%) | 0 (0.0%) |
| 45 to 59 Minutes | 21 (80.8%) | 0 (0.0%) |
| 60 to 89 Minutes | 0 (0.0%) | 0 (0.0%) |
| 90 or more Minutes | 0 (0.0%) | 0 (0.0%) |
Time of Departure to Work by Sex in Burna
The most frequent times of departure to work in Burna are 6:00 AM to 6:29 AM (16, 61.5%) for males and 10:00 AM to 10:59 AM (12, 100.0%) for females.
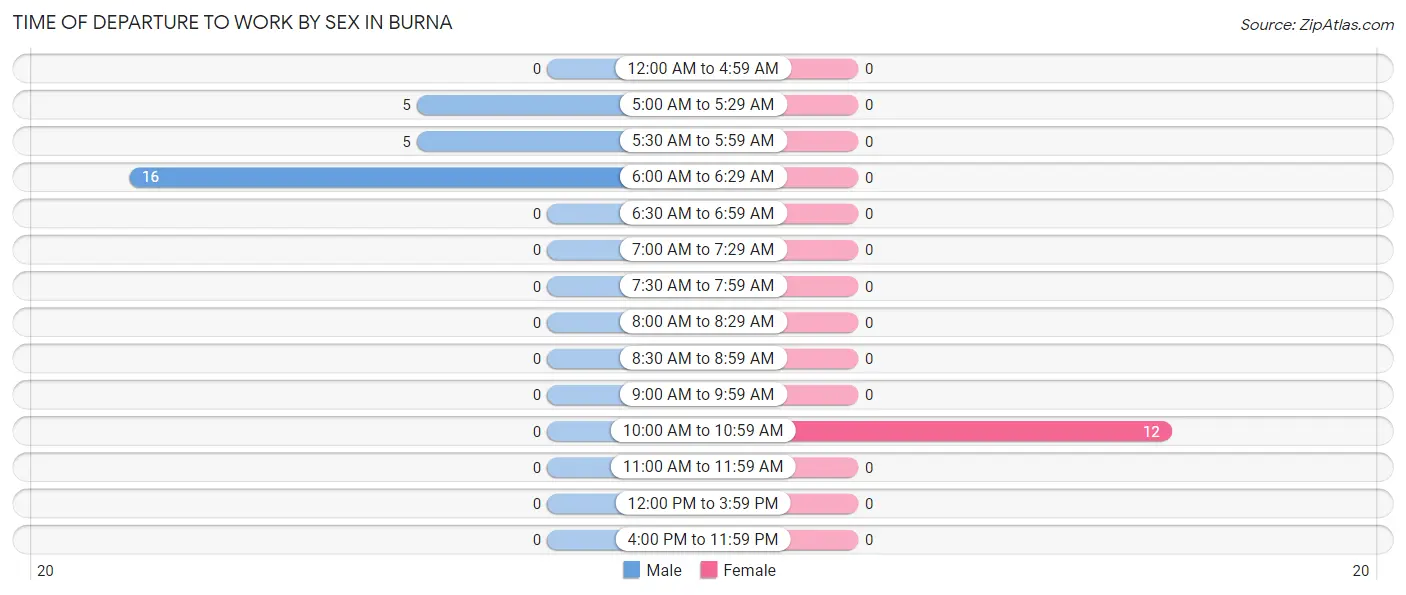
| Time of Departure | Male | Female |
| 12:00 AM to 4:59 AM | 0 (0.0%) | 0 (0.0%) |
| 5:00 AM to 5:29 AM | 5 (19.2%) | 0 (0.0%) |
| 5:30 AM to 5:59 AM | 5 (19.2%) | 0 (0.0%) |
| 6:00 AM to 6:29 AM | 16 (61.5%) | 0 (0.0%) |
| 6:30 AM to 6:59 AM | 0 (0.0%) | 0 (0.0%) |
| 7:00 AM to 7:29 AM | 0 (0.0%) | 0 (0.0%) |
| 7:30 AM to 7:59 AM | 0 (0.0%) | 0 (0.0%) |
| 8:00 AM to 8:29 AM | 0 (0.0%) | 0 (0.0%) |
| 8:30 AM to 8:59 AM | 0 (0.0%) | 0 (0.0%) |
| 9:00 AM to 9:59 AM | 0 (0.0%) | 0 (0.0%) |
| 10:00 AM to 10:59 AM | 0 (0.0%) | 12 (100.0%) |
| 11:00 AM to 11:59 AM | 0 (0.0%) | 0 (0.0%) |
| 12:00 PM to 3:59 PM | 0 (0.0%) | 0 (0.0%) |
| 4:00 PM to 11:59 PM | 0 (0.0%) | 0 (0.0%) |
| Total | 26 (100.0%) | 12 (100.0%) |
Housing Occupancy in Burna
Occupancy by Ownership in Burna
Of the total 48 dwellings in Burna, owner-occupied units account for 48 (100.0%), while renter-occupied units make up 0 (0.0%).
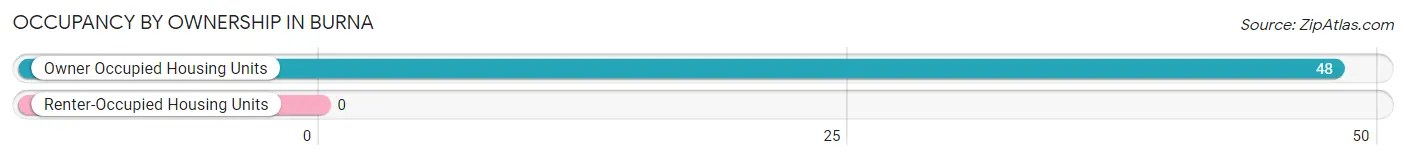
| Occupancy | # Housing Units | % Housing Units |
| Owner Occupied Housing Units | 48 | 100.0% |
| Renter-Occupied Housing Units | 0 | 0.0% |
| Total Occupied Housing Units | 48 | 100.0% |
Occupancy by Household Size in Burna
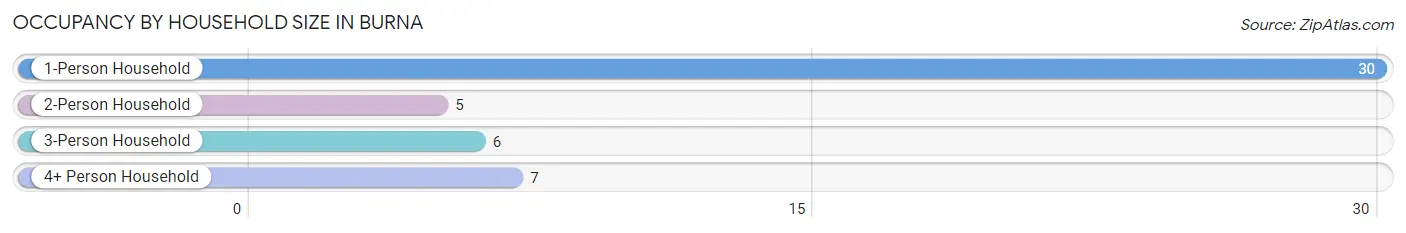
| Household Size | # Housing Units | % Housing Units |
| 1-Person Household | 30 | 62.5% |
| 2-Person Household | 5 | 10.4% |
| 3-Person Household | 6 | 12.5% |
| 4+ Person Household | 7 | 14.6% |
| Total Housing Units | 48 | 100.0% |
Occupancy by Ownership by Household Size in Burna
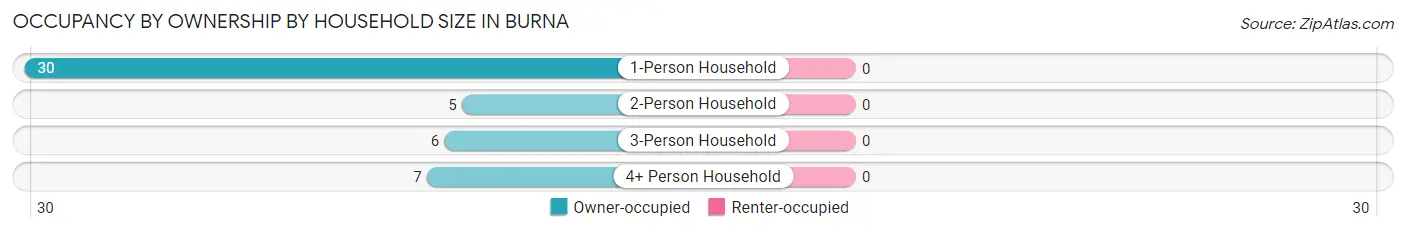
| Household Size | Owner-occupied | Renter-occupied |
| 1-Person Household | 30 (100.0%) | 0 (0.0%) |
| 2-Person Household | 5 (100.0%) | 0 (0.0%) |
| 3-Person Household | 6 (100.0%) | 0 (0.0%) |
| 4+ Person Household | 7 (100.0%) | 0 (0.0%) |
| Total Housing Units | 48 (100.0%) | 0 (0.0%) |
Occupancy by Educational Attainment in Burna
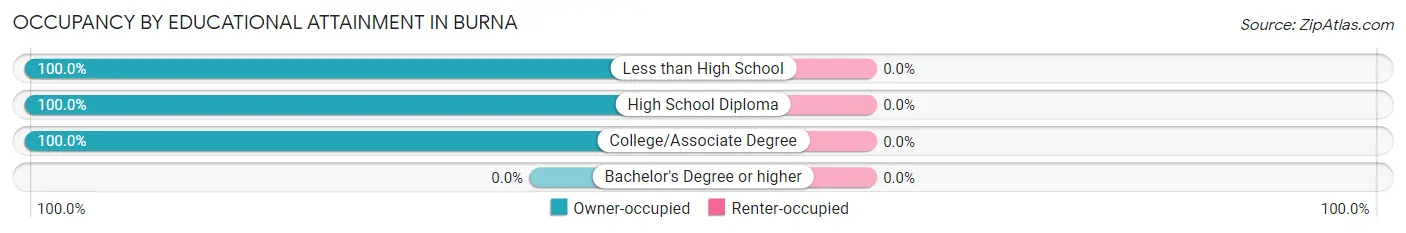
| Household Size | Owner-occupied | Renter-occupied |
| Less than High School | 30 (100.0%) | 0 (0.0%) |
| High School Diploma | 12 (100.0%) | 0 (0.0%) |
| College/Associate Degree | 6 (100.0%) | 0 (0.0%) |
| Bachelor's Degree or higher | 0 (0.0%) | 0 (0.0%) |
Occupancy by Age of Householder in Burna
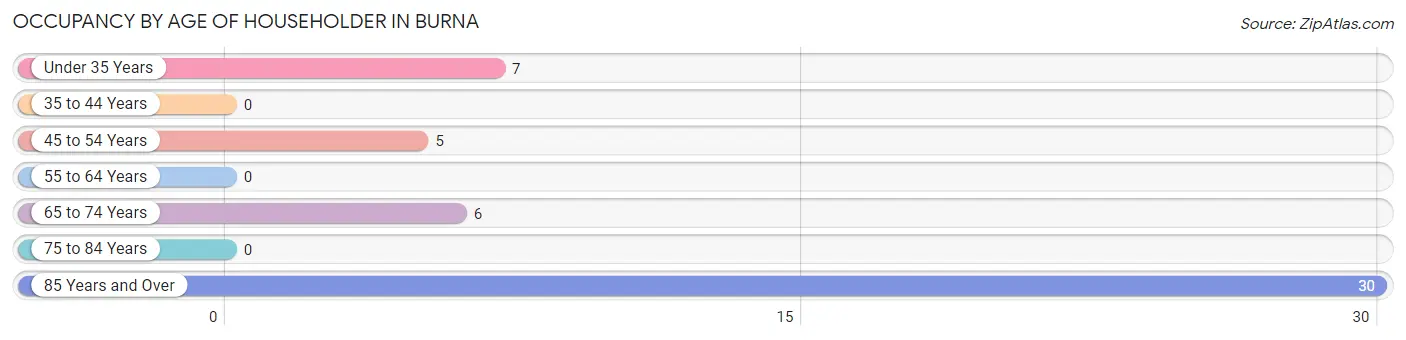
| Age Bracket | # Households | % Households |
| Under 35 Years | 7 | 14.6% |
| 35 to 44 Years | 0 | 0.0% |
| 45 to 54 Years | 5 | 10.4% |
| 55 to 64 Years | 0 | 0.0% |
| 65 to 74 Years | 6 | 12.5% |
| 75 to 84 Years | 0 | 0.0% |
| 85 Years and Over | 30 | 62.5% |
| Total | 48 | 100.0% |
Housing Finances in Burna
Median Income by Occupancy in Burna
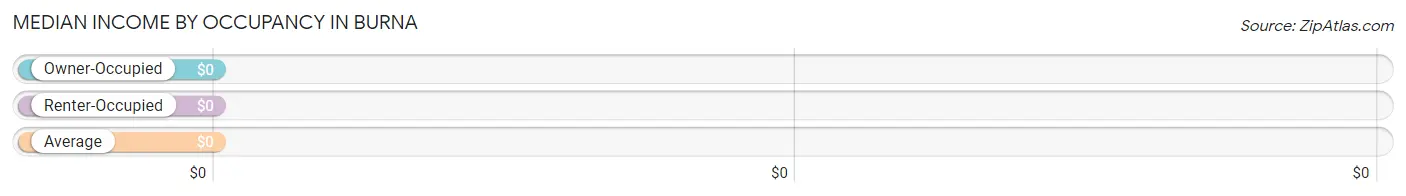
| Occupancy Type | # Households | Median Income |
| Owner-Occupied | 48 (100.0%) | $0 |
| Renter-Occupied | 0 (0.0%) | $0 |
| Average | 48 (100.0%) | $0 |
Occupancy by Householder Income Bracket in Burna
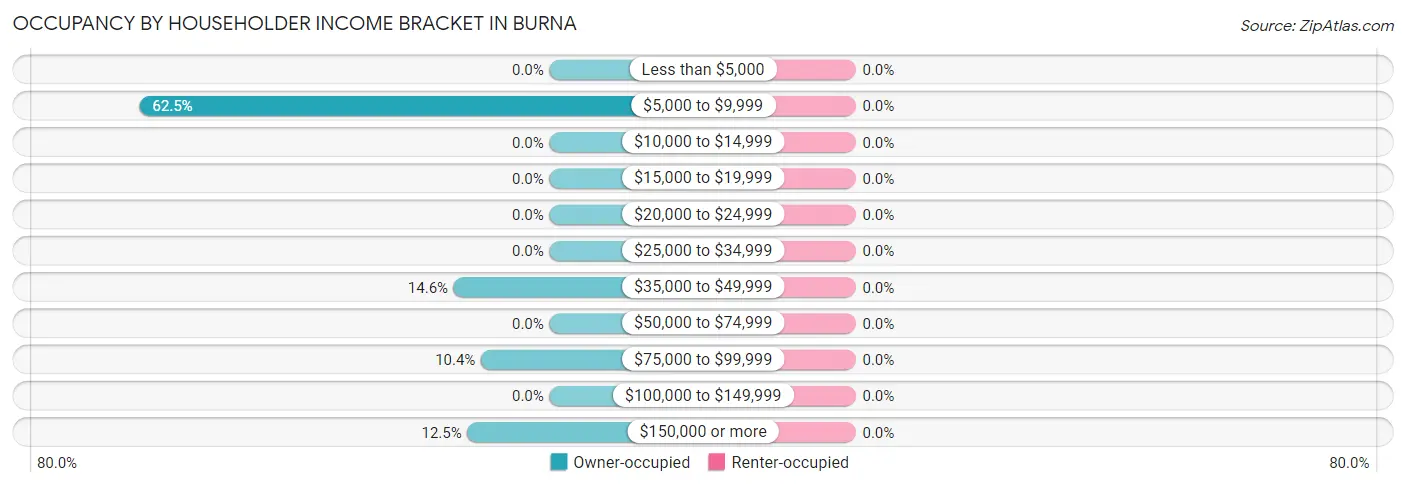
| Income Bracket | Owner-occupied | Renter-occupied |
| Less than $5,000 | 0 (0.0%) | 0 (0.0%) |
| $5,000 to $9,999 | 30 (62.5%) | 0 (0.0%) |
| $10,000 to $14,999 | 0 (0.0%) | 0 (0.0%) |
| $15,000 to $19,999 | 0 (0.0%) | 0 (0.0%) |
| $20,000 to $24,999 | 0 (0.0%) | 0 (0.0%) |
| $25,000 to $34,999 | 0 (0.0%) | 0 (0.0%) |
| $35,000 to $49,999 | 7 (14.6%) | 0 (0.0%) |
| $50,000 to $74,999 | 0 (0.0%) | 0 (0.0%) |
| $75,000 to $99,999 | 5 (10.4%) | 0 (0.0%) |
| $100,000 to $149,999 | 0 (0.0%) | 0 (0.0%) |
| $150,000 or more | 6 (12.5%) | 0 (0.0%) |
| Total | 48 (100.0%) | 0 (0.0%) |
Monthly Housing Cost Tiers in Burna
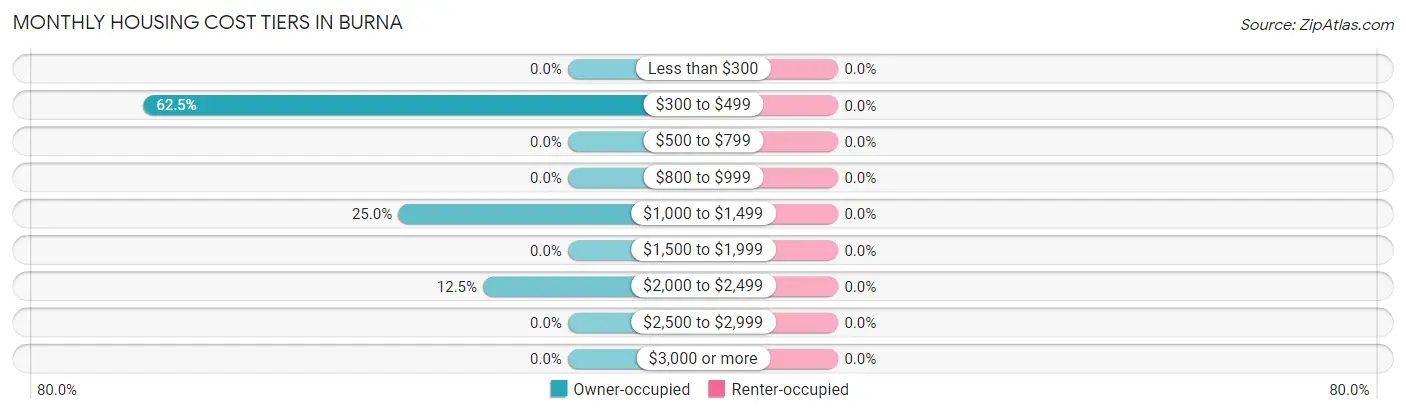
| Monthly Cost | Owner-occupied | Renter-occupied |
| Less than $300 | 0 (0.0%) | 0 (0.0%) |
| $300 to $499 | 30 (62.5%) | 0 (0.0%) |
| $500 to $799 | 0 (0.0%) | 0 (0.0%) |
| $800 to $999 | 0 (0.0%) | 0 (0.0%) |
| $1,000 to $1,499 | 12 (25.0%) | 0 (0.0%) |
| $1,500 to $1,999 | 0 (0.0%) | 0 (0.0%) |
| $2,000 to $2,499 | 6 (12.5%) | 0 (0.0%) |
| $2,500 to $2,999 | 0 (0.0%) | 0 (0.0%) |
| $3,000 or more | 0 (0.0%) | 0 (0.0%) |
| Total | 48 (100.0%) | 0 (0.0%) |
Physical Housing Characteristics in Burna
Housing Structures in Burna
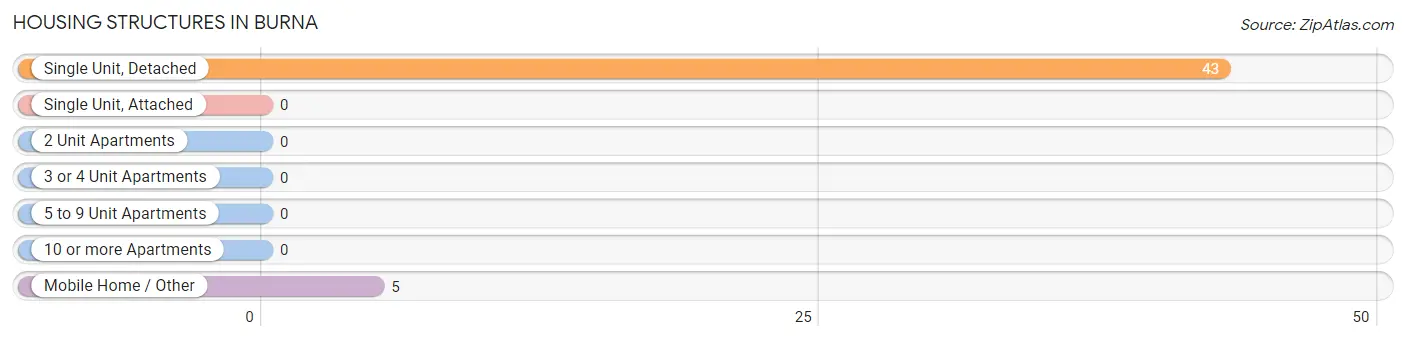
| Structure Type | # Housing Units | % Housing Units |
| Single Unit, Detached | 43 | 89.6% |
| Single Unit, Attached | 0 | 0.0% |
| 2 Unit Apartments | 0 | 0.0% |
| 3 or 4 Unit Apartments | 0 | 0.0% |
| 5 to 9 Unit Apartments | 0 | 0.0% |
| 10 or more Apartments | 0 | 0.0% |
| Mobile Home / Other | 5 | 10.4% |
| Total | 48 | 100.0% |
Housing Structures by Occupancy in Burna
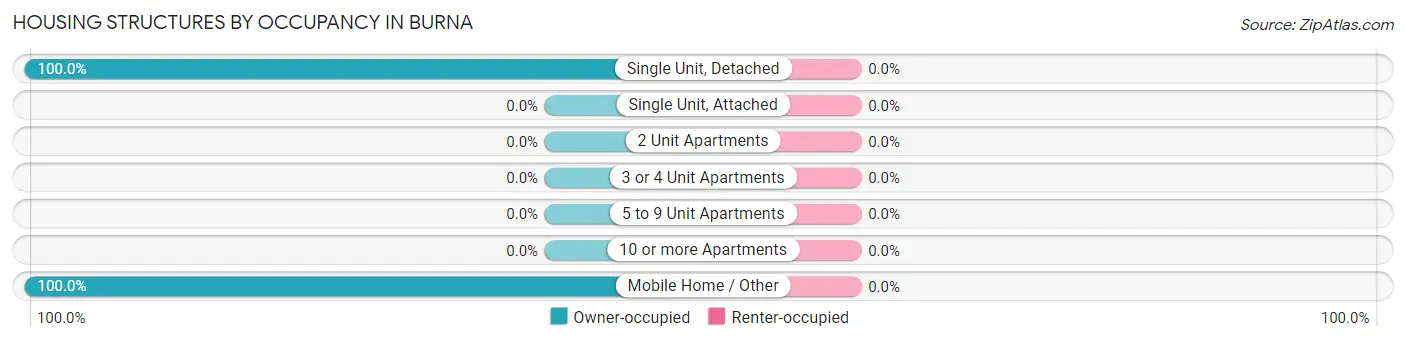
| Structure Type | Owner-occupied | Renter-occupied |
| Single Unit, Detached | 43 (100.0%) | 0 (0.0%) |
| Single Unit, Attached | 0 (0.0%) | 0 (0.0%) |
| 2 Unit Apartments | 0 (0.0%) | 0 (0.0%) |
| 3 or 4 Unit Apartments | 0 (0.0%) | 0 (0.0%) |
| 5 to 9 Unit Apartments | 0 (0.0%) | 0 (0.0%) |
| 10 or more Apartments | 0 (0.0%) | 0 (0.0%) |
| Mobile Home / Other | 5 (100.0%) | 0 (0.0%) |
| Total | 48 (100.0%) | 0 (0.0%) |
Housing Structures by Number of Rooms in Burna
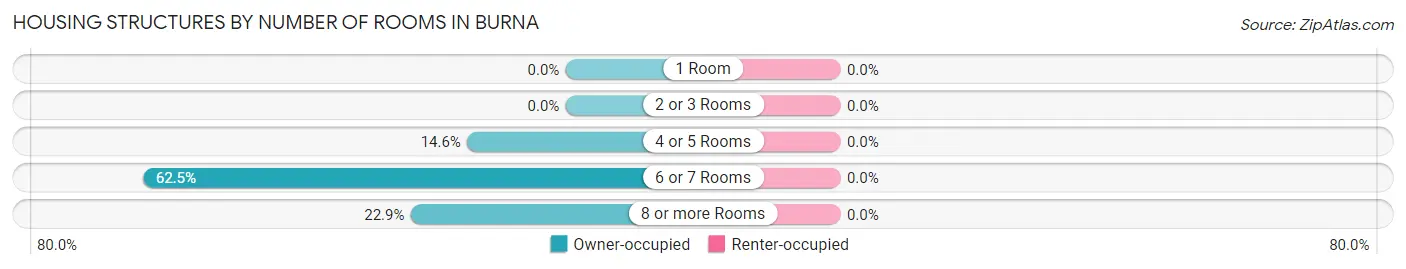
| Number of Rooms | Owner-occupied | Renter-occupied |
| 1 Room | 0 (0.0%) | 0 (0.0%) |
| 2 or 3 Rooms | 0 (0.0%) | 0 (0.0%) |
| 4 or 5 Rooms | 7 (14.6%) | 0 (0.0%) |
| 6 or 7 Rooms | 30 (62.5%) | 0 (0.0%) |
| 8 or more Rooms | 11 (22.9%) | 0 (0.0%) |
| Total | 48 (100.0%) | 0 (0.0%) |
Housing Structure by Heating Type in Burna
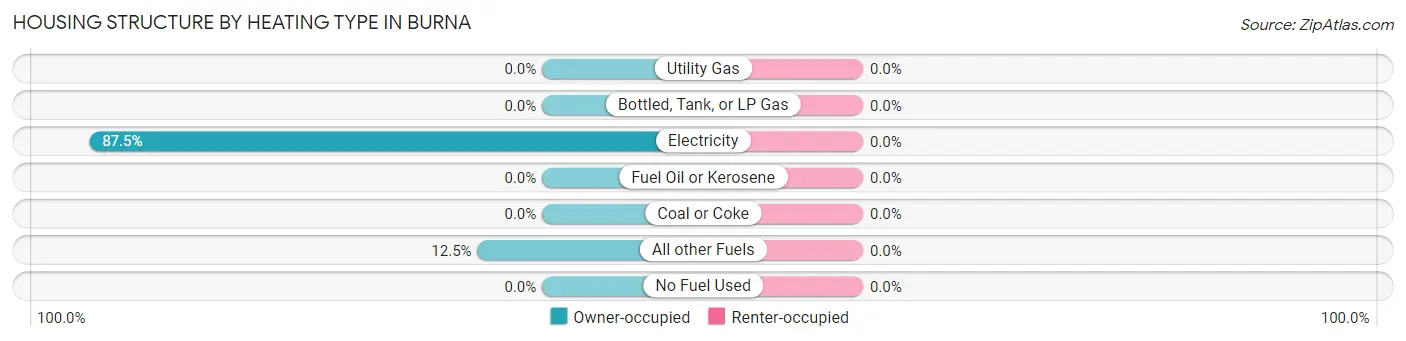
| Heating Type | Owner-occupied | Renter-occupied |
| Utility Gas | 0 (0.0%) | 0 (0.0%) |
| Bottled, Tank, or LP Gas | 0 (0.0%) | 0 (0.0%) |
| Electricity | 42 (87.5%) | 0 (0.0%) |
| Fuel Oil or Kerosene | 0 (0.0%) | 0 (0.0%) |
| Coal or Coke | 0 (0.0%) | 0 (0.0%) |
| All other Fuels | 6 (12.5%) | 0 (0.0%) |
| No Fuel Used | 0 (0.0%) | 0 (0.0%) |
| Total | 48 (100.0%) | 0 (0.0%) |
Household Vehicle Usage in Burna
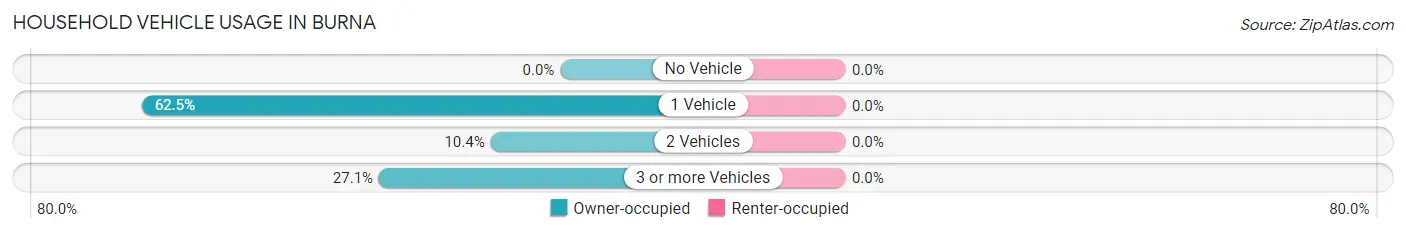
| Vehicles per Household | Owner-occupied | Renter-occupied |
| No Vehicle | 0 (0.0%) | 0 (0.0%) |
| 1 Vehicle | 30 (62.5%) | 0 (0.0%) |
| 2 Vehicles | 5 (10.4%) | 0 (0.0%) |
| 3 or more Vehicles | 13 (27.1%) | 0 (0.0%) |
| Total | 48 (100.0%) | 0 (0.0%) |
Real Estate & Mortgages in Burna
Real Estate and Mortgage Overview in Burna
| Characteristic | Without Mortgage | With Mortgage |
| Housing Units | 36 | 12 |
| Median Property Value | - | - |
| Median Household Income | - | - |
| Monthly Housing Costs | - | - |
| Real Estate Taxes | - | - |
Property Value by Mortgage Status in Burna
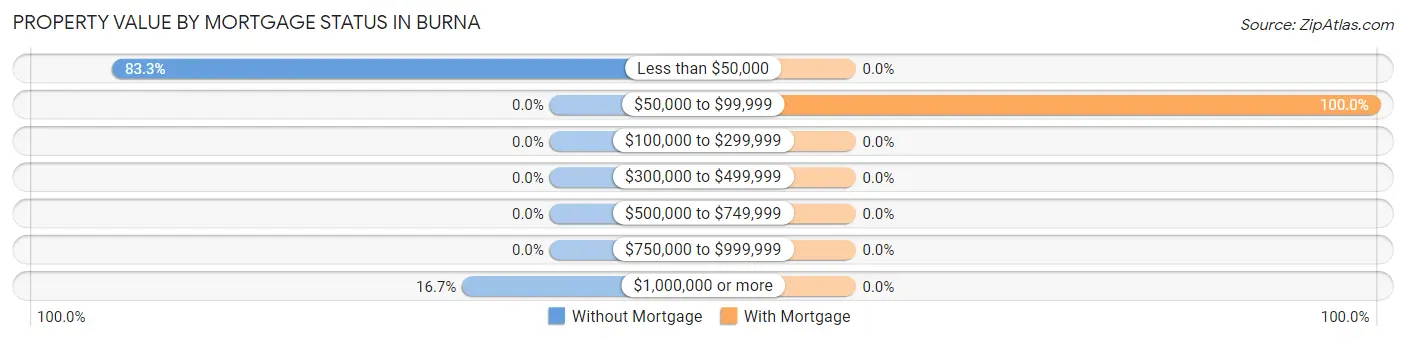
| Property Value | Without Mortgage | With Mortgage |
| Less than $50,000 | 30 (83.3%) | 0 (0.0%) |
| $50,000 to $99,999 | 0 (0.0%) | 12 (100.0%) |
| $100,000 to $299,999 | 0 (0.0%) | 0 (0.0%) |
| $300,000 to $499,999 | 0 (0.0%) | 0 (0.0%) |
| $500,000 to $749,999 | 0 (0.0%) | 0 (0.0%) |
| $750,000 to $999,999 | 0 (0.0%) | 0 (0.0%) |
| $1,000,000 or more | 6 (16.7%) | 0 (0.0%) |
| Total | 36 (100.0%) | 12 (100.0%) |
Household Income by Mortgage Status in Burna
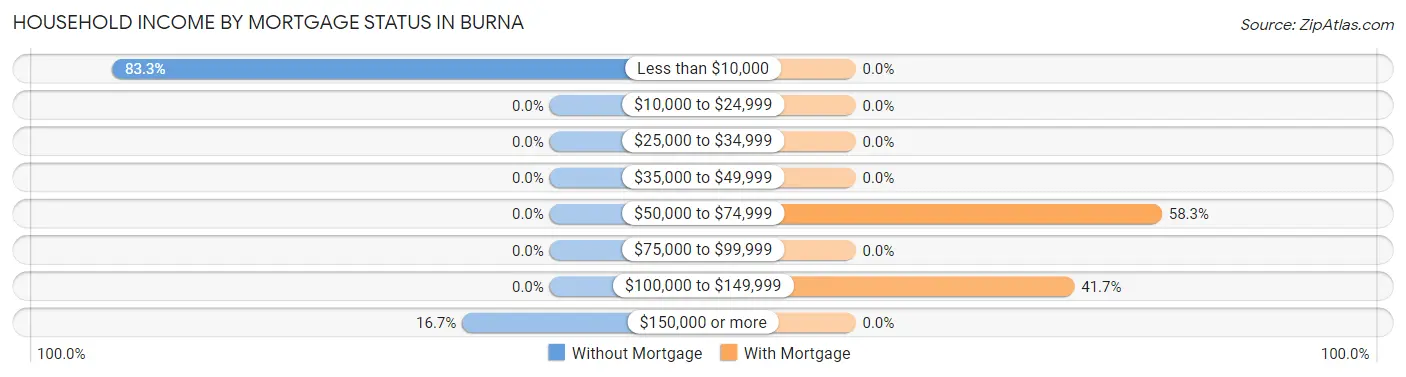
| Household Income | Without Mortgage | With Mortgage |
| Less than $10,000 | 30 (83.3%) | 0 (0.0%) |
| $10,000 to $24,999 | 0 (0.0%) | 0 (0.0%) |
| $25,000 to $34,999 | 0 (0.0%) | 0 (0.0%) |
| $35,000 to $49,999 | 0 (0.0%) | 0 (0.0%) |
| $50,000 to $74,999 | 0 (0.0%) | 7 (58.3%) |
| $75,000 to $99,999 | 0 (0.0%) | 0 (0.0%) |
| $100,000 to $149,999 | 0 (0.0%) | 5 (41.7%) |
| $150,000 or more | 6 (16.7%) | 0 (0.0%) |
| Total | 36 (100.0%) | 12 (100.0%) |
Property Value to Household Income Ratio in Burna
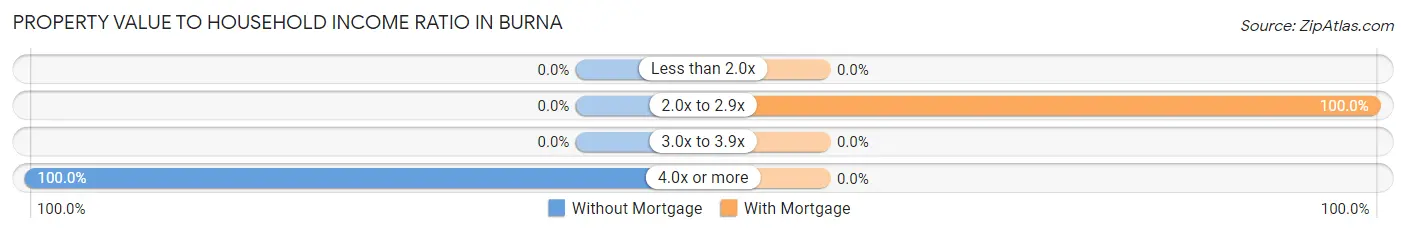
| Value-to-Income Ratio | Without Mortgage | With Mortgage |
| Less than 2.0x | 0 (0.0%) | 0 (0.0%) |
| 2.0x to 2.9x | 0 (0.0%) | 12 (100.0%) |
| 3.0x to 3.9x | 0 (0.0%) | 0 (0.0%) |
| 4.0x or more | 36 (100.0%) | 0 (0.0%) |
| Total | 36 (100.0%) | 12 (100.0%) |
Real Estate Taxes by Mortgage Status in Burna
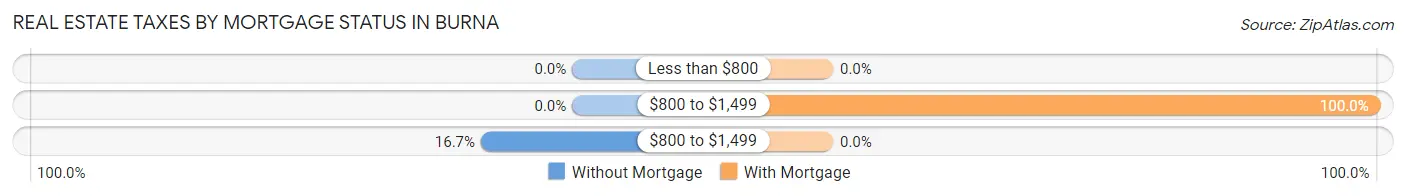
| Property Taxes | Without Mortgage | With Mortgage |
| Less than $800 | 0 (0.0%) | 0 (0.0%) |
| $800 to $1,499 | 0 (0.0%) | 12 (100.0%) |
| $800 to $1,499 | 6 (16.7%) | 0 (0.0%) |
| Total | 36 (100.0%) | 12 (100.0%) |
Health & Disability in Burna
Health Insurance Coverage by Age in Burna
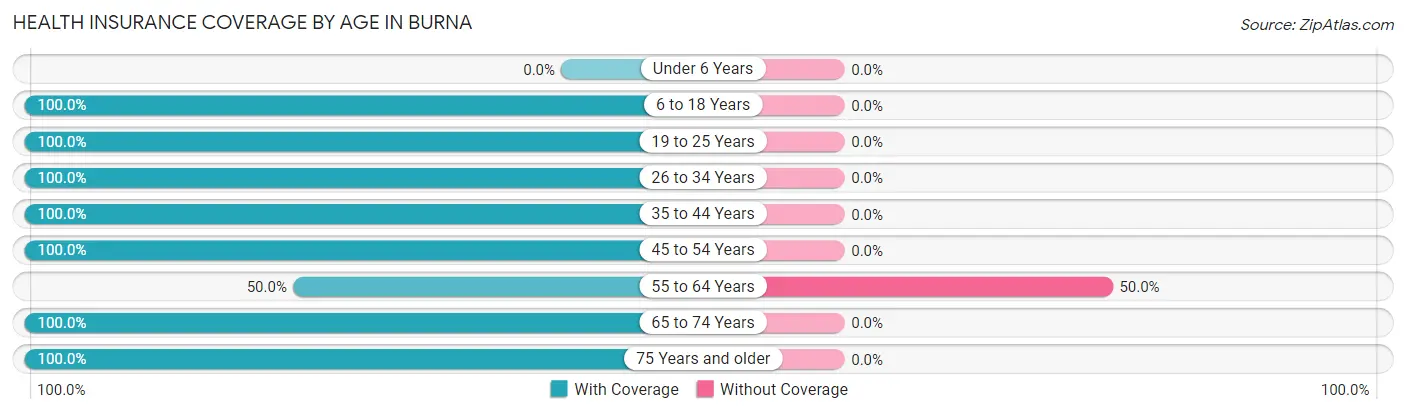
| Age Bracket | With Coverage | Without Coverage |
| Under 6 Years | 0 (0.0%) | 0 (0.0%) |
| 6 to 18 Years | 6 (100.0%) | 0 (0.0%) |
| 19 to 25 Years | 19 (100.0%) | 0 (0.0%) |
| 26 to 34 Years | 5 (100.0%) | 0 (0.0%) |
| 35 to 44 Years | 16 (100.0%) | 0 (0.0%) |
| 45 to 54 Years | 5 (100.0%) | 0 (0.0%) |
| 55 to 64 Years | 7 (50.0%) | 7 (50.0%) |
| 65 to 74 Years | 6 (100.0%) | 0 (0.0%) |
| 75 Years and older | 30 (100.0%) | 0 (0.0%) |
| Total | 94 (93.1%) | 7 (6.9%) |
Health Insurance Coverage by Citizenship Status in Burna
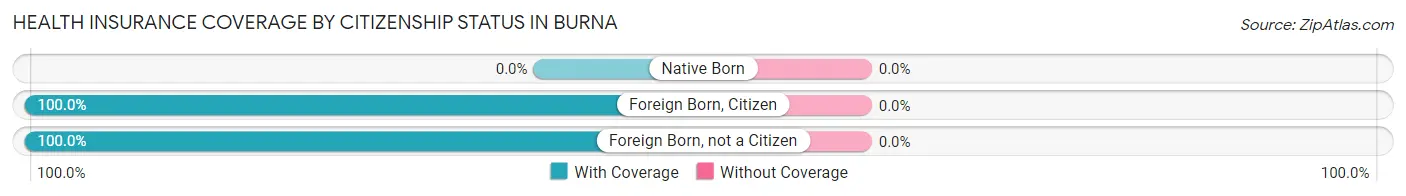
| Citizenship Status | With Coverage | Without Coverage |
| Native Born | 0 (0.0%) | 0 (0.0%) |
| Foreign Born, Citizen | 6 (100.0%) | 0 (0.0%) |
| Foreign Born, not a Citizen | 19 (100.0%) | 0 (0.0%) |
Health Insurance Coverage by Household Income in Burna
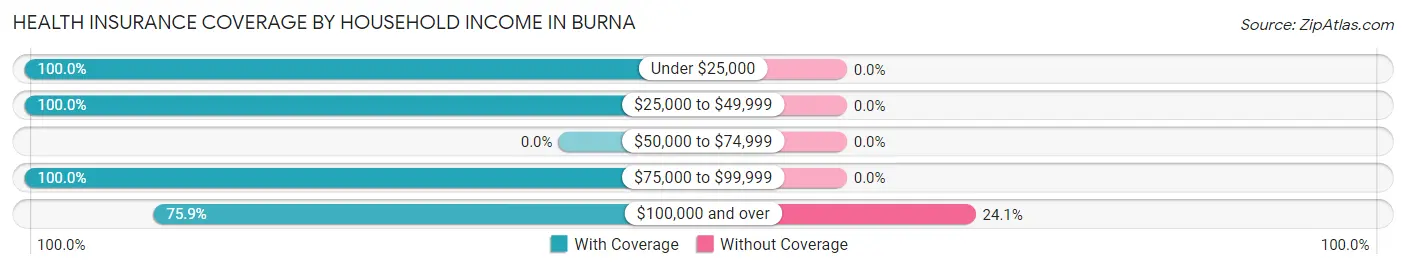
| Household Income | With Coverage | Without Coverage |
| Under $25,000 | 30 (100.0%) | 0 (0.0%) |
| $25,000 to $49,999 | 30 (100.0%) | 0 (0.0%) |
| $50,000 to $74,999 | 0 (0.0%) | 0 (0.0%) |
| $75,000 to $99,999 | 12 (100.0%) | 0 (0.0%) |
| $100,000 and over | 22 (75.9%) | 7 (24.1%) |
Public vs Private Health Insurance Coverage by Age in Burna
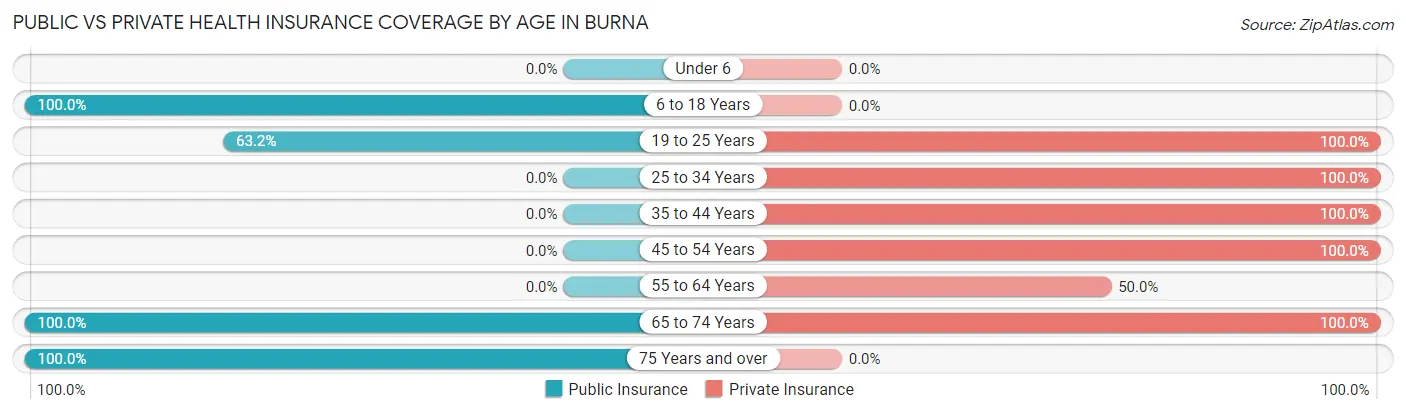
| Age Bracket | Public Insurance | Private Insurance |
| Under 6 | 0 (0.0%) | 0 (0.0%) |
| 6 to 18 Years | 6 (100.0%) | 0 (0.0%) |
| 19 to 25 Years | 12 (63.2%) | 19 (100.0%) |
| 25 to 34 Years | 0 (0.0%) | 5 (100.0%) |
| 35 to 44 Years | 0 (0.0%) | 16 (100.0%) |
| 45 to 54 Years | 0 (0.0%) | 5 (100.0%) |
| 55 to 64 Years | 0 (0.0%) | 7 (50.0%) |
| 65 to 74 Years | 6 (100.0%) | 6 (100.0%) |
| 75 Years and over | 30 (100.0%) | 0 (0.0%) |
| Total | 54 (53.5%) | 58 (57.4%) |
Disability Status by Sex by Age in Burna
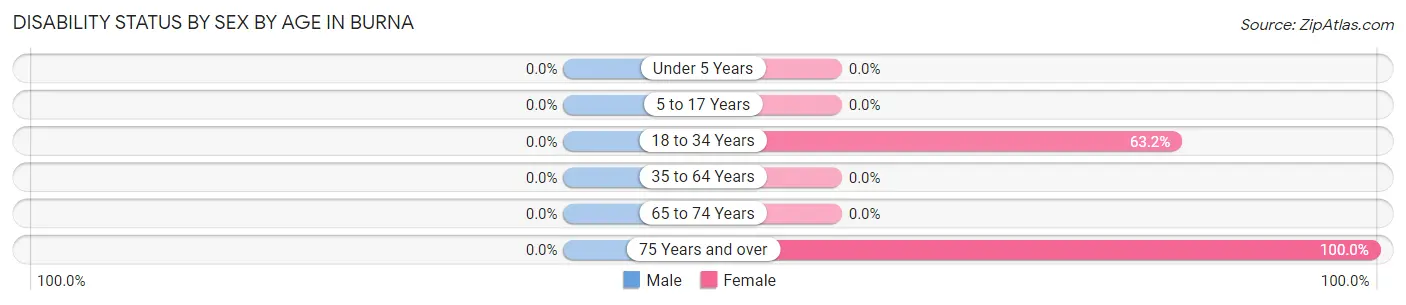
| Age Bracket | Male | Female |
| Under 5 Years | 0 (0.0%) | 0 (0.0%) |
| 5 to 17 Years | 0 (0.0%) | 0 (0.0%) |
| 18 to 34 Years | 0 (0.0%) | 12 (63.2%) |
| 35 to 64 Years | 0 (0.0%) | 0 (0.0%) |
| 65 to 74 Years | 0 (0.0%) | 0 (0.0%) |
| 75 Years and over | 0 (0.0%) | 30 (100.0%) |
Disability Class by Sex by Age in Burna
Disability Class: Hearing Difficulty
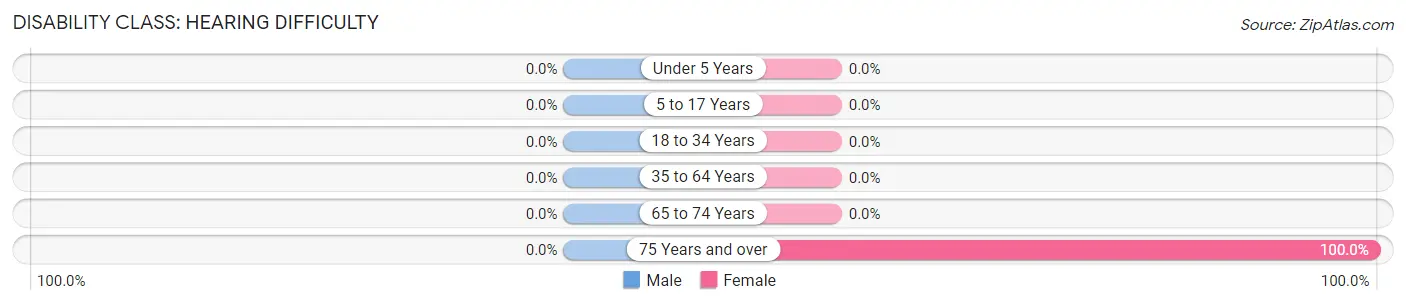
| Age Bracket | Male | Female |
| Under 5 Years | 0 (0.0%) | 0 (0.0%) |
| 5 to 17 Years | 0 (0.0%) | 0 (0.0%) |
| 18 to 34 Years | 0 (0.0%) | 0 (0.0%) |
| 35 to 64 Years | 0 (0.0%) | 0 (0.0%) |
| 65 to 74 Years | 0 (0.0%) | 0 (0.0%) |
| 75 Years and over | 0 (0.0%) | 30 (100.0%) |
Disability Class: Vision Difficulty
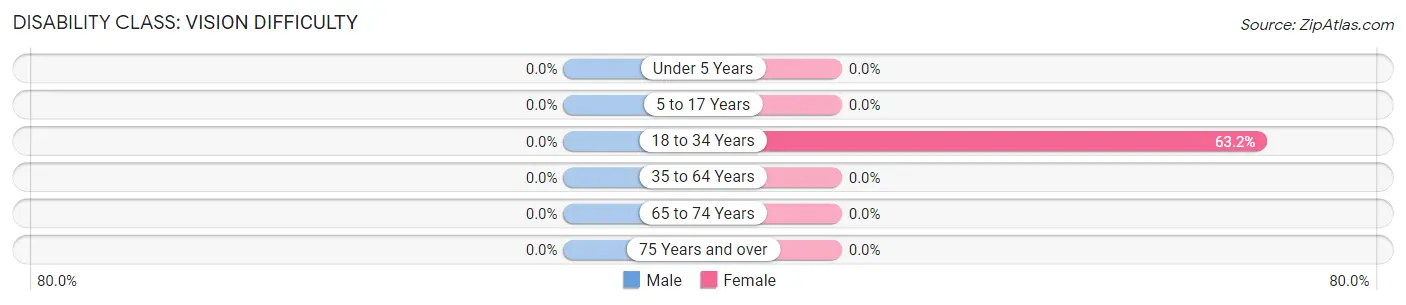
| Age Bracket | Male | Female |
| Under 5 Years | 0 (0.0%) | 0 (0.0%) |
| 5 to 17 Years | 0 (0.0%) | 0 (0.0%) |
| 18 to 34 Years | 0 (0.0%) | 12 (63.2%) |
| 35 to 64 Years | 0 (0.0%) | 0 (0.0%) |
| 65 to 74 Years | 0 (0.0%) | 0 (0.0%) |
| 75 Years and over | 0 (0.0%) | 0 (0.0%) |
Disability Class: Cognitive Difficulty
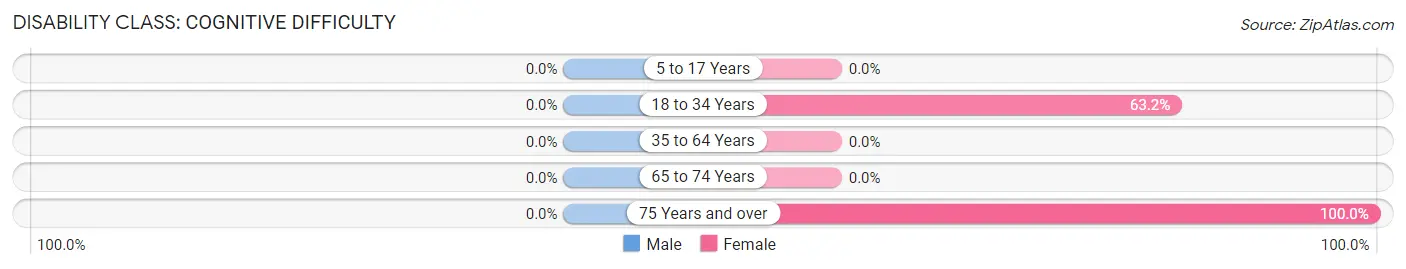
| Age Bracket | Male | Female |
| 5 to 17 Years | 0 (0.0%) | 0 (0.0%) |
| 18 to 34 Years | 0 (0.0%) | 12 (63.2%) |
| 35 to 64 Years | 0 (0.0%) | 0 (0.0%) |
| 65 to 74 Years | 0 (0.0%) | 0 (0.0%) |
| 75 Years and over | 0 (0.0%) | 30 (100.0%) |
Disability Class: Ambulatory Difficulty
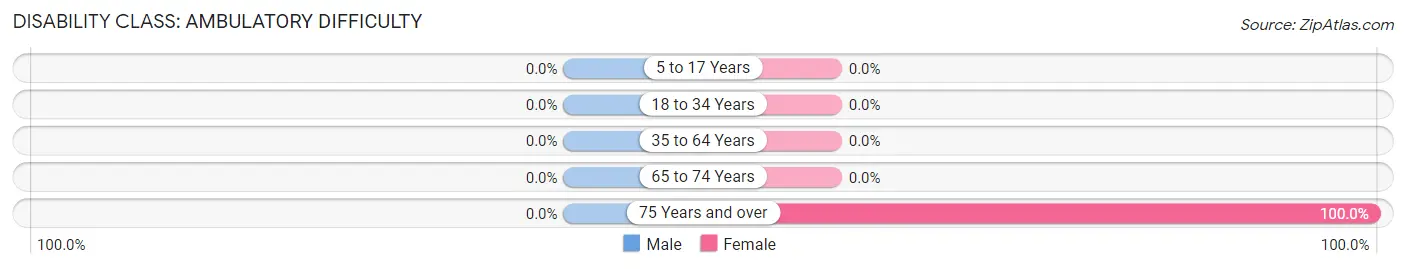
| Age Bracket | Male | Female |
| 5 to 17 Years | 0 (0.0%) | 0 (0.0%) |
| 18 to 34 Years | 0 (0.0%) | 0 (0.0%) |
| 35 to 64 Years | 0 (0.0%) | 0 (0.0%) |
| 65 to 74 Years | 0 (0.0%) | 0 (0.0%) |
| 75 Years and over | 0 (0.0%) | 30 (100.0%) |
Disability Class: Self-Care Difficulty
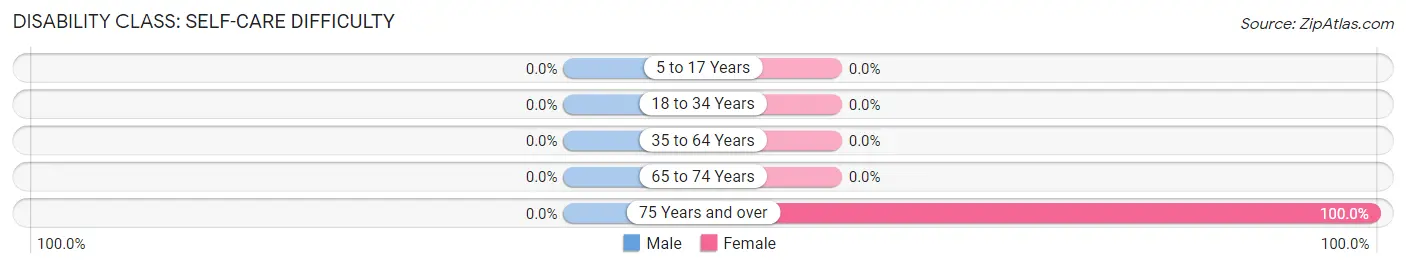
| Age Bracket | Male | Female |
| 5 to 17 Years | 0 (0.0%) | 0 (0.0%) |
| 18 to 34 Years | 0 (0.0%) | 0 (0.0%) |
| 35 to 64 Years | 0 (0.0%) | 0 (0.0%) |
| 65 to 74 Years | 0 (0.0%) | 0 (0.0%) |
| 75 Years and over | 0 (0.0%) | 30 (100.0%) |
Technology Access in Burna
Computing Device Access in Burna
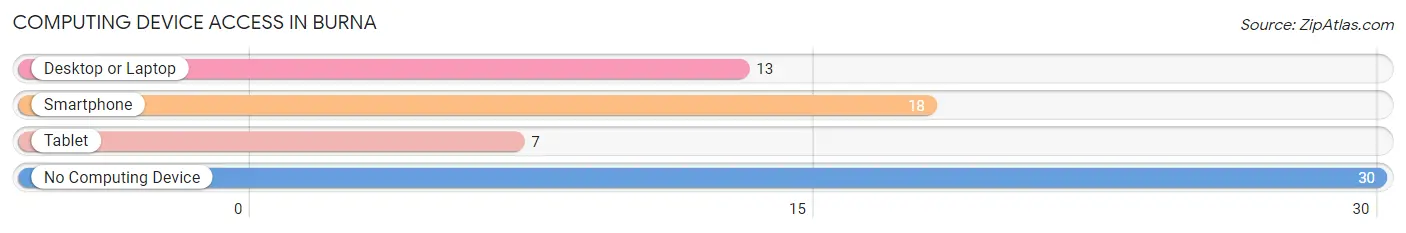
| Device Type | # Households | % Households |
| Desktop or Laptop | 13 | 27.1% |
| Smartphone | 18 | 37.5% |
| Tablet | 7 | 14.6% |
| No Computing Device | 30 | 62.5% |
| Total | 48 | 100.0% |
Internet Access in Burna
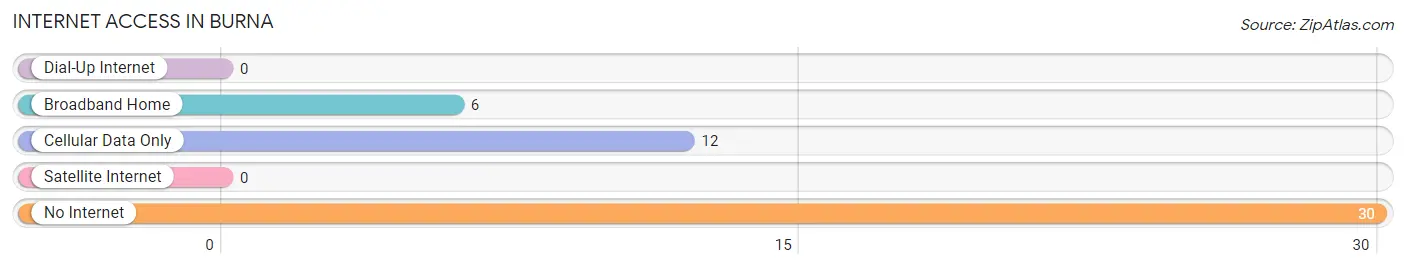
| Internet Type | # Households | % Households |
| Dial-Up Internet | 0 | 0.0% |
| Broadband Home | 6 | 12.5% |
| Cellular Data Only | 12 | 25.0% |
| Satellite Internet | 0 | 0.0% |
| No Internet | 30 | 62.5% |
| Total | 48 | 100.0% |
Burna Summary
Burna is a small unincorporated community located in Livingston County, Kentucky. It is situated along the banks of the Green River, approximately 10 miles south of the county seat of Smithland. The population of Burna was estimated to be around 500 people in 2000.
Geography
Burna is located in the western part of Livingston County, Kentucky. It is situated along the banks of the Green River, approximately 10 miles south of the county seat of Smithland. The terrain of the area is mostly flat, with some rolling hills. The climate is humid subtropical, with hot summers and mild winters.
The area around Burna is mostly rural, with some small towns and villages scattered throughout the county. The nearest major city is Paducah, which is located about 40 miles to the south.
Economy
The economy of Burna is largely based on agriculture. The area is known for its production of tobacco, corn, soybeans, and hay. There are also several small businesses in the area, including a few restaurants, a grocery store, and a few gas stations.
The nearest major employers are located in Paducah, which is about 40 miles away. The city is home to several large companies, including a paper mill, a steel mill, and a chemical plant.
Demographics
As of the 2000 census, the population of Burna was estimated to be around 500 people. The racial makeup of the town was 97.2% White, 0.8% African American, 0.2% Native American, 0.2% Asian, and 1.6% from other races. The median household income was $25,000, and the median family income was $30,000.
The town is served by the Livingston County School District, which includes two elementary schools, one middle school, and one high school. The nearest college is Murray State University, which is located about 40 miles away in Murray, Kentucky.
Conclusion
Burna is a small unincorporated community located in Livingston County, Kentucky. It is situated along the banks of the Green River, approximately 10 miles south of the county seat of Smithland. The population of Burna was estimated to be around 500 people in 2000. The economy of the town is largely based on agriculture, with some small businesses scattered throughout the area. The racial makeup of the town was 97.2% White, 0.8% African American, 0.2% Native American, 0.2% Asian, and 1.6% from other races. The town is served by the Livingston County School District, which includes two elementary schools, one middle school, and one high school.
Common Questions
What is Per Capita Income in Burna?
Per Capita income in Burna is $201,437.
What is Inequality or Gini Index in Burna?
Inequality or Gini Index in Burna is 0.80.
What is the Total Population of Burna?
Total Population of Burna is 101.
What is the Total Male Population of Burna?
Total Male Population of Burna is 32.
What is the Total Female Population of Burna?
Total Female Population of Burna is 69.
What is the Ratio of Males per 100 Females in Burna?
There are 46.38 Males per 100 Females in Burna.
What is the Ratio of Females per 100 Males in Burna?
There are 215.62 Females per 100 Males in Burna.
What is the Median Population Age in Burna?
Median Population Age in Burna is 51.9 Years.
What is the Average Family Size in Burna
Average Family Size in Burna is 3.9 People.
What is the Average Household Size in Burna
Average Household Size in Burna is 2.1 People.
How Large is the Labor Force in Burna?
There are 38 People in the Labor Forcein in Burna.
What is the Percentage of People in the Labor Force in Burna?
40.0% of People are in the Labor Force in Burna.