Zip Codes with the Highest Percentage of Families with Income Above $200,000 in Kentucky
RELATED REPORTS & OPTIONS
Family Income | $200k+
Kentucky
Compare Zip Codes
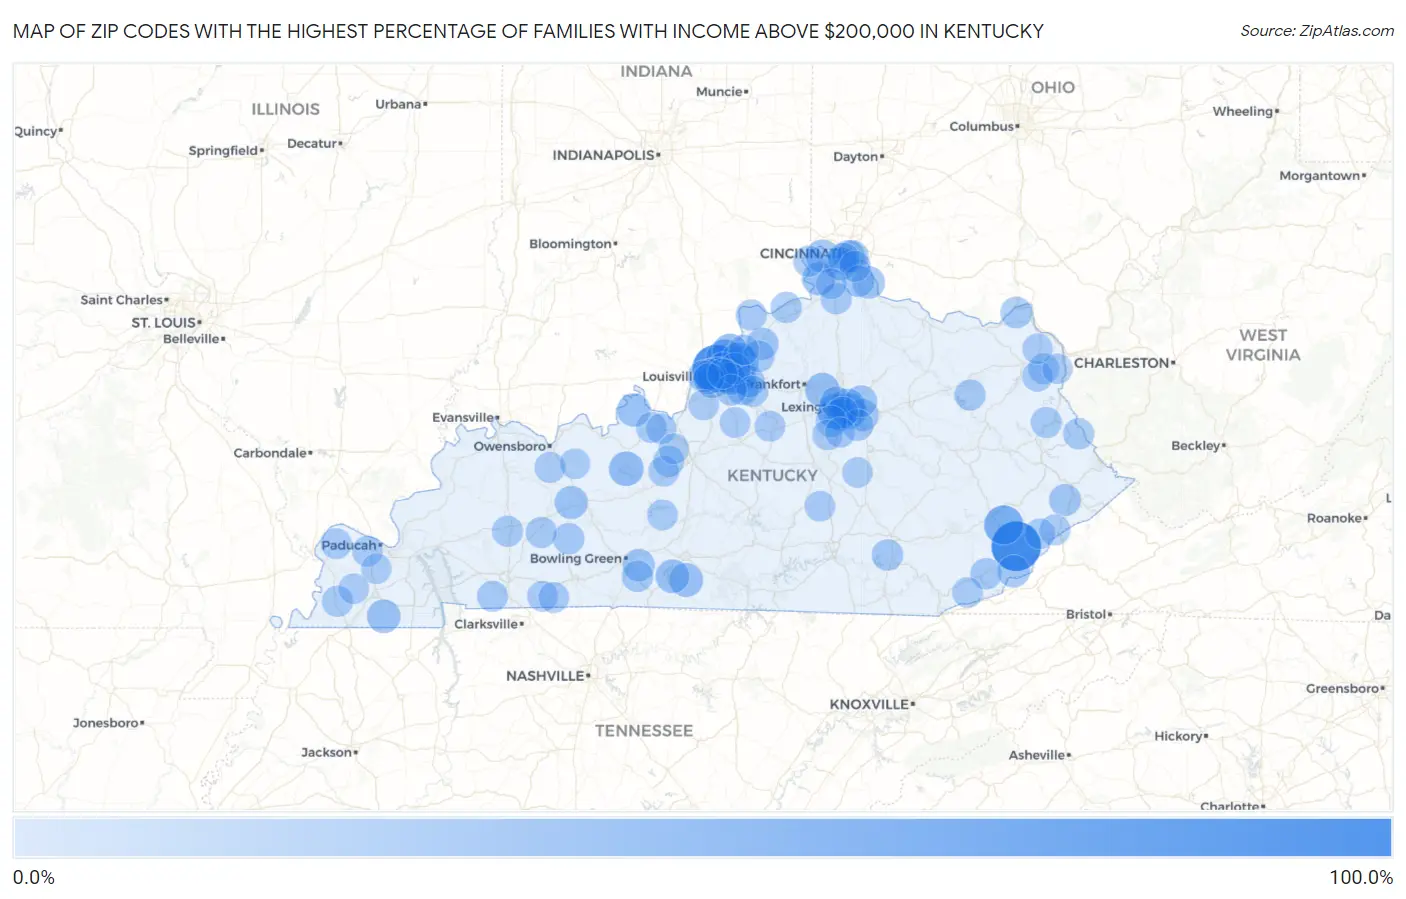
Map of Zip Codes with the Highest Percentage of Families with Income Above $200,000 in Kentucky
0.0%
100.0%
Zip Codes with the Highest Percentage of Families with Income Above $200,000 in Kentucky
| Zip Code | Families with Income > $200k | vs State | vs National | |
| 1. | 41821 | 100.0% | 8.2%(+91.8)#1 | 14.8%(+85.2)#12 |
| 2. | 40025 | 90.9% | 8.2%(+82.7)#2 | 14.8%(+76.1)#54 |
| 3. | 41751 | 51.1% | 8.2%(+42.9)#3 | 14.8%(+36.3)#618 |
| 4. | 40059 | 46.9% | 8.2%(+38.7)#4 | 14.8%(+32.1)#820 |
| 5. | 40513 | 33.0% | 8.2%(+24.8)#5 | 14.8%(+18.2)#2,106 |
| 6. | 40207 | 32.8% | 8.2%(+24.6)#6 | 14.8%(+18.0)#2,125 |
| 7. | 40026 | 31.5% | 8.2%(+23.3)#7 | 14.8%(+16.7)#2,300 |
| 8. | 40245 | 31.4% | 8.2%(+23.2)#8 | 14.8%(+16.6)#2,307 |
| 9. | 40502 | 31.1% | 8.2%(+22.9)#9 | 14.8%(+16.3)#2,350 |
| 10. | 40507 | 30.9% | 8.2%(+22.7)#10 | 14.8%(+16.1)#2,391 |
| 11. | 40152 | 29.6% | 8.2%(+21.4)#11 | 14.8%(+14.8)#2,579 |
| 12. | 40014 | 28.6% | 8.2%(+20.4)#12 | 14.8%(+13.8)#2,750 |
| 13. | 40347 | 28.5% | 8.2%(+20.3)#13 | 14.8%(+13.7)#2,787 |
| 14. | 42131 | 26.0% | 8.2%(+17.8)#14 | 14.8%(+11.2)#3,260 |
| 15. | 42156 | 25.5% | 8.2%(+17.3)#15 | 14.8%(+10.7)#3,357 |
| 16. | 42079 | 24.7% | 8.2%(+16.5)#16 | 14.8%(+9.90)#3,554 |
| 17. | 40241 | 24.0% | 8.2%(+15.8)#17 | 14.8%(+9.20)#3,700 |
| 18. | 41091 | 23.9% | 8.2%(+15.7)#18 | 14.8%(+9.10)#3,726 |
| 19. | 40157 | 23.7% | 8.2%(+15.5)#19 | 14.8%(+8.90)#3,796 |
| 20. | 40222 | 23.6% | 8.2%(+15.4)#20 | 14.8%(+8.80)#3,811 |
| 21. | 41048 | 23.6% | 8.2%(+15.4)#21 | 14.8%(+8.80)#3,815 |
| 22. | 40205 | 23.4% | 8.2%(+15.2)#22 | 14.8%(+8.60)#3,851 |
| 23. | 42354 | 23.4% | 8.2%(+15.2)#23 | 14.8%(+8.60)#3,866 |
| 24. | 40010 | 23.1% | 8.2%(+14.9)#24 | 14.8%(+8.30)#3,931 |
| 25. | 41017 | 22.4% | 8.2%(+14.2)#25 | 14.8%(+7.60)#4,105 |
| 26. | 40223 | 21.7% | 8.2%(+13.5)#26 | 14.8%(+6.90)#4,298 |
| 27. | 40509 | 20.2% | 8.2%(+12.0)#27 | 14.8%(+5.40)#4,742 |
| 28. | 40023 | 20.2% | 8.2%(+12.0)#28 | 14.8%(+5.40)#4,755 |
| 29. | 40927 | 20.2% | 8.2%(+12.0)#29 | 14.8%(+5.40)#4,769 |
| 30. | 41007 | 19.5% | 8.2%(+11.3)#30 | 14.8%(+4.70)#4,982 |
| 31. | 42103 | 19.1% | 8.2%(+10.9)#31 | 14.8%(+4.30)#5,111 |
| 32. | 40243 | 18.7% | 8.2%(+10.5)#32 | 14.8%(+3.90)#5,290 |
| 33. | 40070 | 18.7% | 8.2%(+10.5)#33 | 14.8%(+3.90)#5,309 |
| 34. | 40206 | 18.4% | 8.2%(+10.2)#34 | 14.8%(+3.60)#5,414 |
| 35. | 40514 | 18.2% | 8.2%(+10.00)#35 | 14.8%(+3.40)#5,491 |
| 36. | 41071 | 18.0% | 8.2%(+9.80)#36 | 14.8%(+3.20)#5,570 |
| 37. | 40510 | 18.0% | 8.2%(+9.80)#37 | 14.8%(+3.20)#5,591 |
| 38. | 41075 | 17.9% | 8.2%(+9.70)#38 | 14.8%(+3.10)#5,611 |
| 39. | 40516 | 17.6% | 8.2%(+9.40)#39 | 14.8%(+2.80)#5,743 |
| 40. | 41011 | 17.5% | 8.2%(+9.30)#40 | 14.8%(+2.70)#5,765 |
| 41. | 41560 | 17.3% | 8.2%(+9.10)#41 | 14.8%(+2.50)#5,883 |
| 42. | 40067 | 17.1% | 8.2%(+8.90)#42 | 14.8%(+2.30)#5,951 |
| 43. | 40202 | 16.6% | 8.2%(+8.40)#43 | 14.8%(+1.80)#6,180 |
| 44. | 40515 | 16.3% | 8.2%(+8.10)#44 | 14.8%(+1.50)#6,290 |
| 45. | 40503 | 16.3% | 8.2%(+8.10)#45 | 14.8%(+1.50)#6,293 |
| 46. | 40068 | 16.2% | 8.2%(+8.00)#46 | 14.8%(+1.40)#6,371 |
| 47. | 41001 | 15.8% | 8.2%(+7.60)#47 | 14.8%(+1.000)#6,542 |
| 48. | 40339 | 15.8% | 8.2%(+7.60)#48 | 14.8%(+1.000)#6,572 |
| 49. | 40737 | 15.6% | 8.2%(+7.40)#49 | 14.8%(+0.800)#6,664 |
| 50. | 41174 | 15.6% | 8.2%(+7.40)#50 | 14.8%(+0.800)#6,667 |
| 51. | 40056 | 15.4% | 8.2%(+7.20)#51 | 14.8%(+0.600)#6,760 |
| 52. | 42122 | 15.2% | 8.2%(+7.00)#52 | 14.8%(+0.400)#6,870 |
| 53. | 40806 | 15.2% | 8.2%(+7.00)#53 | 14.8%(+0.400)#6,884 |
| 54. | 42339 | 15.1% | 8.2%(+6.90)#54 | 14.8%(+0.300)#6,956 |
| 55. | 41076 | 14.7% | 8.2%(+6.50)#55 | 14.8%(-0.100)#7,161 |
| 56. | 41203 | 14.6% | 8.2%(+6.40)#56 | 14.8%(-0.200)#7,244 |
| 57. | 41045 | 14.1% | 8.2%(+5.90)#57 | 14.8%(-0.700)#7,501 |
| 58. | 40022 | 14.1% | 8.2%(+5.90)#58 | 14.8%(-0.700)#7,503 |
| 59. | 42345 | 13.8% | 8.2%(+5.60)#59 | 14.8%(-1.00)#7,673 |
| 60. | 42442 | 13.8% | 8.2%(+5.60)#60 | 14.8%(-1.00)#7,693 |
| 61. | 41030 | 13.7% | 8.2%(+5.50)#61 | 14.8%(-1.10)#7,758 |
| 62. | 40313 | 13.7% | 8.2%(+5.50)#62 | 14.8%(-1.10)#7,772 |
| 63. | 41080 | 13.6% | 8.2%(+5.40)#63 | 14.8%(-1.20)#7,834 |
| 64. | 40299 | 13.5% | 8.2%(+5.30)#64 | 14.8%(-1.30)#7,850 |
| 65. | 42724 | 13.5% | 8.2%(+5.30)#65 | 14.8%(-1.30)#7,880 |
| 66. | 42031 | 13.5% | 8.2%(+5.30)#66 | 14.8%(-1.30)#7,885 |
| 67. | 40204 | 13.4% | 8.2%(+5.20)#67 | 14.8%(-1.40)#7,930 |
| 68. | 41232 | 13.4% | 8.2%(+5.20)#68 | 14.8%(-1.40)#7,970 |
| 69. | 42236 | 13.1% | 8.2%(+4.90)#69 | 14.8%(-1.70)#8,184 |
| 70. | 40045 | 13.0% | 8.2%(+4.80)#70 | 14.8%(-1.80)#8,245 |
| 71. | 41810 | 12.9% | 8.2%(+4.70)#71 | 14.8%(-1.90)#8,349 |
| 72. | 41168 | 12.8% | 8.2%(+4.60)#72 | 14.8%(-2.00)#8,387 |
| 73. | 42376 | 12.6% | 8.2%(+4.40)#73 | 14.8%(-2.20)#8,516 |
| 74. | 42056 | 12.6% | 8.2%(+4.40)#74 | 14.8%(-2.20)#8,533 |
| 75. | 41132 | 12.1% | 8.2%(+3.90)#75 | 14.8%(-2.70)#8,950 |
| 76. | 42732 | 12.0% | 8.2%(+3.80)#76 | 14.8%(-2.80)#9,003 |
| 77. | 42234 | 11.7% | 8.2%(+3.50)#77 | 14.8%(-3.10)#9,216 |
| 78. | 42001 | 11.6% | 8.2%(+3.40)#78 | 14.8%(-3.20)#9,268 |
| 79. | 41094 | 11.6% | 8.2%(+3.40)#79 | 14.8%(-3.20)#9,277 |
| 80. | 42729 | 11.6% | 8.2%(+3.40)#80 | 14.8%(-3.20)#9,318 |
| 81. | 40142 | 11.5% | 8.2%(+3.30)#81 | 14.8%(-3.30)#9,387 |
| 82. | 40012 | 11.5% | 8.2%(+3.30)#82 | 14.8%(-3.30)#9,404 |
| 83. | 42204 | 11.5% | 8.2%(+3.30)#83 | 14.8%(-3.30)#9,408 |
| 84. | 40013 | 11.4% | 8.2%(+3.20)#84 | 14.8%(-3.40)#9,464 |
| 85. | 40117 | 11.4% | 8.2%(+3.20)#85 | 14.8%(-3.40)#9,484 |
| 86. | 40442 | 11.4% | 8.2%(+3.20)#86 | 14.8%(-3.40)#9,502 |
| 87. | 40109 | 11.2% | 8.2%(+3.00)#87 | 14.8%(-3.60)#9,665 |
| 88. | 41815 | 11.2% | 8.2%(+3.00)#88 | 14.8%(-3.60)#9,685 |
| 89. | 40461 | 11.0% | 8.2%(+2.80)#89 | 14.8%(-3.80)#9,847 |
| 90. | 40863 | 11.0% | 8.2%(+2.80)#90 | 14.8%(-3.80)#9,877 |
| 91. | 40031 | 10.9% | 8.2%(+2.70)#91 | 14.8%(-3.90)#9,908 |
| 92. | 40162 | 10.9% | 8.2%(+2.70)#92 | 14.8%(-3.90)#9,938 |
| 93. | 42027 | 10.9% | 8.2%(+2.70)#93 | 14.8%(-3.90)#9,951 |
| 94. | 42378 | 10.8% | 8.2%(+2.60)#94 | 14.8%(-4.00)#10,048 |
| 95. | 42039 | 10.8% | 8.2%(+2.60)#95 | 14.8%(-4.00)#10,066 |
| 96. | 40242 | 10.7% | 8.2%(+2.50)#96 | 14.8%(-4.10)#10,122 |
| 97. | 40390 | 10.7% | 8.2%(+2.50)#97 | 14.8%(-4.10)#10,129 |
| 98. | 41129 | 10.6% | 8.2%(+2.40)#98 | 14.8%(-4.20)#10,222 |
| 99. | 41121 | 10.6% | 8.2%(+2.40)#99 | 14.8%(-4.20)#10,247 |
| 100. | 40356 | 10.4% | 8.2%(+2.20)#100 | 14.8%(-4.40)#10,369 |
Common Questions
What are the Top 10 Zip Codes with the Highest Percentage of Families with Income Above $200,000 in Kentucky?
Top 10 Zip Codes with the Highest Percentage of Families with Income Above $200,000 in Kentucky are:
What zip code has the Highest Percentage of Families with Income Above $200,000 in Kentucky?
41821 has the Highest Percentage of Families with Income Above $200,000 in Kentucky with 100.0%.
What is the Percentage of Families with Income Above $200,000 in the State of Kentucky?
Percentage of Families with Income Above $200,000 in Kentucky is 8.2%.
What is the Percentage of Families with Income Above $200,000 in the United States?
Percentage of Families with Income Above $200,000 in the United States is 14.8%.