Westwood, KY Map & Demographics
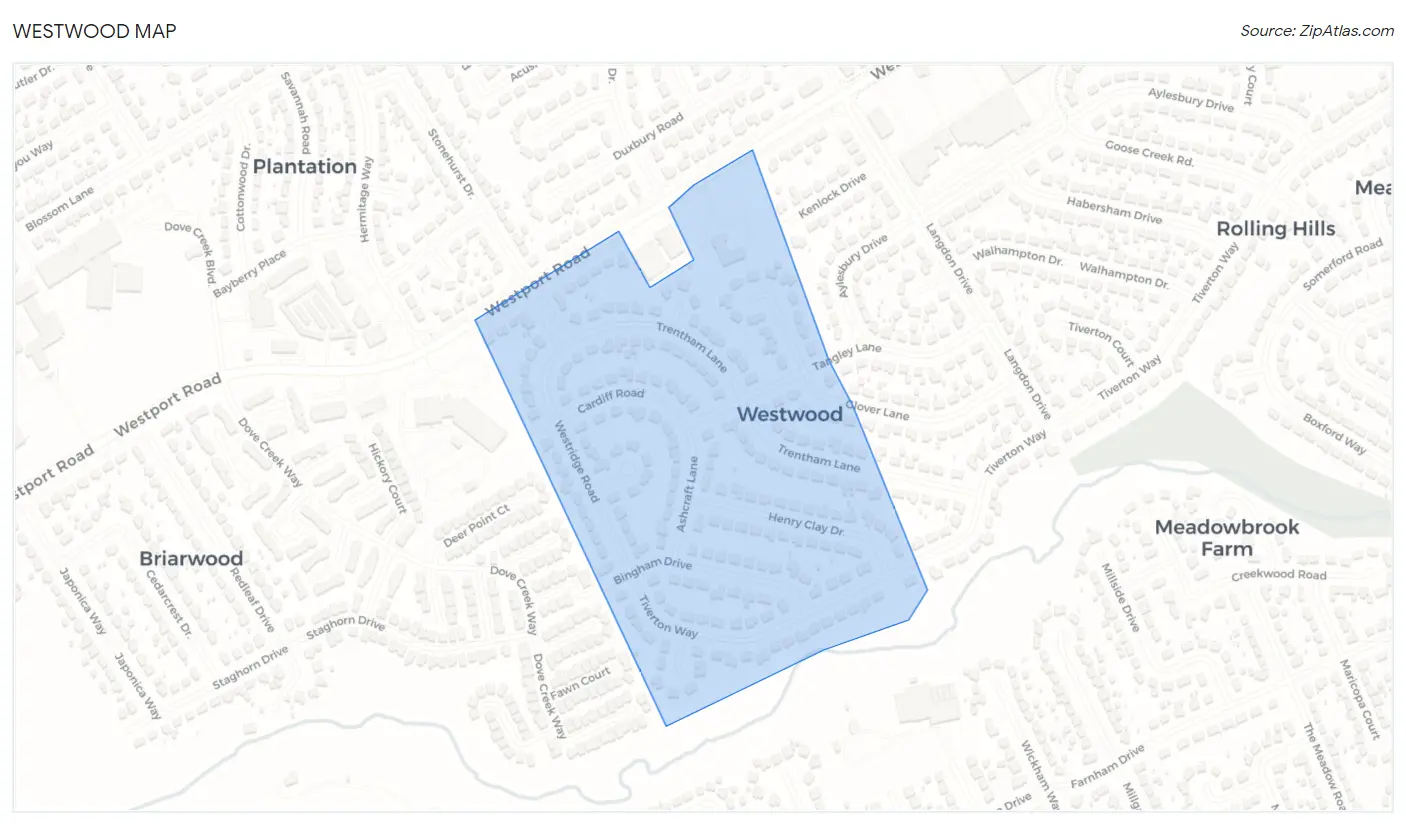
Westwood Map
Westwood Overview
$41,292
PER CAPITA INCOME
$108,250
AVG FAMILY INCOME
$98,125
AVG HOUSEHOLD INCOME
52.5%
WAGE / INCOME GAP [ % ]
47.5¢/ $1
WAGE / INCOME GAP [ $ ]
0.36
INEQUALITY / GINI INDEX
496
TOTAL POPULATION
276
MALE POPULATION
220
FEMALE POPULATION
125.45
MALES / 100 FEMALES
79.71
FEMALES / 100 MALES
43.0
MEDIAN AGE
3.0
AVG FAMILY SIZE
2.8
AVG HOUSEHOLD SIZE
261
LABOR FORCE [ PEOPLE ]
70.4%
PERCENT IN LABOR FORCE
1.5%
UNEMPLOYMENT RATE
Westwood Area Codes
Income in Westwood
Income Overview in Westwood
Per Capita Income in Westwood is $41,292, while median incomes of families and households are $108,250 and $98,125 respectively.
| Characteristic | Number | Measure |
| Per Capita Income | 496 | $41,292 |
| Median Family Income | 151 | $108,250 |
| Mean Family Income | 151 | $120,439 |
| Median Household Income | 177 | $98,125 |
| Mean Household Income | 177 | $112,927 |
| Income Deficit | 151 | $0 |
| Wage / Income Gap (%) | 496 | 52.45% |
| Wage / Income Gap ($) | 496 | 47.55¢ per $1 |
| Gini / Inequality Index | 496 | 0.36 |
Earnings by Sex in Westwood
Average Earnings in Westwood are $46,250, $69,107 for men and $32,857 for women, a difference of 52.4%.
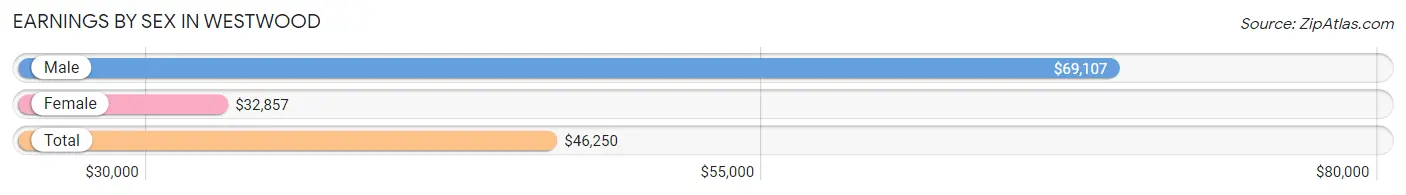
| Sex | Number | Average Earnings |
| Male | 147 (53.4%) | $69,107 |
| Female | 128 (46.6%) | $32,857 |
| Total | 275 (100.0%) | $46,250 |
Earnings by Sex by Income Bracket in Westwood
The most common earnings brackets in Westwood are $100,000+ for men (35 | 23.8%) and $75,000 to $99,999 for women (18 | 14.1%).
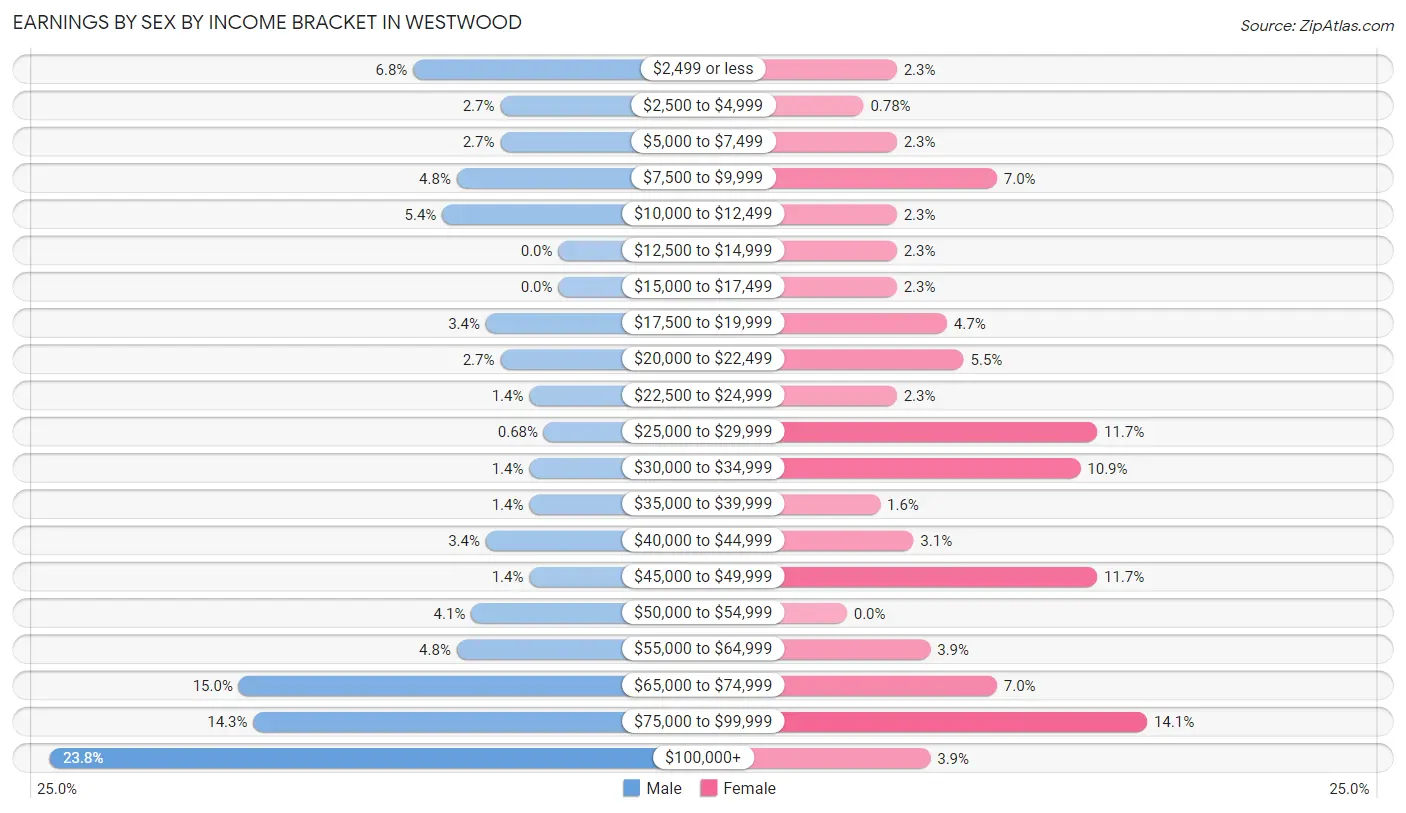
| Income | Male | Female |
| $2,499 or less | 10 (6.8%) | 3 (2.3%) |
| $2,500 to $4,999 | 4 (2.7%) | 1 (0.8%) |
| $5,000 to $7,499 | 4 (2.7%) | 3 (2.3%) |
| $7,500 to $9,999 | 7 (4.8%) | 9 (7.0%) |
| $10,000 to $12,499 | 8 (5.4%) | 3 (2.3%) |
| $12,500 to $14,999 | 0 (0.0%) | 3 (2.3%) |
| $15,000 to $17,499 | 0 (0.0%) | 3 (2.3%) |
| $17,500 to $19,999 | 5 (3.4%) | 6 (4.7%) |
| $20,000 to $22,499 | 4 (2.7%) | 7 (5.5%) |
| $22,500 to $24,999 | 2 (1.4%) | 3 (2.3%) |
| $25,000 to $29,999 | 1 (0.7%) | 15 (11.7%) |
| $30,000 to $34,999 | 2 (1.4%) | 14 (10.9%) |
| $35,000 to $39,999 | 2 (1.4%) | 2 (1.6%) |
| $40,000 to $44,999 | 5 (3.4%) | 4 (3.1%) |
| $45,000 to $49,999 | 2 (1.4%) | 15 (11.7%) |
| $50,000 to $54,999 | 6 (4.1%) | 0 (0.0%) |
| $55,000 to $64,999 | 7 (4.8%) | 5 (3.9%) |
| $65,000 to $74,999 | 22 (15.0%) | 9 (7.0%) |
| $75,000 to $99,999 | 21 (14.3%) | 18 (14.1%) |
| $100,000+ | 35 (23.8%) | 5 (3.9%) |
| Total | 147 (100.0%) | 128 (100.0%) |
Earnings by Sex by Educational Attainment in Westwood
Average earnings in Westwood are $73,750 for men and $33,036 for women, a difference of 55.2%. Men with an educational attainment of graduate degree enjoy the highest average annual earnings of $95,625, while those with college or associate's degree education earn the least with $69,688. Women with an educational attainment of bachelor's degree earn the most with the average annual earnings of $40,938, while those with college or associate's degree education have the smallest earnings of $29,167.
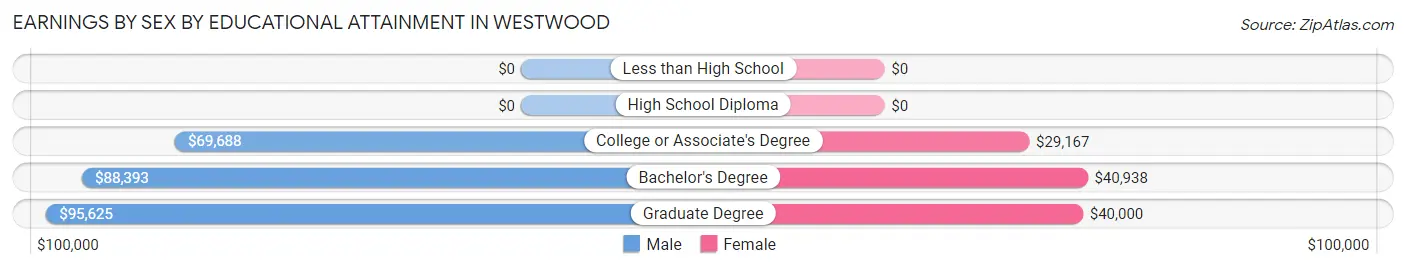
| Educational Attainment | Male Income | Female Income |
| Less than High School | - | - |
| High School Diploma | - | - |
| College or Associate's Degree | $69,688 | $29,167 |
| Bachelor's Degree | $88,393 | $40,938 |
| Graduate Degree | $95,625 | $40,000 |
| Total | $73,750 | $33,036 |
Family Income in Westwood
Family Income Brackets in Westwood
According to the Westwood family income data, there are 45 families falling into the $100,000 to $149,999 income range, which is the most common income bracket and makes up 29.8% of all families.
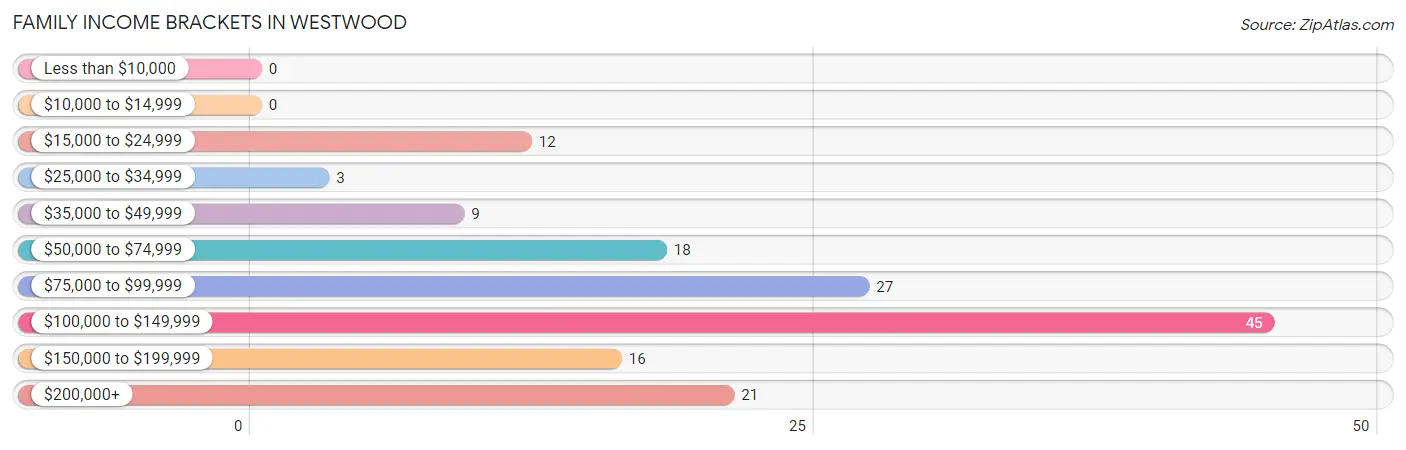
| Income Bracket | # Families | % Families |
| Less than $10,000 | 0 | 0.0% |
| $10,000 to $14,999 | 0 | 0.0% |
| $15,000 to $24,999 | 12 | 7.9% |
| $25,000 to $34,999 | 3 | 2.0% |
| $35,000 to $49,999 | 9 | 6.0% |
| $50,000 to $74,999 | 18 | 11.9% |
| $75,000 to $99,999 | 27 | 17.9% |
| $100,000 to $149,999 | 45 | 29.8% |
| $150,000 to $199,999 | 16 | 10.6% |
| $200,000+ | 21 | 13.9% |
Family Income by Famaliy Size in Westwood
5-person families (14 | 9.3%) account for the highest median family income in Westwood with $250,001 per family, while 5-person families (14 | 9.3%) have the highest median income of $50,000 per family member.
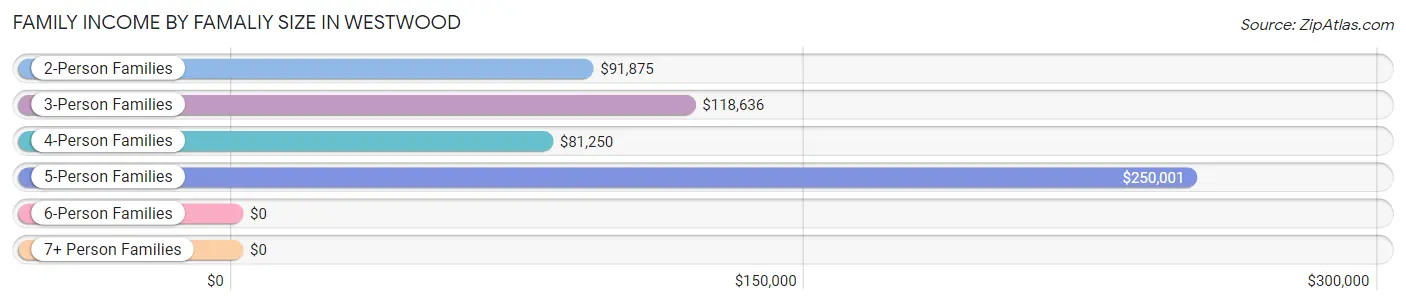
| Income Bracket | # Families | Median Income |
| 2-Person Families | 69 (45.7%) | $91,875 |
| 3-Person Families | 26 (17.2%) | $118,636 |
| 4-Person Families | 40 (26.5%) | $81,250 |
| 5-Person Families | 14 (9.3%) | $250,001 |
| 6-Person Families | 2 (1.3%) | $0 |
| 7+ Person Families | 0 (0.0%) | $0 |
| Total | 151 (100.0%) | $108,250 |
Family Income by Number of Earners in Westwood
The median family income in Westwood is $108,250, with families comprising 3+ earners (19) having the highest median family income of $169,583, while families with no earners (22) have the lowest median family income of $68,056, accounting for 12.6% and 14.6% of families, respectively.
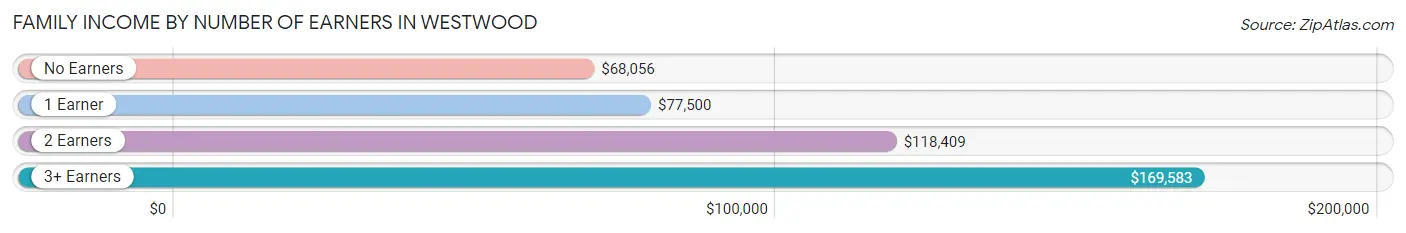
| Number of Earners | # Families | Median Income |
| No Earners | 22 (14.6%) | $68,056 |
| 1 Earner | 36 (23.8%) | $77,500 |
| 2 Earners | 74 (49.0%) | $118,409 |
| 3+ Earners | 19 (12.6%) | $169,583 |
| Total | 151 (100.0%) | $108,250 |
Household Income in Westwood
Household Income Brackets in Westwood
With 49 households falling in the category, the $100,000 to $149,999 income range is the most frequent in Westwood, accounting for 27.7% of all households.
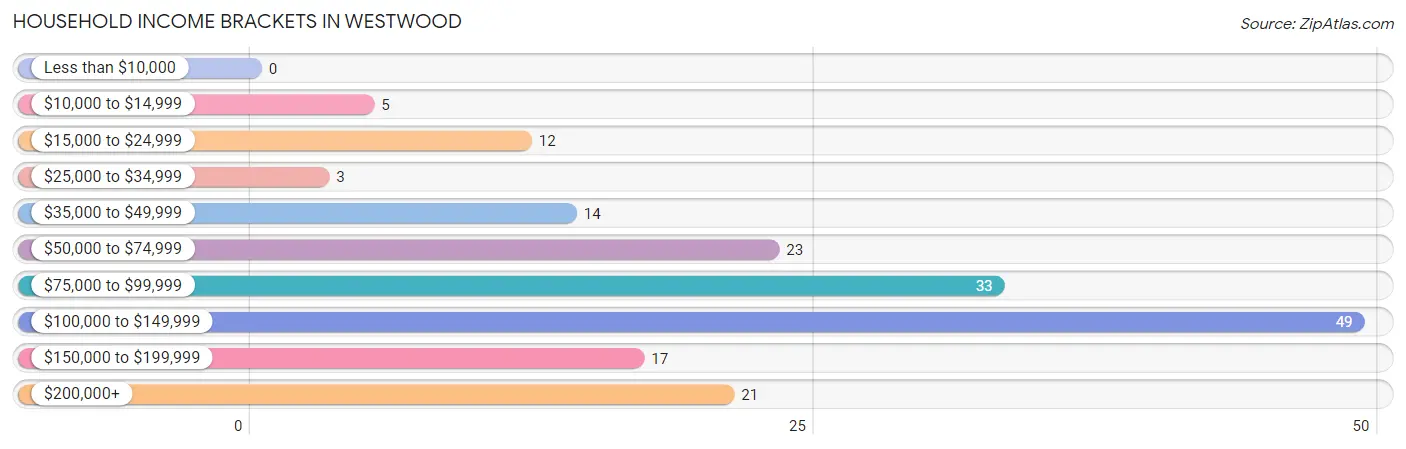
| Income Bracket | # Households | % Households |
| Less than $10,000 | 0 | 0.0% |
| $10,000 to $14,999 | 5 | 2.8% |
| $15,000 to $24,999 | 12 | 6.8% |
| $25,000 to $34,999 | 3 | 1.7% |
| $35,000 to $49,999 | 14 | 7.9% |
| $50,000 to $74,999 | 23 | 13.0% |
| $75,000 to $99,999 | 33 | 18.6% |
| $100,000 to $149,999 | 49 | 27.7% |
| $150,000 to $199,999 | 17 | 9.6% |
| $200,000+ | 21 | 11.9% |
Household Income by Householder Age in Westwood
The median household income in Westwood is $98,125, with the highest median household income of $121,250 found in the 45 to 64 years age bracket for the primary householder. A total of 69 households (39.0%) fall into this category. Meanwhile, the 15 to 24 years age bracket for the primary householder has the lowest median household income of $0, with 2 households (1.1%) in this group.
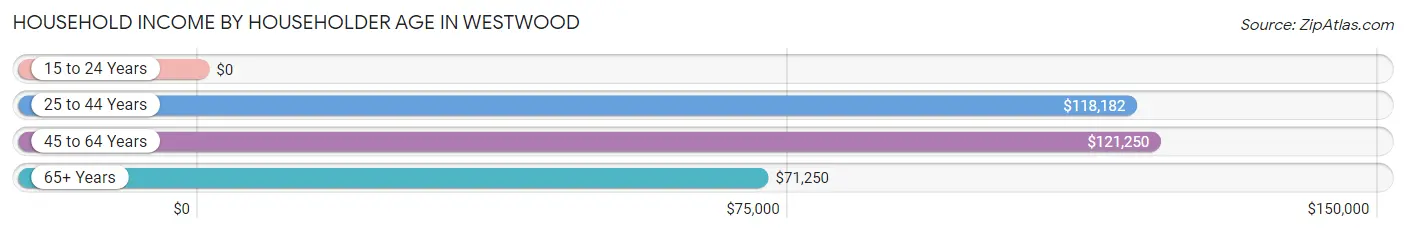
| Income Bracket | # Households | Median Income |
| 15 to 24 Years | 2 (1.1%) | $0 |
| 25 to 44 Years | 46 (26.0%) | $118,182 |
| 45 to 64 Years | 69 (39.0%) | $121,250 |
| 65+ Years | 60 (33.9%) | $71,250 |
| Total | 177 (100.0%) | $98,125 |
Poverty in Westwood
Income Below Poverty by Sex and Age in Westwood
With 10.9% poverty level for males and 11.8% for females among the residents of Westwood, 75 year old and over males and 6 to 11 year old females are the most vulnerable to poverty, with 8 males (27.6%) and 9 females (56.2%) in their respective age groups living below the poverty level.
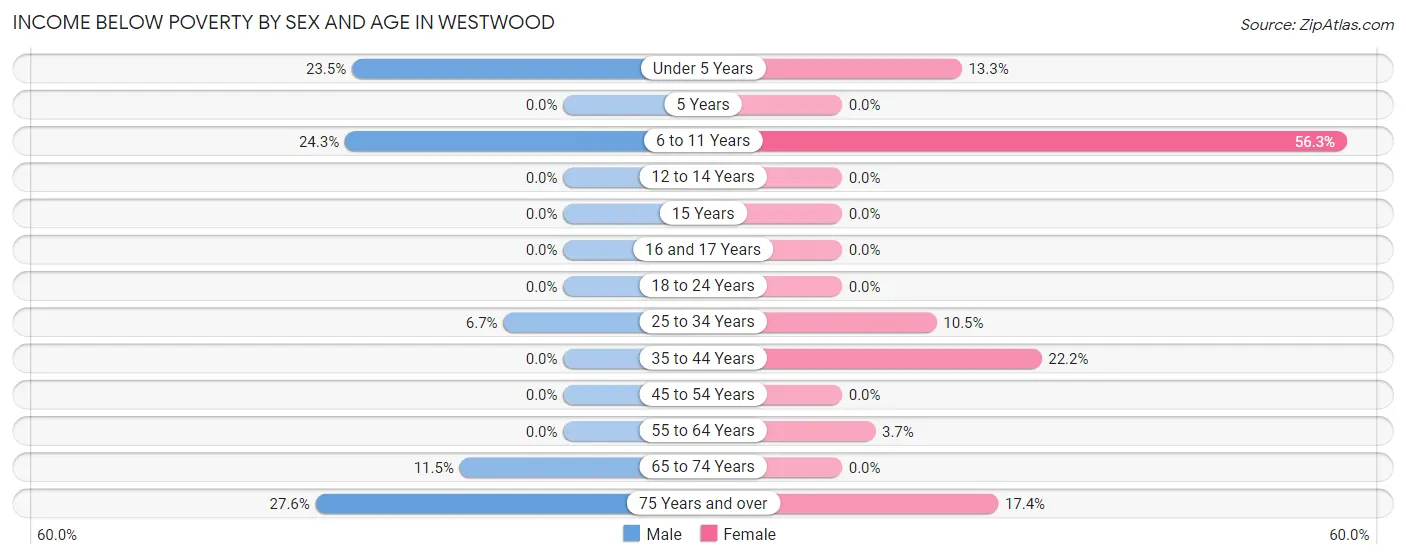
| Age Bracket | Male | Female |
| Under 5 Years | 8 (23.5%) | 2 (13.3%) |
| 5 Years | 0 (0.0%) | 0 (0.0%) |
| 6 to 11 Years | 9 (24.3%) | 9 (56.2%) |
| 12 to 14 Years | 0 (0.0%) | 0 (0.0%) |
| 15 Years | 0 (0.0%) | 0 (0.0%) |
| 16 and 17 Years | 0 (0.0%) | 0 (0.0%) |
| 18 to 24 Years | 0 (0.0%) | 0 (0.0%) |
| 25 to 34 Years | 2 (6.7%) | 2 (10.5%) |
| 35 to 44 Years | 0 (0.0%) | 8 (22.2%) |
| 45 to 54 Years | 0 (0.0%) | 0 (0.0%) |
| 55 to 64 Years | 0 (0.0%) | 1 (3.7%) |
| 65 to 74 Years | 3 (11.5%) | 0 (0.0%) |
| 75 Years and over | 8 (27.6%) | 4 (17.4%) |
| Total | 30 (10.9%) | 26 (11.8%) |
Income Above Poverty by Sex and Age in Westwood
According to the poverty statistics in Westwood, males aged 12 to 14 years and females aged 12 to 14 years are the age groups that are most secure financially, with 100.0% of males and 100.0% of females in these age groups living above the poverty line.
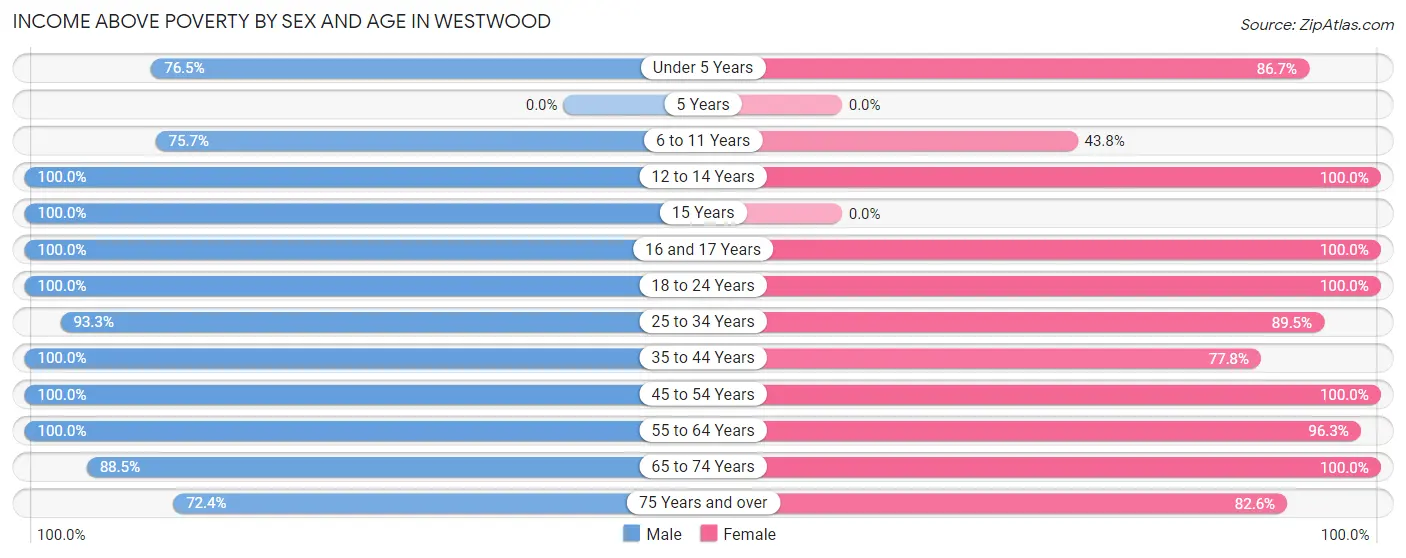
| Age Bracket | Male | Female |
| Under 5 Years | 26 (76.5%) | 13 (86.7%) |
| 5 Years | 0 (0.0%) | 0 (0.0%) |
| 6 to 11 Years | 28 (75.7%) | 7 (43.8%) |
| 12 to 14 Years | 5 (100.0%) | 15 (100.0%) |
| 15 Years | 3 (100.0%) | 0 (0.0%) |
| 16 and 17 Years | 8 (100.0%) | 5 (100.0%) |
| 18 to 24 Years | 23 (100.0%) | 7 (100.0%) |
| 25 to 34 Years | 28 (93.3%) | 17 (89.5%) |
| 35 to 44 Years | 22 (100.0%) | 28 (77.8%) |
| 45 to 54 Years | 29 (100.0%) | 31 (100.0%) |
| 55 to 64 Years | 30 (100.0%) | 26 (96.3%) |
| 65 to 74 Years | 23 (88.5%) | 26 (100.0%) |
| 75 Years and over | 21 (72.4%) | 19 (82.6%) |
| Total | 246 (89.1%) | 194 (88.2%) |
Income Below Poverty Among Married-Couple Families in Westwood
The poverty statistics for married-couple families in Westwood show that 3.2% or 4 of the total 124 families live below the poverty line. Families with 1 or 2 children have the highest poverty rate of 4.8%, comprising of 2 families. On the other hand, families with 3 or 4 children have the lowest poverty rate of 0.0%, which includes 0 families.
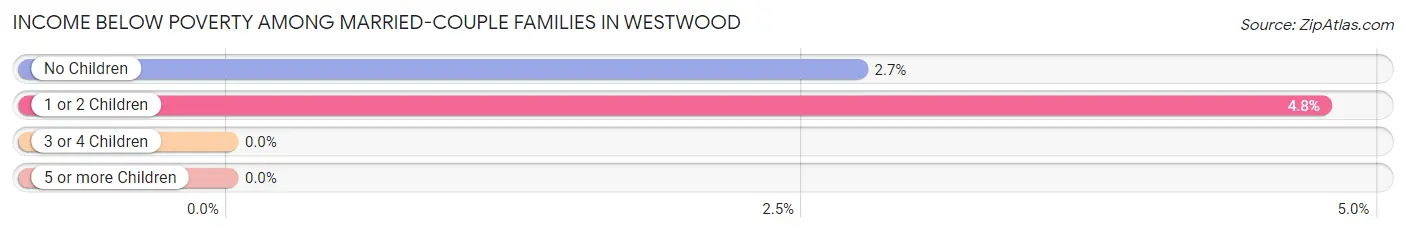
| Children | Above Poverty | Below Poverty |
| No Children | 71 (97.3%) | 2 (2.7%) |
| 1 or 2 Children | 40 (95.2%) | 2 (4.8%) |
| 3 or 4 Children | 9 (100.0%) | 0 (0.0%) |
| 5 or more Children | 0 (0.0%) | 0 (0.0%) |
| Total | 120 (96.8%) | 4 (3.2%) |
Income Below Poverty Among Single-Parent Households in Westwood
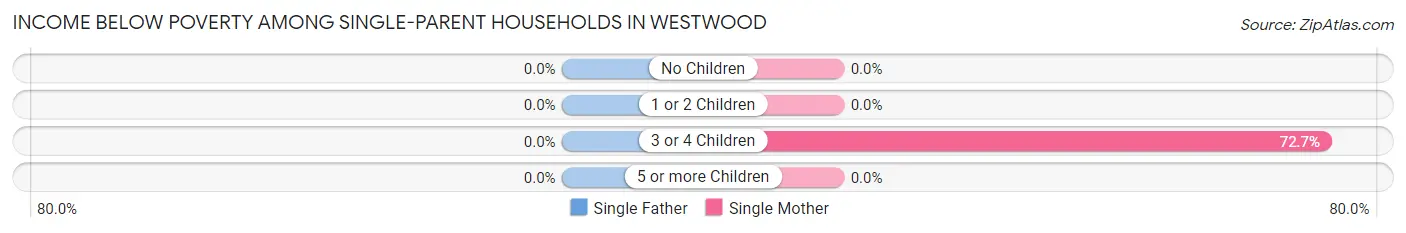
| Children | Single Father | Single Mother |
| No Children | 0 (0.0%) | 0 (0.0%) |
| 1 or 2 Children | 0 (0.0%) | 0 (0.0%) |
| 3 or 4 Children | 0 (0.0%) | 8 (72.7%) |
| 5 or more Children | 0 (0.0%) | 0 (0.0%) |
| Total | 0 (0.0%) | 8 (34.8%) |
Income Below Poverty Among Married-Couple vs Single-Parent Households in Westwood
The poverty data for Westwood shows that 4 of the married-couple family households (3.2%) and 8 of the single-parent households (29.6%) are living below the poverty level. Within the married-couple family households, those with 1 or 2 children have the highest poverty rate, with 2 households (4.8%) falling below the poverty line. Among the single-parent households, those with 3 or 4 children have the highest poverty rate, with 8 household (72.7%) living below poverty.
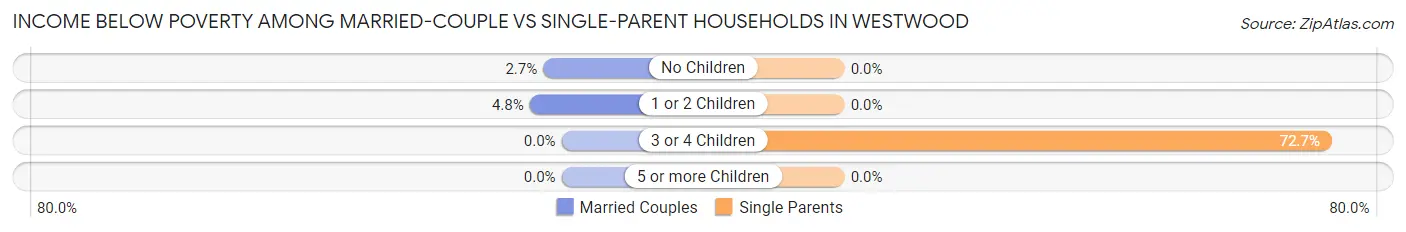
| Children | Married-Couple Families | Single-Parent Households |
| No Children | 2 (2.7%) | 0 (0.0%) |
| 1 or 2 Children | 2 (4.8%) | 0 (0.0%) |
| 3 or 4 Children | 0 (0.0%) | 8 (72.7%) |
| 5 or more Children | 0 (0.0%) | 0 (0.0%) |
| Total | 4 (3.2%) | 8 (29.6%) |
Race in Westwood
The most populous races in Westwood are White / Caucasian (423 | 85.3%), Two or more Races (42 | 8.5%), and Black / African American (30 | 6.0%).
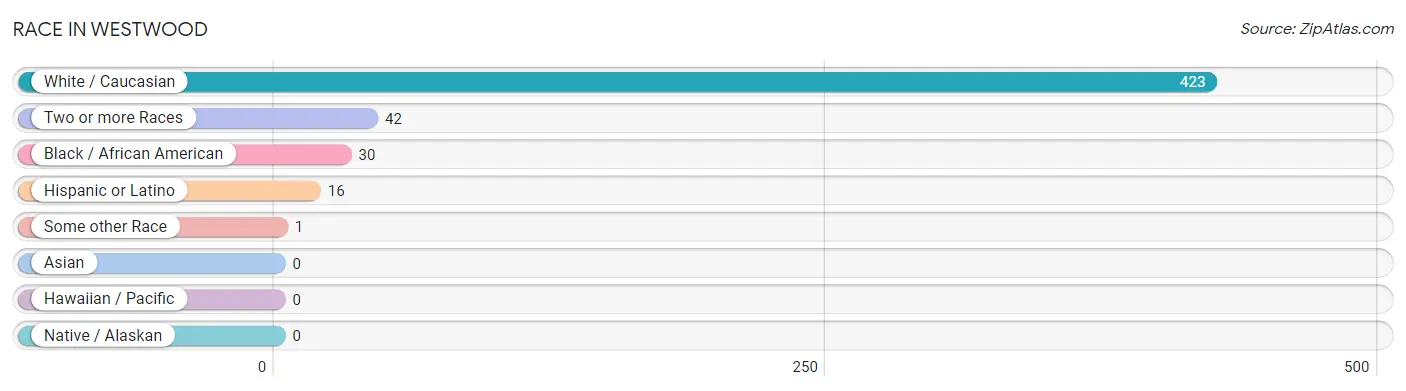
| Race | # Population | % Population |
| Asian | 0 | 0.0% |
| Black / African American | 30 | 6.0% |
| Hawaiian / Pacific | 0 | 0.0% |
| Hispanic or Latino | 16 | 3.2% |
| Native / Alaskan | 0 | 0.0% |
| White / Caucasian | 423 | 85.3% |
| Two or more Races | 42 | 8.5% |
| Some other Race | 1 | 0.2% |
| Total | 496 | 100.0% |
Ancestry in Westwood
The most populous ancestries reported in Westwood are German (169 | 34.1%), English (123 | 24.8%), American (37 | 7.5%), Polish (37 | 7.5%), and Irish (30 | 6.0%), together accounting for 79.8% of all Westwood residents.
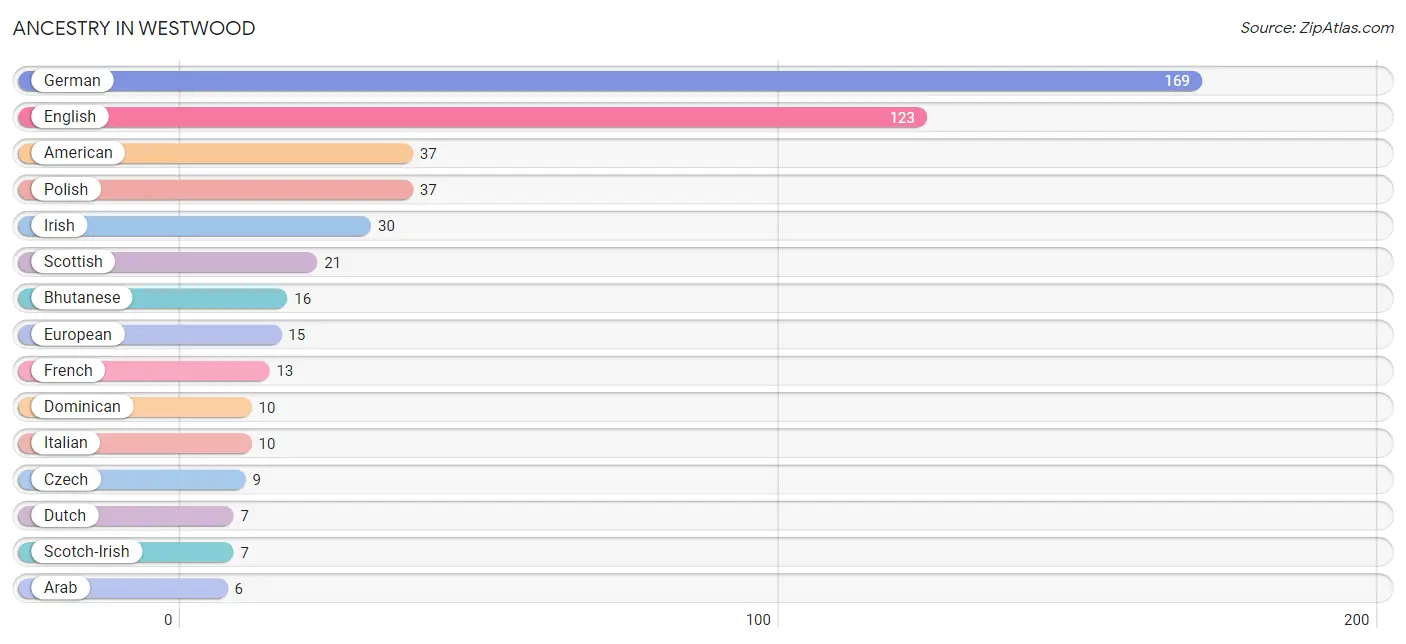
| Ancestry | # Population | % Population |
| African | 2 | 0.4% |
| American | 37 | 7.5% |
| Arab | 6 | 1.2% |
| Austrian | 2 | 0.4% |
| Bhutanese | 16 | 3.2% |
| British | 4 | 0.8% |
| Croatian | 2 | 0.4% |
| Cuban | 5 | 1.0% |
| Czech | 9 | 1.8% |
| Dominican | 10 | 2.0% |
| Dutch | 7 | 1.4% |
| Egyptian | 6 | 1.2% |
| English | 123 | 24.8% |
| European | 15 | 3.0% |
| Finnish | 2 | 0.4% |
| French | 13 | 2.6% |
| German | 169 | 34.1% |
| Hungarian | 5 | 1.0% |
| Irish | 30 | 6.0% |
| Italian | 10 | 2.0% |
| Korean | 4 | 0.8% |
| Mexican | 1 | 0.2% |
| Polish | 37 | 7.5% |
| Scotch-Irish | 7 | 1.4% |
| Scottish | 21 | 4.2% |
| Subsaharan African | 2 | 0.4% |
| Swiss | 4 | 0.8% |
| Welsh | 3 | 0.6% | View All 28 Rows |
Immigrants in Westwood
The most numerous immigrant groups reported in Westwood came from Caribbean (9 | 1.8%), Latin America (9 | 1.8%), Africa (8 | 1.6%), Egypt (6 | 1.2%), and Northern Africa (6 | 1.2%), together accounting for 7.6% of all Westwood residents.
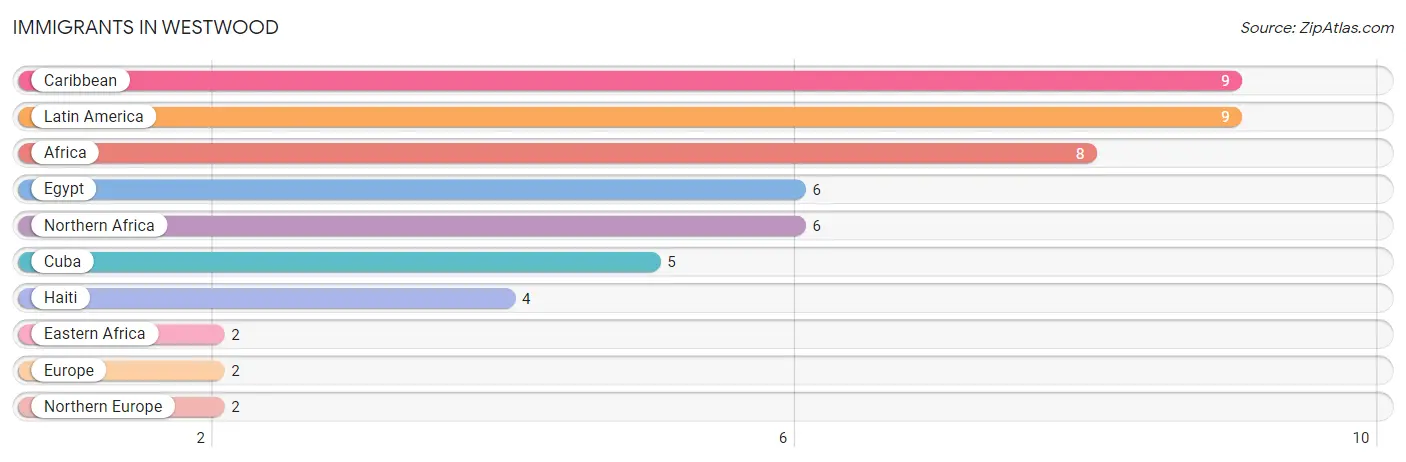
| Immigration Origin | # Population | % Population |
| Africa | 8 | 1.6% |
| Caribbean | 9 | 1.8% |
| Cuba | 5 | 1.0% |
| Eastern Africa | 2 | 0.4% |
| Egypt | 6 | 1.2% |
| Europe | 2 | 0.4% |
| Haiti | 4 | 0.8% |
| Latin America | 9 | 1.8% |
| Northern Africa | 6 | 1.2% |
| Northern Europe | 2 | 0.4% | View All 10 Rows |
Sex and Age in Westwood
Sex and Age in Westwood
The most populous age groups in Westwood are Under 5 Years (34 | 12.3%) for men and 10 to 14 Years (29 | 13.2%) for women.
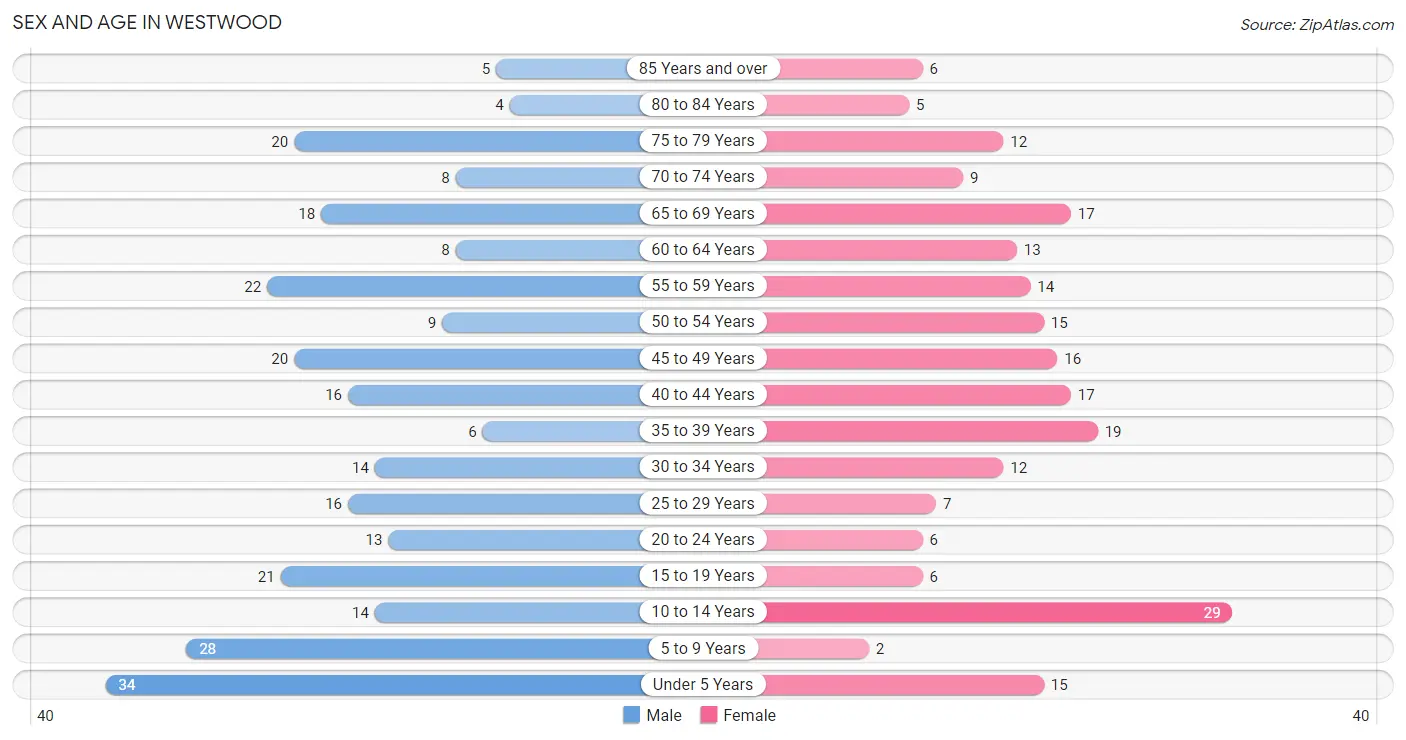
| Age Bracket | Male | Female |
| Under 5 Years | 34 (12.3%) | 15 (6.8%) |
| 5 to 9 Years | 28 (10.1%) | 2 (0.9%) |
| 10 to 14 Years | 14 (5.1%) | 29 (13.2%) |
| 15 to 19 Years | 21 (7.6%) | 6 (2.7%) |
| 20 to 24 Years | 13 (4.7%) | 6 (2.7%) |
| 25 to 29 Years | 16 (5.8%) | 7 (3.2%) |
| 30 to 34 Years | 14 (5.1%) | 12 (5.4%) |
| 35 to 39 Years | 6 (2.2%) | 19 (8.6%) |
| 40 to 44 Years | 16 (5.8%) | 17 (7.7%) |
| 45 to 49 Years | 20 (7.2%) | 16 (7.3%) |
| 50 to 54 Years | 9 (3.3%) | 15 (6.8%) |
| 55 to 59 Years | 22 (8.0%) | 14 (6.4%) |
| 60 to 64 Years | 8 (2.9%) | 13 (5.9%) |
| 65 to 69 Years | 18 (6.5%) | 17 (7.7%) |
| 70 to 74 Years | 8 (2.9%) | 9 (4.1%) |
| 75 to 79 Years | 20 (7.2%) | 12 (5.4%) |
| 80 to 84 Years | 4 (1.5%) | 5 (2.3%) |
| 85 Years and over | 5 (1.8%) | 6 (2.7%) |
| Total | 276 (100.0%) | 220 (100.0%) |
Families and Households in Westwood
Median Family Size in Westwood
The median family size in Westwood is 3.05 persons per family, with married-couple families (124 | 82.1%) accounting for the largest median family size of 3.11 persons per family. On the other hand, single male/father families (4 | 2.6%) represent the smallest median family size with 2.00 persons per family.
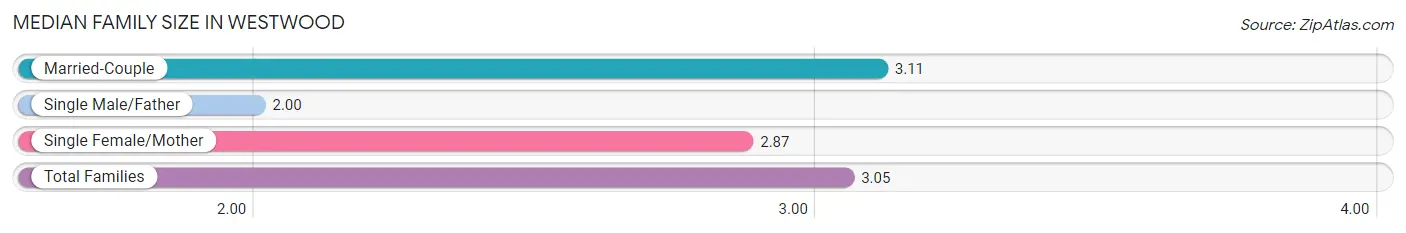
| Family Type | # Families | Family Size |
| Married-Couple | 124 (82.1%) | 3.11 |
| Single Male/Father | 4 (2.6%) | 2.00 |
| Single Female/Mother | 23 (15.2%) | 2.87 |
| Total Families | 151 (100.0%) | 3.05 |
Median Household Size in Westwood
The median household size in Westwood is 2.80 persons per household, with married-couple households (124 | 70.1%) accounting for the largest median household size of 3.11 persons per household. non-family households (26 | 14.7%) represent the smallest median household size with 1.27 persons per household.
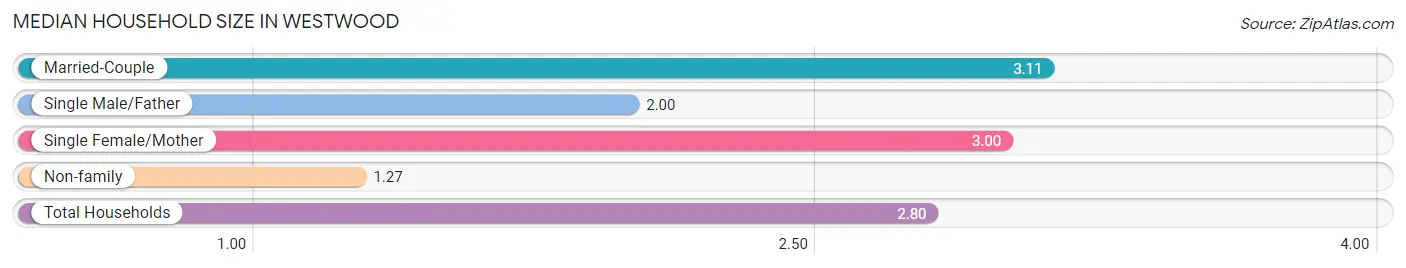
| Household Type | # Households | Household Size |
| Married-Couple | 124 (70.1%) | 3.11 |
| Single Male/Father | 4 (2.3%) | 2.00 |
| Single Female/Mother | 23 (13.0%) | 3.00 |
| Non-family | 26 (14.7%) | 1.27 |
| Total Households | 177 (100.0%) | 2.80 |
Household Size by Marriage Status in Westwood
Out of a total of 177 households in Westwood, 151 (85.3%) are family households, while 26 (14.7%) are nonfamily households. The most numerous type of family households are 2-person households, comprising 66, and the most common type of nonfamily households are 1-person households, comprising 24.
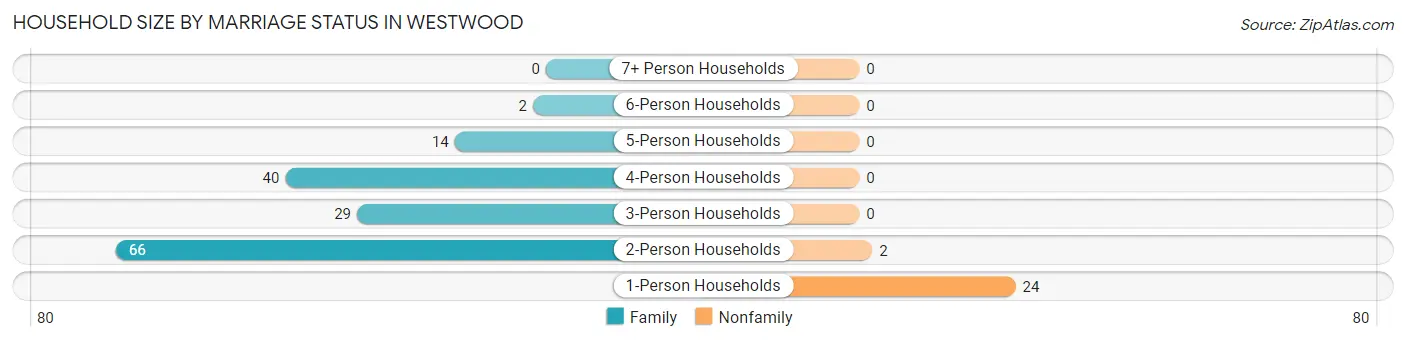
| Household Size | Family Households | Nonfamily Households |
| 1-Person Households | - | 24 (13.6%) |
| 2-Person Households | 66 (37.3%) | 2 (1.1%) |
| 3-Person Households | 29 (16.4%) | 0 (0.0%) |
| 4-Person Households | 40 (22.6%) | 0 (0.0%) |
| 5-Person Households | 14 (7.9%) | 0 (0.0%) |
| 6-Person Households | 2 (1.1%) | 0 (0.0%) |
| 7+ Person Households | 0 (0.0%) | 0 (0.0%) |
| Total | 151 (85.3%) | 26 (14.7%) |
Female Fertility in Westwood
Fertility by Age in Westwood
Average fertility rate in Westwood is 165.0 births per 1,000 women. Women in the age bracket of 20 to 34 years have the highest fertility rate with 480.0 births per 1,000 women. Women in the age bracket of 20 to 34 years acount for 85.7% of all women with births.
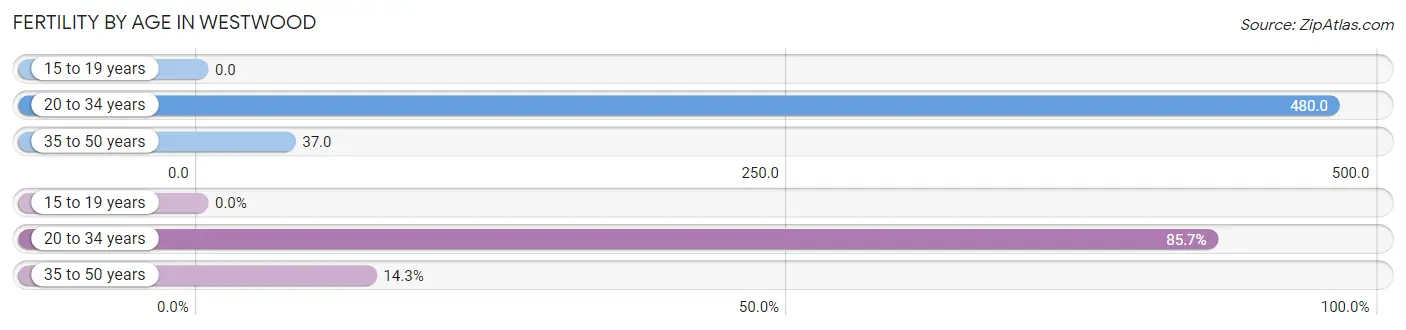
| Age Bracket | Women with Births | Births / 1,000 Women |
| 15 to 19 years | 0 (0.0%) | 0.0 |
| 20 to 34 years | 12 (85.7%) | 480.0 |
| 35 to 50 years | 2 (14.3%) | 37.0 |
| Total | 14 (100.0%) | 165.0 |
Fertility by Age by Marriage Status in Westwood
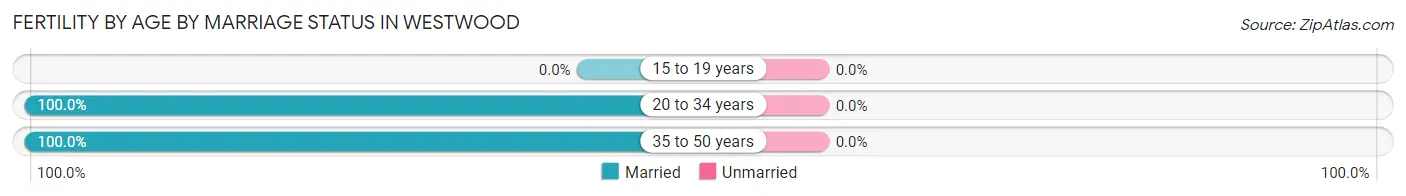
| Age Bracket | Married | Unmarried |
| 15 to 19 years | 0 (0.0%) | 0 (0.0%) |
| 20 to 34 years | 12 (100.0%) | 0 (0.0%) |
| 35 to 50 years | 2 (100.0%) | 0 (0.0%) |
| Total | 14 (100.0%) | 0 (0.0%) |
Fertility by Education in Westwood
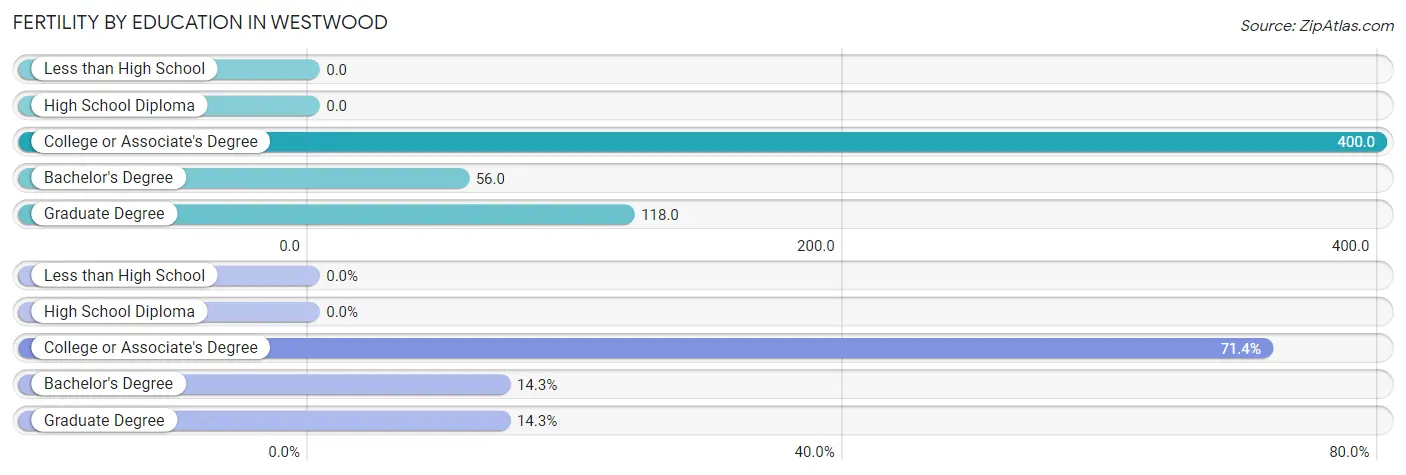
| Educational Attainment | Women with Births | Births / 1,000 Women |
| Less than High School | 0 (0.0%) | 0.0 |
| High School Diploma | 0 (0.0%) | 0.0 |
| College or Associate's Degree | 10 (71.4%) | 400.0 |
| Bachelor's Degree | 2 (14.3%) | 56.0 |
| Graduate Degree | 2 (14.3%) | 118.0 |
| Total | 14 (100.0%) | 165.0 |
Fertility by Education by Marriage Status in Westwood
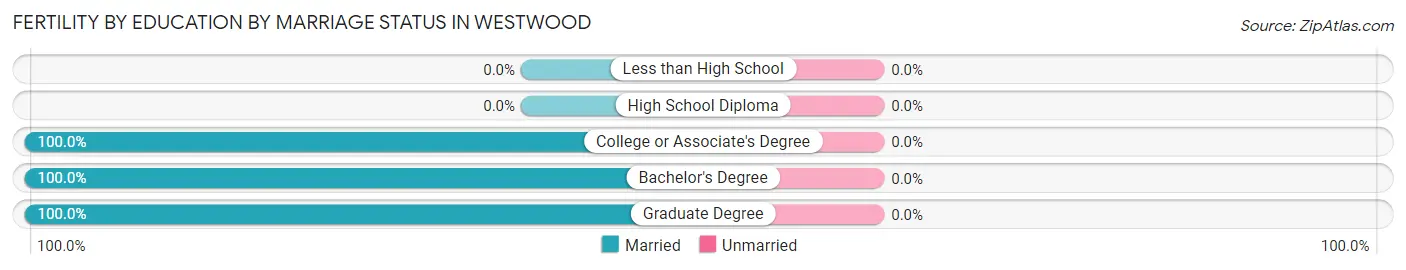
| Educational Attainment | Married | Unmarried |
| Less than High School | 0 (0.0%) | 0 (0.0%) |
| High School Diploma | 0 (0.0%) | 0 (0.0%) |
| College or Associate's Degree | 10 (100.0%) | 0 (0.0%) |
| Bachelor's Degree | 2 (100.0%) | 0 (0.0%) |
| Graduate Degree | 2 (100.0%) | 0 (0.0%) |
| Total | 14 (100.0%) | 0 (0.0%) |
Employment Characteristics in Westwood
Employment by Class of Employer in Westwood
Among the 253 employed individuals in Westwood, private company employees (163 | 64.4%), not-for-profit organizations (39 | 15.4%), and self-employed (not incorporated) (19 | 7.5%) make up the most common classes of employment.
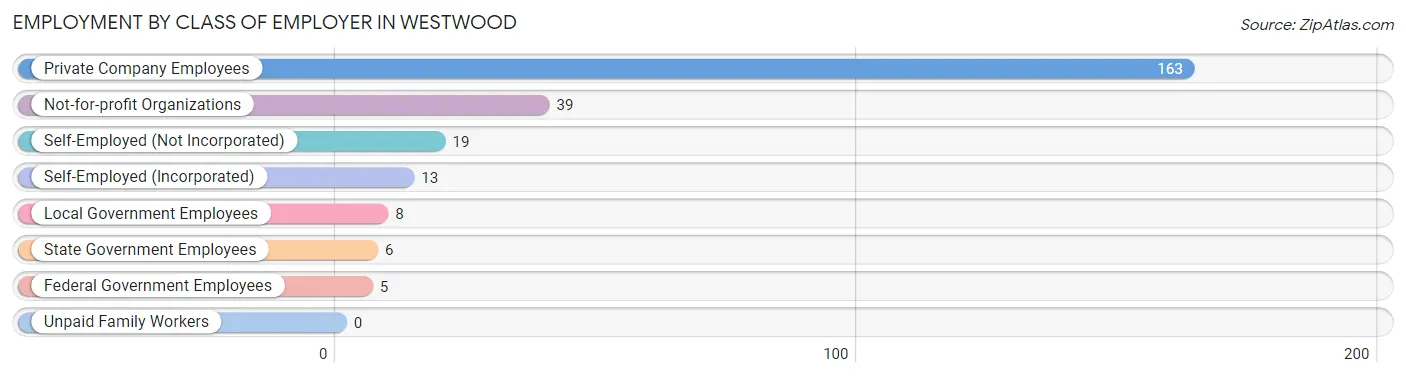
| Employer Class | # Employees | % Employees |
| Private Company Employees | 163 | 64.4% |
| Self-Employed (Incorporated) | 13 | 5.1% |
| Self-Employed (Not Incorporated) | 19 | 7.5% |
| Not-for-profit Organizations | 39 | 15.4% |
| Local Government Employees | 8 | 3.2% |
| State Government Employees | 6 | 2.4% |
| Federal Government Employees | 5 | 2.0% |
| Unpaid Family Workers | 0 | 0.0% |
| Total | 253 | 100.0% |
Employment Status by Age in Westwood
According to the labor force statistics for Westwood, out of the total population over 16 years of age (371), 70.4% or 261 individuals are in the labor force, with 1.5% or 4 of them unemployed. The age group with the highest labor force participation rate is 35 to 44 years, with 100.0% or 58 individuals in the labor force. Within the labor force, the 16 to 19 years age range has the highest percentage of unemployed individuals, with 23.5% or 4 of them being unemployed.
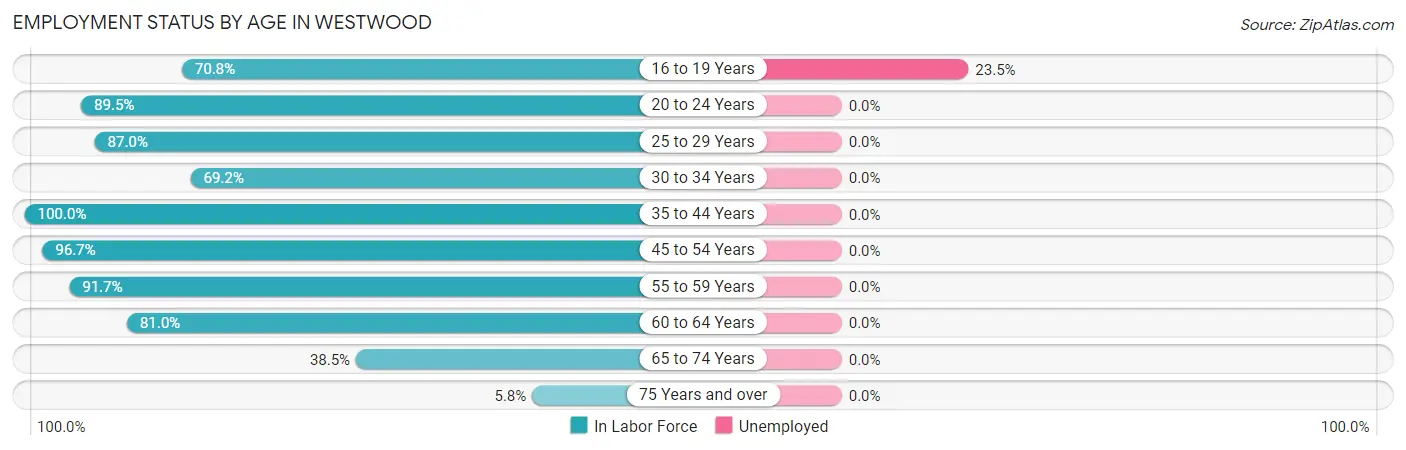
| Age Bracket | In Labor Force | Unemployed |
| 16 to 19 Years | 17 (70.8%) | 4 (23.5%) |
| 20 to 24 Years | 17 (89.5%) | 0 (0.0%) |
| 25 to 29 Years | 20 (87.0%) | 0 (0.0%) |
| 30 to 34 Years | 18 (69.2%) | 0 (0.0%) |
| 35 to 44 Years | 58 (100.0%) | 0 (0.0%) |
| 45 to 54 Years | 58 (96.7%) | 0 (0.0%) |
| 55 to 59 Years | 33 (91.7%) | 0 (0.0%) |
| 60 to 64 Years | 17 (81.0%) | 0 (0.0%) |
| 65 to 74 Years | 20 (38.5%) | 0 (0.0%) |
| 75 Years and over | 3 (5.8%) | 0 (0.0%) |
| Total | 261 (70.4%) | 4 (1.5%) |
Employment Status by Educational Attainment in Westwood
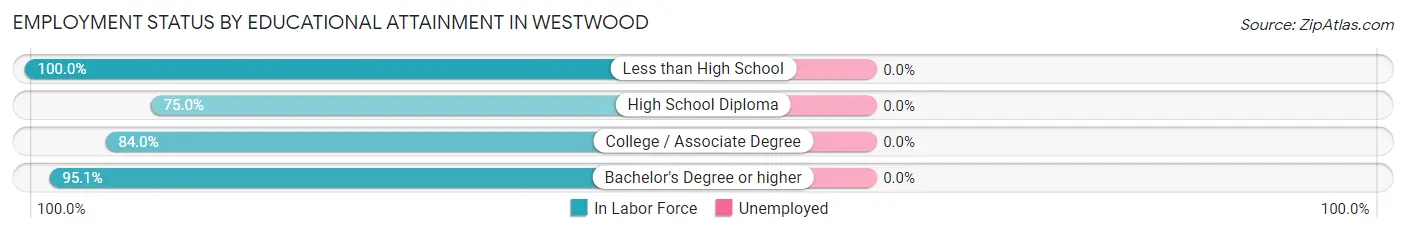
| Educational Attainment | In Labor Force | Unemployed |
| Less than High School | 1 (100.0%) | 0 (0.0%) |
| High School Diploma | 3 (75.0%) | 0 (0.0%) |
| College / Associate Degree | 63 (84.0%) | 0 (0.0%) |
| Bachelor's Degree or higher | 137 (95.1%) | 0 (0.0%) |
| Total | 204 (91.1%) | 0 (0.0%) |
Employment Occupations by Sex in Westwood
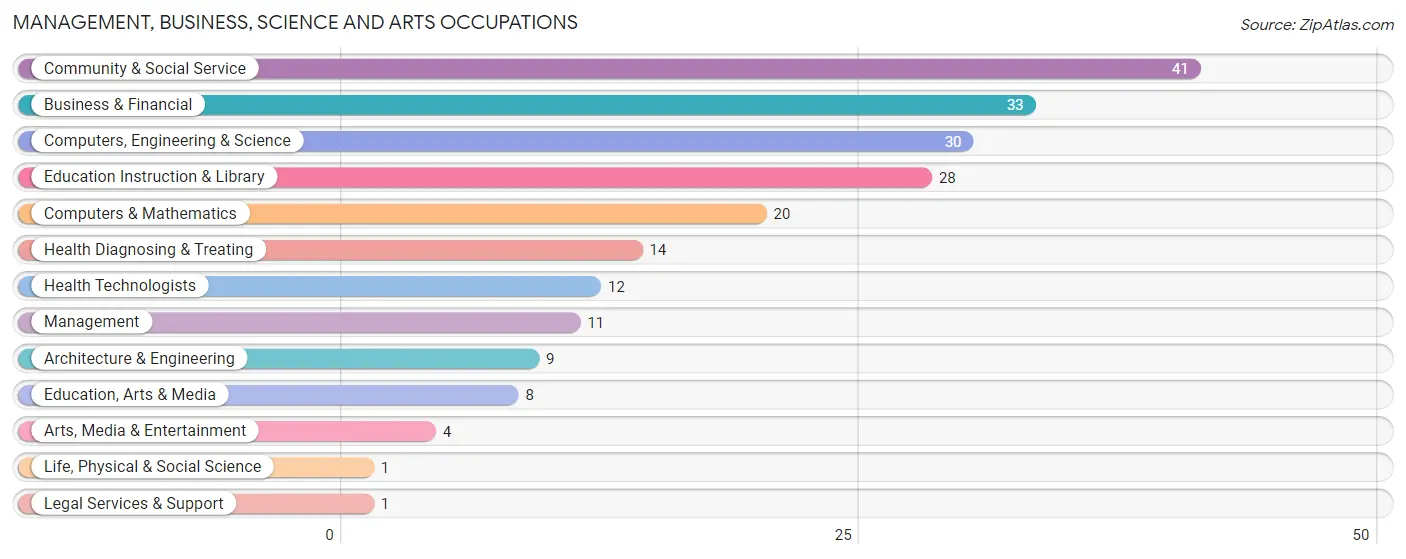
Management, Business, Science and Arts Occupations
The most common Management, Business, Science and Arts occupations in Westwood are Community & Social Service (41 | 16.0%), Business & Financial (33 | 12.8%), Computers, Engineering & Science (30 | 11.7%), Education Instruction & Library (28 | 10.9%), and Computers & Mathematics (20 | 7.8%).
Management, Business, Science and Arts Occupations by Sex
Within the Management, Business, Science and Arts occupations in Westwood, the most male-oriented occupations are Architecture & Engineering (100.0%), Life, Physical & Social Science (100.0%), and Legal Services & Support (100.0%), while the most female-oriented occupations are Education Instruction & Library (85.7%), Health Diagnosing & Treating (85.7%), and Health Technologists (83.3%).
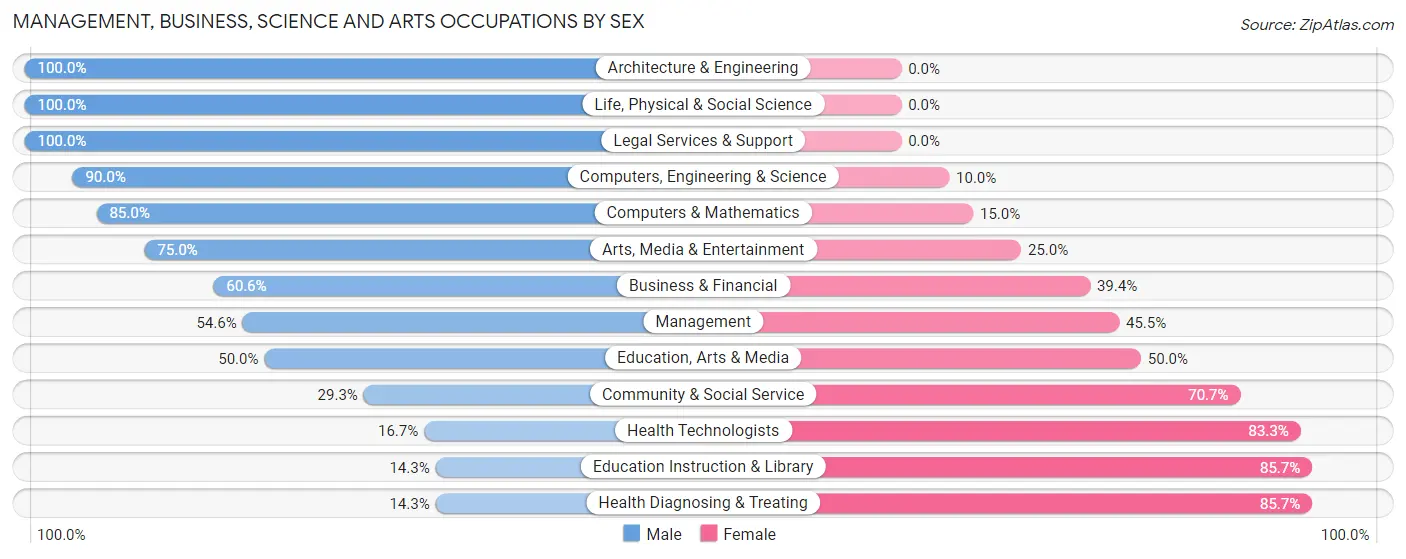
| Occupation | Male | Female |
| Management | 6 (54.5%) | 5 (45.5%) |
| Business & Financial | 20 (60.6%) | 13 (39.4%) |
| Computers, Engineering & Science | 27 (90.0%) | 3 (10.0%) |
| Computers & Mathematics | 17 (85.0%) | 3 (15.0%) |
| Architecture & Engineering | 9 (100.0%) | 0 (0.0%) |
| Life, Physical & Social Science | 1 (100.0%) | 0 (0.0%) |
| Community & Social Service | 12 (29.3%) | 29 (70.7%) |
| Education, Arts & Media | 4 (50.0%) | 4 (50.0%) |
| Legal Services & Support | 1 (100.0%) | 0 (0.0%) |
| Education Instruction & Library | 4 (14.3%) | 24 (85.7%) |
| Arts, Media & Entertainment | 3 (75.0%) | 1 (25.0%) |
| Health Diagnosing & Treating | 2 (14.3%) | 12 (85.7%) |
| Health Technologists | 2 (16.7%) | 10 (83.3%) |
| Total (Category) | 67 (51.9%) | 62 (48.1%) |
| Total (Overall) | 140 (54.5%) | 117 (45.5%) |
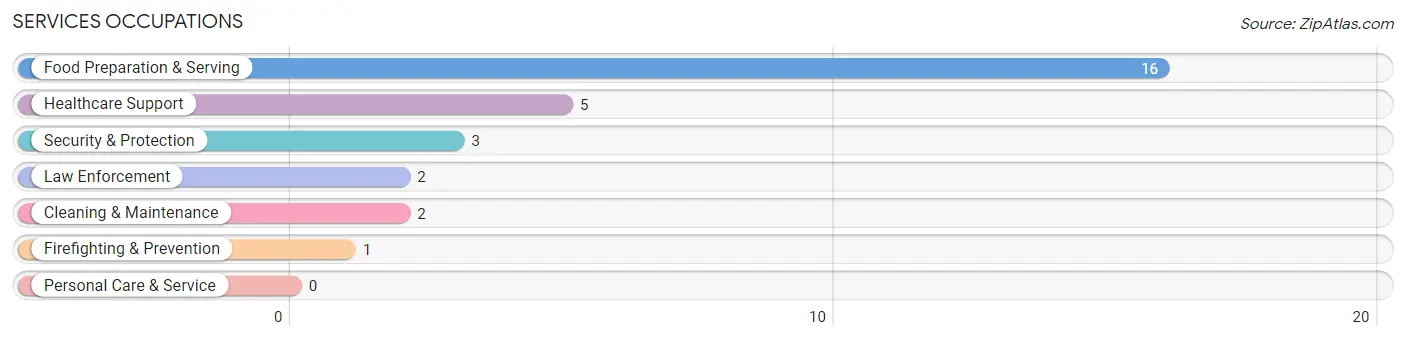
Services Occupations
The most common Services occupations in Westwood are Food Preparation & Serving (16 | 6.2%), Healthcare Support (5 | 1.9%), Security & Protection (3 | 1.2%), Law Enforcement (2 | 0.8%), and Cleaning & Maintenance (2 | 0.8%).
Services Occupations by Sex
Within the Services occupations in Westwood, the most male-oriented occupations are Security & Protection (100.0%), Firefighting & Prevention (100.0%), and Law Enforcement (100.0%), while the most female-oriented occupations are Healthcare Support (100.0%), Cleaning & Maintenance (100.0%), and Food Preparation & Serving (12.5%).
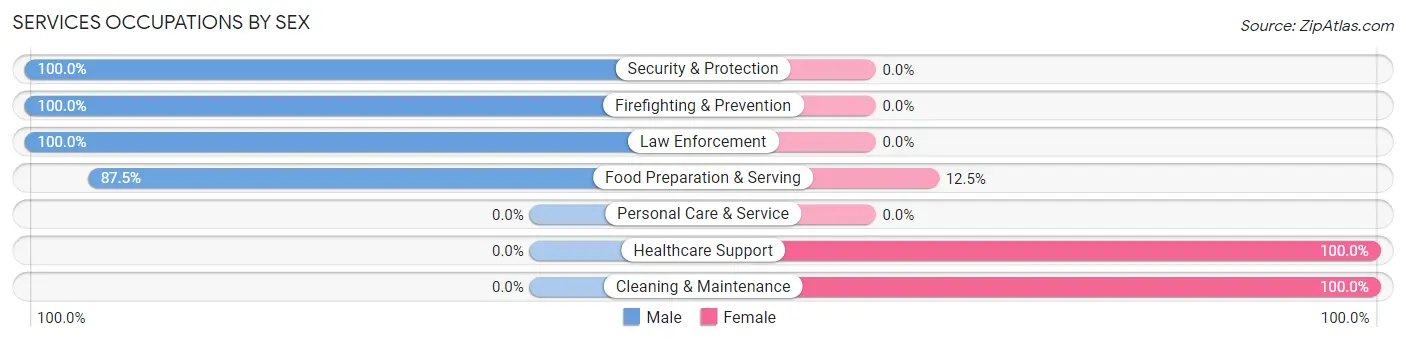
| Occupation | Male | Female |
| Healthcare Support | 0 (0.0%) | 5 (100.0%) |
| Security & Protection | 3 (100.0%) | 0 (0.0%) |
| Firefighting & Prevention | 1 (100.0%) | 0 (0.0%) |
| Law Enforcement | 2 (100.0%) | 0 (0.0%) |
| Food Preparation & Serving | 14 (87.5%) | 2 (12.5%) |
| Cleaning & Maintenance | 0 (0.0%) | 2 (100.0%) |
| Personal Care & Service | 0 (0.0%) | 0 (0.0%) |
| Total (Category) | 17 (65.4%) | 9 (34.6%) |
| Total (Overall) | 140 (54.5%) | 117 (45.5%) |
Sales and Office Occupations
The most common Sales and Office occupations in Westwood are Office & Administration (41 | 16.0%), and Sales & Related (29 | 11.3%).
Sales and Office Occupations by Sex
| Occupation | Male | Female |
| Sales & Related | 21 (72.4%) | 8 (27.6%) |
| Office & Administration | 9 (22.0%) | 32 (78.0%) |
| Total (Category) | 30 (42.9%) | 40 (57.1%) |
| Total (Overall) | 140 (54.5%) | 117 (45.5%) |
Natural Resources, Construction and Maintenance Occupations
Natural Resources, Construction and Maintenance Occupations by Sex
| Occupation | Male | Female |
| Farming, Fishing & Forestry | 0 (0.0%) | 0 (0.0%) |
| Construction & Extraction | 0 (0.0%) | 0 (0.0%) |
| Installation, Maintenance & Repair | 0 (0.0%) | 0 (0.0%) |
| Total (Category) | 0 (0.0%) | 0 (0.0%) |
| Total (Overall) | 140 (54.5%) | 117 (45.5%) |
Production, Transportation and Moving Occupations
The most common Production, Transportation and Moving occupations in Westwood are Production (20 | 7.8%), Material Moving (8 | 3.1%), and Transportation (4 | 1.6%).
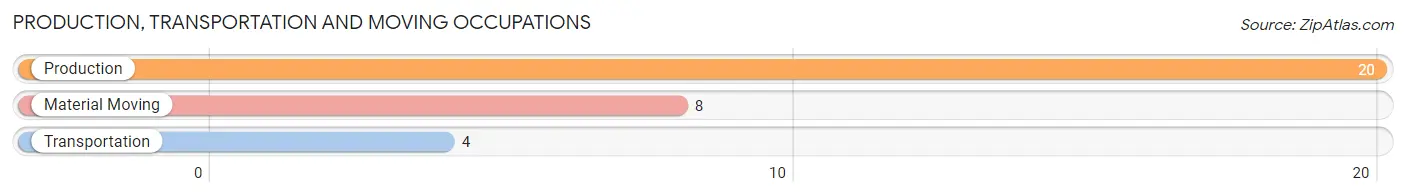
Production, Transportation and Moving Occupations by Sex
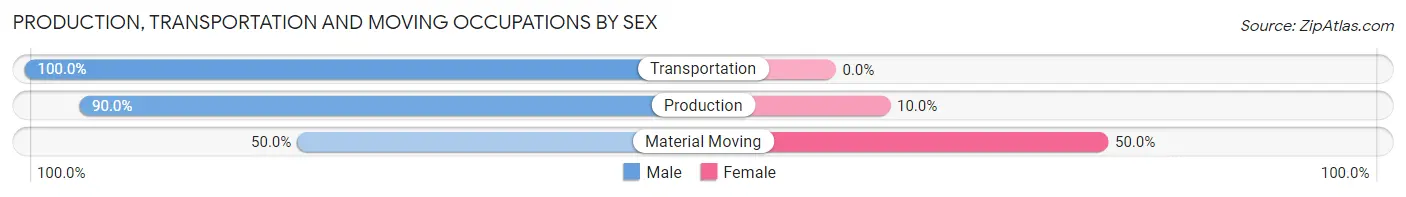
| Occupation | Male | Female |
| Production | 18 (90.0%) | 2 (10.0%) |
| Transportation | 4 (100.0%) | 0 (0.0%) |
| Material Moving | 4 (50.0%) | 4 (50.0%) |
| Total (Category) | 26 (81.2%) | 6 (18.8%) |
| Total (Overall) | 140 (54.5%) | 117 (45.5%) |
Employment Industries by Sex in Westwood
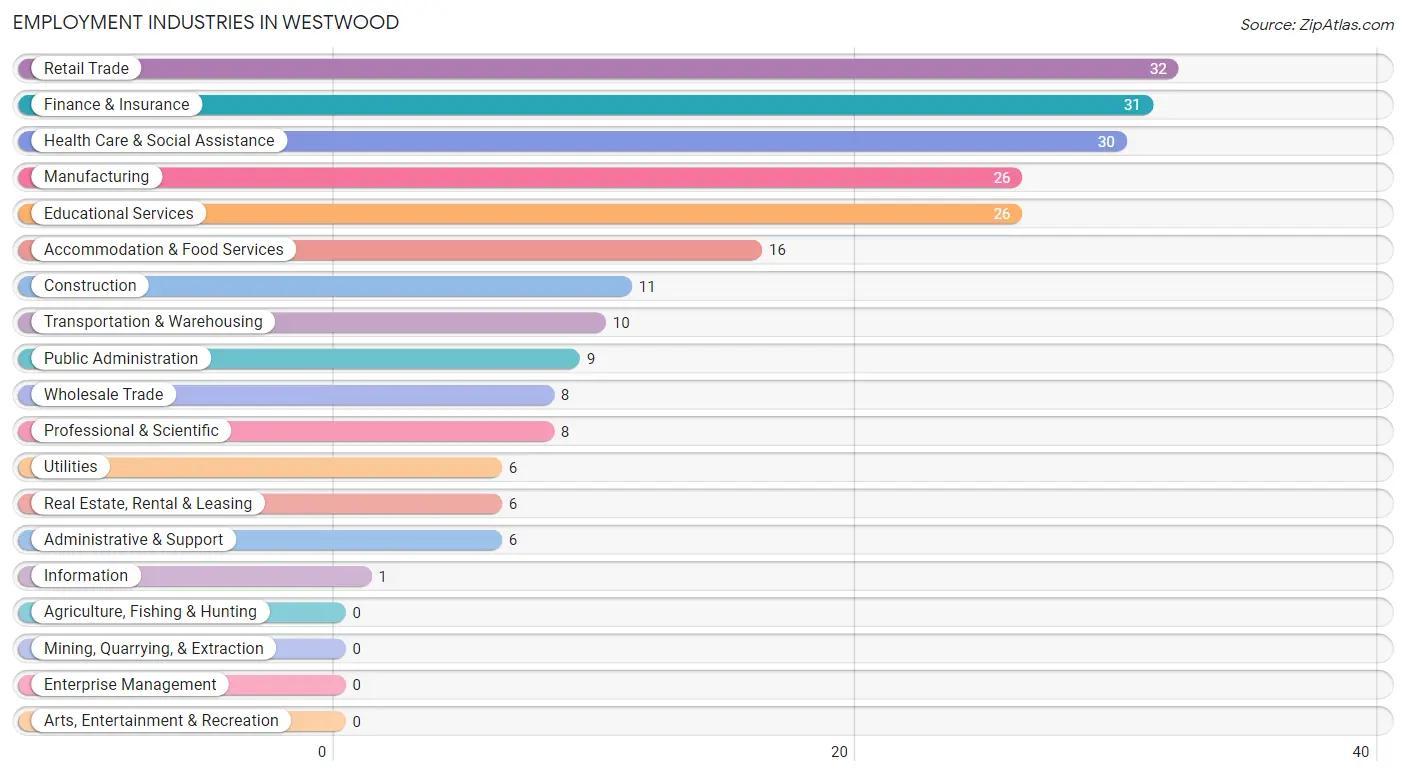
Employment Industries in Westwood
The major employment industries in Westwood include Retail Trade (32 | 12.4%), Finance & Insurance (31 | 12.1%), Health Care & Social Assistance (30 | 11.7%), Manufacturing (26 | 10.1%), and Educational Services (26 | 10.1%).
Employment Industries by Sex in Westwood
The Westwood industries that see more men than women are Wholesale Trade (100.0%), Information (100.0%), and Accommodation & Food Services (93.8%), whereas the industries that tend to have a higher number of women are Educational Services (92.3%), Health Care & Social Assistance (83.3%), and Professional & Scientific (75.0%).
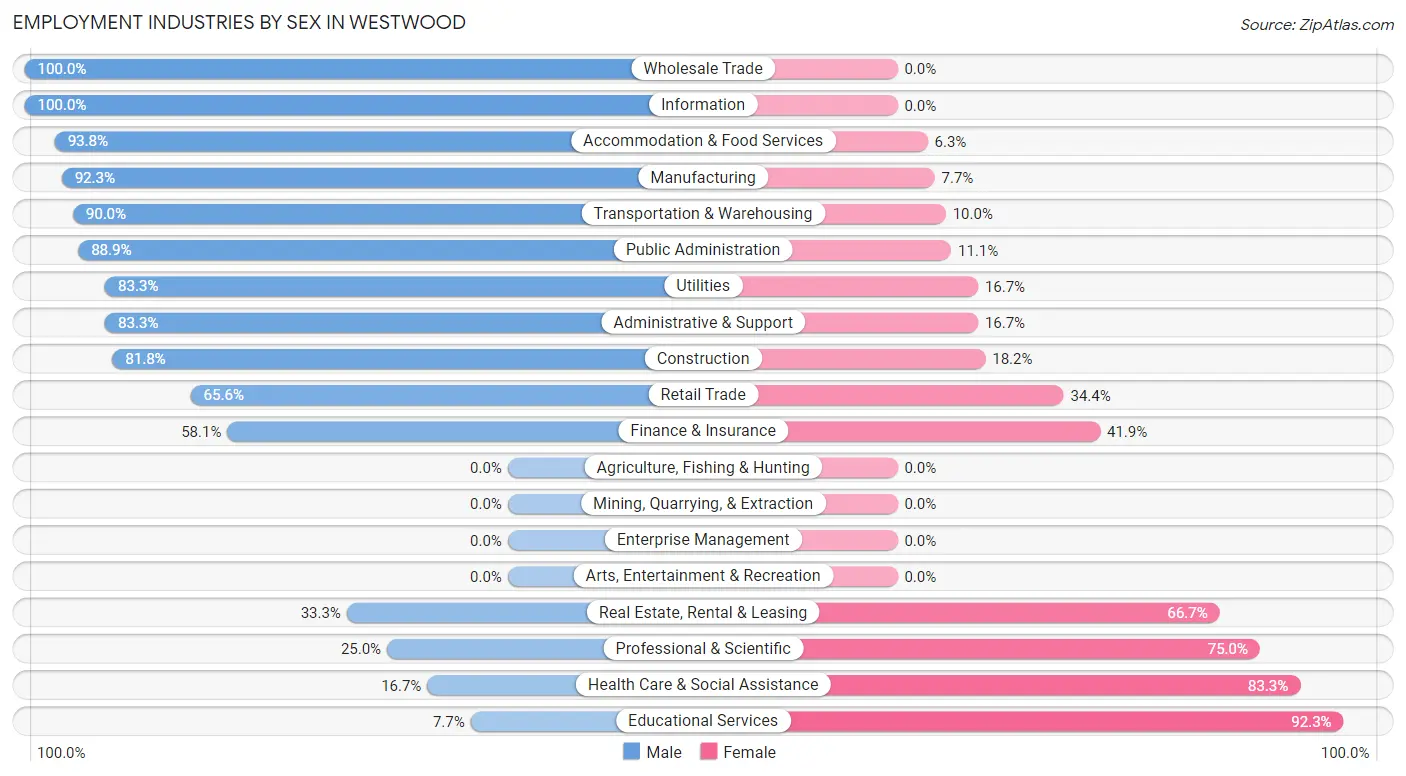
| Industry | Male | Female |
| Agriculture, Fishing & Hunting | 0 (0.0%) | 0 (0.0%) |
| Mining, Quarrying, & Extraction | 0 (0.0%) | 0 (0.0%) |
| Construction | 9 (81.8%) | 2 (18.2%) |
| Manufacturing | 24 (92.3%) | 2 (7.7%) |
| Wholesale Trade | 8 (100.0%) | 0 (0.0%) |
| Retail Trade | 21 (65.6%) | 11 (34.4%) |
| Transportation & Warehousing | 9 (90.0%) | 1 (10.0%) |
| Utilities | 5 (83.3%) | 1 (16.7%) |
| Information | 1 (100.0%) | 0 (0.0%) |
| Finance & Insurance | 18 (58.1%) | 13 (41.9%) |
| Real Estate, Rental & Leasing | 2 (33.3%) | 4 (66.7%) |
| Professional & Scientific | 2 (25.0%) | 6 (75.0%) |
| Enterprise Management | 0 (0.0%) | 0 (0.0%) |
| Administrative & Support | 5 (83.3%) | 1 (16.7%) |
| Educational Services | 2 (7.7%) | 24 (92.3%) |
| Health Care & Social Assistance | 5 (16.7%) | 25 (83.3%) |
| Arts, Entertainment & Recreation | 0 (0.0%) | 0 (0.0%) |
| Accommodation & Food Services | 15 (93.8%) | 1 (6.2%) |
| Public Administration | 8 (88.9%) | 1 (11.1%) |
| Total | 140 (54.5%) | 117 (45.5%) |
Education in Westwood
School Enrollment in Westwood
The most common levels of schooling among the 128 students in Westwood are middle school (43 | 33.6%), elementary school (28 | 21.9%), and high school (24 | 18.8%).
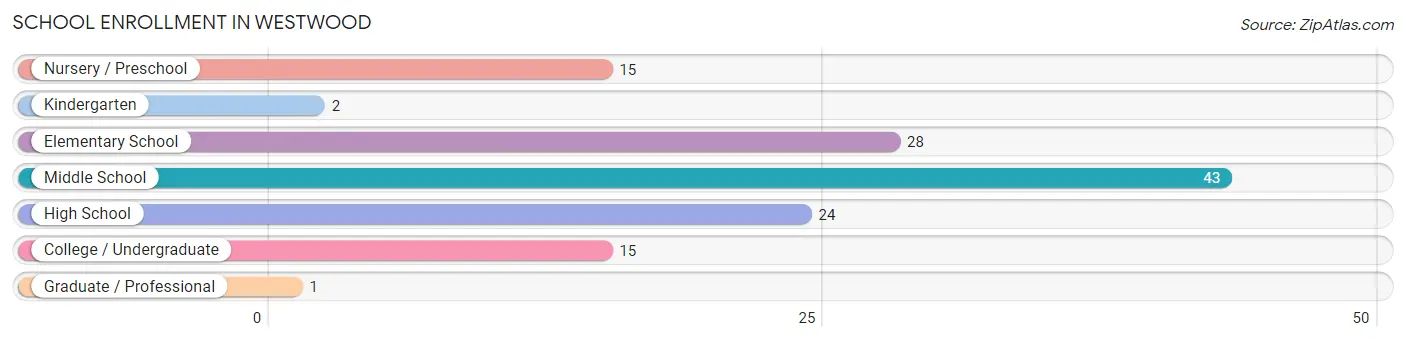
| School Level | # Students | % Students |
| Nursery / Preschool | 15 | 11.7% |
| Kindergarten | 2 | 1.6% |
| Elementary School | 28 | 21.9% |
| Middle School | 43 | 33.6% |
| High School | 24 | 18.8% |
| College / Undergraduate | 15 | 11.7% |
| Graduate / Professional | 1 | 0.8% |
| Total | 128 | 100.0% |
School Enrollment by Age by Funding Source in Westwood
Out of a total of 128 students who are enrolled in schools in Westwood, 67 (52.3%) attend a private institution, while the remaining 61 (47.7%) are enrolled in public schools. The age group of 35 years and over has the highest likelihood of being enrolled in private schools, with 4 (80.0% in the age bracket) enrolled. Conversely, the age group of 18 to 19 year olds has the lowest likelihood of being enrolled in a private school, with 10 (100.0% in the age bracket) attending a public institution.
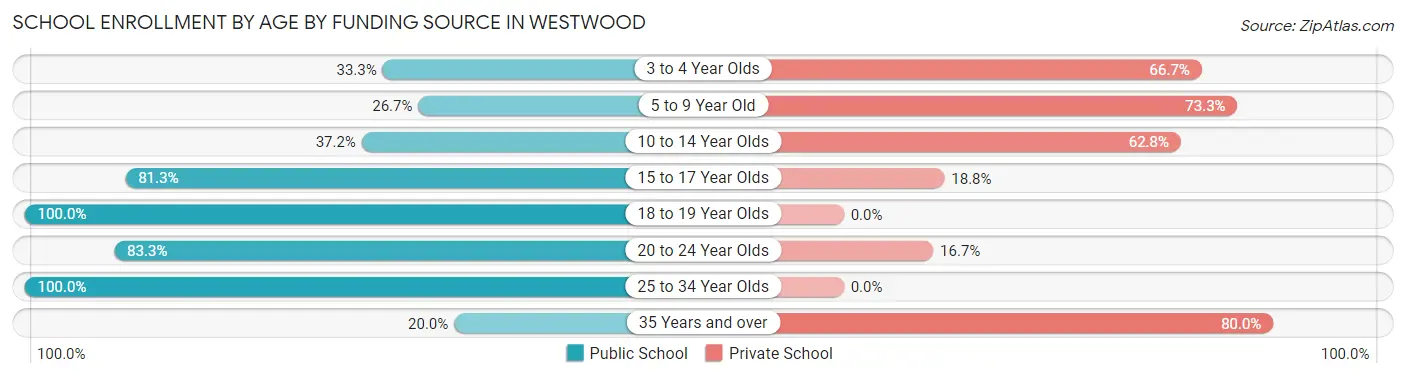
| Age Bracket | Public School | Private School |
| 3 to 4 Year Olds | 5 (33.3%) | 10 (66.7%) |
| 5 to 9 Year Old | 8 (26.7%) | 22 (73.3%) |
| 10 to 14 Year Olds | 16 (37.2%) | 27 (62.8%) |
| 15 to 17 Year Olds | 13 (81.2%) | 3 (18.8%) |
| 18 to 19 Year Olds | 10 (100.0%) | 0 (0.0%) |
| 20 to 24 Year Olds | 5 (83.3%) | 1 (16.7%) |
| 25 to 34 Year Olds | 3 (100.0%) | 0 (0.0%) |
| 35 Years and over | 1 (20.0%) | 4 (80.0%) |
| Total | 61 (47.7%) | 67 (52.3%) |
Educational Attainment by Field of Study in Westwood
Business (34 | 15.8%), communications (24 | 11.2%), bio, nature & agricultural (18 | 8.4%), education (17 | 7.9%), and science & technology (16 | 7.4%) are the most common fields of study among 215 individuals in Westwood who have obtained a bachelor's degree or higher.
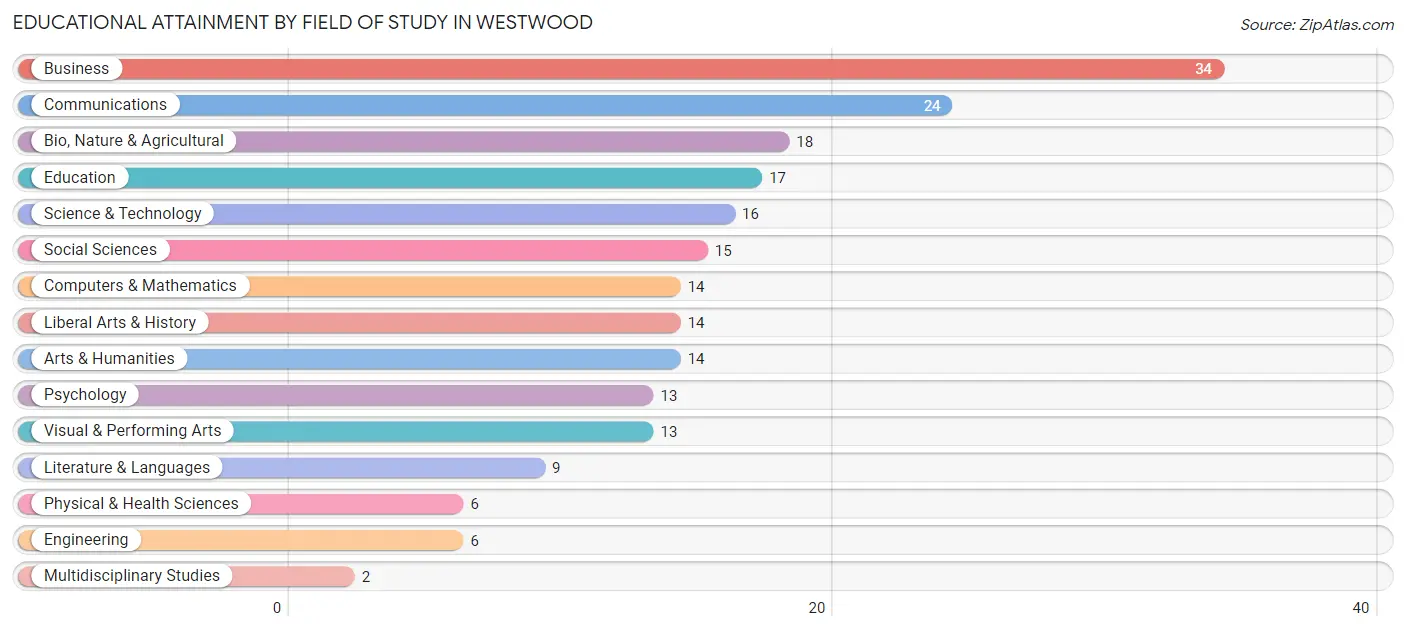
| Field of Study | # Graduates | % Graduates |
| Computers & Mathematics | 14 | 6.5% |
| Bio, Nature & Agricultural | 18 | 8.4% |
| Physical & Health Sciences | 6 | 2.8% |
| Psychology | 13 | 6.0% |
| Social Sciences | 15 | 7.0% |
| Engineering | 6 | 2.8% |
| Multidisciplinary Studies | 2 | 0.9% |
| Science & Technology | 16 | 7.4% |
| Business | 34 | 15.8% |
| Education | 17 | 7.9% |
| Literature & Languages | 9 | 4.2% |
| Liberal Arts & History | 14 | 6.5% |
| Visual & Performing Arts | 13 | 6.0% |
| Communications | 24 | 11.2% |
| Arts & Humanities | 14 | 6.5% |
| Total | 215 | 100.0% |
Transportation & Commute in Westwood
Vehicle Availability by Sex in Westwood
The most prevalent vehicle ownership categories in Westwood are males with 2 vehicles (62, accounting for 44.6%) and females with 2 vehicles (65, making up 54.4%).
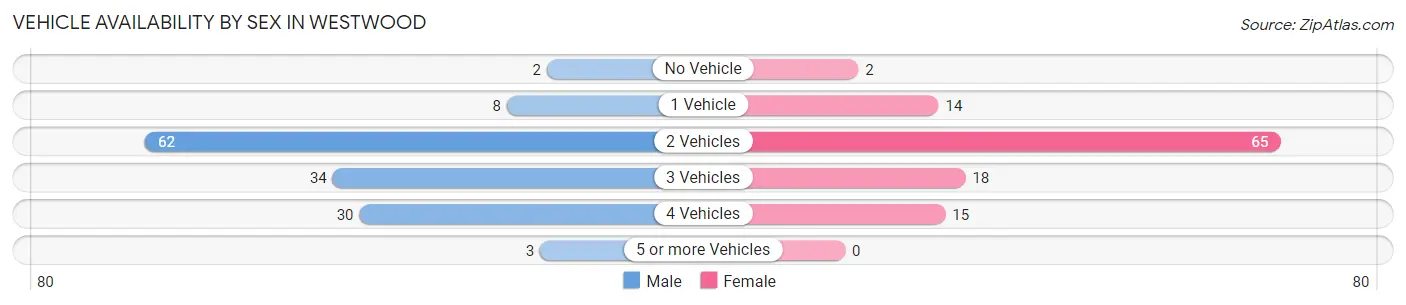
| Vehicles Available | Male | Female |
| No Vehicle | 2 (1.4%) | 2 (1.8%) |
| 1 Vehicle | 8 (5.8%) | 14 (12.3%) |
| 2 Vehicles | 62 (44.6%) | 65 (57.0%) |
| 3 Vehicles | 34 (24.5%) | 18 (15.8%) |
| 4 Vehicles | 30 (21.6%) | 15 (13.2%) |
| 5 or more Vehicles | 3 (2.2%) | 0 (0.0%) |
| Total | 139 (100.0%) | 114 (100.0%) |
Commute Time in Westwood
The most frequently occuring commute durations in Westwood are 15 to 19 minutes (64 commuters, 28.0%), 20 to 24 minutes (56 commuters, 24.4%), and 10 to 14 minutes (34 commuters, 14.8%).
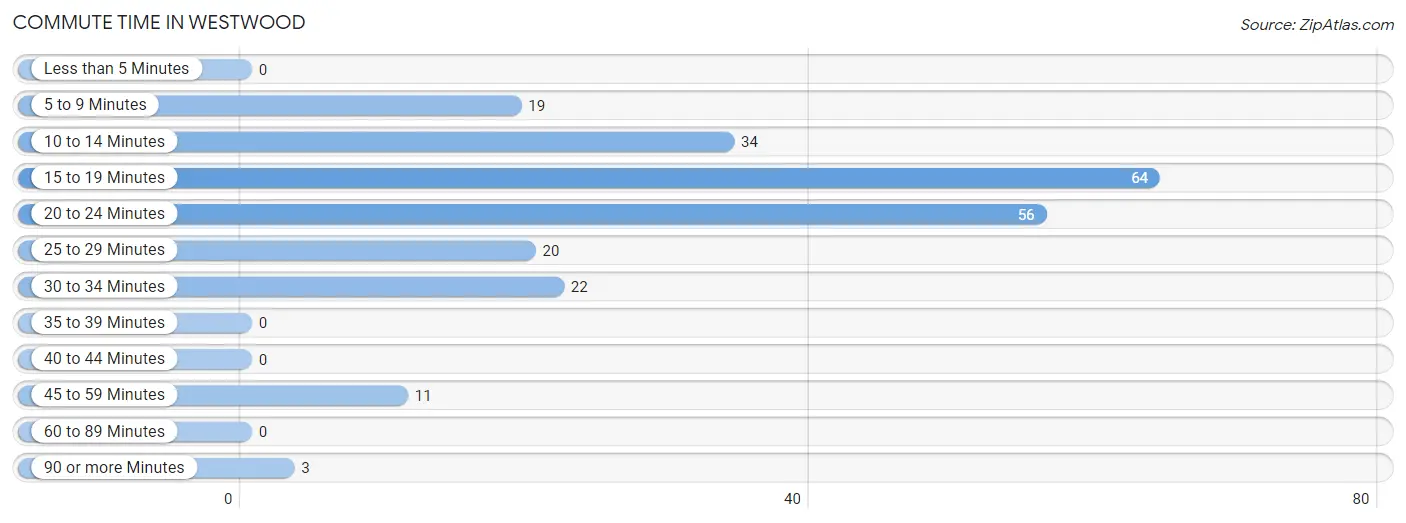
| Commute Time | # Commuters | % Commuters |
| Less than 5 Minutes | 0 | 0.0% |
| 5 to 9 Minutes | 19 | 8.3% |
| 10 to 14 Minutes | 34 | 14.8% |
| 15 to 19 Minutes | 64 | 28.0% |
| 20 to 24 Minutes | 56 | 24.4% |
| 25 to 29 Minutes | 20 | 8.7% |
| 30 to 34 Minutes | 22 | 9.6% |
| 35 to 39 Minutes | 0 | 0.0% |
| 40 to 44 Minutes | 0 | 0.0% |
| 45 to 59 Minutes | 11 | 4.8% |
| 60 to 89 Minutes | 0 | 0.0% |
| 90 or more Minutes | 3 | 1.3% |
Commute Time by Sex in Westwood
The most common commute times in Westwood are 20 to 24 minutes (44 commuters, 34.4%) for males and 15 to 19 minutes (32 commuters, 31.7%) for females.
| Commute Time | Male | Female |
| Less than 5 Minutes | 0 (0.0%) | 0 (0.0%) |
| 5 to 9 Minutes | 2 (1.6%) | 17 (16.8%) |
| 10 to 14 Minutes | 14 (10.9%) | 20 (19.8%) |
| 15 to 19 Minutes | 32 (25.0%) | 32 (31.7%) |
| 20 to 24 Minutes | 44 (34.4%) | 12 (11.9%) |
| 25 to 29 Minutes | 16 (12.5%) | 4 (4.0%) |
| 30 to 34 Minutes | 11 (8.6%) | 11 (10.9%) |
| 35 to 39 Minutes | 0 (0.0%) | 0 (0.0%) |
| 40 to 44 Minutes | 0 (0.0%) | 0 (0.0%) |
| 45 to 59 Minutes | 7 (5.5%) | 4 (4.0%) |
| 60 to 89 Minutes | 0 (0.0%) | 0 (0.0%) |
| 90 or more Minutes | 2 (1.6%) | 1 (1.0%) |
Time of Departure to Work by Sex in Westwood
The most frequent times of departure to work in Westwood are 7:00 AM to 7:29 AM (31, 24.2%) for males and 8:00 AM to 8:29 AM (26, 25.7%) for females.
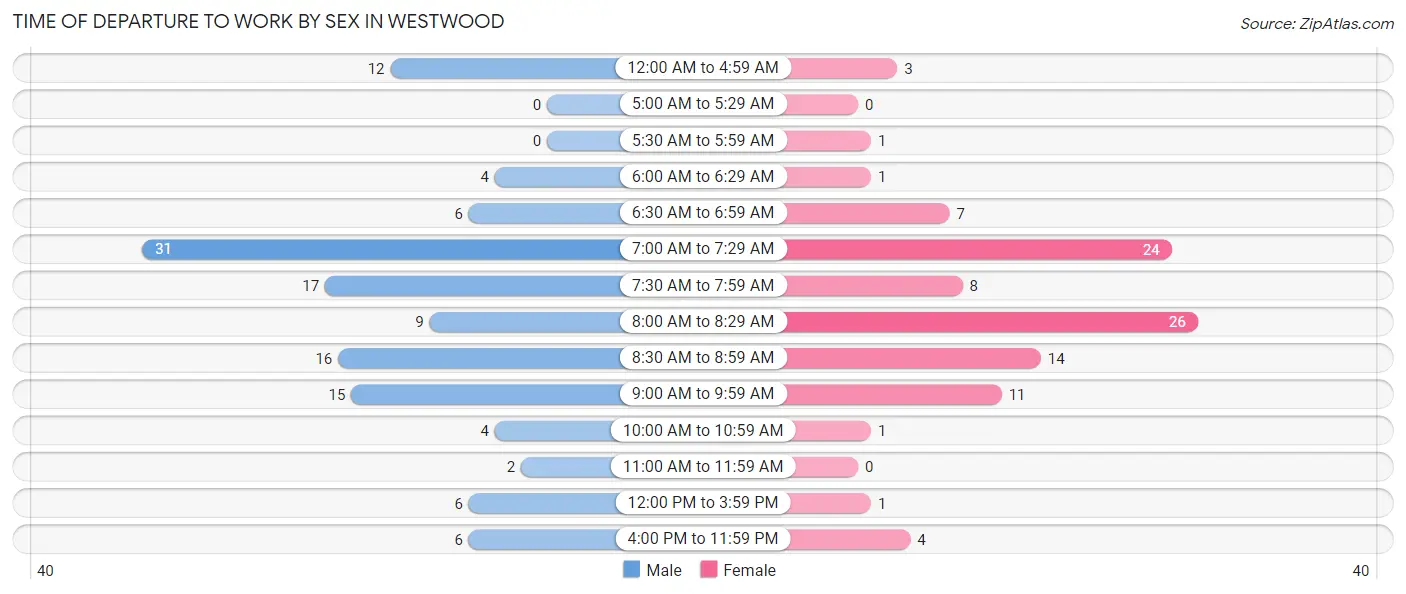
| Time of Departure | Male | Female |
| 12:00 AM to 4:59 AM | 12 (9.4%) | 3 (3.0%) |
| 5:00 AM to 5:29 AM | 0 (0.0%) | 0 (0.0%) |
| 5:30 AM to 5:59 AM | 0 (0.0%) | 1 (1.0%) |
| 6:00 AM to 6:29 AM | 4 (3.1%) | 1 (1.0%) |
| 6:30 AM to 6:59 AM | 6 (4.7%) | 7 (6.9%) |
| 7:00 AM to 7:29 AM | 31 (24.2%) | 24 (23.8%) |
| 7:30 AM to 7:59 AM | 17 (13.3%) | 8 (7.9%) |
| 8:00 AM to 8:29 AM | 9 (7.0%) | 26 (25.7%) |
| 8:30 AM to 8:59 AM | 16 (12.5%) | 14 (13.9%) |
| 9:00 AM to 9:59 AM | 15 (11.7%) | 11 (10.9%) |
| 10:00 AM to 10:59 AM | 4 (3.1%) | 1 (1.0%) |
| 11:00 AM to 11:59 AM | 2 (1.6%) | 0 (0.0%) |
| 12:00 PM to 3:59 PM | 6 (4.7%) | 1 (1.0%) |
| 4:00 PM to 11:59 PM | 6 (4.7%) | 4 (4.0%) |
| Total | 128 (100.0%) | 101 (100.0%) |
Housing Occupancy in Westwood
Occupancy by Ownership in Westwood
Of the total 177 dwellings in Westwood, owner-occupied units account for 169 (95.5%), while renter-occupied units make up 8 (4.5%).
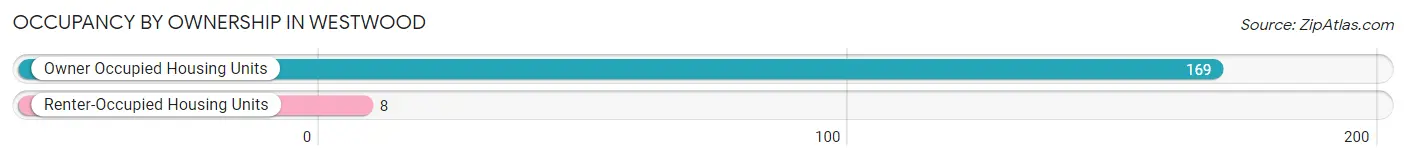
| Occupancy | # Housing Units | % Housing Units |
| Owner Occupied Housing Units | 169 | 95.5% |
| Renter-Occupied Housing Units | 8 | 4.5% |
| Total Occupied Housing Units | 177 | 100.0% |
Occupancy by Household Size in Westwood
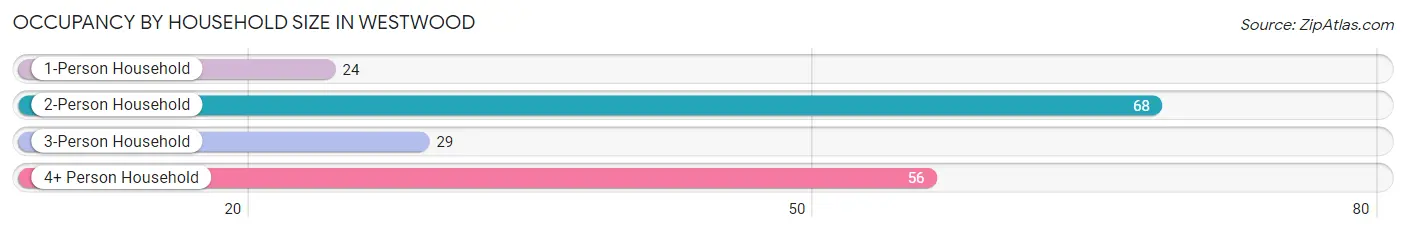
| Household Size | # Housing Units | % Housing Units |
| 1-Person Household | 24 | 13.6% |
| 2-Person Household | 68 | 38.4% |
| 3-Person Household | 29 | 16.4% |
| 4+ Person Household | 56 | 31.6% |
| Total Housing Units | 177 | 100.0% |
Occupancy by Ownership by Household Size in Westwood
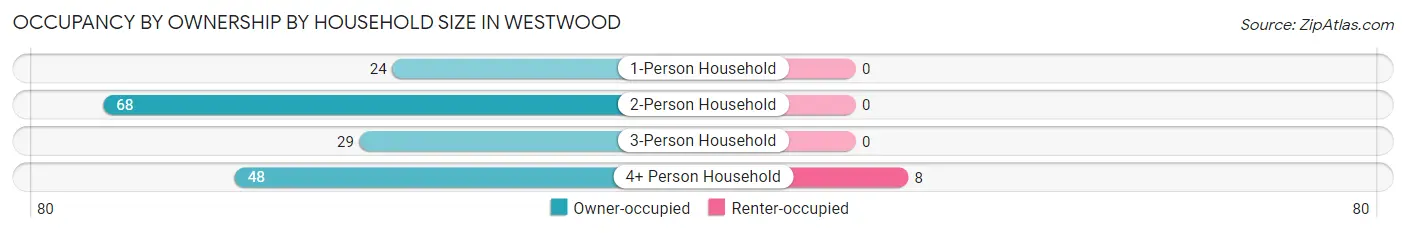
| Household Size | Owner-occupied | Renter-occupied |
| 1-Person Household | 24 (100.0%) | 0 (0.0%) |
| 2-Person Household | 68 (100.0%) | 0 (0.0%) |
| 3-Person Household | 29 (100.0%) | 0 (0.0%) |
| 4+ Person Household | 48 (85.7%) | 8 (14.3%) |
| Total Housing Units | 169 (95.5%) | 8 (4.5%) |
Occupancy by Educational Attainment in Westwood
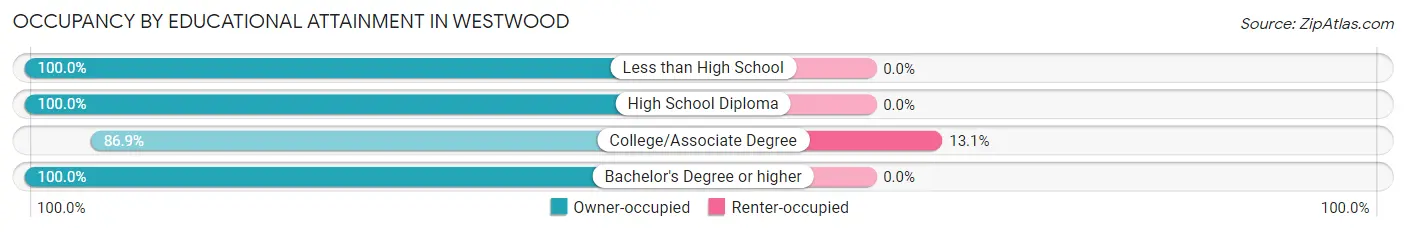
| Household Size | Owner-occupied | Renter-occupied |
| Less than High School | 1 (100.0%) | 0 (0.0%) |
| High School Diploma | 8 (100.0%) | 0 (0.0%) |
| College/Associate Degree | 53 (86.9%) | 8 (13.1%) |
| Bachelor's Degree or higher | 107 (100.0%) | 0 (0.0%) |
Occupancy by Age of Householder in Westwood
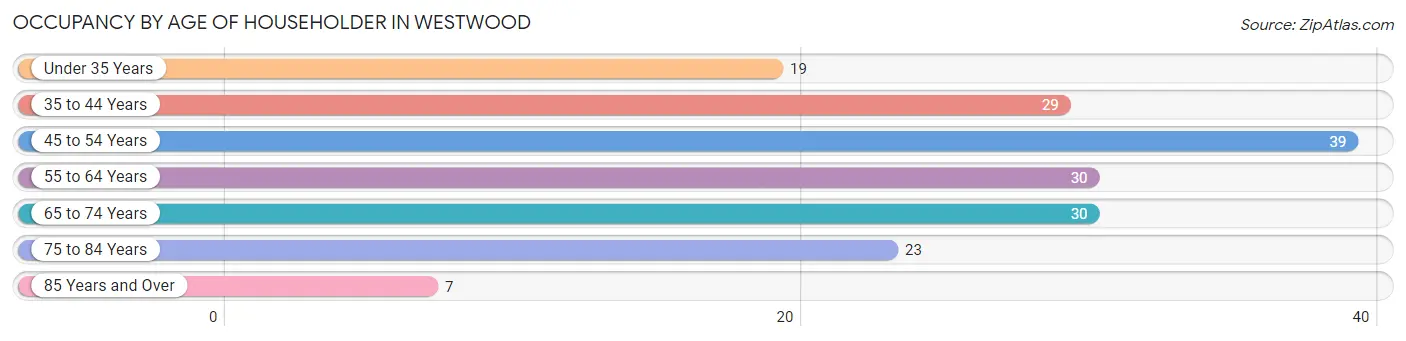
| Age Bracket | # Households | % Households |
| Under 35 Years | 19 | 10.7% |
| 35 to 44 Years | 29 | 16.4% |
| 45 to 54 Years | 39 | 22.0% |
| 55 to 64 Years | 30 | 17.0% |
| 65 to 74 Years | 30 | 17.0% |
| 75 to 84 Years | 23 | 13.0% |
| 85 Years and Over | 7 | 4.0% |
| Total | 177 | 100.0% |
Housing Finances in Westwood
Median Income by Occupancy in Westwood
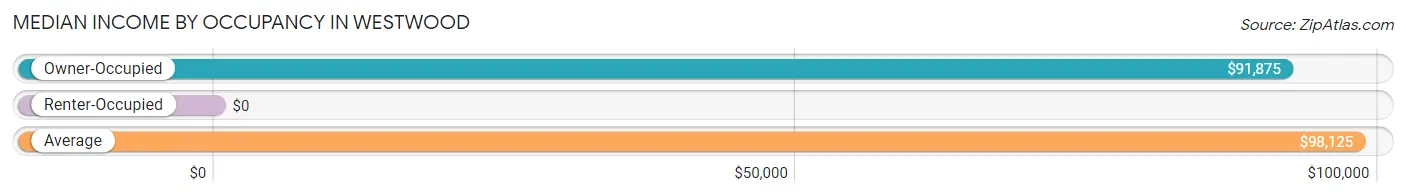
| Occupancy Type | # Households | Median Income |
| Owner-Occupied | 169 (95.5%) | $91,875 |
| Renter-Occupied | 8 (4.5%) | $0 |
| Average | 177 (100.0%) | $98,125 |
Occupancy by Householder Income Bracket in Westwood
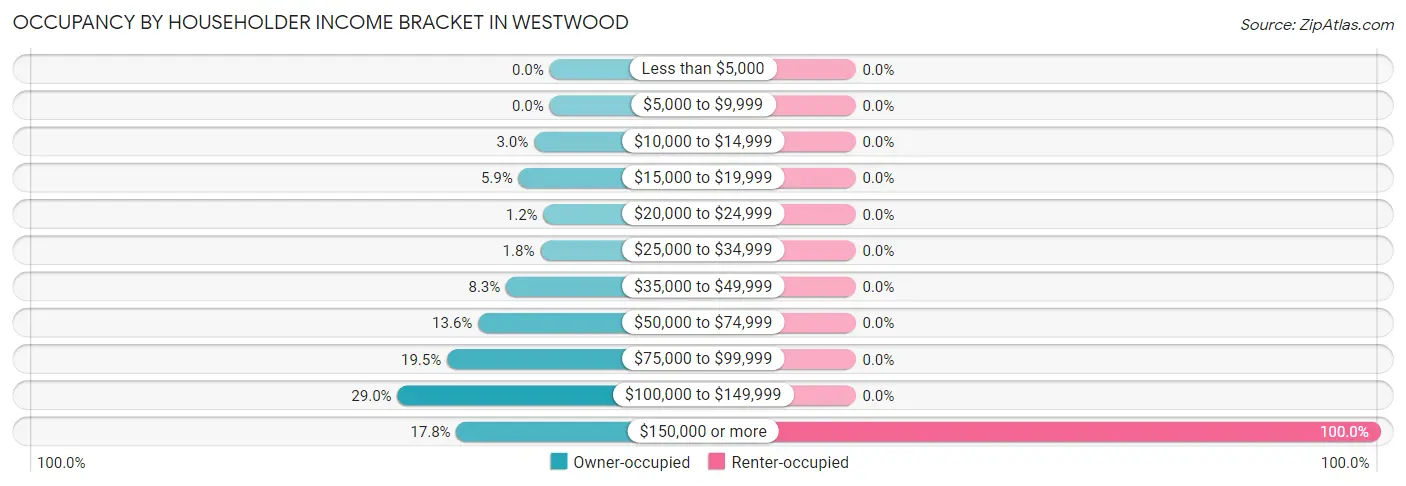
| Income Bracket | Owner-occupied | Renter-occupied |
| Less than $5,000 | 0 (0.0%) | 0 (0.0%) |
| $5,000 to $9,999 | 0 (0.0%) | 0 (0.0%) |
| $10,000 to $14,999 | 5 (3.0%) | 0 (0.0%) |
| $15,000 to $19,999 | 10 (5.9%) | 0 (0.0%) |
| $20,000 to $24,999 | 2 (1.2%) | 0 (0.0%) |
| $25,000 to $34,999 | 3 (1.8%) | 0 (0.0%) |
| $35,000 to $49,999 | 14 (8.3%) | 0 (0.0%) |
| $50,000 to $74,999 | 23 (13.6%) | 0 (0.0%) |
| $75,000 to $99,999 | 33 (19.5%) | 0 (0.0%) |
| $100,000 to $149,999 | 49 (29.0%) | 0 (0.0%) |
| $150,000 or more | 30 (17.7%) | 8 (100.0%) |
| Total | 169 (100.0%) | 8 (100.0%) |
Monthly Housing Cost Tiers in Westwood
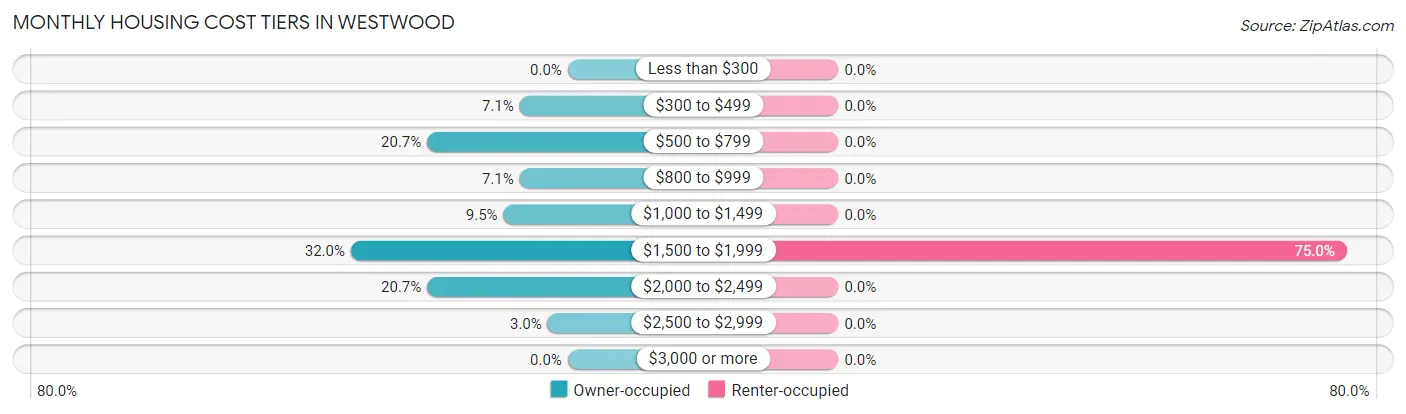
| Monthly Cost | Owner-occupied | Renter-occupied |
| Less than $300 | 0 (0.0%) | 0 (0.0%) |
| $300 to $499 | 12 (7.1%) | 0 (0.0%) |
| $500 to $799 | 35 (20.7%) | 0 (0.0%) |
| $800 to $999 | 12 (7.1%) | 0 (0.0%) |
| $1,000 to $1,499 | 16 (9.5%) | 0 (0.0%) |
| $1,500 to $1,999 | 54 (32.0%) | 6 (75.0%) |
| $2,000 to $2,499 | 35 (20.7%) | 0 (0.0%) |
| $2,500 to $2,999 | 5 (3.0%) | 0 (0.0%) |
| $3,000 or more | 0 (0.0%) | 0 (0.0%) |
| Total | 169 (100.0%) | 8 (100.0%) |
Physical Housing Characteristics in Westwood
Housing Structures in Westwood
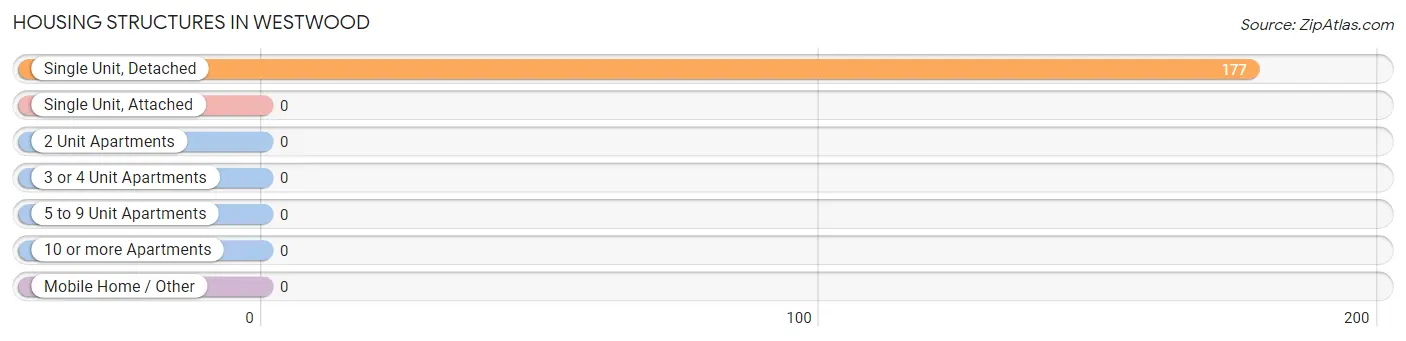
| Structure Type | # Housing Units | % Housing Units |
| Single Unit, Detached | 177 | 100.0% |
| Single Unit, Attached | 0 | 0.0% |
| 2 Unit Apartments | 0 | 0.0% |
| 3 or 4 Unit Apartments | 0 | 0.0% |
| 5 to 9 Unit Apartments | 0 | 0.0% |
| 10 or more Apartments | 0 | 0.0% |
| Mobile Home / Other | 0 | 0.0% |
| Total | 177 | 100.0% |
Housing Structures by Occupancy in Westwood
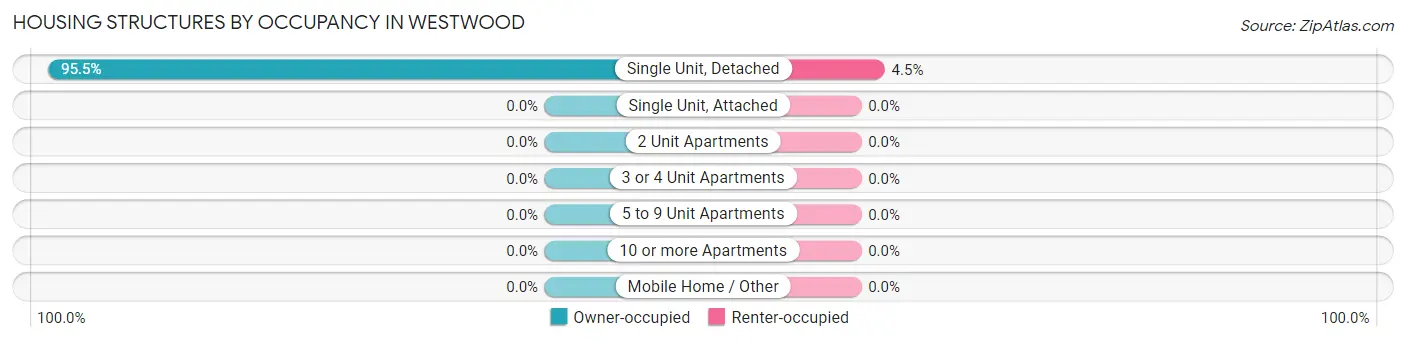
| Structure Type | Owner-occupied | Renter-occupied |
| Single Unit, Detached | 169 (95.5%) | 8 (4.5%) |
| Single Unit, Attached | 0 (0.0%) | 0 (0.0%) |
| 2 Unit Apartments | 0 (0.0%) | 0 (0.0%) |
| 3 or 4 Unit Apartments | 0 (0.0%) | 0 (0.0%) |
| 5 to 9 Unit Apartments | 0 (0.0%) | 0 (0.0%) |
| 10 or more Apartments | 0 (0.0%) | 0 (0.0%) |
| Mobile Home / Other | 0 (0.0%) | 0 (0.0%) |
| Total | 169 (95.5%) | 8 (4.5%) |
Housing Structures by Number of Rooms in Westwood
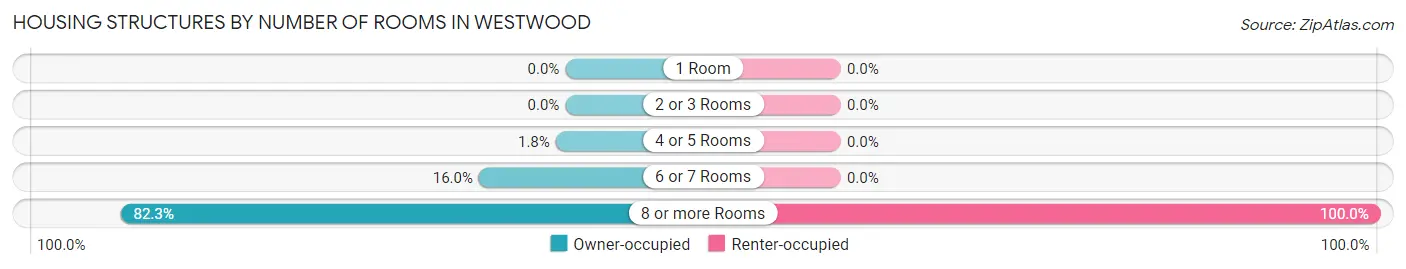
| Number of Rooms | Owner-occupied | Renter-occupied |
| 1 Room | 0 (0.0%) | 0 (0.0%) |
| 2 or 3 Rooms | 0 (0.0%) | 0 (0.0%) |
| 4 or 5 Rooms | 3 (1.8%) | 0 (0.0%) |
| 6 or 7 Rooms | 27 (16.0%) | 0 (0.0%) |
| 8 or more Rooms | 139 (82.3%) | 8 (100.0%) |
| Total | 169 (100.0%) | 8 (100.0%) |
Housing Structure by Heating Type in Westwood
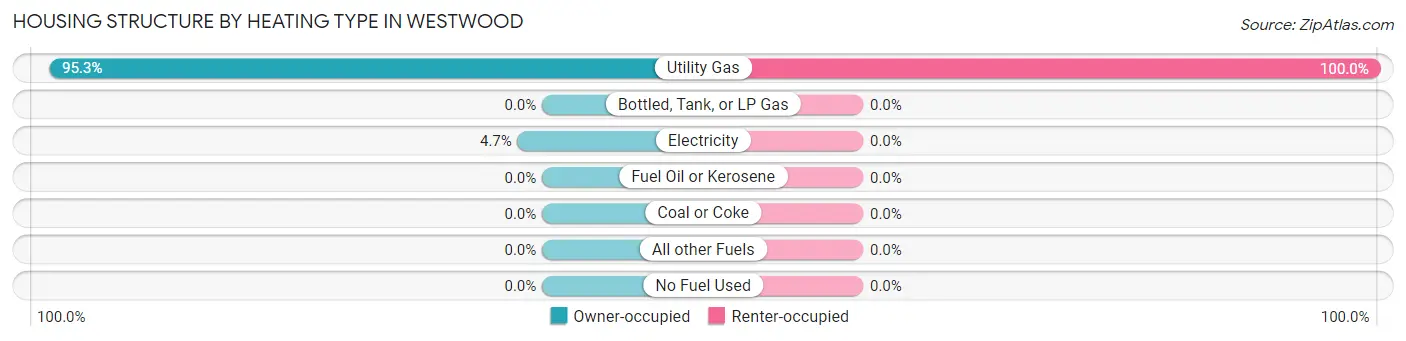
| Heating Type | Owner-occupied | Renter-occupied |
| Utility Gas | 161 (95.3%) | 8 (100.0%) |
| Bottled, Tank, or LP Gas | 0 (0.0%) | 0 (0.0%) |
| Electricity | 8 (4.7%) | 0 (0.0%) |
| Fuel Oil or Kerosene | 0 (0.0%) | 0 (0.0%) |
| Coal or Coke | 0 (0.0%) | 0 (0.0%) |
| All other Fuels | 0 (0.0%) | 0 (0.0%) |
| No Fuel Used | 0 (0.0%) | 0 (0.0%) |
| Total | 169 (100.0%) | 8 (100.0%) |
Household Vehicle Usage in Westwood
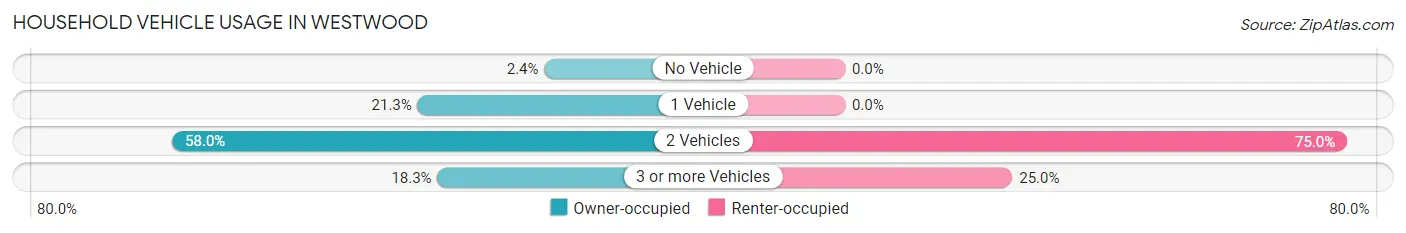
| Vehicles per Household | Owner-occupied | Renter-occupied |
| No Vehicle | 4 (2.4%) | 0 (0.0%) |
| 1 Vehicle | 36 (21.3%) | 0 (0.0%) |
| 2 Vehicles | 98 (58.0%) | 6 (75.0%) |
| 3 or more Vehicles | 31 (18.3%) | 2 (25.0%) |
| Total | 169 (100.0%) | 8 (100.0%) |
Real Estate & Mortgages in Westwood
Real Estate and Mortgage Overview in Westwood
| Characteristic | Without Mortgage | With Mortgage |
| Housing Units | 51 | 118 |
| Median Property Value | $297,900 | $301,800 |
| Median Household Income | $75,750 | $26 |
| Monthly Housing Costs | $628 | $0 |
| Real Estate Taxes | $2,315 | $0 |
Property Value by Mortgage Status in Westwood
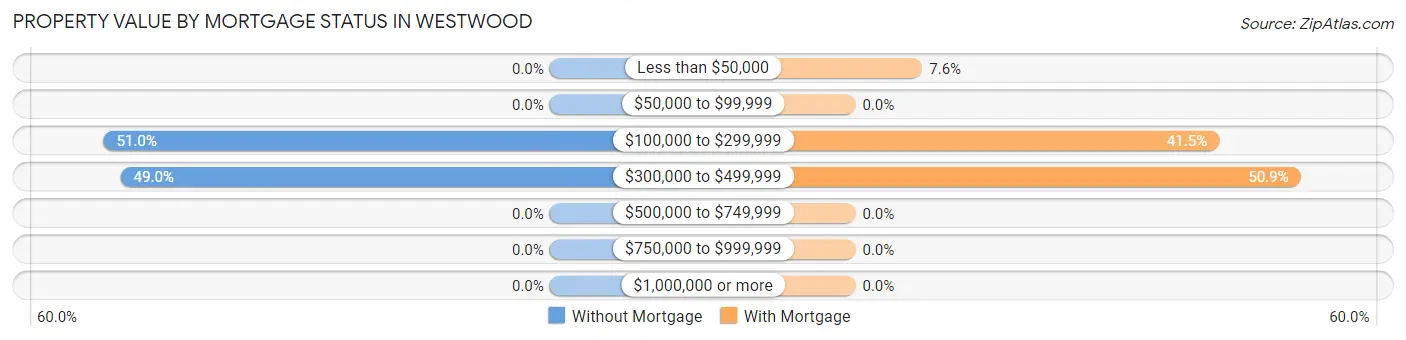
| Property Value | Without Mortgage | With Mortgage |
| Less than $50,000 | 0 (0.0%) | 9 (7.6%) |
| $50,000 to $99,999 | 0 (0.0%) | 0 (0.0%) |
| $100,000 to $299,999 | 26 (51.0%) | 49 (41.5%) |
| $300,000 to $499,999 | 25 (49.0%) | 60 (50.8%) |
| $500,000 to $749,999 | 0 (0.0%) | 0 (0.0%) |
| $750,000 to $999,999 | 0 (0.0%) | 0 (0.0%) |
| $1,000,000 or more | 0 (0.0%) | 0 (0.0%) |
| Total | 51 (100.0%) | 118 (100.0%) |
Household Income by Mortgage Status in Westwood
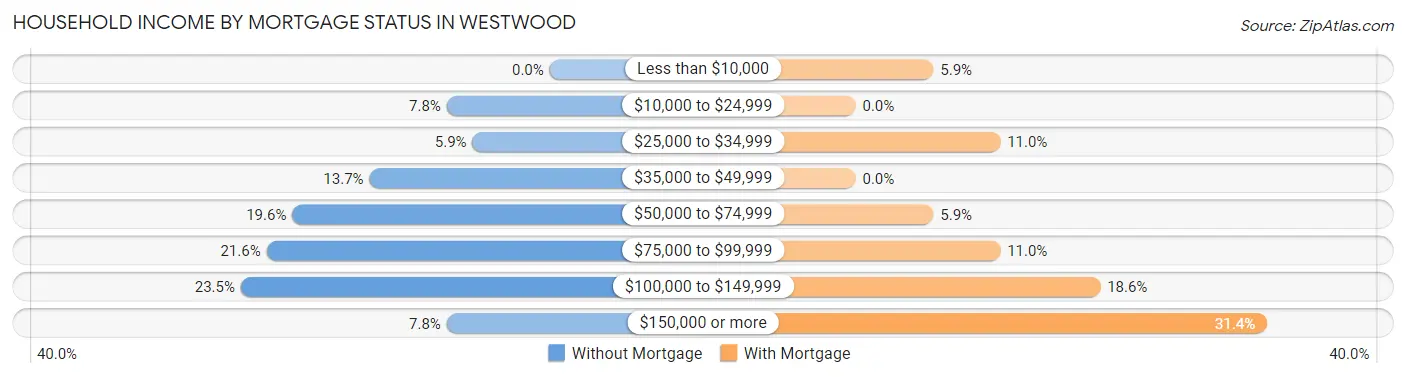
| Household Income | Without Mortgage | With Mortgage |
| Less than $10,000 | 0 (0.0%) | 7 (5.9%) |
| $10,000 to $24,999 | 4 (7.8%) | 0 (0.0%) |
| $25,000 to $34,999 | 3 (5.9%) | 13 (11.0%) |
| $35,000 to $49,999 | 7 (13.7%) | 0 (0.0%) |
| $50,000 to $74,999 | 10 (19.6%) | 7 (5.9%) |
| $75,000 to $99,999 | 11 (21.6%) | 13 (11.0%) |
| $100,000 to $149,999 | 12 (23.5%) | 22 (18.6%) |
| $150,000 or more | 4 (7.8%) | 37 (31.4%) |
| Total | 51 (100.0%) | 118 (100.0%) |
Property Value to Household Income Ratio in Westwood
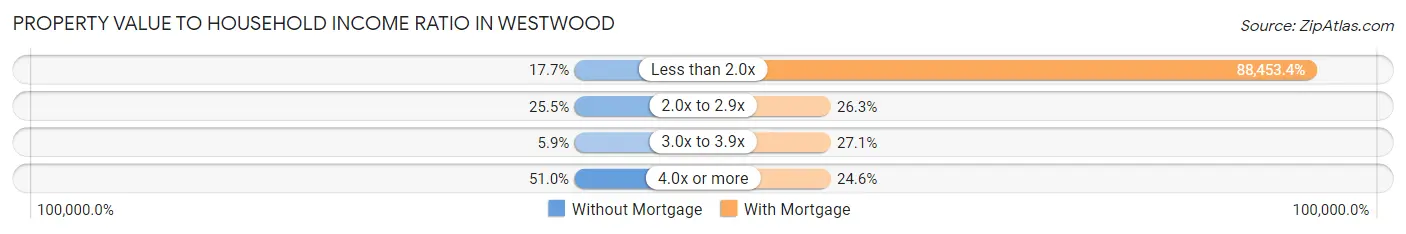
| Value-to-Income Ratio | Without Mortgage | With Mortgage |
| Less than 2.0x | 9 (17.6%) | 104,375 (88,453.4%) |
| 2.0x to 2.9x | 13 (25.5%) | 31 (26.3%) |
| 3.0x to 3.9x | 3 (5.9%) | 32 (27.1%) |
| 4.0x or more | 26 (51.0%) | 29 (24.6%) |
| Total | 51 (100.0%) | 118 (100.0%) |
Real Estate Taxes by Mortgage Status in Westwood
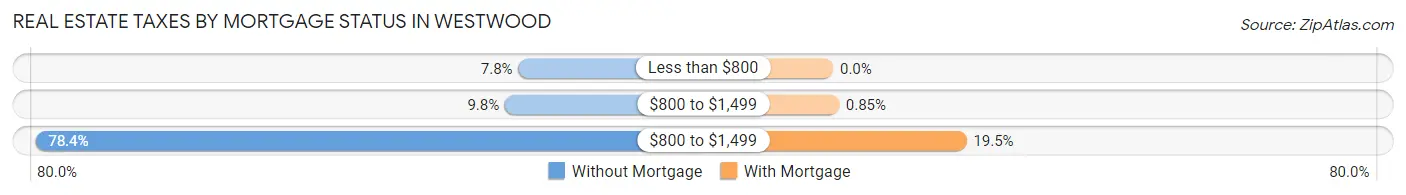
| Property Taxes | Without Mortgage | With Mortgage |
| Less than $800 | 4 (7.8%) | 0 (0.0%) |
| $800 to $1,499 | 5 (9.8%) | 1 (0.9%) |
| $800 to $1,499 | 40 (78.4%) | 23 (19.5%) |
| Total | 51 (100.0%) | 118 (100.0%) |
Health & Disability in Westwood
Health Insurance Coverage by Age in Westwood
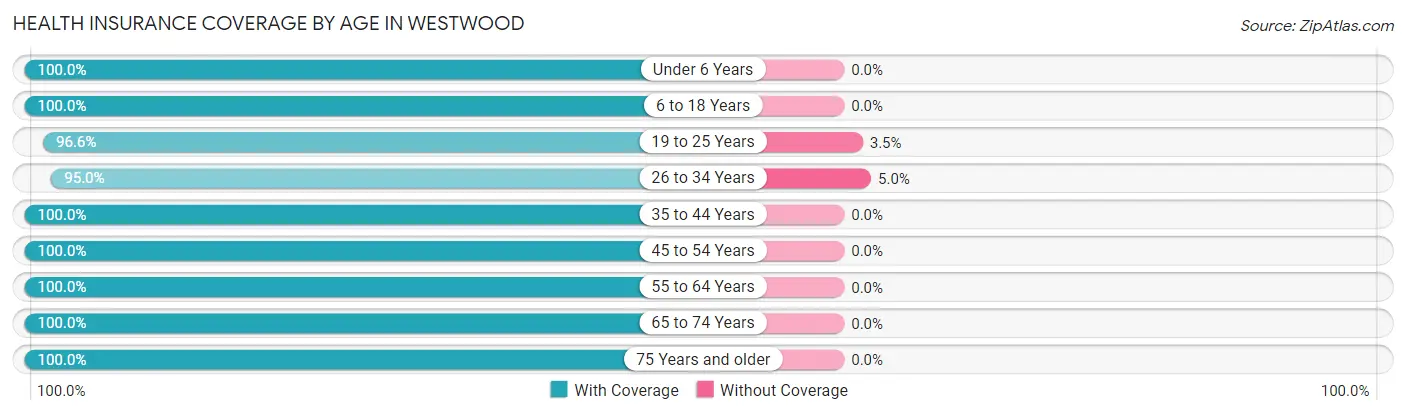
| Age Bracket | With Coverage | Without Coverage |
| Under 6 Years | 49 (100.0%) | 0 (0.0%) |
| 6 to 18 Years | 99 (100.0%) | 0 (0.0%) |
| 19 to 25 Years | 28 (96.6%) | 1 (3.5%) |
| 26 to 34 Years | 38 (95.0%) | 2 (5.0%) |
| 35 to 44 Years | 58 (100.0%) | 0 (0.0%) |
| 45 to 54 Years | 60 (100.0%) | 0 (0.0%) |
| 55 to 64 Years | 57 (100.0%) | 0 (0.0%) |
| 65 to 74 Years | 52 (100.0%) | 0 (0.0%) |
| 75 Years and older | 52 (100.0%) | 0 (0.0%) |
| Total | 493 (99.4%) | 3 (0.6%) |
Health Insurance Coverage by Citizenship Status in Westwood
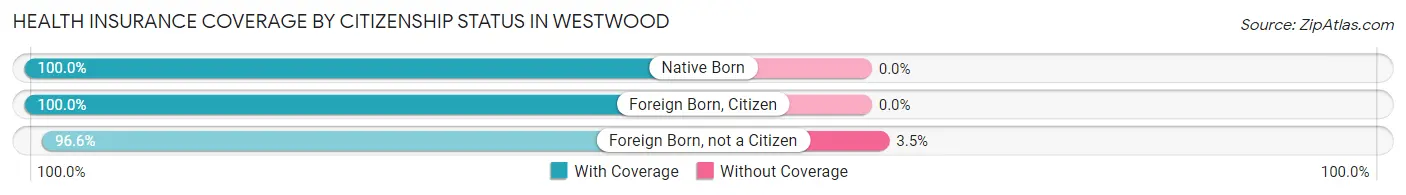
| Citizenship Status | With Coverage | Without Coverage |
| Native Born | 49 (100.0%) | 0 (0.0%) |
| Foreign Born, Citizen | 99 (100.0%) | 0 (0.0%) |
| Foreign Born, not a Citizen | 28 (96.6%) | 1 (3.5%) |
Health Insurance Coverage by Household Income in Westwood
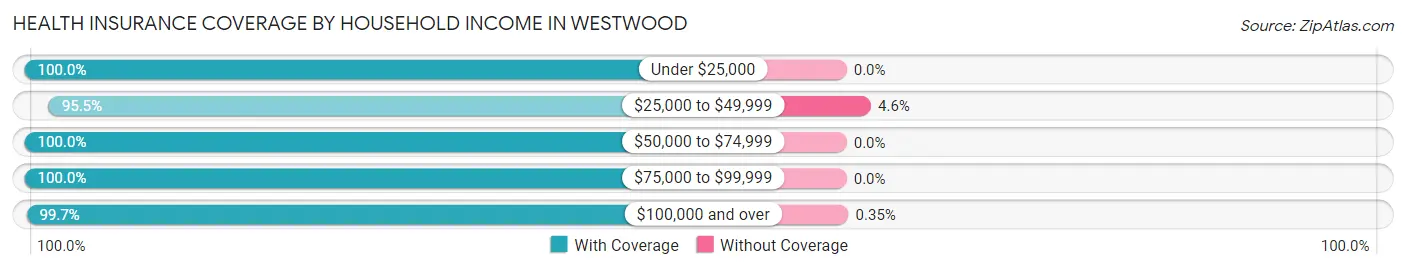
| Household Income | With Coverage | Without Coverage |
| Under $25,000 | 49 (100.0%) | 0 (0.0%) |
| $25,000 to $49,999 | 42 (95.5%) | 2 (4.5%) |
| $50,000 to $74,999 | 43 (100.0%) | 0 (0.0%) |
| $75,000 to $99,999 | 74 (100.0%) | 0 (0.0%) |
| $100,000 and over | 285 (99.7%) | 1 (0.4%) |
Public vs Private Health Insurance Coverage by Age in Westwood
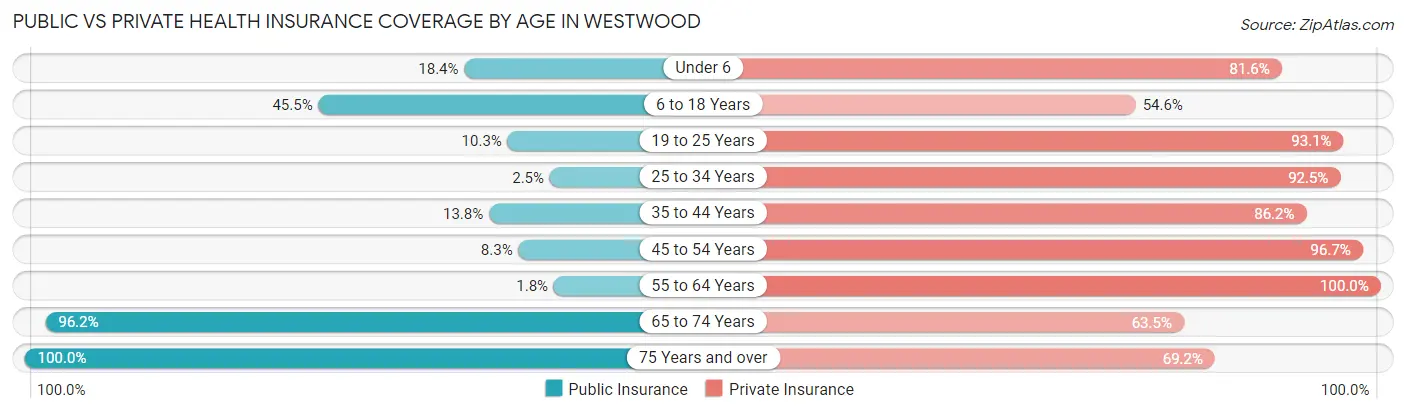
| Age Bracket | Public Insurance | Private Insurance |
| Under 6 | 9 (18.4%) | 40 (81.6%) |
| 6 to 18 Years | 45 (45.5%) | 54 (54.5%) |
| 19 to 25 Years | 3 (10.3%) | 27 (93.1%) |
| 25 to 34 Years | 1 (2.5%) | 37 (92.5%) |
| 35 to 44 Years | 8 (13.8%) | 50 (86.2%) |
| 45 to 54 Years | 5 (8.3%) | 58 (96.7%) |
| 55 to 64 Years | 1 (1.8%) | 57 (100.0%) |
| 65 to 74 Years | 50 (96.2%) | 33 (63.5%) |
| 75 Years and over | 52 (100.0%) | 36 (69.2%) |
| Total | 174 (35.1%) | 392 (79.0%) |
Disability Status by Sex by Age in Westwood
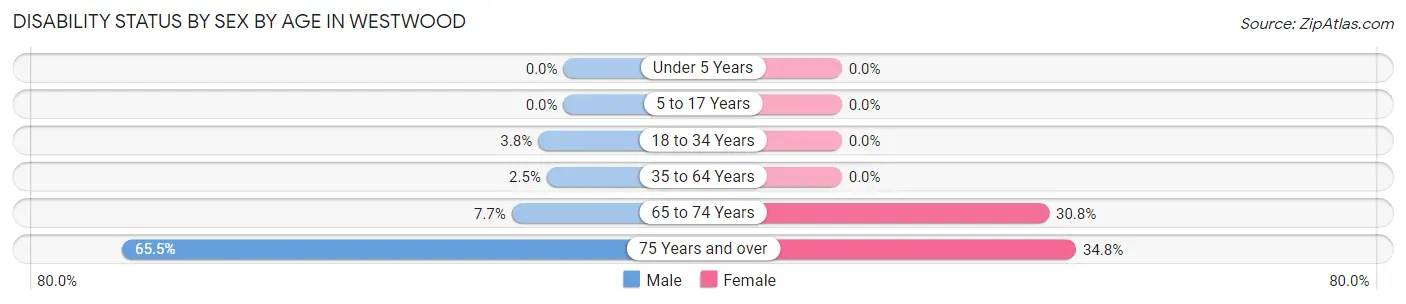
| Age Bracket | Male | Female |
| Under 5 Years | 0 (0.0%) | 0 (0.0%) |
| 5 to 17 Years | 0 (0.0%) | 0 (0.0%) |
| 18 to 34 Years | 2 (3.8%) | 0 (0.0%) |
| 35 to 64 Years | 2 (2.5%) | 0 (0.0%) |
| 65 to 74 Years | 2 (7.7%) | 8 (30.8%) |
| 75 Years and over | 19 (65.5%) | 8 (34.8%) |
Disability Class by Sex by Age in Westwood
Disability Class: Hearing Difficulty
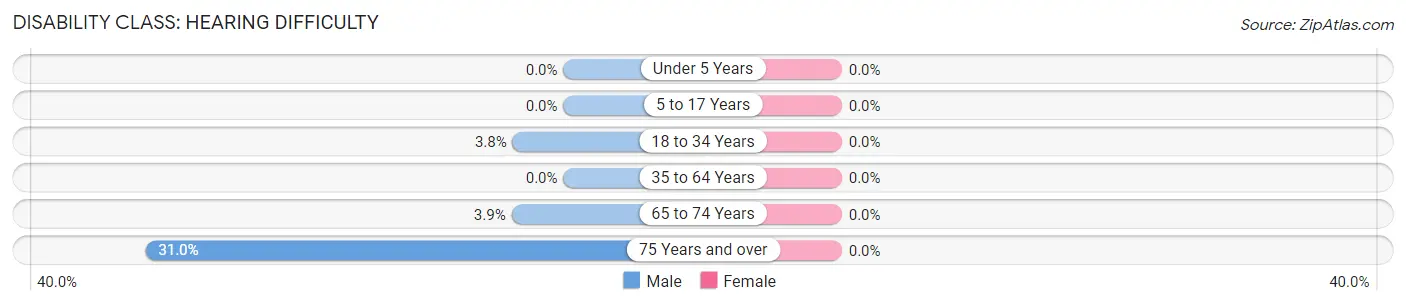
| Age Bracket | Male | Female |
| Under 5 Years | 0 (0.0%) | 0 (0.0%) |
| 5 to 17 Years | 0 (0.0%) | 0 (0.0%) |
| 18 to 34 Years | 2 (3.8%) | 0 (0.0%) |
| 35 to 64 Years | 0 (0.0%) | 0 (0.0%) |
| 65 to 74 Years | 1 (3.8%) | 0 (0.0%) |
| 75 Years and over | 9 (31.0%) | 0 (0.0%) |
Disability Class: Vision Difficulty
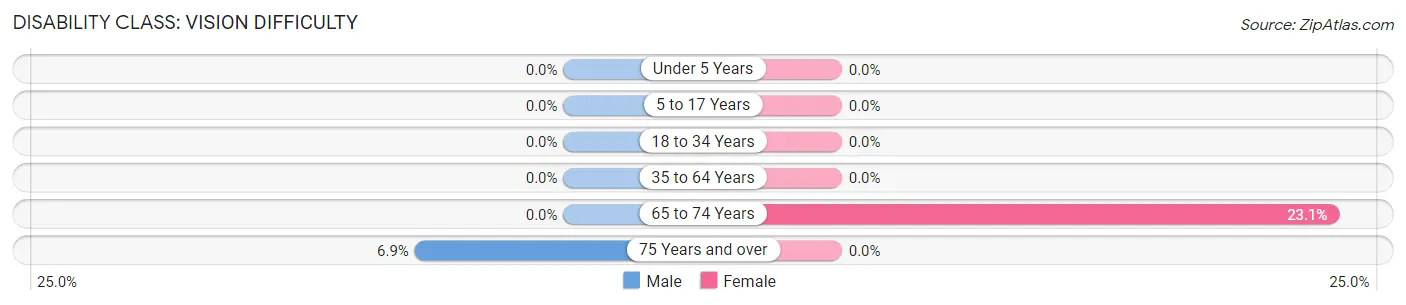
| Age Bracket | Male | Female |
| Under 5 Years | 0 (0.0%) | 0 (0.0%) |
| 5 to 17 Years | 0 (0.0%) | 0 (0.0%) |
| 18 to 34 Years | 0 (0.0%) | 0 (0.0%) |
| 35 to 64 Years | 0 (0.0%) | 0 (0.0%) |
| 65 to 74 Years | 0 (0.0%) | 6 (23.1%) |
| 75 Years and over | 2 (6.9%) | 0 (0.0%) |
Disability Class: Cognitive Difficulty
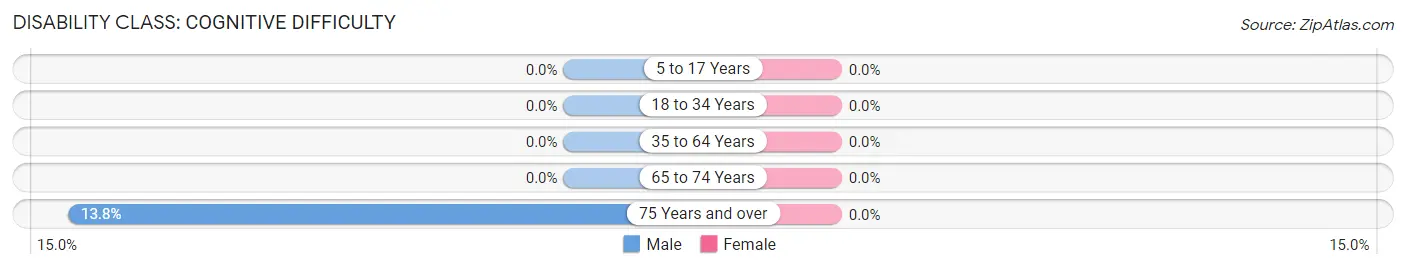
| Age Bracket | Male | Female |
| 5 to 17 Years | 0 (0.0%) | 0 (0.0%) |
| 18 to 34 Years | 0 (0.0%) | 0 (0.0%) |
| 35 to 64 Years | 0 (0.0%) | 0 (0.0%) |
| 65 to 74 Years | 0 (0.0%) | 0 (0.0%) |
| 75 Years and over | 4 (13.8%) | 0 (0.0%) |
Disability Class: Ambulatory Difficulty
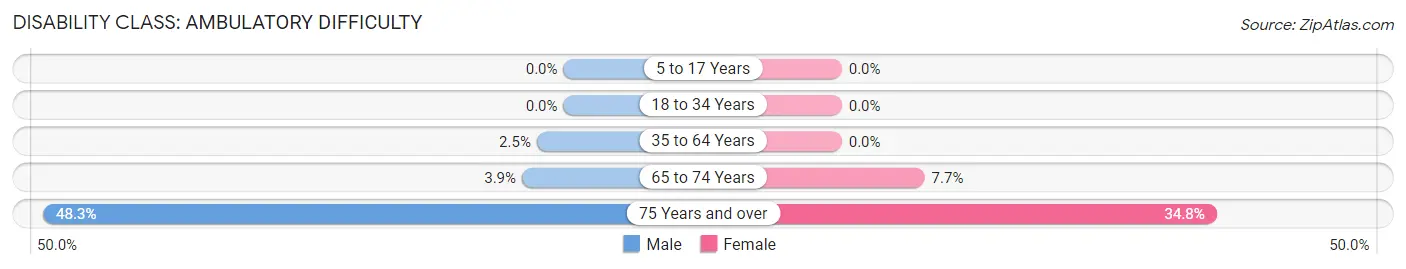
| Age Bracket | Male | Female |
| 5 to 17 Years | 0 (0.0%) | 0 (0.0%) |
| 18 to 34 Years | 0 (0.0%) | 0 (0.0%) |
| 35 to 64 Years | 2 (2.5%) | 0 (0.0%) |
| 65 to 74 Years | 1 (3.8%) | 2 (7.7%) |
| 75 Years and over | 14 (48.3%) | 8 (34.8%) |
Disability Class: Self-Care Difficulty
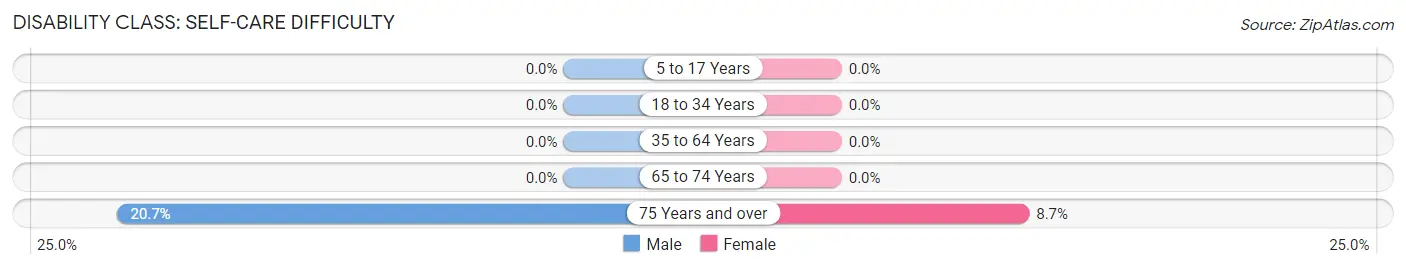
| Age Bracket | Male | Female |
| 5 to 17 Years | 0 (0.0%) | 0 (0.0%) |
| 18 to 34 Years | 0 (0.0%) | 0 (0.0%) |
| 35 to 64 Years | 0 (0.0%) | 0 (0.0%) |
| 65 to 74 Years | 0 (0.0%) | 0 (0.0%) |
| 75 Years and over | 6 (20.7%) | 2 (8.7%) |
Technology Access in Westwood
Computing Device Access in Westwood
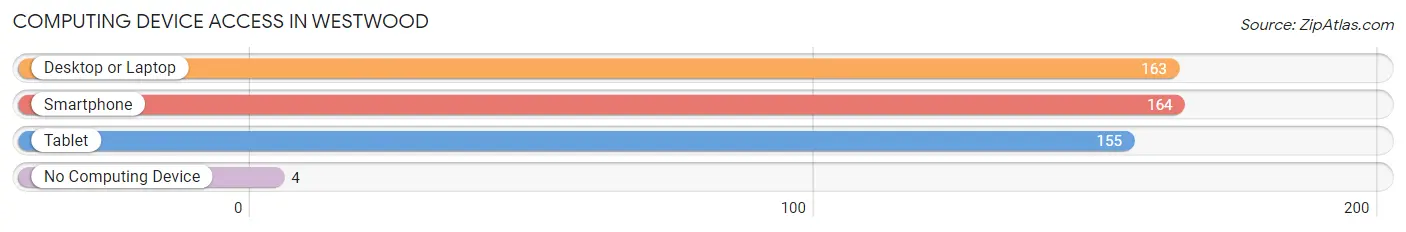
| Device Type | # Households | % Households |
| Desktop or Laptop | 163 | 92.1% |
| Smartphone | 164 | 92.7% |
| Tablet | 155 | 87.6% |
| No Computing Device | 4 | 2.3% |
| Total | 177 | 100.0% |
Internet Access in Westwood
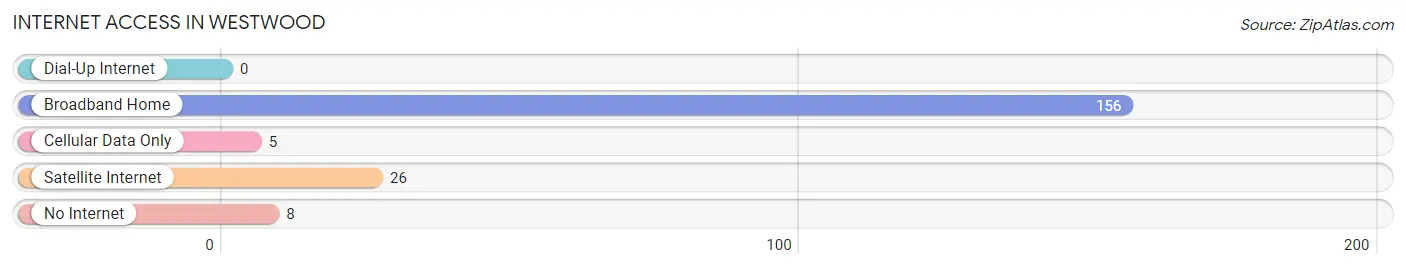
| Internet Type | # Households | % Households |
| Dial-Up Internet | 0 | 0.0% |
| Broadband Home | 156 | 88.1% |
| Cellular Data Only | 5 | 2.8% |
| Satellite Internet | 26 | 14.7% |
| No Internet | 8 | 4.5% |
| Total | 177 | 100.0% |
Westwood Summary
Westwood, Kentucky is a small city located in the northern part of the state, in the county of Boone. It is situated on the banks of the Ohio River, and is part of the Cincinnati metropolitan area. The city has a population of approximately 4,000 people, and is known for its small-town charm and friendly atmosphere.
History
Westwood was founded in 1817 by a group of settlers from Pennsylvania. The town was originally known as Westwood Station, and was a stop on the Cincinnati, Hamilton and Dayton Railroad. The town was officially incorporated in 1867, and the name was changed to Westwood.
The city was a major hub for the coal mining industry in the late 19th and early 20th centuries. The coal mines provided jobs for many of the residents, and the city grew rapidly. The city was also home to several large manufacturing plants, including a steel mill and a paper mill.
Geography
Westwood is located in the northern part of Boone County, in the Cincinnati metropolitan area. The city is situated on the banks of the Ohio River, and is bordered by the cities of Florence, Hebron, and Union. The city covers an area of approximately 4.5 square miles, and has an elevation of 845 feet.
The climate in Westwood is humid continental, with hot summers and cold winters. The average annual temperature is around 54 degrees Fahrenheit, and the average annual precipitation is around 40 inches.
Economy
Westwood’s economy is largely based on manufacturing and retail. The city is home to several large manufacturing plants, including a steel mill and a paper mill. The city is also home to several retail stores, including a Walmart Supercenter and a Kroger grocery store.
The city is also home to several small businesses, including restaurants, bars, and shops. The city is also home to several medical facilities, including a hospital and several clinics.
Demographics
As of the 2010 census, the population of Westwood was 4,000. The racial makeup of the city was 95.3% White, 1.7% African American, 0.3% Native American, 0.7% Asian, 0.1% Pacific Islander, and 1.8% from other races. The median household income was $41,250, and the median family income was $50,000.
The city is home to several churches, including the Westwood United Methodist Church, the Westwood Baptist Church, and the Westwood Presbyterian Church. The city is also home to several schools, including Westwood Elementary School, Westwood Middle School, and Westwood High School.
Conclusion
Westwood, Kentucky is a small city located in the northern part of the state, in the county of Boone. It is situated on the banks of the Ohio River, and is part of the Cincinnati metropolitan area. The city has a population of approximately 4,000 people, and is known for its small-town charm and friendly atmosphere. The city’s economy is largely based on manufacturing and retail, and the city is home to several large manufacturing plants, retail stores, and small businesses. The city is also home to several churches and schools.
Common Questions
What is Per Capita Income in Westwood?
Per Capita income in Westwood is $41,292.
What is the Median Family Income in Westwood?
Median Family Income in Westwood is $108,250.
What is the Median Household income in Westwood?
Median Household Income in Westwood is $98,125.
What is Income or Wage Gap in Westwood?
Income or Wage Gap in Westwood is 52.5%.
Women in Westwood earn 47.5 cents for every dollar earned by a man.
What is Inequality or Gini Index in Westwood?
Inequality or Gini Index in Westwood is 0.36.
What is the Total Population of Westwood?
Total Population of Westwood is 496.
What is the Total Male Population of Westwood?
Total Male Population of Westwood is 276.
What is the Total Female Population of Westwood?
Total Female Population of Westwood is 220.
What is the Ratio of Males per 100 Females in Westwood?
There are 125.45 Males per 100 Females in Westwood.
What is the Ratio of Females per 100 Males in Westwood?
There are 79.71 Females per 100 Males in Westwood.
What is the Median Population Age in Westwood?
Median Population Age in Westwood is 43.0 Years.
What is the Average Family Size in Westwood
Average Family Size in Westwood is 3.0 People.
What is the Average Household Size in Westwood
Average Household Size in Westwood is 2.8 People.
How Large is the Labor Force in Westwood?
There are 261 People in the Labor Forcein in Westwood.
What is the Percentage of People in the Labor Force in Westwood?
70.4% of People are in the Labor Force in Westwood.
What is the Unemployment Rate in Westwood?
Unemployment Rate in Westwood is 1.5%.