Woodburn, KY Map & Demographics
Woodburn Map
Woodburn Overview
$25,062
PER CAPITA INCOME
$80,000
AVG FAMILY INCOME
$66,250
AVG HOUSEHOLD INCOME
49.5%
WAGE / INCOME GAP [ % ]
50.5¢/ $1
WAGE / INCOME GAP [ $ ]
0.36
INEQUALITY / GINI INDEX
306
TOTAL POPULATION
119
MALE POPULATION
187
FEMALE POPULATION
63.64
MALES / 100 FEMALES
157.14
FEMALES / 100 MALES
52.4
MEDIAN AGE
3.0
AVG FAMILY SIZE
2.8
AVG HOUSEHOLD SIZE
115
LABOR FORCE [ PEOPLE ]
47.1%
PERCENT IN LABOR FORCE
5.2%
UNEMPLOYMENT RATE
Woodburn Zip Codes
Woodburn Area Codes
Income in Woodburn
Income Overview in Woodburn
Per Capita Income in Woodburn is $25,062, while median incomes of families and households are $80,000 and $66,250 respectively.
| Characteristic | Number | Measure |
| Per Capita Income | 306 | $25,062 |
| Median Family Income | 80 | $80,000 |
| Mean Family Income | 80 | $83,405 |
| Median Household Income | 92 | $66,250 |
| Mean Household Income | 92 | $75,861 |
| Income Deficit | 80 | $0 |
| Wage / Income Gap (%) | 306 | 49.53% |
| Wage / Income Gap ($) | 306 | 50.47¢ per $1 |
| Gini / Inequality Index | 306 | 0.36 |
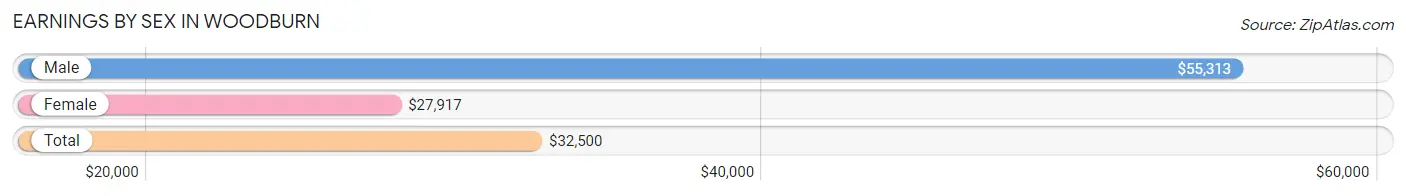
Earnings by Sex in Woodburn
Average Earnings in Woodburn are $32,500, $55,313 for men and $27,917 for women, a difference of 49.5%.
| Sex | Number | Average Earnings |
| Male | 73 (57.9%) | $55,313 |
| Female | 53 (42.1%) | $27,917 |
| Total | 126 (100.0%) | $32,500 |
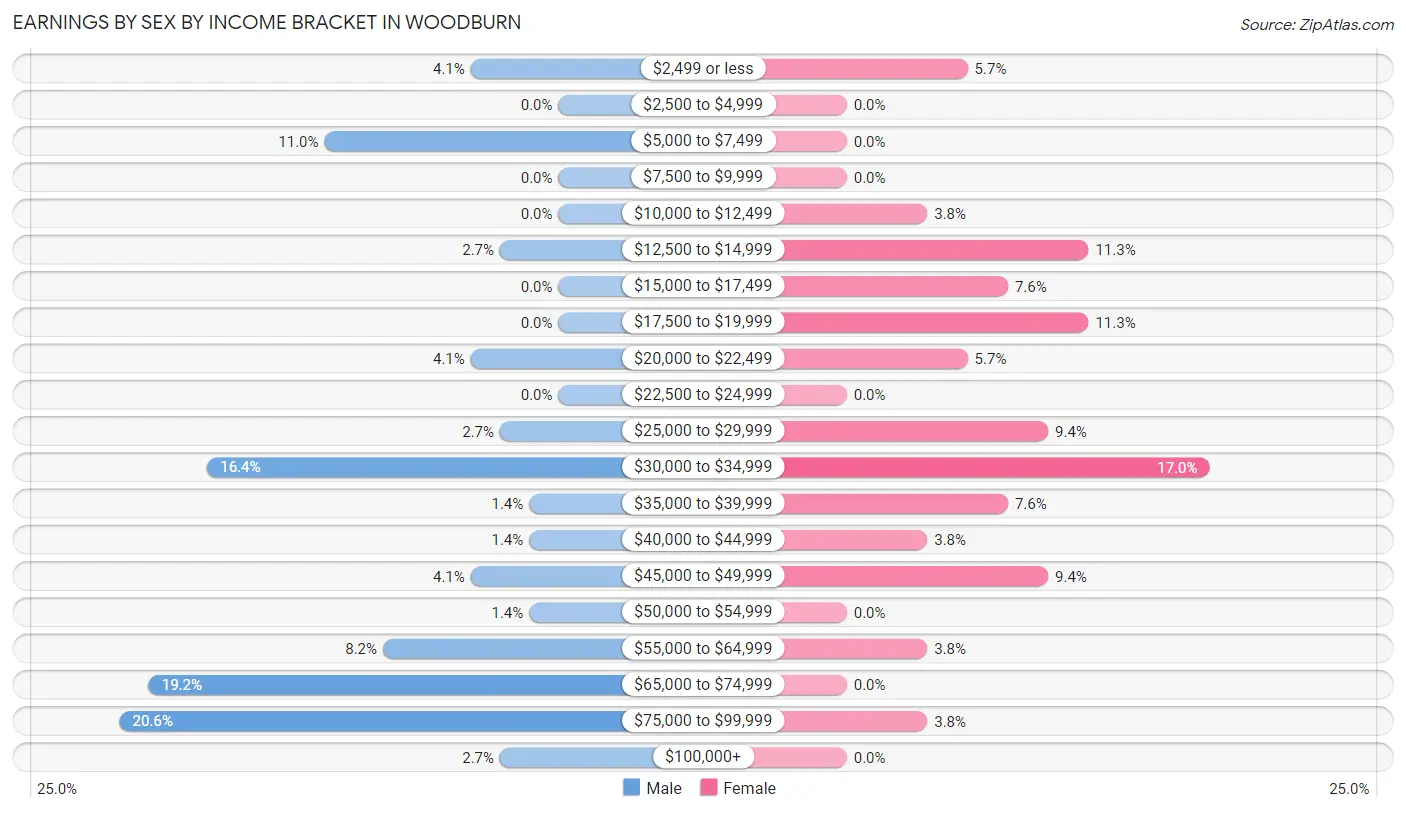
Earnings by Sex by Income Bracket in Woodburn
The most common earnings brackets in Woodburn are $75,000 to $99,999 for men (15 | 20.5%) and $30,000 to $34,999 for women (9 | 17.0%).
| Income | Male | Female |
| $2,499 or less | 3 (4.1%) | 3 (5.7%) |
| $2,500 to $4,999 | 0 (0.0%) | 0 (0.0%) |
| $5,000 to $7,499 | 8 (11.0%) | 0 (0.0%) |
| $7,500 to $9,999 | 0 (0.0%) | 0 (0.0%) |
| $10,000 to $12,499 | 0 (0.0%) | 2 (3.8%) |
| $12,500 to $14,999 | 2 (2.7%) | 6 (11.3%) |
| $15,000 to $17,499 | 0 (0.0%) | 4 (7.5%) |
| $17,500 to $19,999 | 0 (0.0%) | 6 (11.3%) |
| $20,000 to $22,499 | 3 (4.1%) | 3 (5.7%) |
| $22,500 to $24,999 | 0 (0.0%) | 0 (0.0%) |
| $25,000 to $29,999 | 2 (2.7%) | 5 (9.4%) |
| $30,000 to $34,999 | 12 (16.4%) | 9 (17.0%) |
| $35,000 to $39,999 | 1 (1.4%) | 4 (7.5%) |
| $40,000 to $44,999 | 1 (1.4%) | 2 (3.8%) |
| $45,000 to $49,999 | 3 (4.1%) | 5 (9.4%) |
| $50,000 to $54,999 | 1 (1.4%) | 0 (0.0%) |
| $55,000 to $64,999 | 6 (8.2%) | 2 (3.8%) |
| $65,000 to $74,999 | 14 (19.2%) | 0 (0.0%) |
| $75,000 to $99,999 | 15 (20.5%) | 2 (3.8%) |
| $100,000+ | 2 (2.7%) | 0 (0.0%) |
| Total | 73 (100.0%) | 53 (100.0%) |
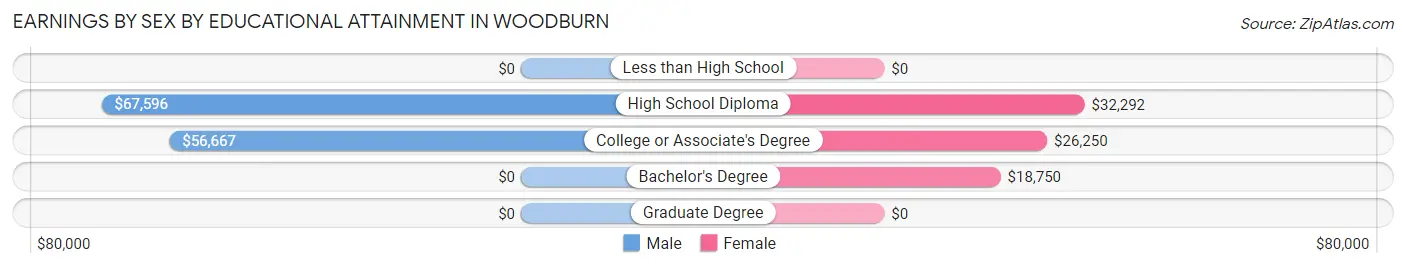
Earnings by Sex by Educational Attainment in Woodburn
Average earnings in Woodburn are $61,875 for men and $29,167 for women, a difference of 52.9%. Men with an educational attainment of high school diploma enjoy the highest average annual earnings of $67,596, while those with college or associate's degree education earn the least with $56,667. Women with an educational attainment of high school diploma earn the most with the average annual earnings of $32,292, while those with bachelor's degree education have the smallest earnings of $18,750.
| Educational Attainment | Male Income | Female Income |
| Less than High School | - | - |
| High School Diploma | $67,596 | $32,292 |
| College or Associate's Degree | $56,667 | $26,250 |
| Bachelor's Degree | - | - |
| Graduate Degree | - | - |
| Total | $61,875 | $29,167 |
Family Income in Woodburn
Family Income Brackets in Woodburn
According to the Woodburn family income data, there are 21 families falling into the $100,000 to $149,999 income range, which is the most common income bracket and makes up 26.3% of all families.
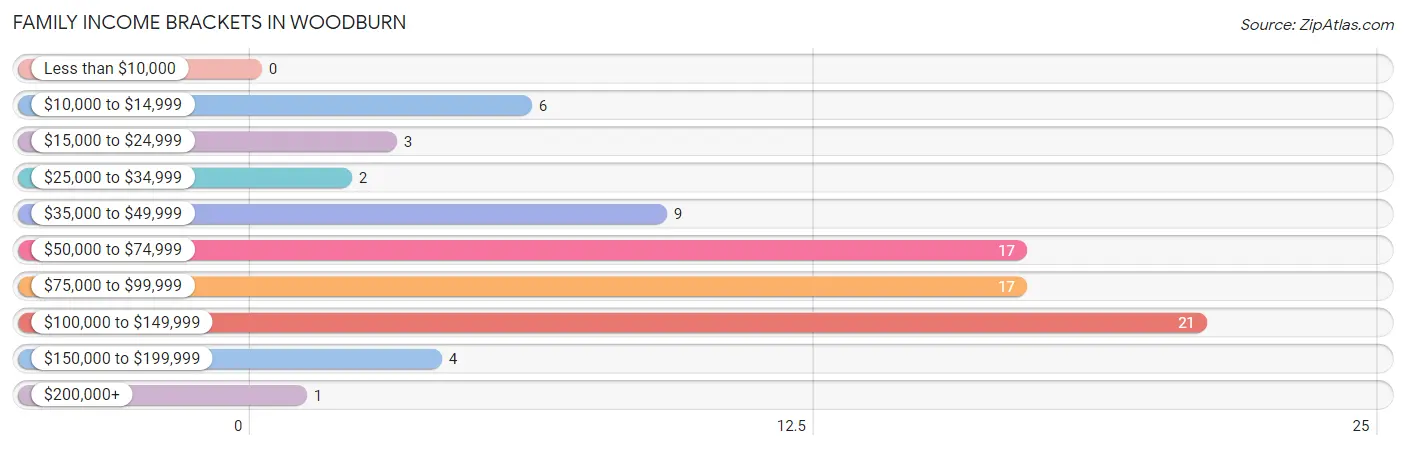
| Income Bracket | # Families | % Families |
| Less than $10,000 | 0 | 0.0% |
| $10,000 to $14,999 | 6 | 7.5% |
| $15,000 to $24,999 | 3 | 3.8% |
| $25,000 to $34,999 | 2 | 2.5% |
| $35,000 to $49,999 | 9 | 11.3% |
| $50,000 to $74,999 | 17 | 21.3% |
| $75,000 to $99,999 | 17 | 21.3% |
| $100,000 to $149,999 | 21 | 26.3% |
| $150,000 to $199,999 | 4 | 5.0% |
| $200,000+ | 1 | 1.3% |
Family Income by Famaliy Size in Woodburn
5-person families (9 | 11.3%) account for the highest median family income in Woodburn with $138,125 per family, while 2-person families (43 | 53.7%) have the highest median income of $40,938 per family member.
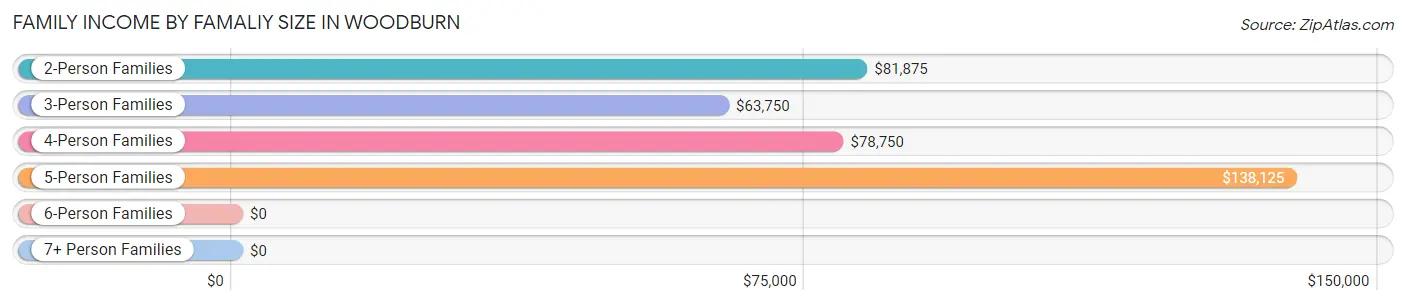
| Income Bracket | # Families | Median Income |
| 2-Person Families | 43 (53.7%) | $81,875 |
| 3-Person Families | 14 (17.5%) | $63,750 |
| 4-Person Families | 12 (15.0%) | $78,750 |
| 5-Person Families | 9 (11.3%) | $138,125 |
| 6-Person Families | 2 (2.5%) | $0 |
| 7+ Person Families | 0 (0.0%) | $0 |
| Total | 80 (100.0%) | $80,000 |
Family Income by Number of Earners in Woodburn
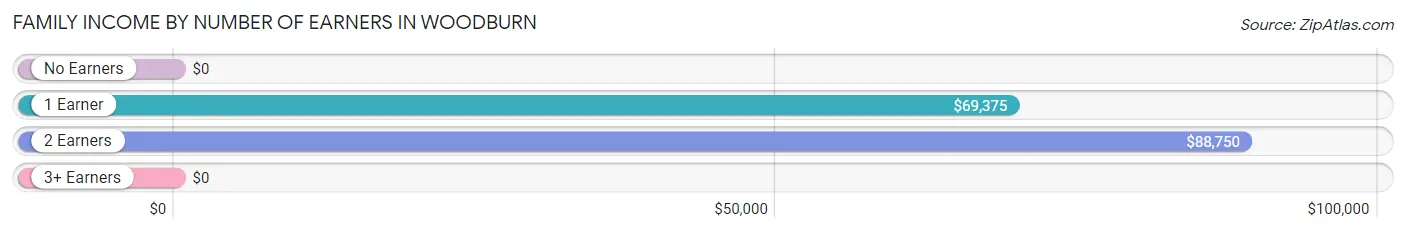
| Number of Earners | # Families | Median Income |
| No Earners | 10 (12.5%) | $0 |
| 1 Earner | 27 (33.8%) | $69,375 |
| 2 Earners | 40 (50.0%) | $88,750 |
| 3+ Earners | 3 (3.7%) | $0 |
| Total | 80 (100.0%) | $80,000 |
Household Income in Woodburn
Household Income Brackets in Woodburn
With 20 households falling in the category, the $100,000 to $149,999 income range is the most frequent in Woodburn, accounting for 21.7% of all households.
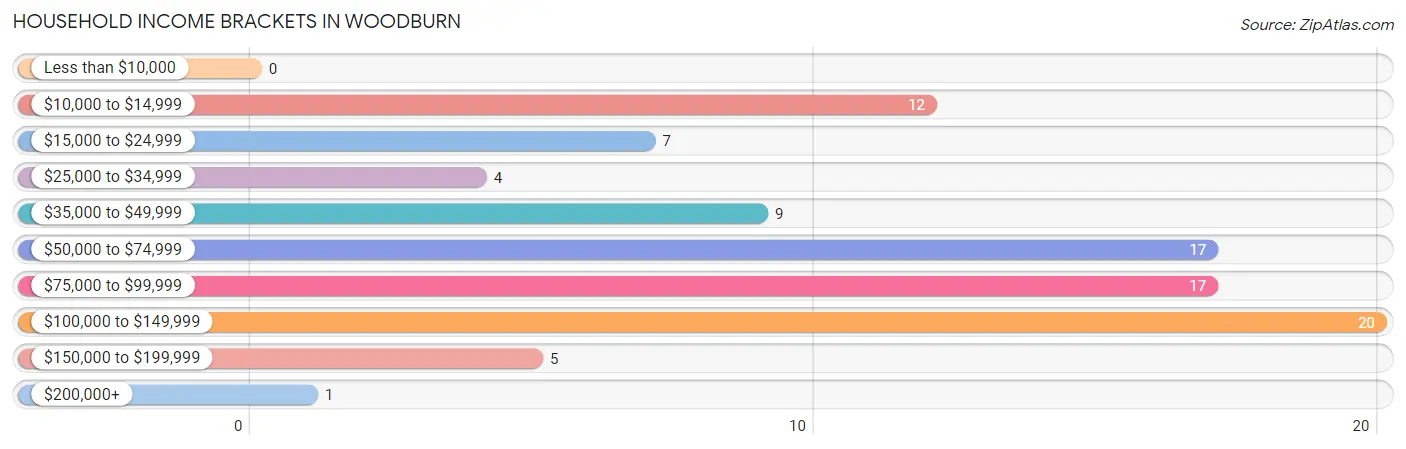
| Income Bracket | # Households | % Households |
| Less than $10,000 | 0 | 0.0% |
| $10,000 to $14,999 | 12 | 13.0% |
| $15,000 to $24,999 | 7 | 7.6% |
| $25,000 to $34,999 | 4 | 4.3% |
| $35,000 to $49,999 | 9 | 9.8% |
| $50,000 to $74,999 | 17 | 18.5% |
| $75,000 to $99,999 | 17 | 18.5% |
| $100,000 to $149,999 | 20 | 21.7% |
| $150,000 to $199,999 | 5 | 5.4% |
| $200,000+ | 1 | 1.1% |
Household Income by Householder Age in Woodburn
The median household income in Woodburn is $66,250, with the highest median household income of $81,250 found in the 25 to 44 years age bracket for the primary householder. A total of 22 households (23.9%) fall into this category. Meanwhile, the 15 to 24 years age bracket for the primary householder has the lowest median household income of $0, with 2 households (2.2%) in this group.
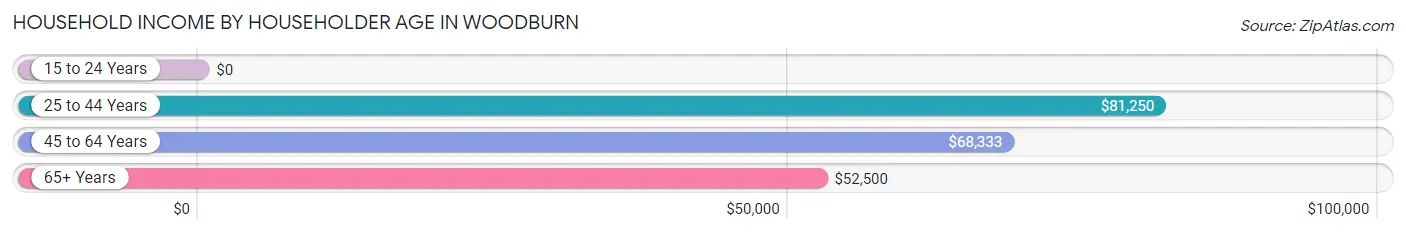
| Income Bracket | # Households | Median Income |
| 15 to 24 Years | 2 (2.2%) | $0 |
| 25 to 44 Years | 22 (23.9%) | $81,250 |
| 45 to 64 Years | 46 (50.0%) | $68,333 |
| 65+ Years | 22 (23.9%) | $52,500 |
| Total | 92 (100.0%) | $66,250 |
Poverty in Woodburn
Income Below Poverty by Sex and Age in Woodburn
With 8.4% poverty level for males and 11.0% for females among the residents of Woodburn, 15 year old males and 18 to 24 year old females are the most vulnerable to poverty, with 2 males (100.0%) and 2 females (100.0%) in their respective age groups living below the poverty level.
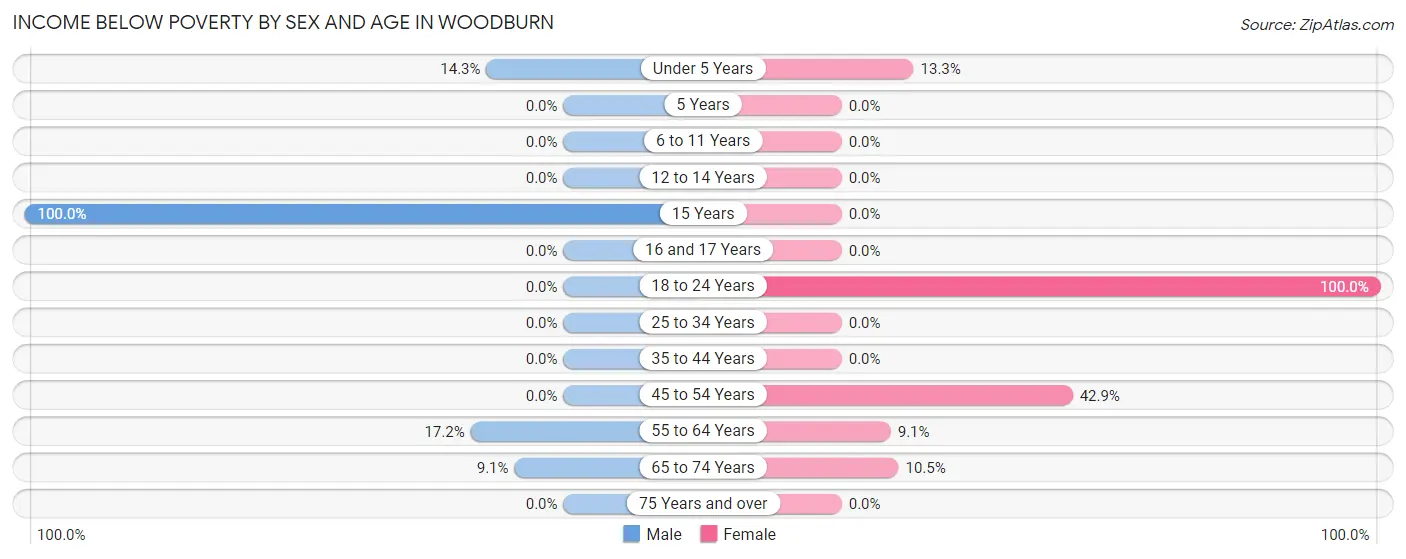
| Age Bracket | Male | Female |
| Under 5 Years | 2 (14.3%) | 2 (13.3%) |
| 5 Years | 0 (0.0%) | 0 (0.0%) |
| 6 to 11 Years | 0 (0.0%) | 0 (0.0%) |
| 12 to 14 Years | 0 (0.0%) | 0 (0.0%) |
| 15 Years | 2 (100.0%) | 0 (0.0%) |
| 16 and 17 Years | 0 (0.0%) | 0 (0.0%) |
| 18 to 24 Years | 0 (0.0%) | 2 (100.0%) |
| 25 to 34 Years | 0 (0.0%) | 0 (0.0%) |
| 35 to 44 Years | 0 (0.0%) | 0 (0.0%) |
| 45 to 54 Years | 0 (0.0%) | 6 (42.9%) |
| 55 to 64 Years | 5 (17.2%) | 3 (9.1%) |
| 65 to 74 Years | 1 (9.1%) | 2 (10.5%) |
| 75 Years and over | 0 (0.0%) | 0 (0.0%) |
| Total | 10 (8.4%) | 15 (11.0%) |
Income Above Poverty by Sex and Age in Woodburn
According to the poverty statistics in Woodburn, males aged 6 to 11 years and females aged 6 to 11 years are the age groups that are most secure financially, with 100.0% of males and 100.0% of females in these age groups living above the poverty line.
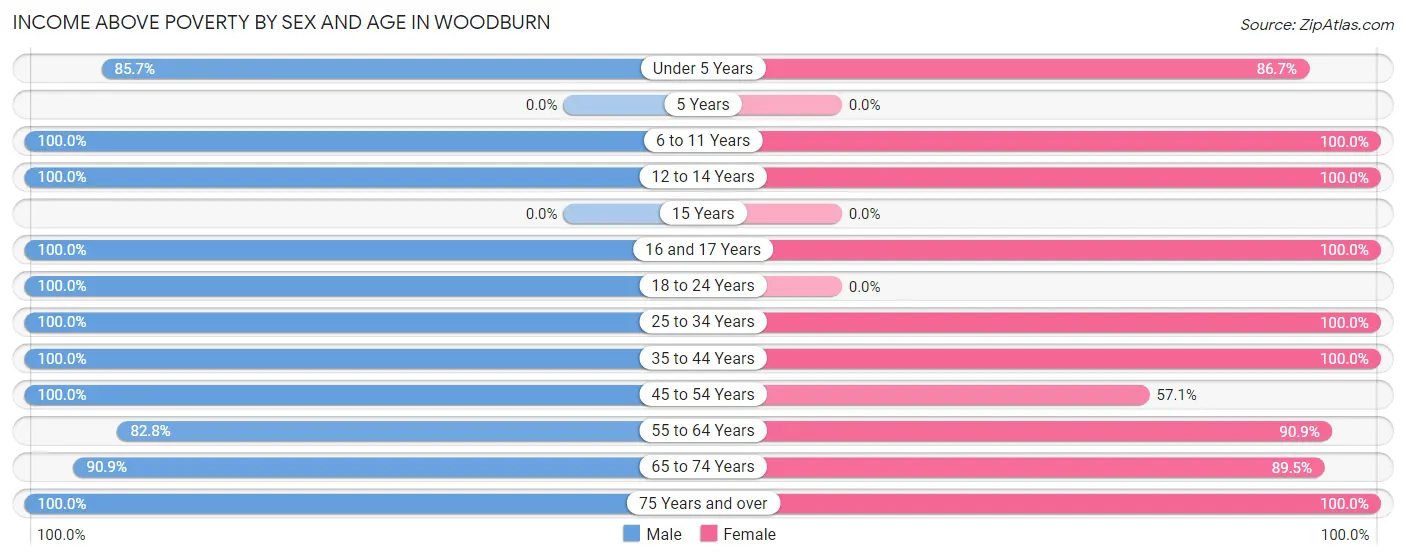
| Age Bracket | Male | Female |
| Under 5 Years | 12 (85.7%) | 13 (86.7%) |
| 5 Years | 0 (0.0%) | 0 (0.0%) |
| 6 to 11 Years | 5 (100.0%) | 12 (100.0%) |
| 12 to 14 Years | 4 (100.0%) | 8 (100.0%) |
| 15 Years | 0 (0.0%) | 0 (0.0%) |
| 16 and 17 Years | 2 (100.0%) | 1 (100.0%) |
| 18 to 24 Years | 10 (100.0%) | 0 (0.0%) |
| 25 to 34 Years | 15 (100.0%) | 15 (100.0%) |
| 35 to 44 Years | 9 (100.0%) | 13 (100.0%) |
| 45 to 54 Years | 15 (100.0%) | 8 (57.1%) |
| 55 to 64 Years | 24 (82.8%) | 30 (90.9%) |
| 65 to 74 Years | 10 (90.9%) | 17 (89.5%) |
| 75 Years and over | 3 (100.0%) | 5 (100.0%) |
| Total | 109 (91.6%) | 122 (89.0%) |
Income Below Poverty Among Married-Couple Families in Woodburn
The poverty statistics for married-couple families in Woodburn show that 9.2% or 6 of the total 65 families live below the poverty line. Families with 1 or 2 children have the highest poverty rate of 16.7%, comprising of 4 families. On the other hand, families with 3 or 4 children have the lowest poverty rate of 0.0%, which includes 0 families.
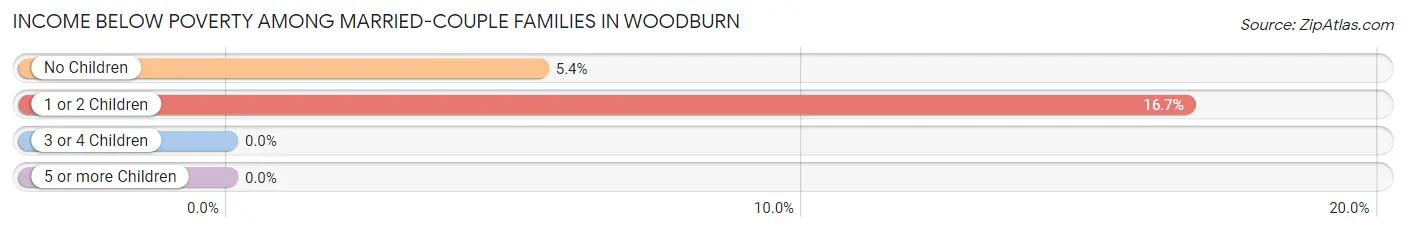
| Children | Above Poverty | Below Poverty |
| No Children | 35 (94.6%) | 2 (5.4%) |
| 1 or 2 Children | 20 (83.3%) | 4 (16.7%) |
| 3 or 4 Children | 4 (100.0%) | 0 (0.0%) |
| 5 or more Children | 0 (0.0%) | 0 (0.0%) |
| Total | 59 (90.8%) | 6 (9.2%) |
Income Below Poverty Among Single-Parent Households in Woodburn
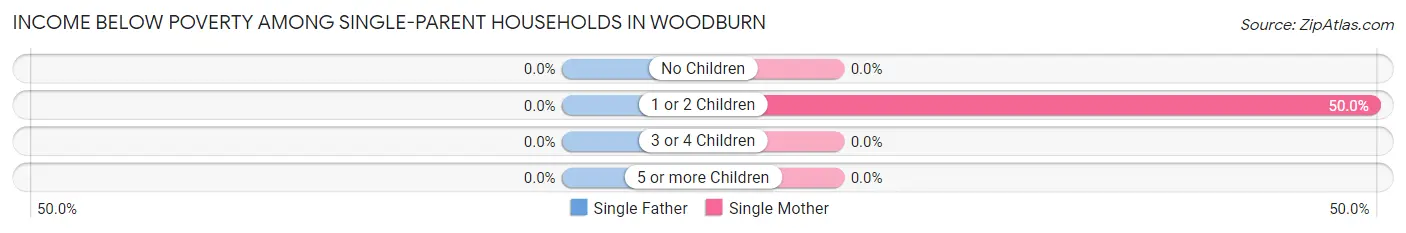
| Children | Single Father | Single Mother |
| No Children | 0 (0.0%) | 0 (0.0%) |
| 1 or 2 Children | 0 (0.0%) | 2 (50.0%) |
| 3 or 4 Children | 0 (0.0%) | 0 (0.0%) |
| 5 or more Children | 0 (0.0%) | 0 (0.0%) |
| Total | 0 (0.0%) | 2 (18.2%) |
Income Below Poverty Among Married-Couple vs Single-Parent Households in Woodburn
The poverty data for Woodburn shows that 6 of the married-couple family households (9.2%) and 2 of the single-parent households (13.3%) are living below the poverty level. Within the married-couple family households, those with 1 or 2 children have the highest poverty rate, with 4 households (16.7%) falling below the poverty line. Among the single-parent households, those with 1 or 2 children have the highest poverty rate, with 2 household (25.0%) living below poverty.
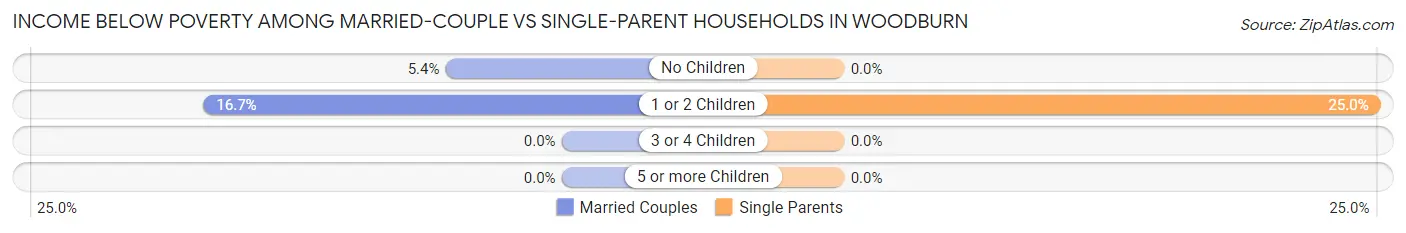
| Children | Married-Couple Families | Single-Parent Households |
| No Children | 2 (5.4%) | 0 (0.0%) |
| 1 or 2 Children | 4 (16.7%) | 2 (25.0%) |
| 3 or 4 Children | 0 (0.0%) | 0 (0.0%) |
| 5 or more Children | 0 (0.0%) | 0 (0.0%) |
| Total | 6 (9.2%) | 2 (13.3%) |
Race in Woodburn
The most populous races in Woodburn are White / Caucasian (303 | 99.0%), and Two or more Races (3 | 1.0%).
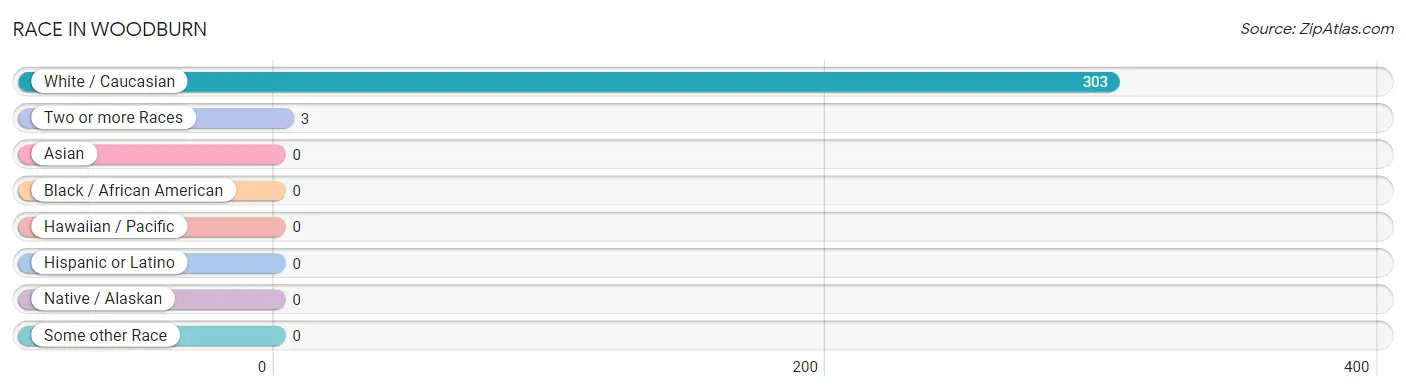
| Race | # Population | % Population |
| Asian | 0 | 0.0% |
| Black / African American | 0 | 0.0% |
| Hawaiian / Pacific | 0 | 0.0% |
| Hispanic or Latino | 0 | 0.0% |
| Native / Alaskan | 0 | 0.0% |
| White / Caucasian | 303 | 99.0% |
| Two or more Races | 3 | 1.0% |
| Some other Race | 0 | 0.0% |
| Total | 306 | 100.0% |
Ancestry in Woodburn
The most populous ancestries reported in Woodburn are English (38 | 12.4%), Irish (35 | 11.4%), German (26 | 8.5%), American (21 | 6.9%), and Scottish (12 | 3.9%), together accounting for 43.1% of all Woodburn residents.
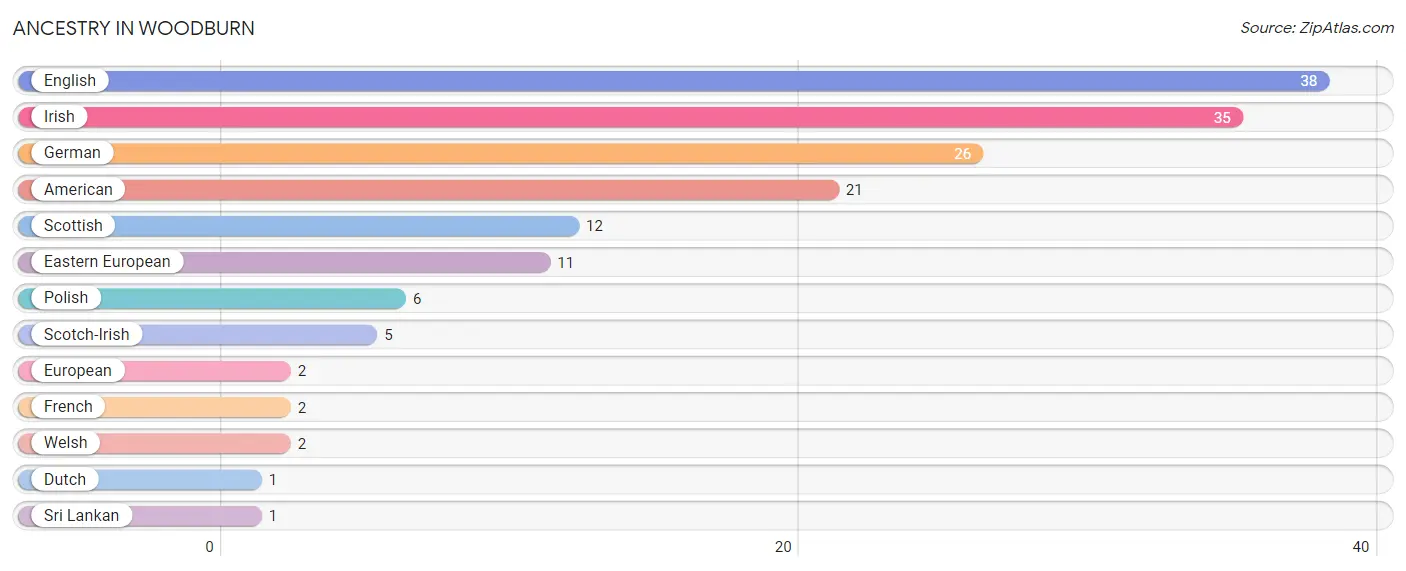
| Ancestry | # Population | % Population |
| American | 21 | 6.9% |
| Dutch | 1 | 0.3% |
| Eastern European | 11 | 3.6% |
| English | 38 | 12.4% |
| European | 2 | 0.6% |
| French | 2 | 0.6% |
| German | 26 | 8.5% |
| Irish | 35 | 11.4% |
| Polish | 6 | 2.0% |
| Scotch-Irish | 5 | 1.6% |
| Scottish | 12 | 3.9% |
| Sri Lankan | 1 | 0.3% |
| Welsh | 2 | 0.6% | View All 13 Rows |
Immigrants in Woodburn

| Immigration Origin | # Population | % Population | View All 0 Rows |
Sex and Age in Woodburn
Sex and Age in Woodburn
The most populous age groups in Woodburn are 55 to 59 Years (19 | 16.0%) for men and 65 to 69 Years (38 | 20.3%) for women.
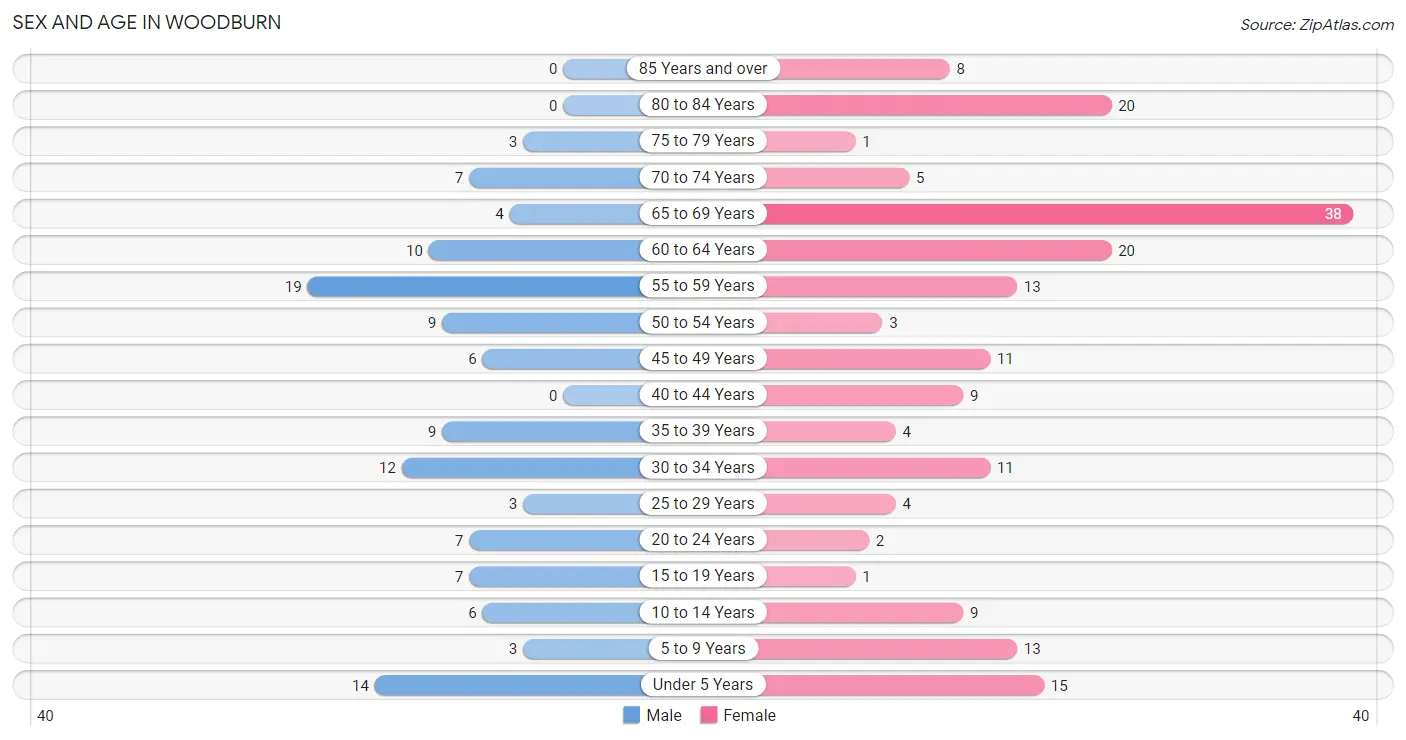
| Age Bracket | Male | Female |
| Under 5 Years | 14 (11.8%) | 15 (8.0%) |
| 5 to 9 Years | 3 (2.5%) | 13 (7.0%) |
| 10 to 14 Years | 6 (5.0%) | 9 (4.8%) |
| 15 to 19 Years | 7 (5.9%) | 1 (0.5%) |
| 20 to 24 Years | 7 (5.9%) | 2 (1.1%) |
| 25 to 29 Years | 3 (2.5%) | 4 (2.1%) |
| 30 to 34 Years | 12 (10.1%) | 11 (5.9%) |
| 35 to 39 Years | 9 (7.6%) | 4 (2.1%) |
| 40 to 44 Years | 0 (0.0%) | 9 (4.8%) |
| 45 to 49 Years | 6 (5.0%) | 11 (5.9%) |
| 50 to 54 Years | 9 (7.6%) | 3 (1.6%) |
| 55 to 59 Years | 19 (16.0%) | 13 (7.0%) |
| 60 to 64 Years | 10 (8.4%) | 20 (10.7%) |
| 65 to 69 Years | 4 (3.4%) | 38 (20.3%) |
| 70 to 74 Years | 7 (5.9%) | 5 (2.7%) |
| 75 to 79 Years | 3 (2.5%) | 1 (0.5%) |
| 80 to 84 Years | 0 (0.0%) | 20 (10.7%) |
| 85 Years and over | 0 (0.0%) | 8 (4.3%) |
| Total | 119 (100.0%) | 187 (100.0%) |
Families and Households in Woodburn
Median Family Size in Woodburn
The median family size in Woodburn is 3.04 persons per family, with single female/mother families (11 | 13.8%) accounting for the largest median family size of 3.36 persons per family. On the other hand, single male/father families (4 | 5.0%) represent the smallest median family size with 2.25 persons per family.
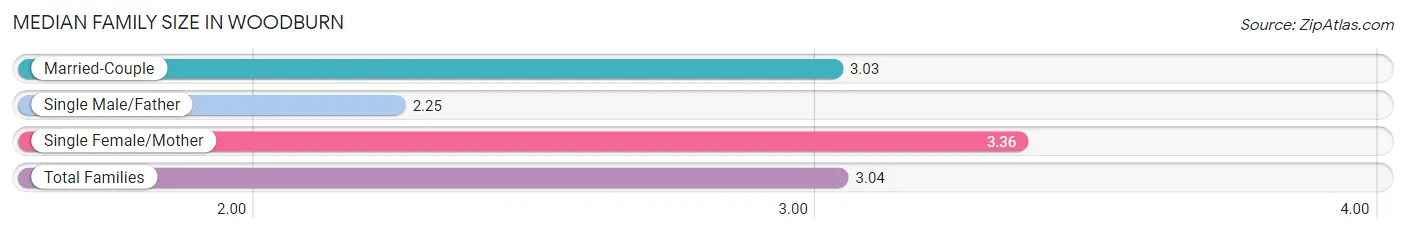
| Family Type | # Families | Family Size |
| Married-Couple | 65 (81.2%) | 3.03 |
| Single Male/Father | 4 (5.0%) | 2.25 |
| Single Female/Mother | 11 (13.8%) | 3.36 |
| Total Families | 80 (100.0%) | 3.04 |
Median Household Size in Woodburn
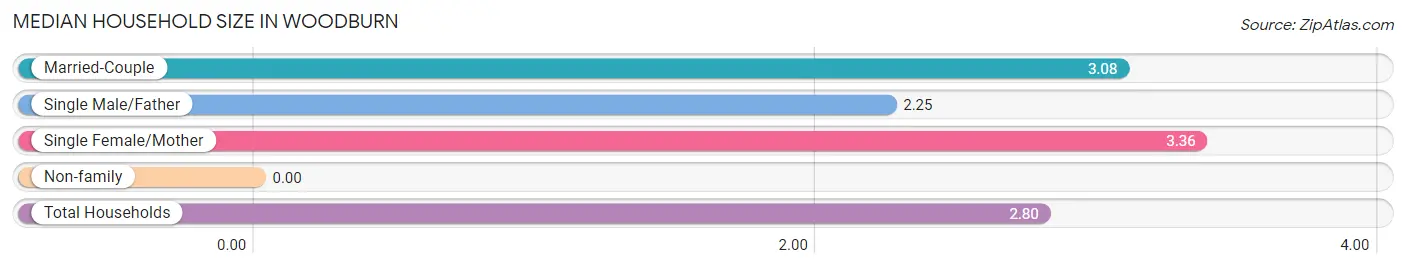
| Household Type | # Households | Household Size |
| Married-Couple | 65 (70.7%) | 3.08 |
| Single Male/Father | 4 (4.3%) | 2.25 |
| Single Female/Mother | 11 (12.0%) | 3.36 |
| Non-family | 12 (13.0%) | - |
| Total Households | 92 (100.0%) | 2.80 |
Household Size by Marriage Status in Woodburn
Out of a total of 92 households in Woodburn, 80 (87.0%) are family households, while 12 (13.0%) are nonfamily households. The most numerous type of family households are 2-person households, comprising 43, and the most common type of nonfamily households are 1-person households, comprising 12.
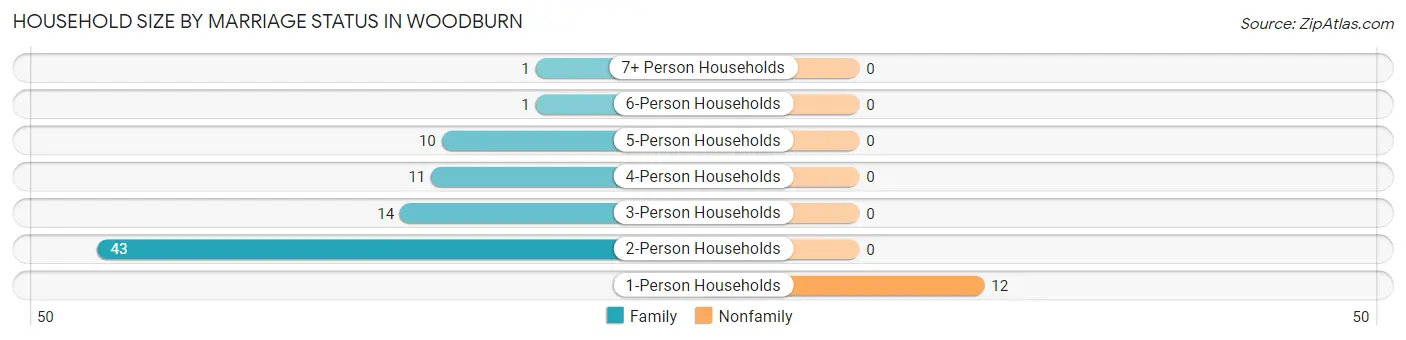
| Household Size | Family Households | Nonfamily Households |
| 1-Person Households | - | 12 (13.0%) |
| 2-Person Households | 43 (46.7%) | 0 (0.0%) |
| 3-Person Households | 14 (15.2%) | 0 (0.0%) |
| 4-Person Households | 11 (12.0%) | 0 (0.0%) |
| 5-Person Households | 10 (10.9%) | 0 (0.0%) |
| 6-Person Households | 1 (1.1%) | 0 (0.0%) |
| 7+ Person Households | 1 (1.1%) | 0 (0.0%) |
| Total | 80 (87.0%) | 12 (13.0%) |
Female Fertility in Woodburn
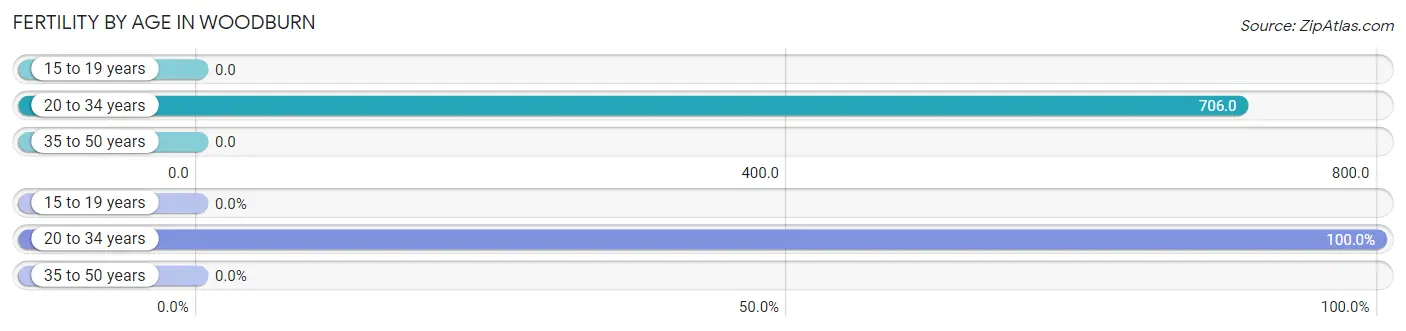
Fertility by Age in Woodburn
Average fertility rate in Woodburn is 273.0 births per 1,000 women. Women in the age bracket of 20 to 34 years have the highest fertility rate with 706.0 births per 1,000 women. Women in the age bracket of 20 to 34 years acount for 100.0% of all women with births.
| Age Bracket | Women with Births | Births / 1,000 Women |
| 15 to 19 years | 0 (0.0%) | 0.0 |
| 20 to 34 years | 12 (100.0%) | 706.0 |
| 35 to 50 years | 0 (0.0%) | 0.0 |
| Total | 12 (100.0%) | 273.0 |
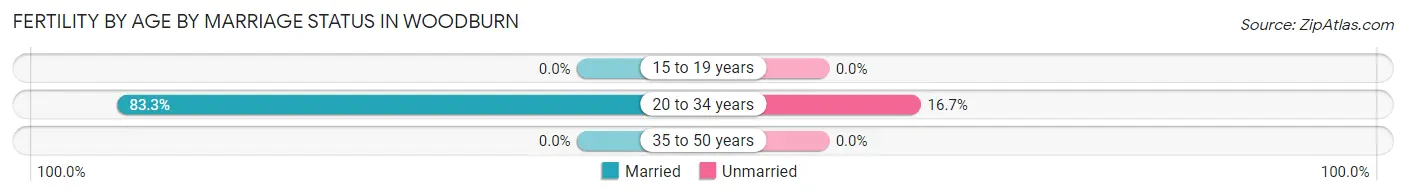
Fertility by Age by Marriage Status in Woodburn
83.3% of women with births (12) in Woodburn are married. The highest percentage of unmarried women with births falls into 20 to 34 years age bracket with 16.7% of them unmarried at the time of birth, while the lowest percentage of unmarried women with births belong to 20 to 34 years age bracket with 16.7% of them unmarried.
| Age Bracket | Married | Unmarried |
| 15 to 19 years | 0 (0.0%) | 0 (0.0%) |
| 20 to 34 years | 10 (83.3%) | 2 (16.7%) |
| 35 to 50 years | 0 (0.0%) | 0 (0.0%) |
| Total | 10 (83.3%) | 2 (16.7%) |
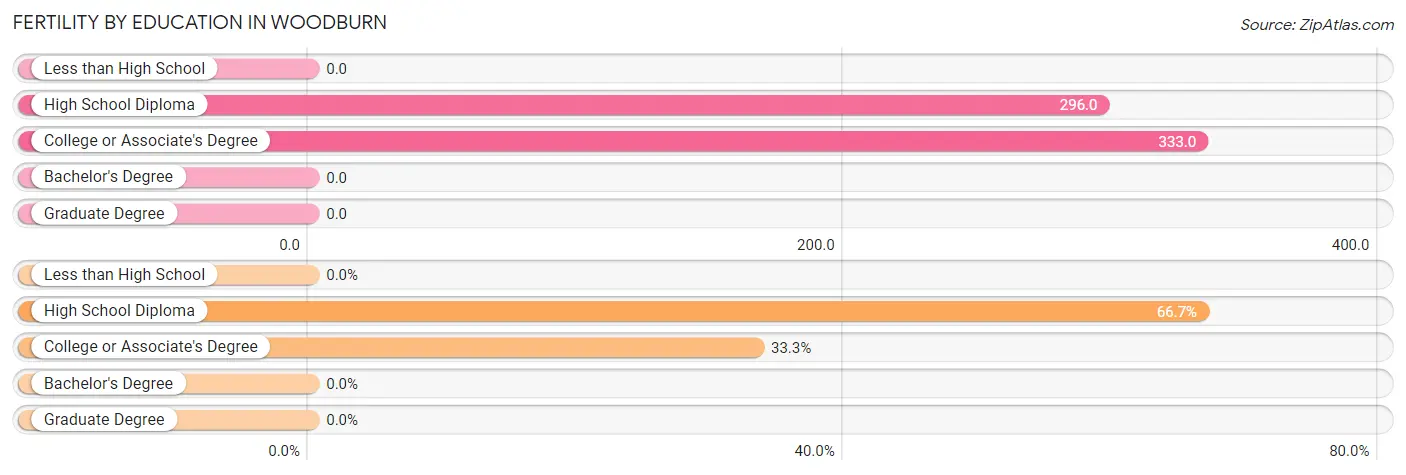
Fertility by Education in Woodburn
| Educational Attainment | Women with Births | Births / 1,000 Women |
| Less than High School | 0 (0.0%) | 0.0 |
| High School Diploma | 8 (66.7%) | 296.0 |
| College or Associate's Degree | 4 (33.3%) | 333.0 |
| Bachelor's Degree | 0 (0.0%) | 0.0 |
| Graduate Degree | 0 (0.0%) | 0.0 |
| Total | 12 (100.0%) | 273.0 |
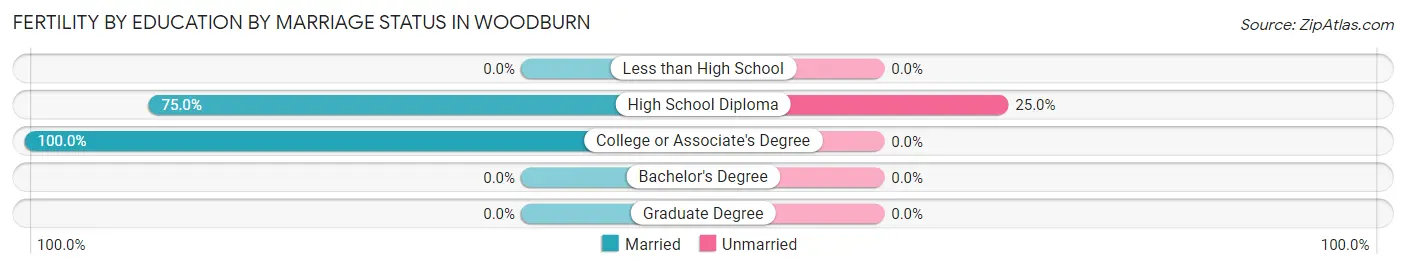
Fertility by Education by Marriage Status in Woodburn
16.7% of women with births in Woodburn are unmarried. Women with the educational attainment of college or associate's degree are most likely to be married with 100.0% of them married at childbirth, while women with the educational attainment of high school diploma are least likely to be married with 25.0% of them unmarried at childbirth.
| Educational Attainment | Married | Unmarried |
| Less than High School | 0 (0.0%) | 0 (0.0%) |
| High School Diploma | 6 (75.0%) | 2 (25.0%) |
| College or Associate's Degree | 4 (100.0%) | 0 (0.0%) |
| Bachelor's Degree | 0 (0.0%) | 0 (0.0%) |
| Graduate Degree | 0 (0.0%) | 0 (0.0%) |
| Total | 10 (83.3%) | 2 (16.7%) |
Employment Characteristics in Woodburn
Employment by Class of Employer in Woodburn
Among the 107 employed individuals in Woodburn, private company employees (89 | 83.2%), not-for-profit organizations (7 | 6.5%), and self-employed (incorporated) (4 | 3.7%) make up the most common classes of employment.
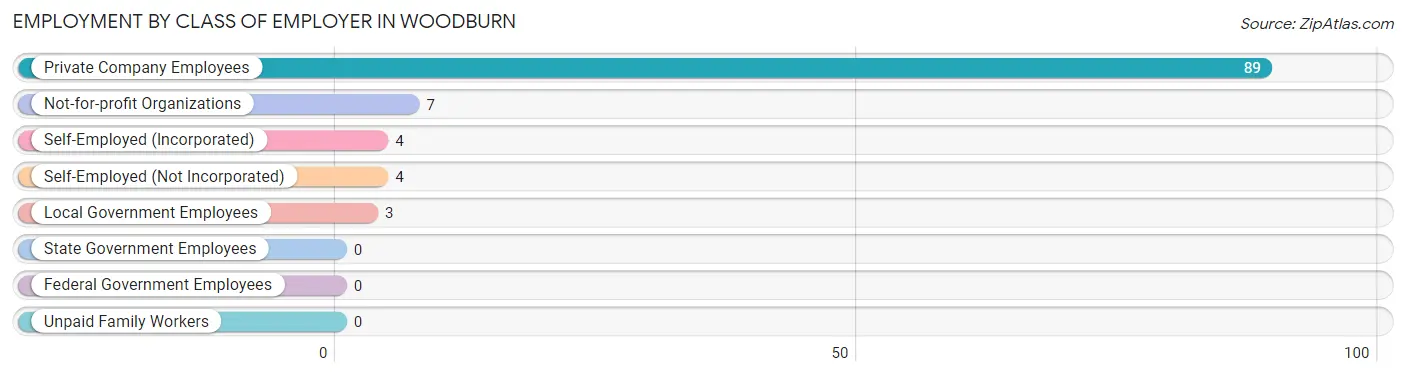
| Employer Class | # Employees | % Employees |
| Private Company Employees | 89 | 83.2% |
| Self-Employed (Incorporated) | 4 | 3.7% |
| Self-Employed (Not Incorporated) | 4 | 3.7% |
| Not-for-profit Organizations | 7 | 6.5% |
| Local Government Employees | 3 | 2.8% |
| State Government Employees | 0 | 0.0% |
| Federal Government Employees | 0 | 0.0% |
| Unpaid Family Workers | 0 | 0.0% |
| Total | 107 | 100.0% |
Employment Status by Age in Woodburn
According to the labor force statistics for Woodburn, out of the total population over 16 years of age (244), 47.1% or 115 individuals are in the labor force, with 5.2% or 6 of them unemployed. The age group with the highest labor force participation rate is 35 to 44 years, with 90.9% or 20 individuals in the labor force. Within the labor force, the 55 to 59 years age range has the highest percentage of unemployed individuals, with 28.6% or 6 of them being unemployed.
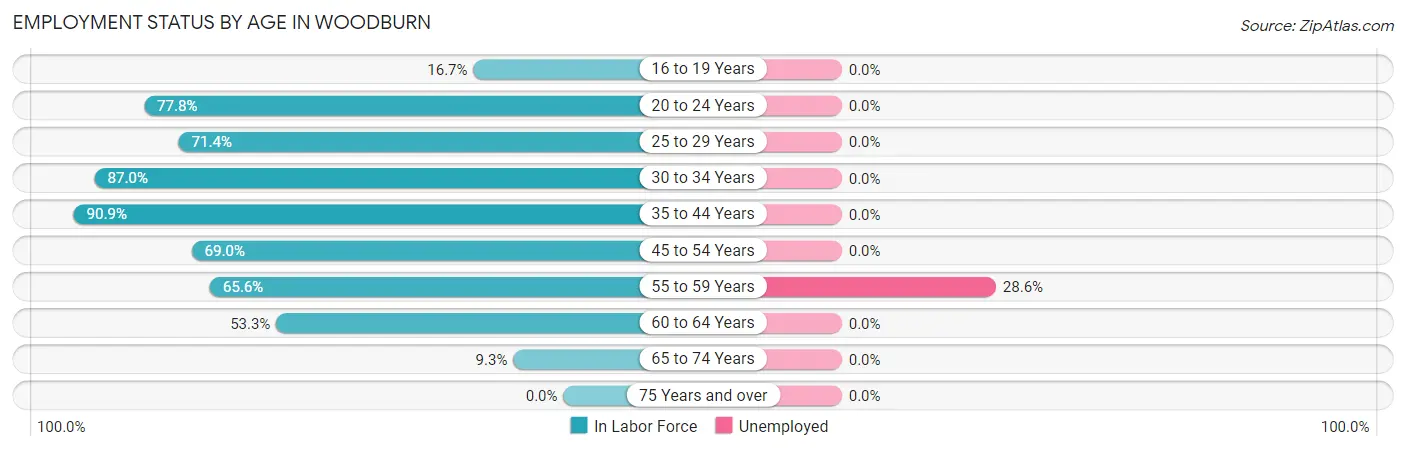
| Age Bracket | In Labor Force | Unemployed |
| 16 to 19 Years | 1 (16.7%) | 0 (0.0%) |
| 20 to 24 Years | 7 (77.8%) | 0 (0.0%) |
| 25 to 29 Years | 5 (71.4%) | 0 (0.0%) |
| 30 to 34 Years | 20 (87.0%) | 0 (0.0%) |
| 35 to 44 Years | 20 (90.9%) | 0 (0.0%) |
| 45 to 54 Years | 20 (69.0%) | 0 (0.0%) |
| 55 to 59 Years | 21 (65.6%) | 6 (28.6%) |
| 60 to 64 Years | 16 (53.3%) | 0 (0.0%) |
| 65 to 74 Years | 5 (9.3%) | 0 (0.0%) |
| 75 Years and over | 0 (0.0%) | 0 (0.0%) |
| Total | 115 (47.1%) | 6 (5.2%) |
Employment Status by Educational Attainment in Woodburn
According to labor force statistics for Woodburn, 71.3% of individuals (102) out of the total population between 25 and 64 years of age (143) are in the labor force, with 5.9% or 6 of them being unemployed. The group with the highest labor force participation rate are those with the educational attainment of bachelor's degree or higher, with 83.3% or 15 individuals in the labor force. Within the labor force, individuals with bachelor's degree or higher education have the highest percentage of unemployment, with 40.0% or 6 of them being unemployed.
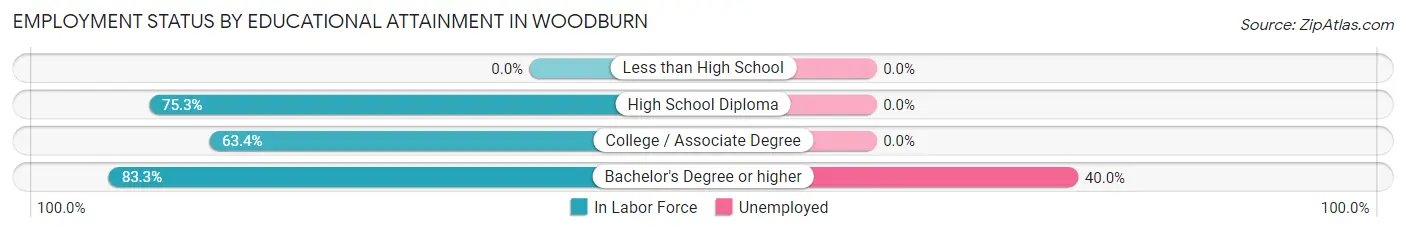
| Educational Attainment | In Labor Force | Unemployed |
| Less than High School | 0 (0.0%) | 0 (0.0%) |
| High School Diploma | 61 (75.3%) | 0 (0.0%) |
| College / Associate Degree | 26 (63.4%) | 0 (0.0%) |
| Bachelor's Degree or higher | 15 (83.3%) | 7 (40.0%) |
| Total | 102 (71.3%) | 8 (5.9%) |
Employment Occupations by Sex in Woodburn
Management, Business, Science and Arts Occupations
The most common Management, Business, Science and Arts occupations in Woodburn are Community & Social Service (6 | 5.5%), Education Instruction & Library (5 | 4.6%), Health Diagnosing & Treating (5 | 4.6%), Computers, Engineering & Science (4 | 3.7%), and Computers & Mathematics (2 | 1.8%).
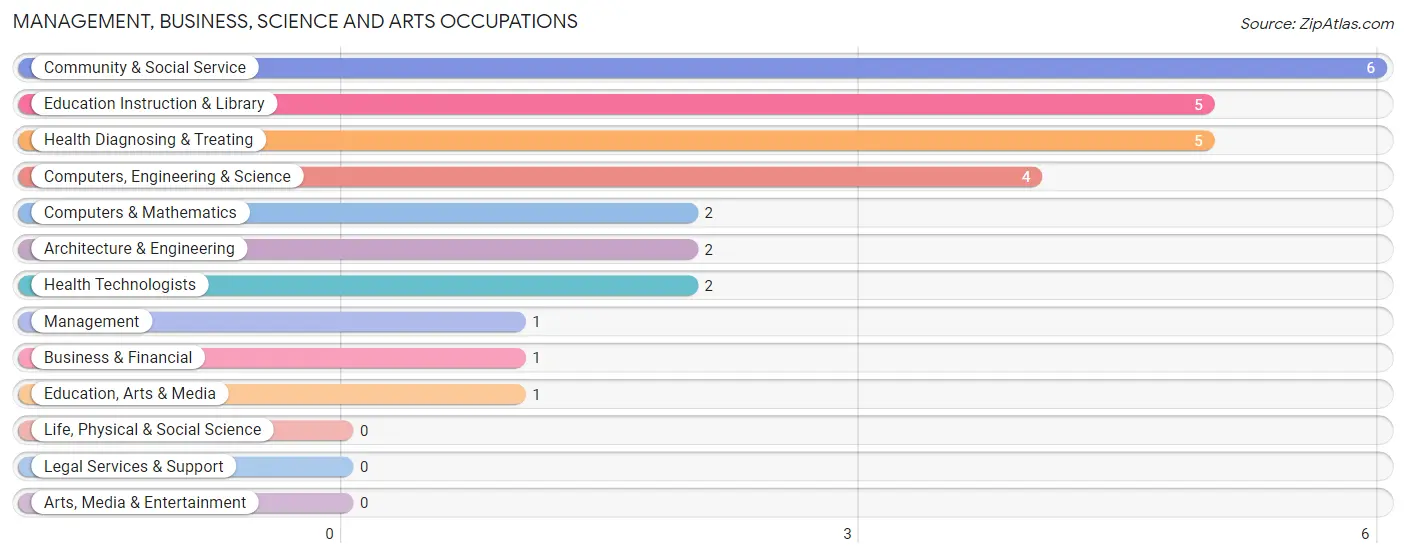
Management, Business, Science and Arts Occupations by Sex
Within the Management, Business, Science and Arts occupations in Woodburn, the most male-oriented occupations are Management (100.0%), Business & Financial (100.0%), and Architecture & Engineering (100.0%), while the most female-oriented occupations are Computers & Mathematics (100.0%), Education Instruction & Library (100.0%), and Health Diagnosing & Treating (100.0%).
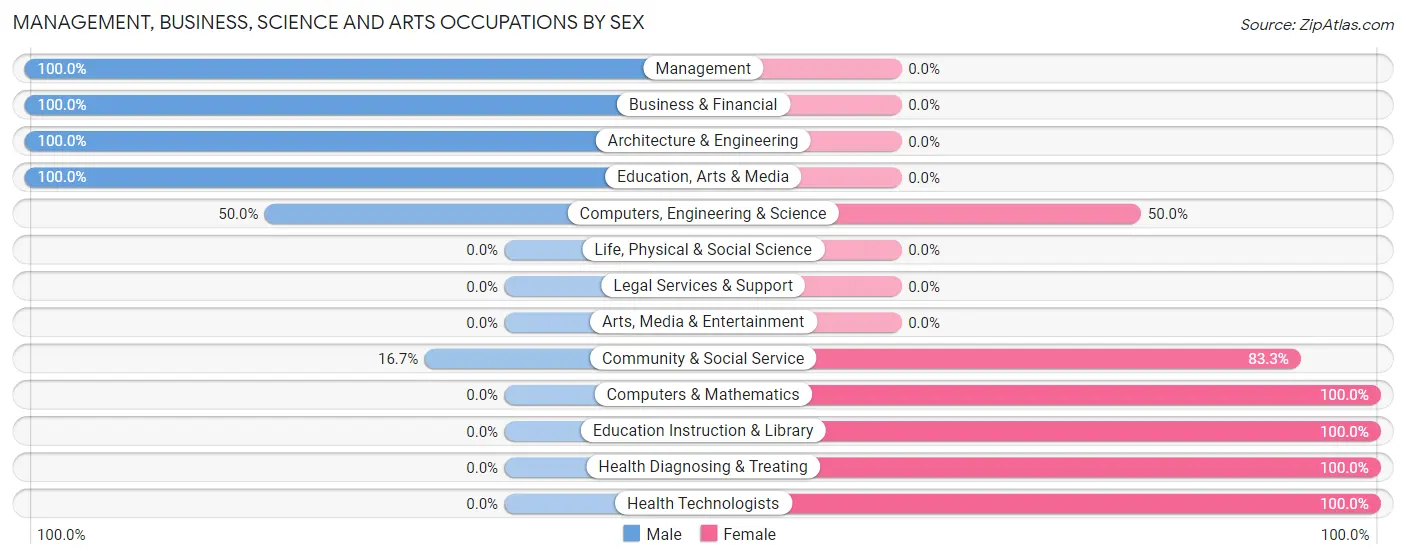
| Occupation | Male | Female |
| Management | 1 (100.0%) | 0 (0.0%) |
| Business & Financial | 1 (100.0%) | 0 (0.0%) |
| Computers, Engineering & Science | 2 (50.0%) | 2 (50.0%) |
| Computers & Mathematics | 0 (0.0%) | 2 (100.0%) |
| Architecture & Engineering | 2 (100.0%) | 0 (0.0%) |
| Life, Physical & Social Science | 0 (0.0%) | 0 (0.0%) |
| Community & Social Service | 1 (16.7%) | 5 (83.3%) |
| Education, Arts & Media | 1 (100.0%) | 0 (0.0%) |
| Legal Services & Support | 0 (0.0%) | 0 (0.0%) |
| Education Instruction & Library | 0 (0.0%) | 5 (100.0%) |
| Arts, Media & Entertainment | 0 (0.0%) | 0 (0.0%) |
| Health Diagnosing & Treating | 0 (0.0%) | 5 (100.0%) |
| Health Technologists | 0 (0.0%) | 2 (100.0%) |
| Total (Category) | 5 (29.4%) | 12 (70.6%) |
| Total (Overall) | 71 (65.1%) | 38 (34.9%) |
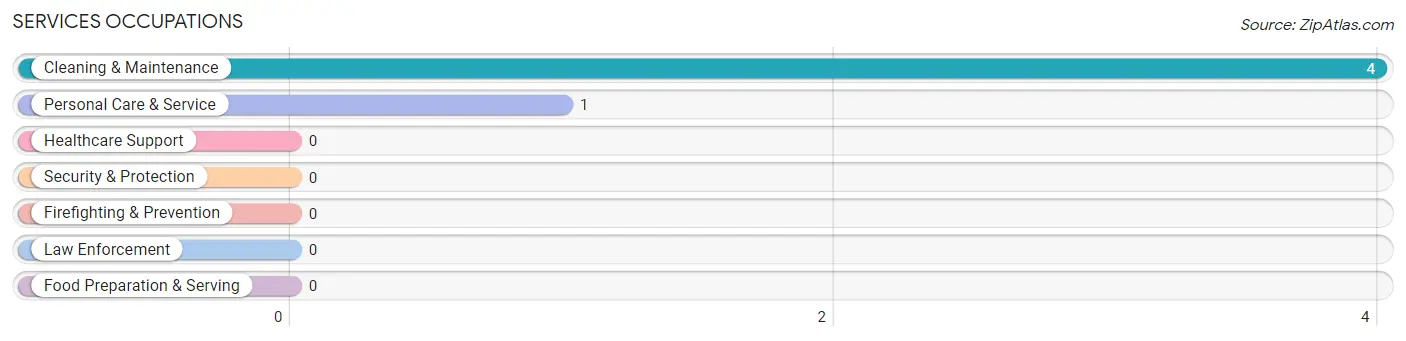
Services Occupations
The most common Services occupations in Woodburn are Cleaning & Maintenance (4 | 3.7%), and Personal Care & Service (1 | 0.9%).
Services Occupations by Sex
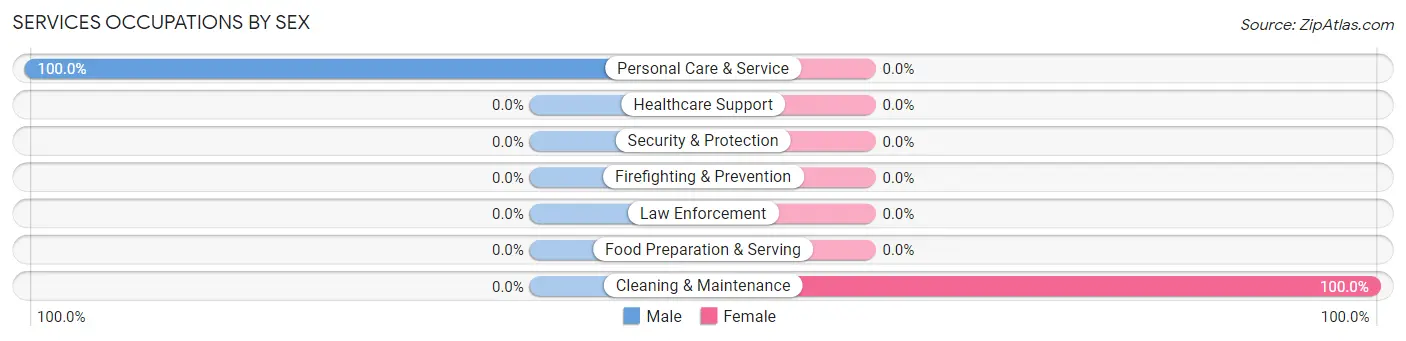
| Occupation | Male | Female |
| Healthcare Support | 0 (0.0%) | 0 (0.0%) |
| Security & Protection | 0 (0.0%) | 0 (0.0%) |
| Firefighting & Prevention | 0 (0.0%) | 0 (0.0%) |
| Law Enforcement | 0 (0.0%) | 0 (0.0%) |
| Food Preparation & Serving | 0 (0.0%) | 0 (0.0%) |
| Cleaning & Maintenance | 0 (0.0%) | 4 (100.0%) |
| Personal Care & Service | 1 (100.0%) | 0 (0.0%) |
| Total (Category) | 1 (20.0%) | 4 (80.0%) |
| Total (Overall) | 71 (65.1%) | 38 (34.9%) |
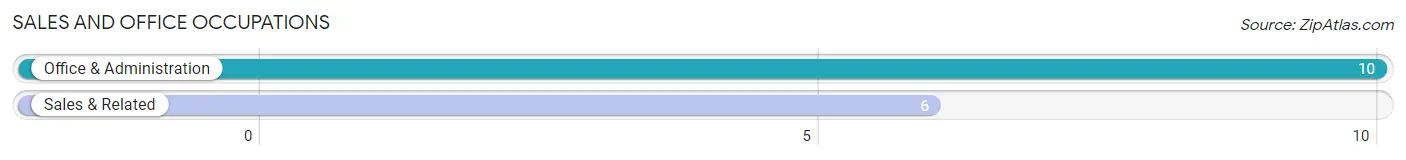
Sales and Office Occupations
The most common Sales and Office occupations in Woodburn are Office & Administration (10 | 9.2%), and Sales & Related (6 | 5.5%).
Sales and Office Occupations by Sex
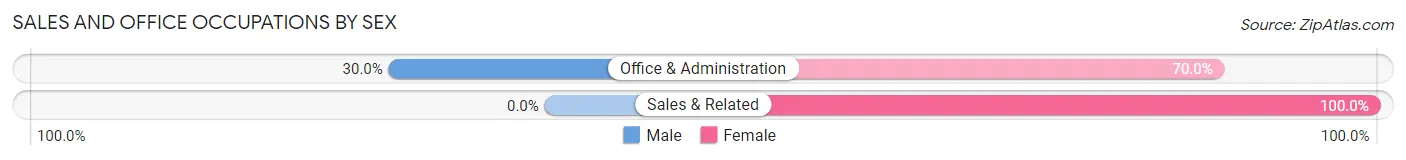
| Occupation | Male | Female |
| Sales & Related | 0 (0.0%) | 6 (100.0%) |
| Office & Administration | 3 (30.0%) | 7 (70.0%) |
| Total (Category) | 3 (18.8%) | 13 (81.2%) |
| Total (Overall) | 71 (65.1%) | 38 (34.9%) |
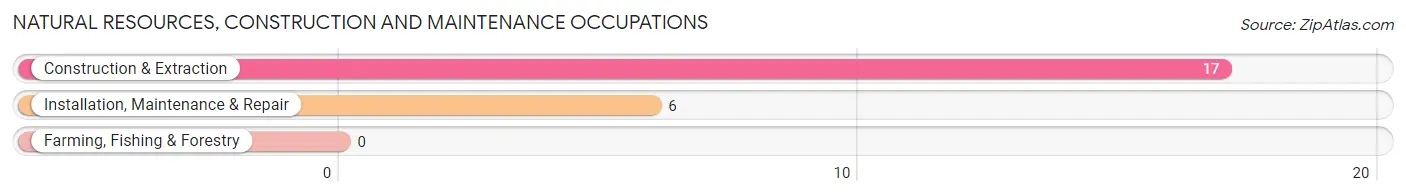
Natural Resources, Construction and Maintenance Occupations
The most common Natural Resources, Construction and Maintenance occupations in Woodburn are Construction & Extraction (17 | 15.6%), and Installation, Maintenance & Repair (6 | 5.5%).
Natural Resources, Construction and Maintenance Occupations by Sex
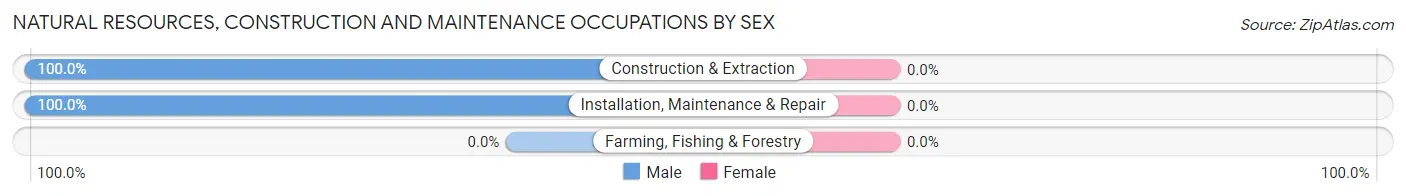
| Occupation | Male | Female |
| Farming, Fishing & Forestry | 0 (0.0%) | 0 (0.0%) |
| Construction & Extraction | 17 (100.0%) | 0 (0.0%) |
| Installation, Maintenance & Repair | 6 (100.0%) | 0 (0.0%) |
| Total (Category) | 23 (100.0%) | 0 (0.0%) |
| Total (Overall) | 71 (65.1%) | 38 (34.9%) |
Production, Transportation and Moving Occupations
The most common Production, Transportation and Moving occupations in Woodburn are Production (26 | 23.8%), Transportation (13 | 11.9%), and Material Moving (9 | 8.3%).
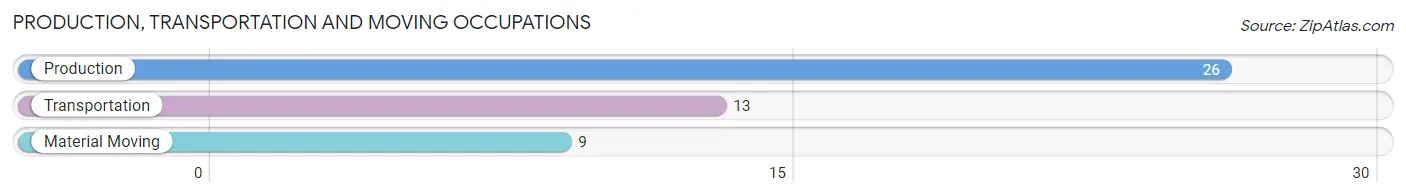
Production, Transportation and Moving Occupations by Sex
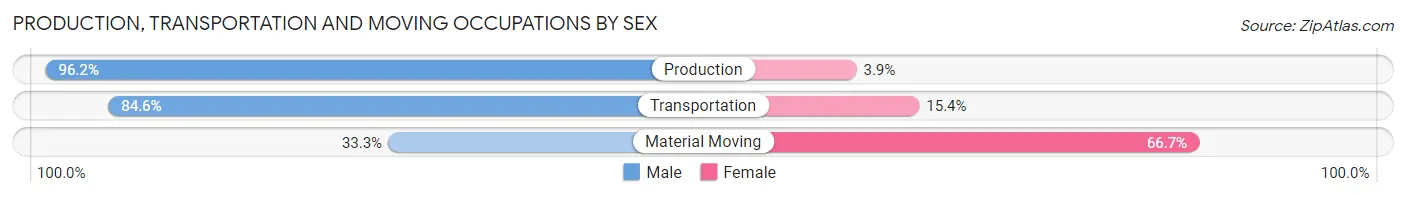
| Occupation | Male | Female |
| Production | 25 (96.2%) | 1 (3.8%) |
| Transportation | 11 (84.6%) | 2 (15.4%) |
| Material Moving | 3 (33.3%) | 6 (66.7%) |
| Total (Category) | 39 (81.2%) | 9 (18.8%) |
| Total (Overall) | 71 (65.1%) | 38 (34.9%) |
Employment Industries by Sex in Woodburn
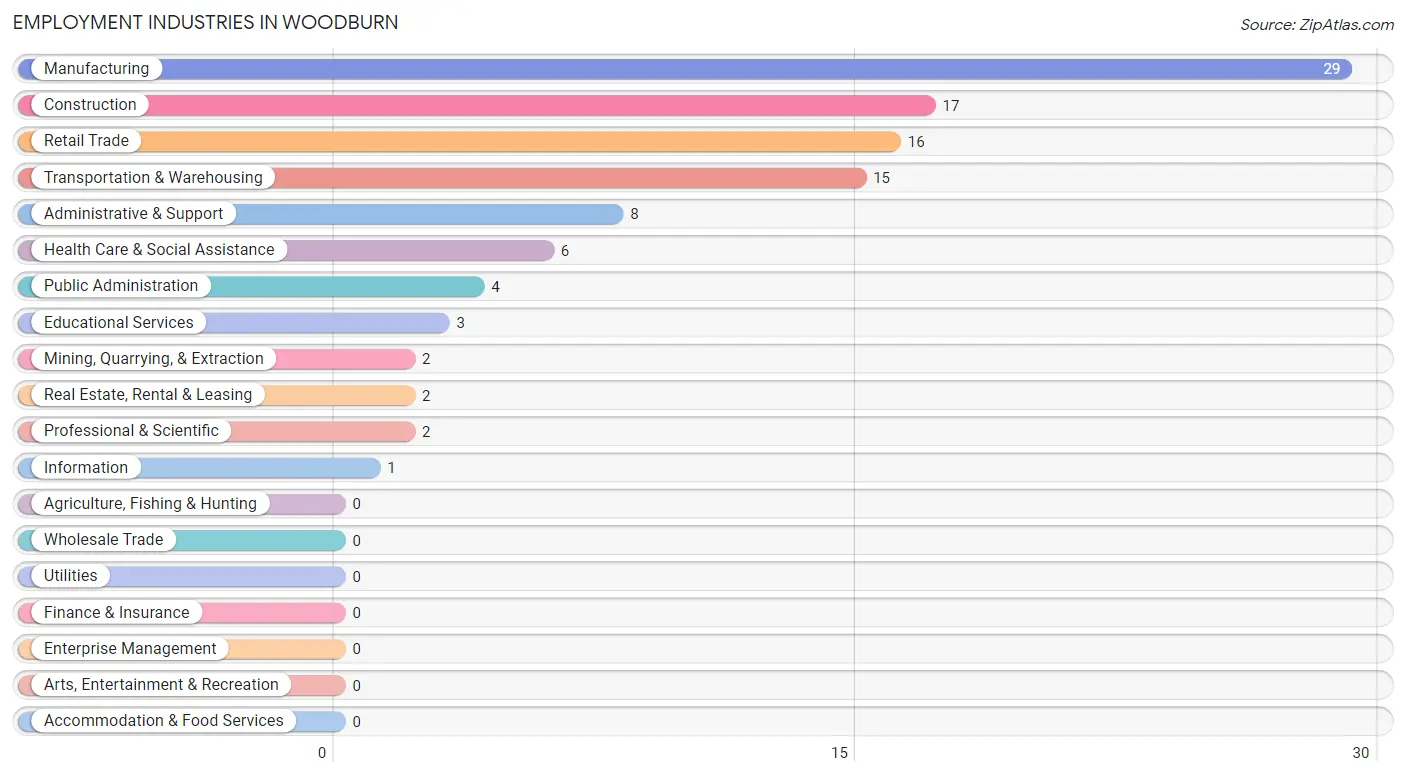
Employment Industries in Woodburn
The major employment industries in Woodburn include Manufacturing (29 | 26.6%), Construction (17 | 15.6%), Retail Trade (16 | 14.7%), Transportation & Warehousing (15 | 13.8%), and Administrative & Support (8 | 7.3%).
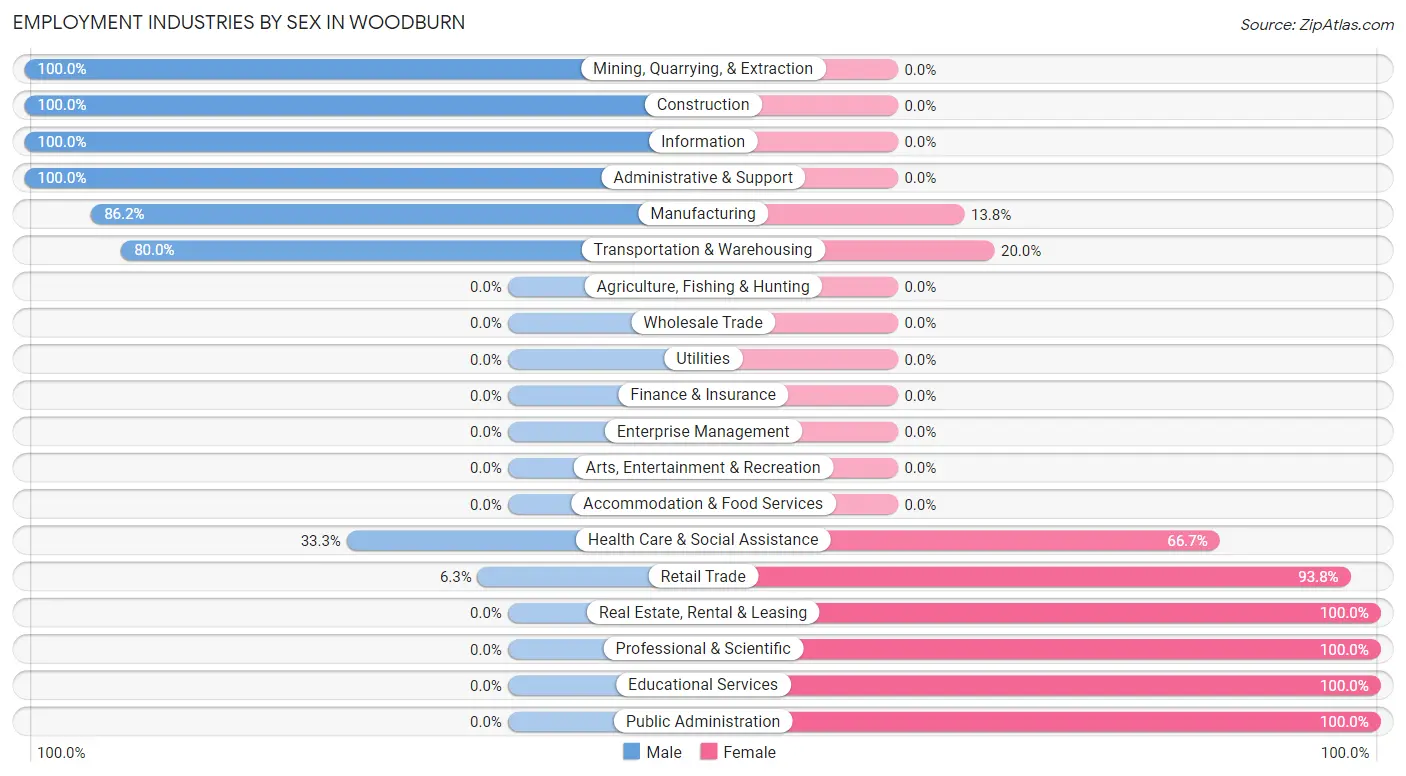
Employment Industries by Sex in Woodburn
The Woodburn industries that see more men than women are Mining, Quarrying, & Extraction (100.0%), Construction (100.0%), and Information (100.0%), whereas the industries that tend to have a higher number of women are Real Estate, Rental & Leasing (100.0%), Professional & Scientific (100.0%), and Educational Services (100.0%).
| Industry | Male | Female |
| Agriculture, Fishing & Hunting | 0 (0.0%) | 0 (0.0%) |
| Mining, Quarrying, & Extraction | 2 (100.0%) | 0 (0.0%) |
| Construction | 17 (100.0%) | 0 (0.0%) |
| Manufacturing | 25 (86.2%) | 4 (13.8%) |
| Wholesale Trade | 0 (0.0%) | 0 (0.0%) |
| Retail Trade | 1 (6.2%) | 15 (93.8%) |
| Transportation & Warehousing | 12 (80.0%) | 3 (20.0%) |
| Utilities | 0 (0.0%) | 0 (0.0%) |
| Information | 1 (100.0%) | 0 (0.0%) |
| Finance & Insurance | 0 (0.0%) | 0 (0.0%) |
| Real Estate, Rental & Leasing | 0 (0.0%) | 2 (100.0%) |
| Professional & Scientific | 0 (0.0%) | 2 (100.0%) |
| Enterprise Management | 0 (0.0%) | 0 (0.0%) |
| Administrative & Support | 8 (100.0%) | 0 (0.0%) |
| Educational Services | 0 (0.0%) | 3 (100.0%) |
| Health Care & Social Assistance | 2 (33.3%) | 4 (66.7%) |
| Arts, Entertainment & Recreation | 0 (0.0%) | 0 (0.0%) |
| Accommodation & Food Services | 0 (0.0%) | 0 (0.0%) |
| Public Administration | 0 (0.0%) | 4 (100.0%) |
| Total | 71 (65.1%) | 38 (34.9%) |
Education in Woodburn
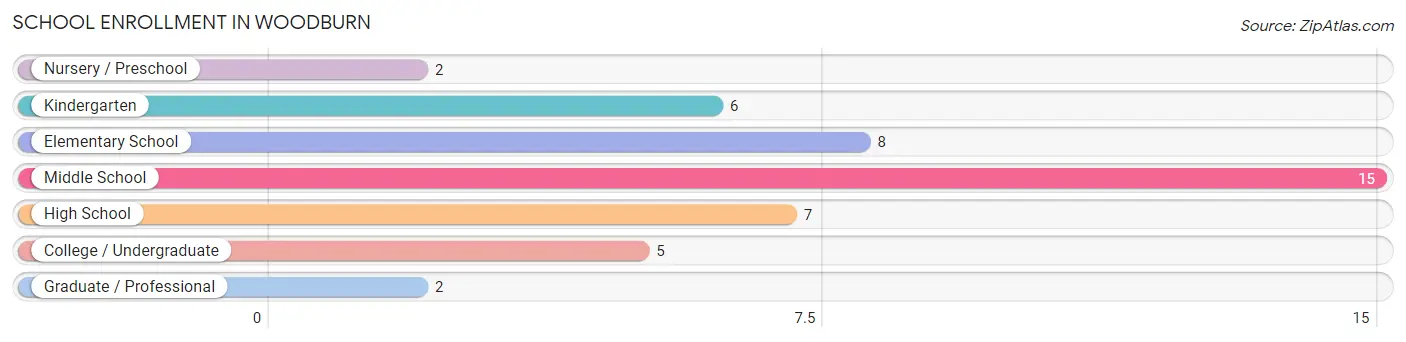
School Enrollment in Woodburn
The most common levels of schooling among the 45 students in Woodburn are middle school (15 | 33.3%), elementary school (8 | 17.8%), and high school (7 | 15.6%).
| School Level | # Students | % Students |
| Nursery / Preschool | 2 | 4.4% |
| Kindergarten | 6 | 13.3% |
| Elementary School | 8 | 17.8% |
| Middle School | 15 | 33.3% |
| High School | 7 | 15.6% |
| College / Undergraduate | 5 | 11.1% |
| Graduate / Professional | 2 | 4.4% |
| Total | 45 | 100.0% |
School Enrollment by Age by Funding Source in Woodburn
Out of a total of 45 students who are enrolled in schools in Woodburn, 10 (22.2%) attend a private institution, while the remaining 35 (77.8%) are enrolled in public schools. The age group of 3 to 4 year olds has the highest likelihood of being enrolled in private schools, with 2 (100.0% in the age bracket) enrolled. Conversely, the age group of 25 to 34 year olds has the lowest likelihood of being enrolled in a private school, with 6 (100.0% in the age bracket) attending a public institution.
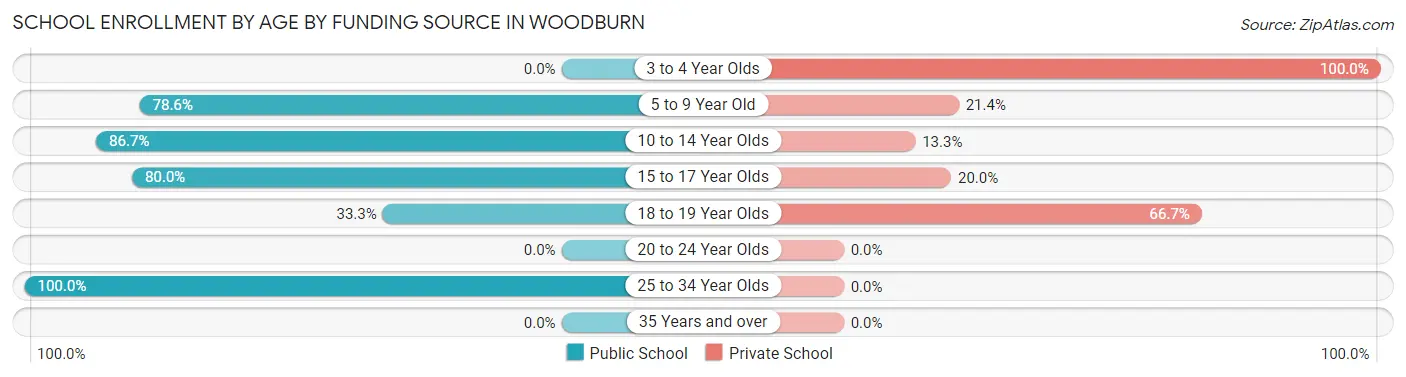
| Age Bracket | Public School | Private School |
| 3 to 4 Year Olds | 0 (0.0%) | 2 (100.0%) |
| 5 to 9 Year Old | 11 (78.6%) | 3 (21.4%) |
| 10 to 14 Year Olds | 13 (86.7%) | 2 (13.3%) |
| 15 to 17 Year Olds | 4 (80.0%) | 1 (20.0%) |
| 18 to 19 Year Olds | 1 (33.3%) | 2 (66.7%) |
| 20 to 24 Year Olds | 0 (0.0%) | 0 (0.0%) |
| 25 to 34 Year Olds | 6 (100.0%) | 0 (0.0%) |
| 35 Years and over | 0 (0.0%) | 0 (0.0%) |
| Total | 35 (77.8%) | 10 (22.2%) |
Educational Attainment by Field of Study in Woodburn
Arts & humanities (10 | 35.7%), social sciences (8 | 28.6%), business (4 | 14.3%), science & technology (2 | 7.1%), and bio, nature & agricultural (1 | 3.6%) are the most common fields of study among 28 individuals in Woodburn who have obtained a bachelor's degree or higher.
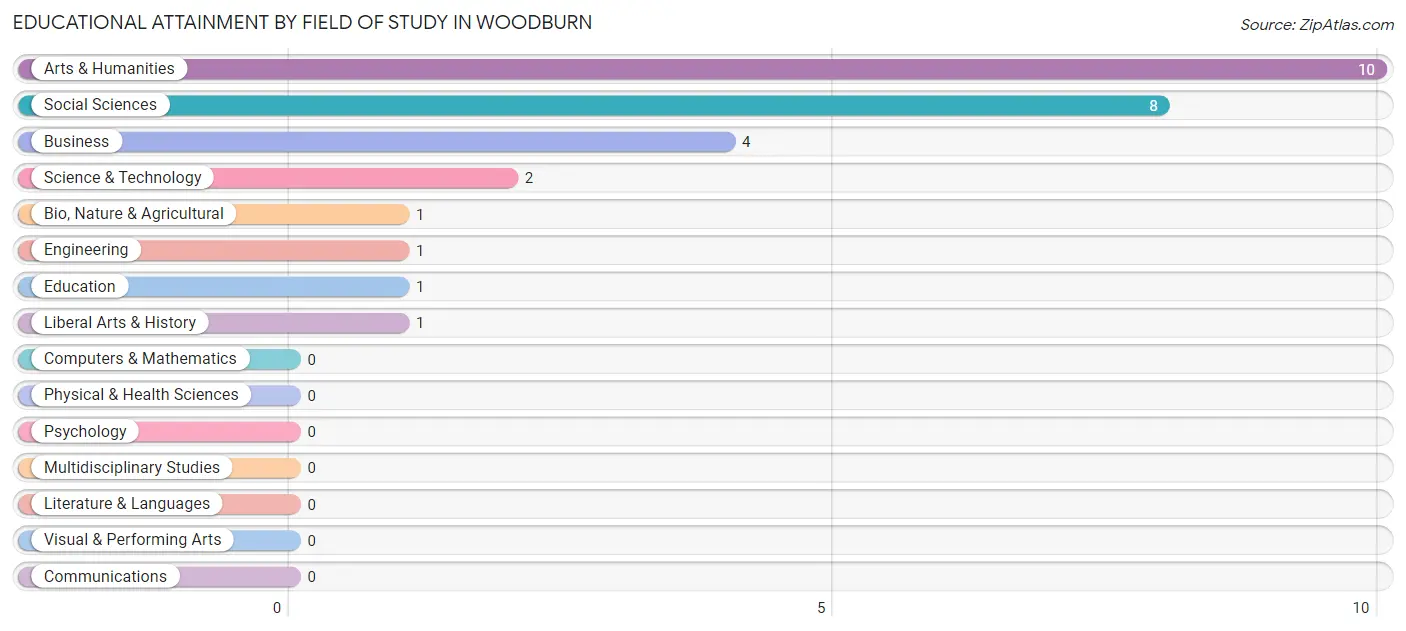
| Field of Study | # Graduates | % Graduates |
| Computers & Mathematics | 0 | 0.0% |
| Bio, Nature & Agricultural | 1 | 3.6% |
| Physical & Health Sciences | 0 | 0.0% |
| Psychology | 0 | 0.0% |
| Social Sciences | 8 | 28.6% |
| Engineering | 1 | 3.6% |
| Multidisciplinary Studies | 0 | 0.0% |
| Science & Technology | 2 | 7.1% |
| Business | 4 | 14.3% |
| Education | 1 | 3.6% |
| Literature & Languages | 0 | 0.0% |
| Liberal Arts & History | 1 | 3.6% |
| Visual & Performing Arts | 0 | 0.0% |
| Communications | 0 | 0.0% |
| Arts & Humanities | 10 | 35.7% |
| Total | 28 | 100.0% |
Transportation & Commute in Woodburn
Vehicle Availability by Sex in Woodburn
The most prevalent vehicle ownership categories in Woodburn are males with 2 vehicles (36, accounting for 50.7%) and females with 2 vehicles (16, making up 100.0%).
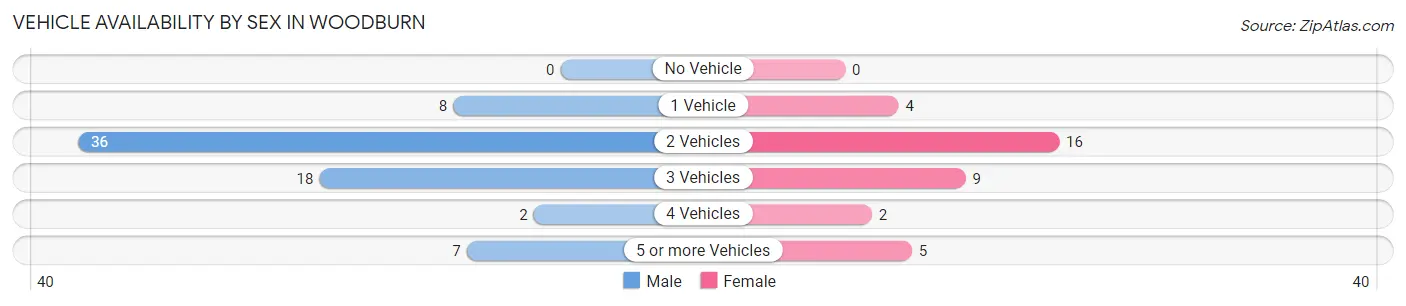
| Vehicles Available | Male | Female |
| No Vehicle | 0 (0.0%) | 0 (0.0%) |
| 1 Vehicle | 8 (11.3%) | 4 (11.1%) |
| 2 Vehicles | 36 (50.7%) | 16 (44.4%) |
| 3 Vehicles | 18 (25.4%) | 9 (25.0%) |
| 4 Vehicles | 2 (2.8%) | 2 (5.6%) |
| 5 or more Vehicles | 7 (9.9%) | 5 (13.9%) |
| Total | 71 (100.0%) | 36 (100.0%) |
Commute Time in Woodburn
The most frequently occuring commute durations in Woodburn are 20 to 24 minutes (30 commuters, 28.3%), 15 to 19 minutes (27 commuters, 25.5%), and 10 to 14 minutes (26 commuters, 24.5%).
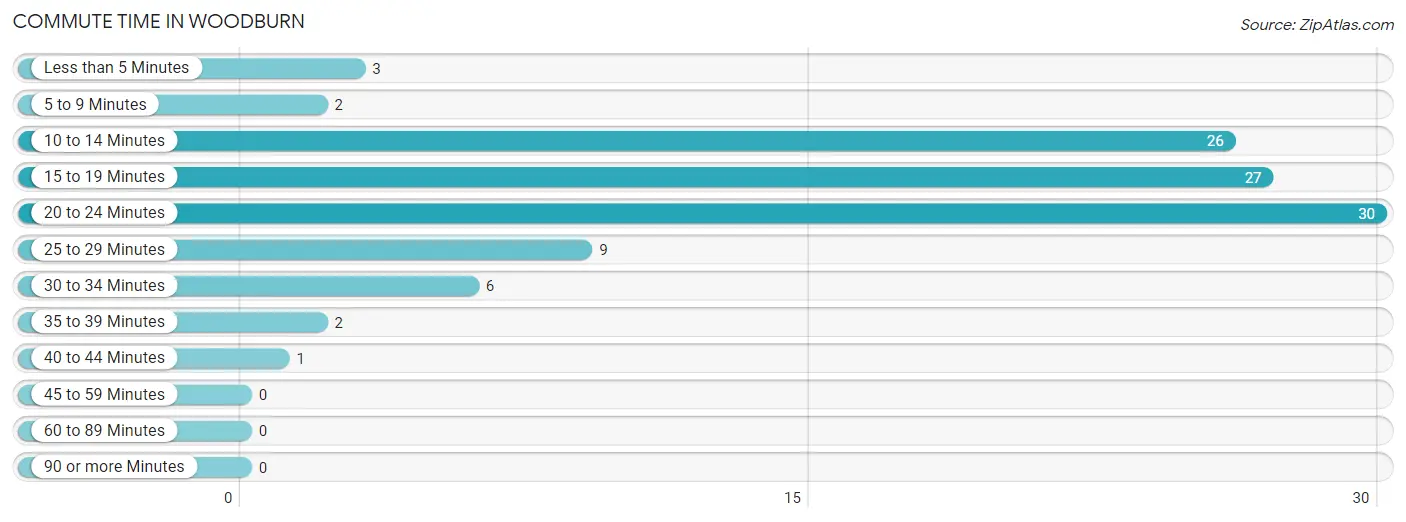
| Commute Time | # Commuters | % Commuters |
| Less than 5 Minutes | 3 | 2.8% |
| 5 to 9 Minutes | 2 | 1.9% |
| 10 to 14 Minutes | 26 | 24.5% |
| 15 to 19 Minutes | 27 | 25.5% |
| 20 to 24 Minutes | 30 | 28.3% |
| 25 to 29 Minutes | 9 | 8.5% |
| 30 to 34 Minutes | 6 | 5.7% |
| 35 to 39 Minutes | 2 | 1.9% |
| 40 to 44 Minutes | 1 | 0.9% |
| 45 to 59 Minutes | 0 | 0.0% |
| 60 to 89 Minutes | 0 | 0.0% |
| 90 or more Minutes | 0 | 0.0% |
Commute Time by Sex in Woodburn
The most common commute times in Woodburn are 20 to 24 minutes (22 commuters, 31.0%) for males and 15 to 19 minutes (11 commuters, 31.4%) for females.
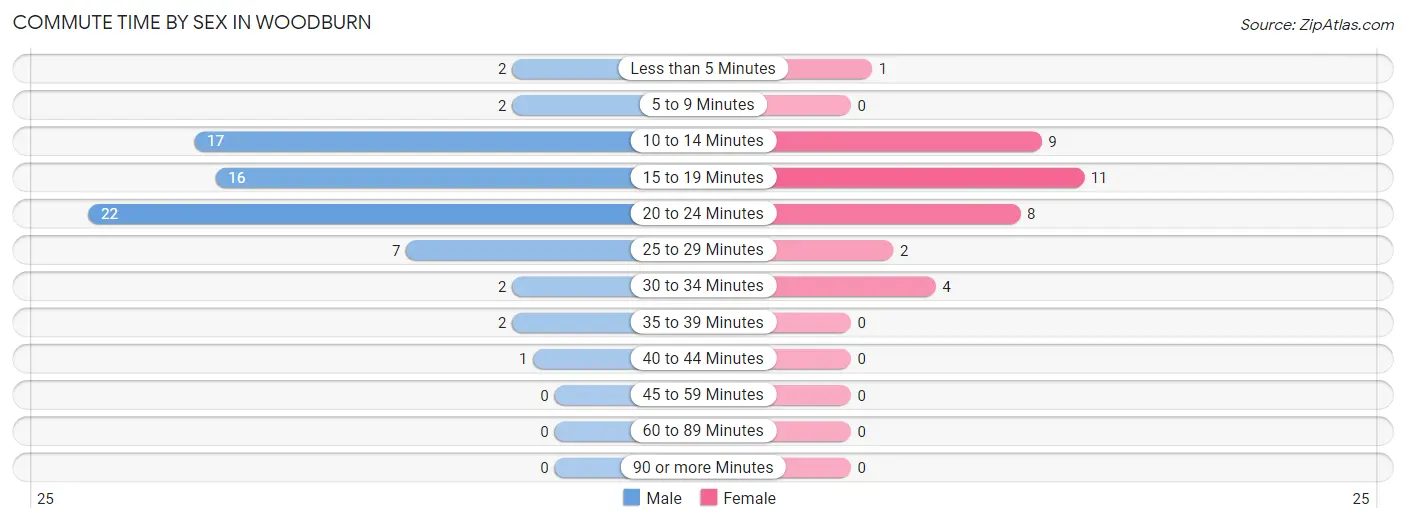
| Commute Time | Male | Female |
| Less than 5 Minutes | 2 (2.8%) | 1 (2.9%) |
| 5 to 9 Minutes | 2 (2.8%) | 0 (0.0%) |
| 10 to 14 Minutes | 17 (23.9%) | 9 (25.7%) |
| 15 to 19 Minutes | 16 (22.5%) | 11 (31.4%) |
| 20 to 24 Minutes | 22 (31.0%) | 8 (22.9%) |
| 25 to 29 Minutes | 7 (9.9%) | 2 (5.7%) |
| 30 to 34 Minutes | 2 (2.8%) | 4 (11.4%) |
| 35 to 39 Minutes | 2 (2.8%) | 0 (0.0%) |
| 40 to 44 Minutes | 1 (1.4%) | 0 (0.0%) |
| 45 to 59 Minutes | 0 (0.0%) | 0 (0.0%) |
| 60 to 89 Minutes | 0 (0.0%) | 0 (0.0%) |
| 90 or more Minutes | 0 (0.0%) | 0 (0.0%) |
Time of Departure to Work by Sex in Woodburn
The most frequent times of departure to work in Woodburn are 6:00 AM to 6:29 AM (17, 23.9%) for males and 7:30 AM to 7:59 AM (10, 28.6%) for females.
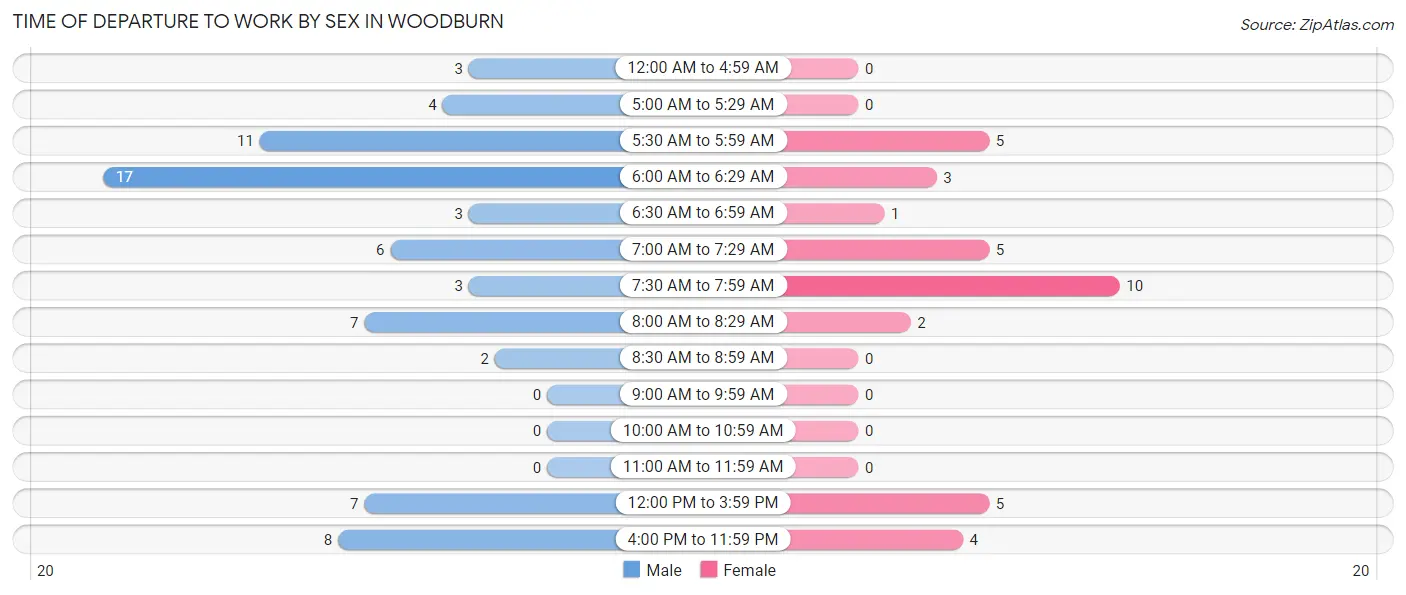
| Time of Departure | Male | Female |
| 12:00 AM to 4:59 AM | 3 (4.2%) | 0 (0.0%) |
| 5:00 AM to 5:29 AM | 4 (5.6%) | 0 (0.0%) |
| 5:30 AM to 5:59 AM | 11 (15.5%) | 5 (14.3%) |
| 6:00 AM to 6:29 AM | 17 (23.9%) | 3 (8.6%) |
| 6:30 AM to 6:59 AM | 3 (4.2%) | 1 (2.9%) |
| 7:00 AM to 7:29 AM | 6 (8.5%) | 5 (14.3%) |
| 7:30 AM to 7:59 AM | 3 (4.2%) | 10 (28.6%) |
| 8:00 AM to 8:29 AM | 7 (9.9%) | 2 (5.7%) |
| 8:30 AM to 8:59 AM | 2 (2.8%) | 0 (0.0%) |
| 9:00 AM to 9:59 AM | 0 (0.0%) | 0 (0.0%) |
| 10:00 AM to 10:59 AM | 0 (0.0%) | 0 (0.0%) |
| 11:00 AM to 11:59 AM | 0 (0.0%) | 0 (0.0%) |
| 12:00 PM to 3:59 PM | 7 (9.9%) | 5 (14.3%) |
| 4:00 PM to 11:59 PM | 8 (11.3%) | 4 (11.4%) |
| Total | 71 (100.0%) | 35 (100.0%) |
Housing Occupancy in Woodburn
Occupancy by Ownership in Woodburn
Of the total 92 dwellings in Woodburn, owner-occupied units account for 78 (84.8%), while renter-occupied units make up 14 (15.2%).
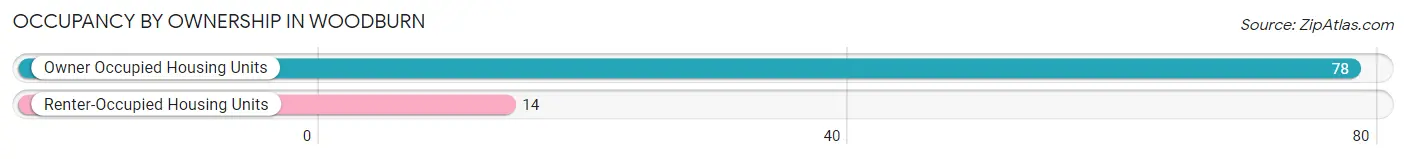
| Occupancy | # Housing Units | % Housing Units |
| Owner Occupied Housing Units | 78 | 84.8% |
| Renter-Occupied Housing Units | 14 | 15.2% |
| Total Occupied Housing Units | 92 | 100.0% |
Occupancy by Household Size in Woodburn
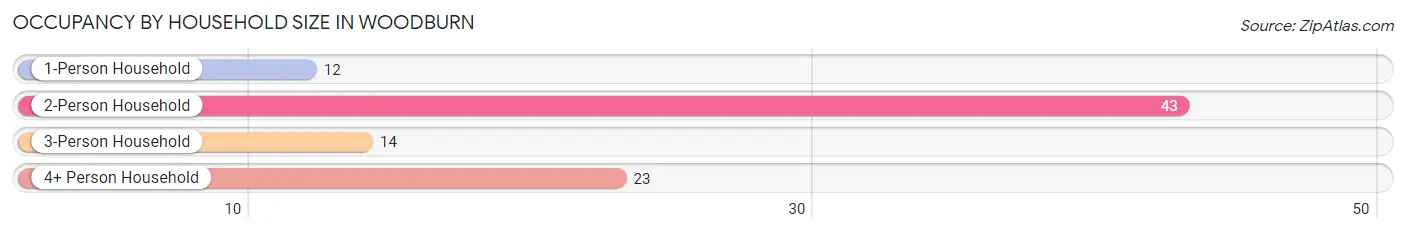
| Household Size | # Housing Units | % Housing Units |
| 1-Person Household | 12 | 13.0% |
| 2-Person Household | 43 | 46.7% |
| 3-Person Household | 14 | 15.2% |
| 4+ Person Household | 23 | 25.0% |
| Total Housing Units | 92 | 100.0% |
Occupancy by Ownership by Household Size in Woodburn
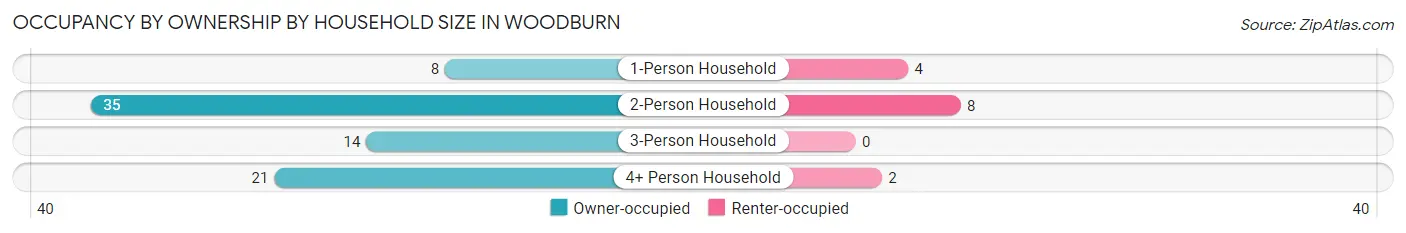
| Household Size | Owner-occupied | Renter-occupied |
| 1-Person Household | 8 (66.7%) | 4 (33.3%) |
| 2-Person Household | 35 (81.4%) | 8 (18.6%) |
| 3-Person Household | 14 (100.0%) | 0 (0.0%) |
| 4+ Person Household | 21 (91.3%) | 2 (8.7%) |
| Total Housing Units | 78 (84.8%) | 14 (15.2%) |
Occupancy by Educational Attainment in Woodburn
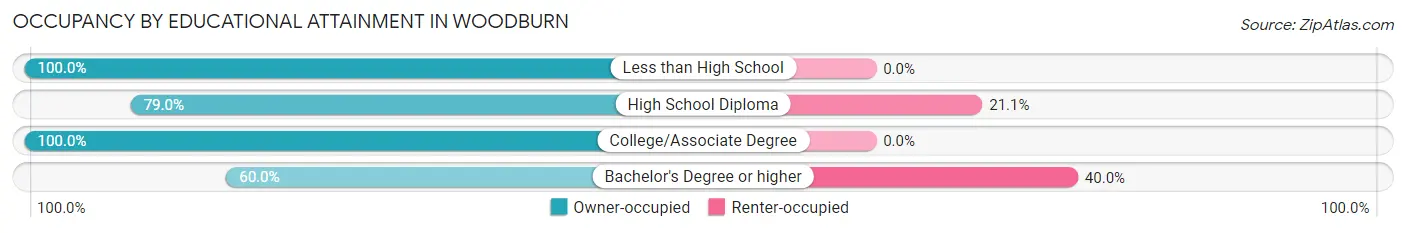
| Household Size | Owner-occupied | Renter-occupied |
| Less than High School | 5 (100.0%) | 0 (0.0%) |
| High School Diploma | 30 (78.9%) | 8 (21.0%) |
| College/Associate Degree | 34 (100.0%) | 0 (0.0%) |
| Bachelor's Degree or higher | 9 (60.0%) | 6 (40.0%) |
Occupancy by Age of Householder in Woodburn
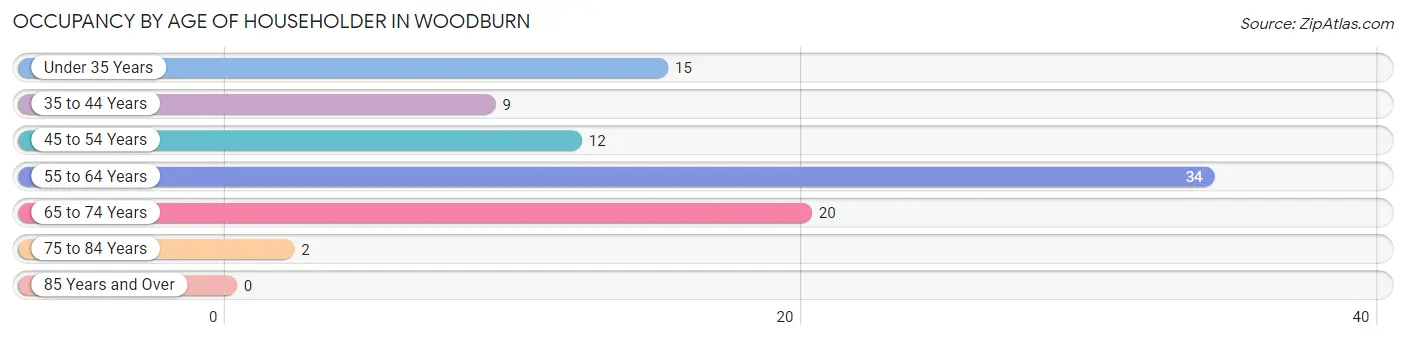
| Age Bracket | # Households | % Households |
| Under 35 Years | 15 | 16.3% |
| 35 to 44 Years | 9 | 9.8% |
| 45 to 54 Years | 12 | 13.0% |
| 55 to 64 Years | 34 | 37.0% |
| 65 to 74 Years | 20 | 21.7% |
| 75 to 84 Years | 2 | 2.2% |
| 85 Years and Over | 0 | 0.0% |
| Total | 92 | 100.0% |
Housing Finances in Woodburn
Median Income by Occupancy in Woodburn
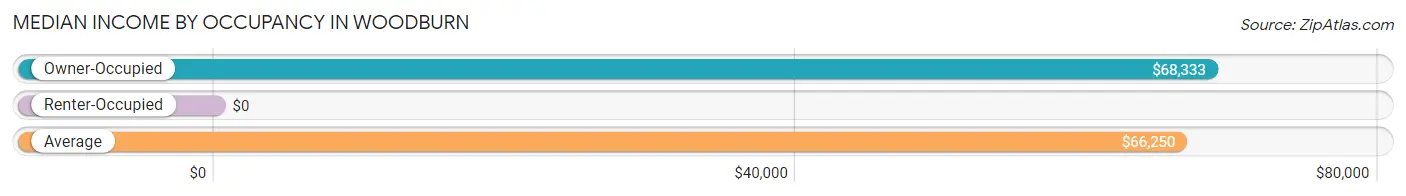
| Occupancy Type | # Households | Median Income |
| Owner-Occupied | 78 (84.8%) | $68,333 |
| Renter-Occupied | 14 (15.2%) | $0 |
| Average | 92 (100.0%) | $66,250 |
Occupancy by Householder Income Bracket in Woodburn
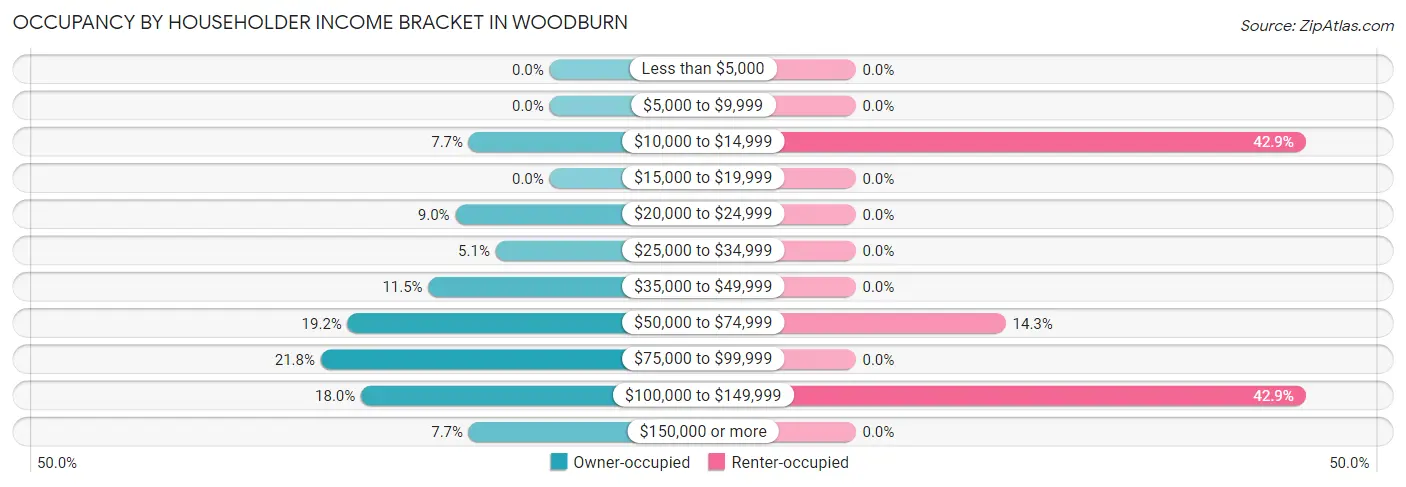
| Income Bracket | Owner-occupied | Renter-occupied |
| Less than $5,000 | 0 (0.0%) | 0 (0.0%) |
| $5,000 to $9,999 | 0 (0.0%) | 0 (0.0%) |
| $10,000 to $14,999 | 6 (7.7%) | 6 (42.9%) |
| $15,000 to $19,999 | 0 (0.0%) | 0 (0.0%) |
| $20,000 to $24,999 | 7 (9.0%) | 0 (0.0%) |
| $25,000 to $34,999 | 4 (5.1%) | 0 (0.0%) |
| $35,000 to $49,999 | 9 (11.5%) | 0 (0.0%) |
| $50,000 to $74,999 | 15 (19.2%) | 2 (14.3%) |
| $75,000 to $99,999 | 17 (21.8%) | 0 (0.0%) |
| $100,000 to $149,999 | 14 (17.9%) | 6 (42.9%) |
| $150,000 or more | 6 (7.7%) | 0 (0.0%) |
| Total | 78 (100.0%) | 14 (100.0%) |
Monthly Housing Cost Tiers in Woodburn
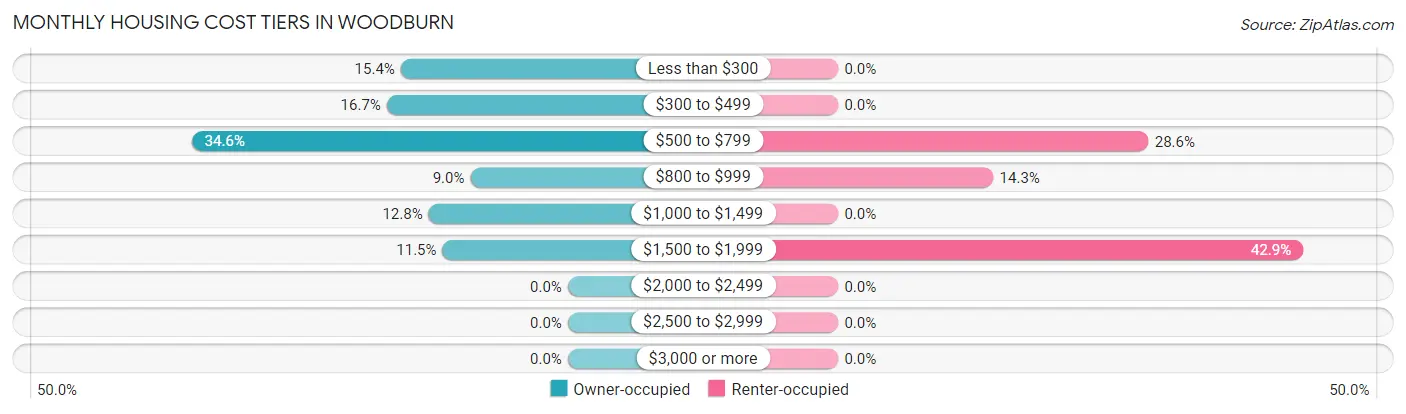
| Monthly Cost | Owner-occupied | Renter-occupied |
| Less than $300 | 12 (15.4%) | 0 (0.0%) |
| $300 to $499 | 13 (16.7%) | 0 (0.0%) |
| $500 to $799 | 27 (34.6%) | 4 (28.6%) |
| $800 to $999 | 7 (9.0%) | 2 (14.3%) |
| $1,000 to $1,499 | 10 (12.8%) | 0 (0.0%) |
| $1,500 to $1,999 | 9 (11.5%) | 6 (42.9%) |
| $2,000 to $2,499 | 0 (0.0%) | 0 (0.0%) |
| $2,500 to $2,999 | 0 (0.0%) | 0 (0.0%) |
| $3,000 or more | 0 (0.0%) | 0 (0.0%) |
| Total | 78 (100.0%) | 14 (100.0%) |
Physical Housing Characteristics in Woodburn
Housing Structures in Woodburn
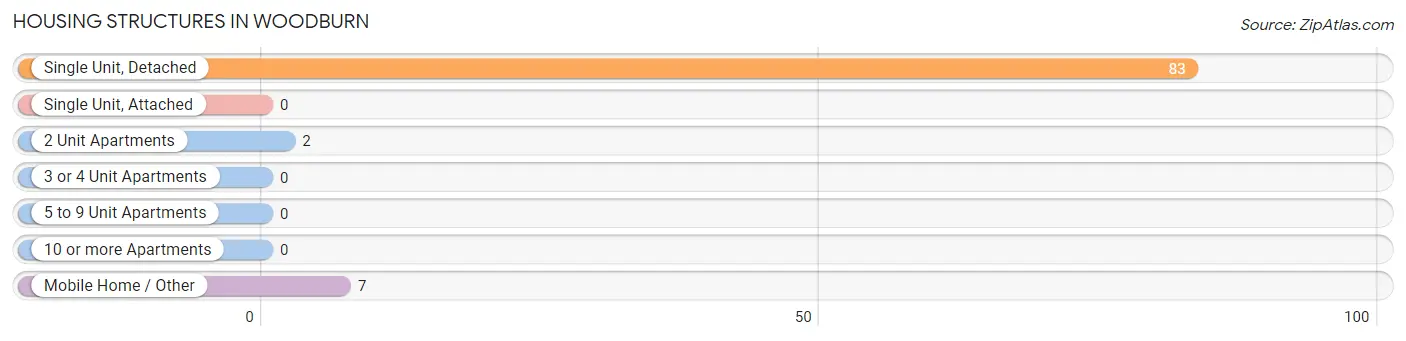
| Structure Type | # Housing Units | % Housing Units |
| Single Unit, Detached | 83 | 90.2% |
| Single Unit, Attached | 0 | 0.0% |
| 2 Unit Apartments | 2 | 2.2% |
| 3 or 4 Unit Apartments | 0 | 0.0% |
| 5 to 9 Unit Apartments | 0 | 0.0% |
| 10 or more Apartments | 0 | 0.0% |
| Mobile Home / Other | 7 | 7.6% |
| Total | 92 | 100.0% |
Housing Structures by Occupancy in Woodburn
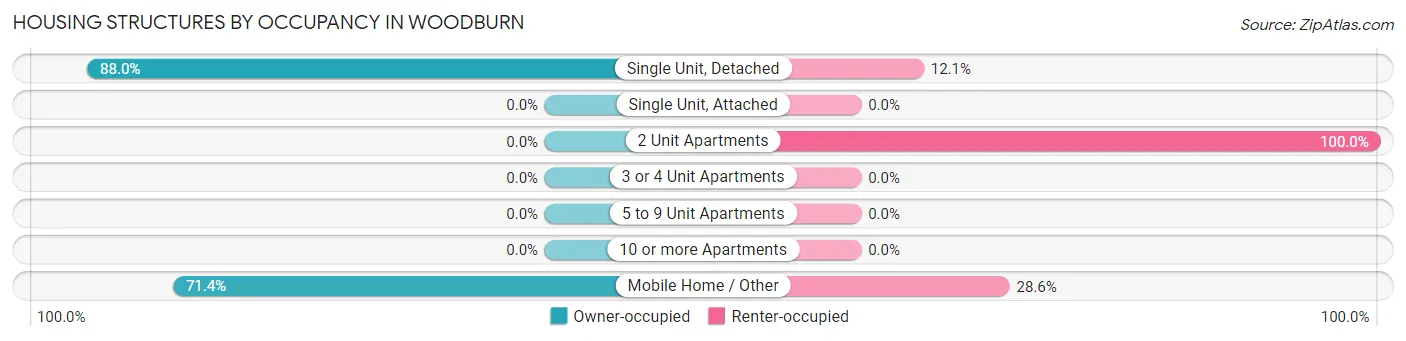
| Structure Type | Owner-occupied | Renter-occupied |
| Single Unit, Detached | 73 (87.9%) | 10 (12.0%) |
| Single Unit, Attached | 0 (0.0%) | 0 (0.0%) |
| 2 Unit Apartments | 0 (0.0%) | 2 (100.0%) |
| 3 or 4 Unit Apartments | 0 (0.0%) | 0 (0.0%) |
| 5 to 9 Unit Apartments | 0 (0.0%) | 0 (0.0%) |
| 10 or more Apartments | 0 (0.0%) | 0 (0.0%) |
| Mobile Home / Other | 5 (71.4%) | 2 (28.6%) |
| Total | 78 (84.8%) | 14 (15.2%) |
Housing Structures by Number of Rooms in Woodburn
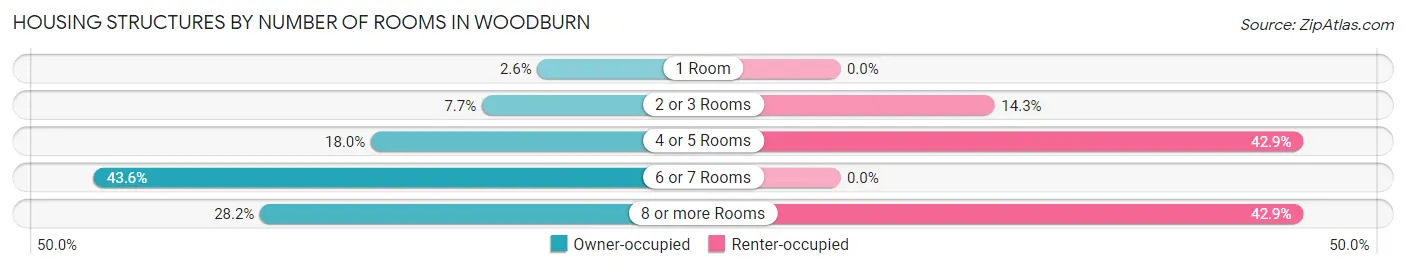
| Number of Rooms | Owner-occupied | Renter-occupied |
| 1 Room | 2 (2.6%) | 0 (0.0%) |
| 2 or 3 Rooms | 6 (7.7%) | 2 (14.3%) |
| 4 or 5 Rooms | 14 (17.9%) | 6 (42.9%) |
| 6 or 7 Rooms | 34 (43.6%) | 0 (0.0%) |
| 8 or more Rooms | 22 (28.2%) | 6 (42.9%) |
| Total | 78 (100.0%) | 14 (100.0%) |
Housing Structure by Heating Type in Woodburn
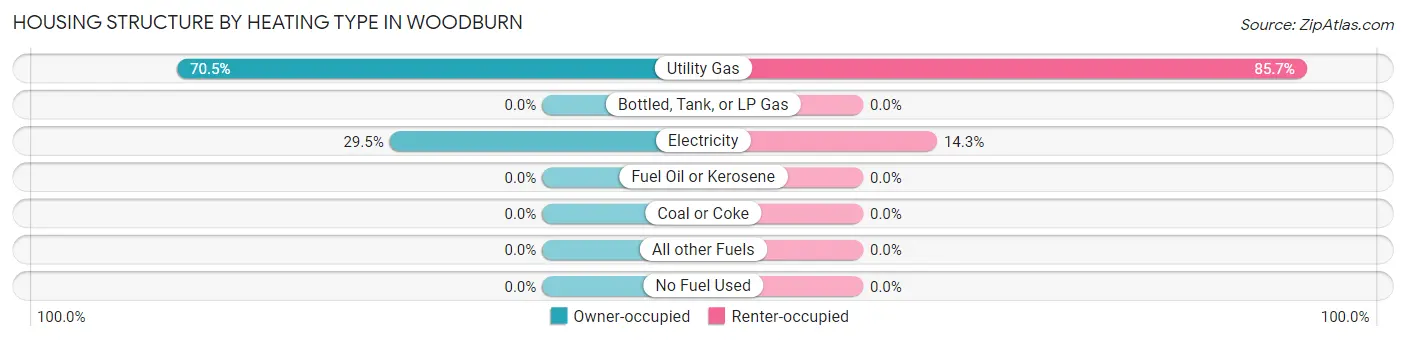
| Heating Type | Owner-occupied | Renter-occupied |
| Utility Gas | 55 (70.5%) | 12 (85.7%) |
| Bottled, Tank, or LP Gas | 0 (0.0%) | 0 (0.0%) |
| Electricity | 23 (29.5%) | 2 (14.3%) |
| Fuel Oil or Kerosene | 0 (0.0%) | 0 (0.0%) |
| Coal or Coke | 0 (0.0%) | 0 (0.0%) |
| All other Fuels | 0 (0.0%) | 0 (0.0%) |
| No Fuel Used | 0 (0.0%) | 0 (0.0%) |
| Total | 78 (100.0%) | 14 (100.0%) |
Household Vehicle Usage in Woodburn
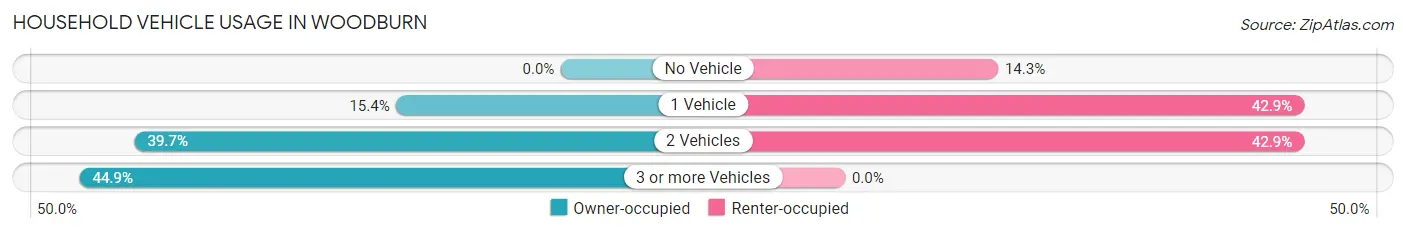
| Vehicles per Household | Owner-occupied | Renter-occupied |
| No Vehicle | 0 (0.0%) | 2 (14.3%) |
| 1 Vehicle | 12 (15.4%) | 6 (42.9%) |
| 2 Vehicles | 31 (39.7%) | 6 (42.9%) |
| 3 or more Vehicles | 35 (44.9%) | 0 (0.0%) |
| Total | 78 (100.0%) | 14 (100.0%) |
Real Estate & Mortgages in Woodburn
Real Estate and Mortgage Overview in Woodburn
| Characteristic | Without Mortgage | With Mortgage |
| Housing Units | 32 | 46 |
| Median Property Value | $100,000 | $158,300 |
| Median Household Income | $63,750 | $1 |
| Monthly Housing Costs | $375 | $0 |
| Real Estate Taxes | $622 | $5 |
Property Value by Mortgage Status in Woodburn
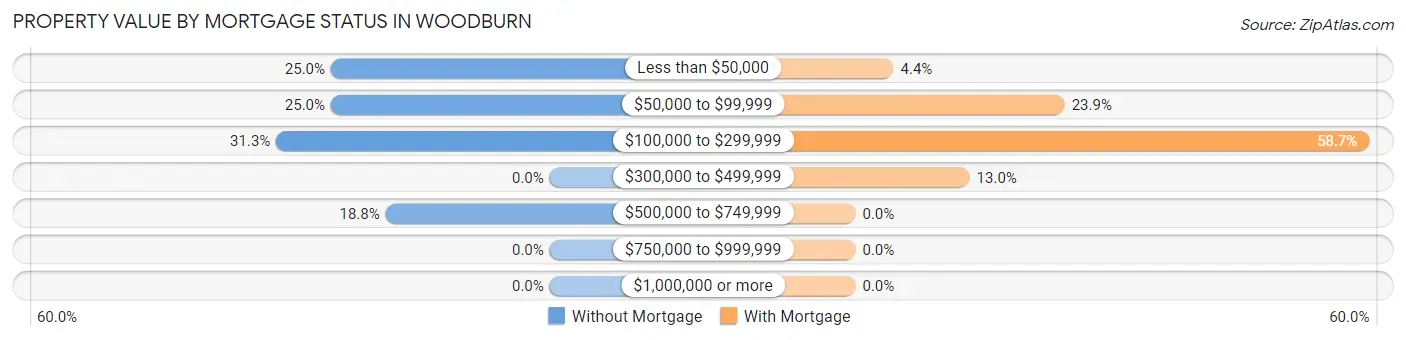
| Property Value | Without Mortgage | With Mortgage |
| Less than $50,000 | 8 (25.0%) | 2 (4.3%) |
| $50,000 to $99,999 | 8 (25.0%) | 11 (23.9%) |
| $100,000 to $299,999 | 10 (31.2%) | 27 (58.7%) |
| $300,000 to $499,999 | 0 (0.0%) | 6 (13.0%) |
| $500,000 to $749,999 | 6 (18.8%) | 0 (0.0%) |
| $750,000 to $999,999 | 0 (0.0%) | 0 (0.0%) |
| $1,000,000 or more | 0 (0.0%) | 0 (0.0%) |
| Total | 32 (100.0%) | 46 (100.0%) |
Household Income by Mortgage Status in Woodburn
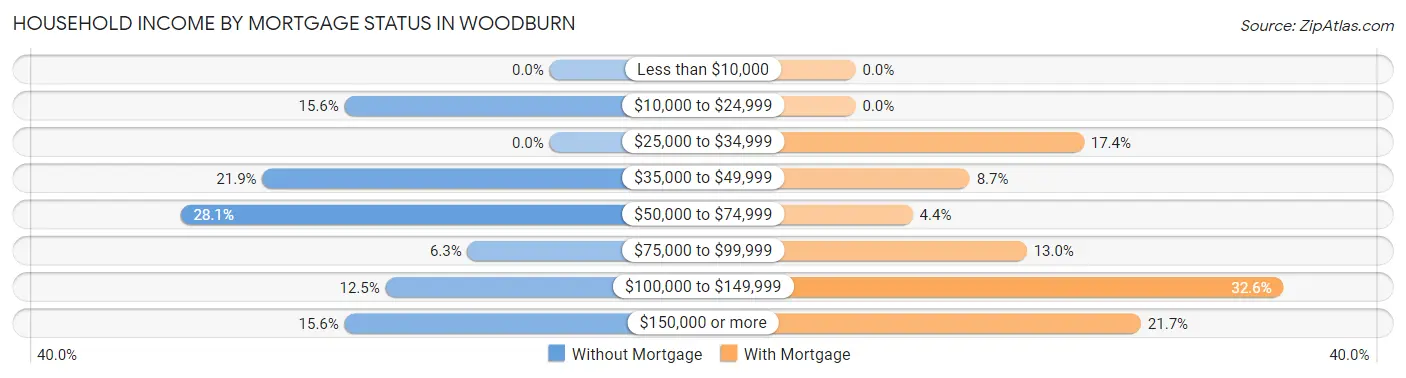
| Household Income | Without Mortgage | With Mortgage |
| Less than $10,000 | 0 (0.0%) | 0 (0.0%) |
| $10,000 to $24,999 | 5 (15.6%) | 0 (0.0%) |
| $25,000 to $34,999 | 0 (0.0%) | 8 (17.4%) |
| $35,000 to $49,999 | 7 (21.9%) | 4 (8.7%) |
| $50,000 to $74,999 | 9 (28.1%) | 2 (4.3%) |
| $75,000 to $99,999 | 2 (6.2%) | 6 (13.0%) |
| $100,000 to $149,999 | 4 (12.5%) | 15 (32.6%) |
| $150,000 or more | 5 (15.6%) | 10 (21.7%) |
| Total | 32 (100.0%) | 46 (100.0%) |
Property Value to Household Income Ratio in Woodburn
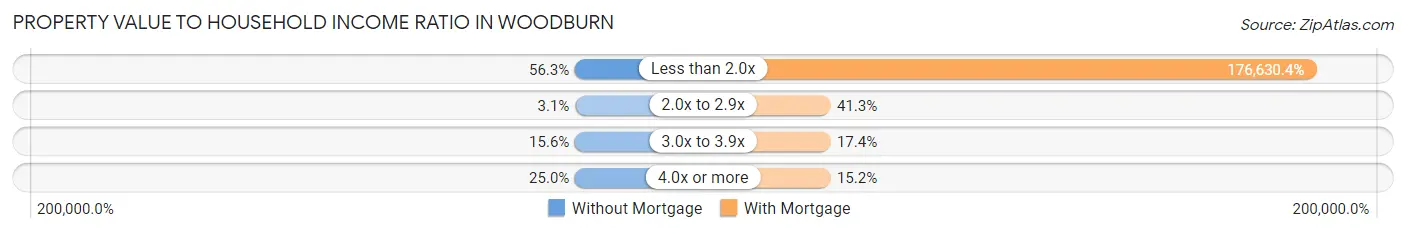
| Value-to-Income Ratio | Without Mortgage | With Mortgage |
| Less than 2.0x | 18 (56.2%) | 81,250 (176,630.4%) |
| 2.0x to 2.9x | 1 (3.1%) | 19 (41.3%) |
| 3.0x to 3.9x | 5 (15.6%) | 8 (17.4%) |
| 4.0x or more | 8 (25.0%) | 7 (15.2%) |
| Total | 32 (100.0%) | 46 (100.0%) |
Real Estate Taxes by Mortgage Status in Woodburn
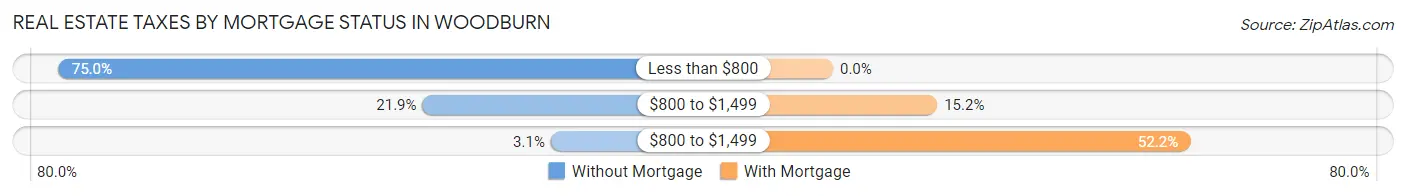
| Property Taxes | Without Mortgage | With Mortgage |
| Less than $800 | 24 (75.0%) | 0 (0.0%) |
| $800 to $1,499 | 7 (21.9%) | 7 (15.2%) |
| $800 to $1,499 | 1 (3.1%) | 24 (52.2%) |
| Total | 32 (100.0%) | 46 (100.0%) |
Health & Disability in Woodburn
Health Insurance Coverage by Age in Woodburn
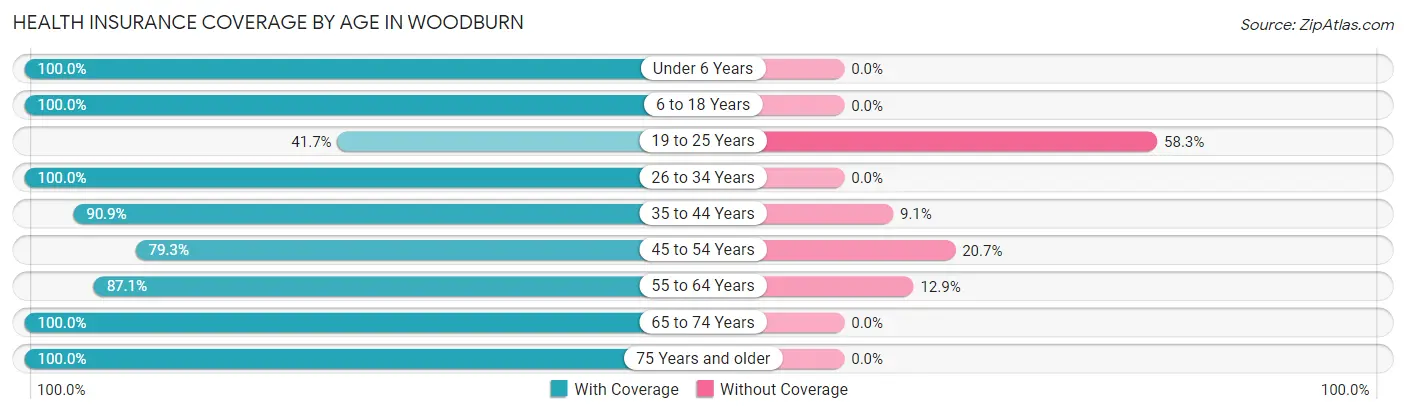
| Age Bracket | With Coverage | Without Coverage |
| Under 6 Years | 31 (100.0%) | 0 (0.0%) |
| 6 to 18 Years | 36 (100.0%) | 0 (0.0%) |
| 19 to 25 Years | 5 (41.7%) | 7 (58.3%) |
| 26 to 34 Years | 28 (100.0%) | 0 (0.0%) |
| 35 to 44 Years | 20 (90.9%) | 2 (9.1%) |
| 45 to 54 Years | 23 (79.3%) | 6 (20.7%) |
| 55 to 64 Years | 54 (87.1%) | 8 (12.9%) |
| 65 to 74 Years | 30 (100.0%) | 0 (0.0%) |
| 75 Years and older | 8 (100.0%) | 0 (0.0%) |
| Total | 235 (91.1%) | 23 (8.9%) |
Health Insurance Coverage by Citizenship Status in Woodburn
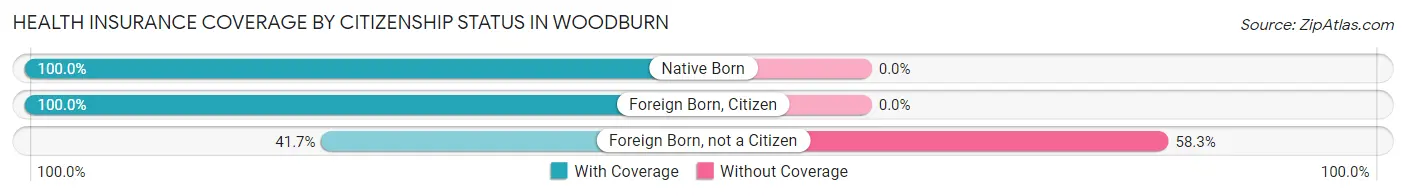
| Citizenship Status | With Coverage | Without Coverage |
| Native Born | 31 (100.0%) | 0 (0.0%) |
| Foreign Born, Citizen | 36 (100.0%) | 0 (0.0%) |
| Foreign Born, not a Citizen | 5 (41.7%) | 7 (58.3%) |
Health Insurance Coverage by Household Income in Woodburn
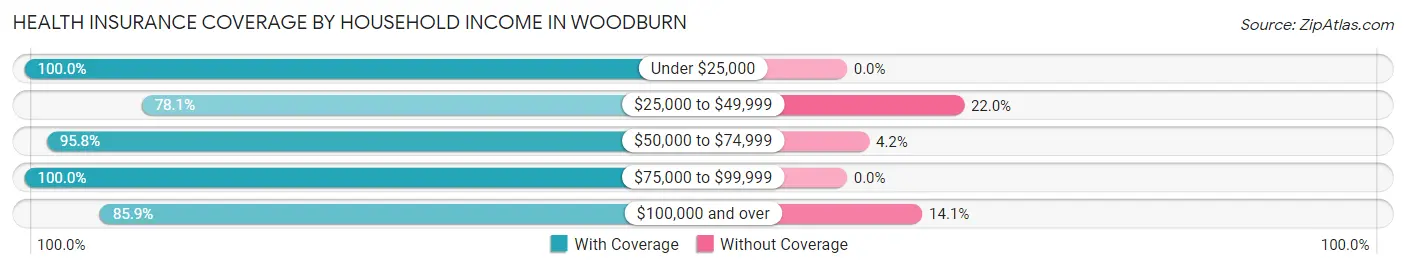
| Household Income | With Coverage | Without Coverage |
| Under $25,000 | 31 (100.0%) | 0 (0.0%) |
| $25,000 to $49,999 | 32 (78.0%) | 9 (22.0%) |
| $50,000 to $74,999 | 46 (95.8%) | 2 (4.2%) |
| $75,000 to $99,999 | 53 (100.0%) | 0 (0.0%) |
| $100,000 and over | 73 (85.9%) | 12 (14.1%) |
Public vs Private Health Insurance Coverage by Age in Woodburn
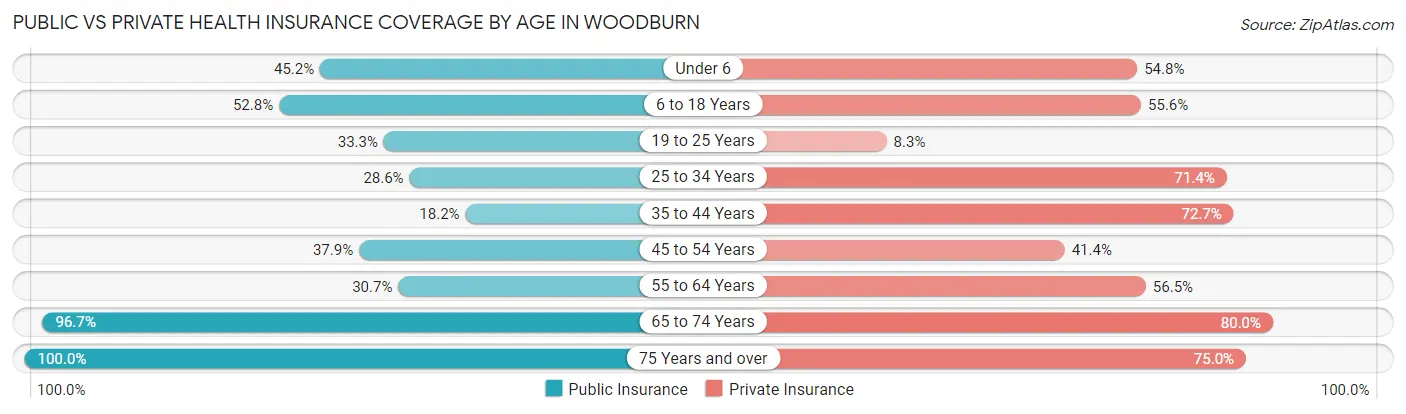
| Age Bracket | Public Insurance | Private Insurance |
| Under 6 | 14 (45.2%) | 17 (54.8%) |
| 6 to 18 Years | 19 (52.8%) | 20 (55.6%) |
| 19 to 25 Years | 4 (33.3%) | 1 (8.3%) |
| 25 to 34 Years | 8 (28.6%) | 20 (71.4%) |
| 35 to 44 Years | 4 (18.2%) | 16 (72.7%) |
| 45 to 54 Years | 11 (37.9%) | 12 (41.4%) |
| 55 to 64 Years | 19 (30.6%) | 35 (56.5%) |
| 65 to 74 Years | 29 (96.7%) | 24 (80.0%) |
| 75 Years and over | 8 (100.0%) | 6 (75.0%) |
| Total | 116 (45.0%) | 151 (58.5%) |
Disability Status by Sex by Age in Woodburn
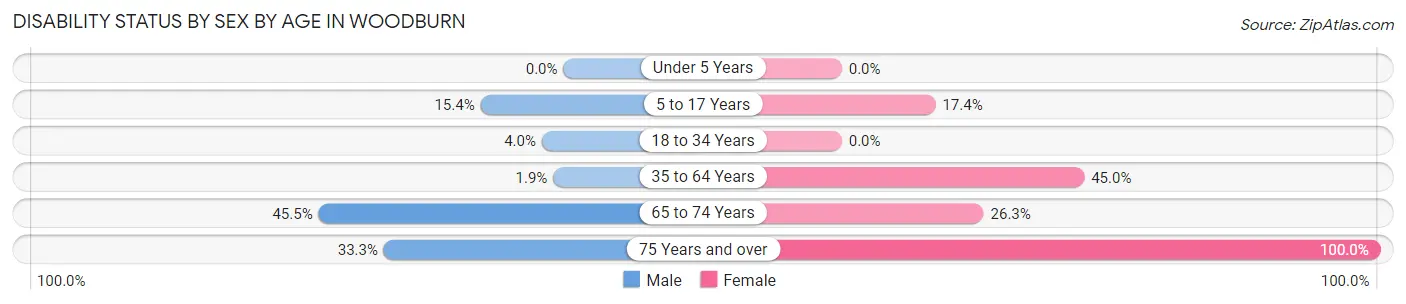
| Age Bracket | Male | Female |
| Under 5 Years | 0 (0.0%) | 0 (0.0%) |
| 5 to 17 Years | 2 (15.4%) | 4 (17.4%) |
| 18 to 34 Years | 1 (4.0%) | 0 (0.0%) |
| 35 to 64 Years | 1 (1.9%) | 27 (45.0%) |
| 65 to 74 Years | 5 (45.5%) | 5 (26.3%) |
| 75 Years and over | 1 (33.3%) | 5 (100.0%) |
Disability Class by Sex by Age in Woodburn
Disability Class: Hearing Difficulty
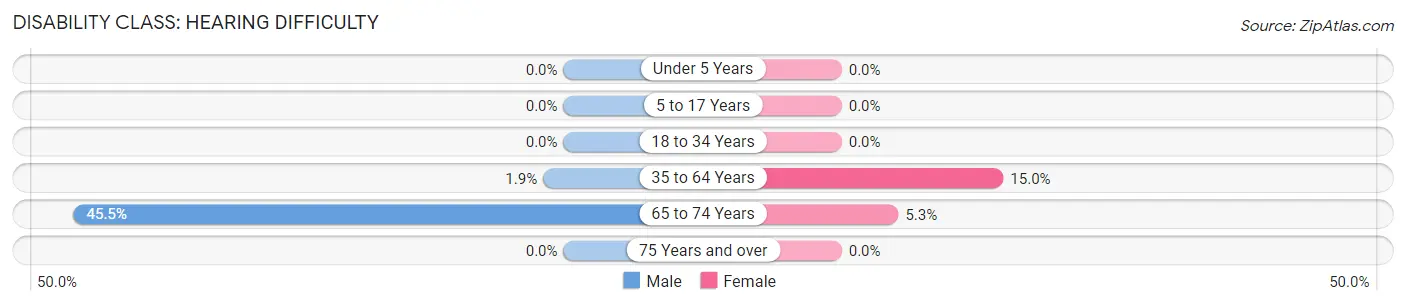
| Age Bracket | Male | Female |
| Under 5 Years | 0 (0.0%) | 0 (0.0%) |
| 5 to 17 Years | 0 (0.0%) | 0 (0.0%) |
| 18 to 34 Years | 0 (0.0%) | 0 (0.0%) |
| 35 to 64 Years | 1 (1.9%) | 9 (15.0%) |
| 65 to 74 Years | 5 (45.5%) | 1 (5.3%) |
| 75 Years and over | 0 (0.0%) | 0 (0.0%) |
Disability Class: Vision Difficulty
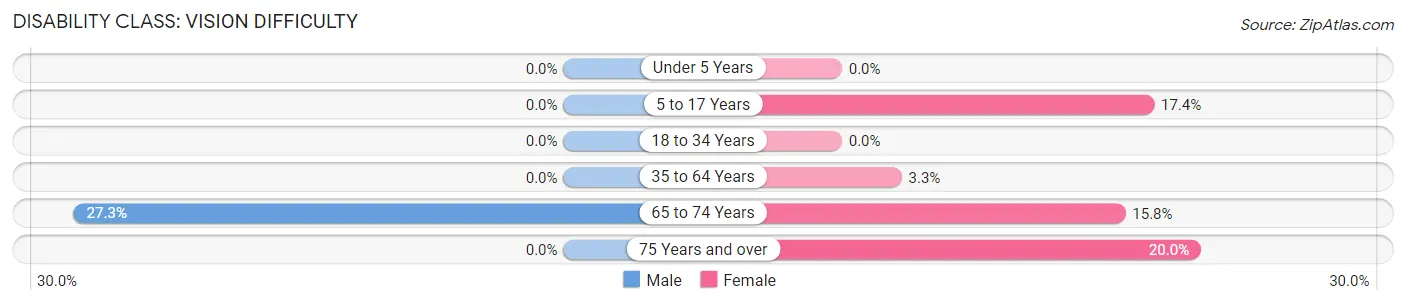
| Age Bracket | Male | Female |
| Under 5 Years | 0 (0.0%) | 0 (0.0%) |
| 5 to 17 Years | 0 (0.0%) | 4 (17.4%) |
| 18 to 34 Years | 0 (0.0%) | 0 (0.0%) |
| 35 to 64 Years | 0 (0.0%) | 2 (3.3%) |
| 65 to 74 Years | 3 (27.3%) | 3 (15.8%) |
| 75 Years and over | 0 (0.0%) | 1 (20.0%) |
Disability Class: Cognitive Difficulty
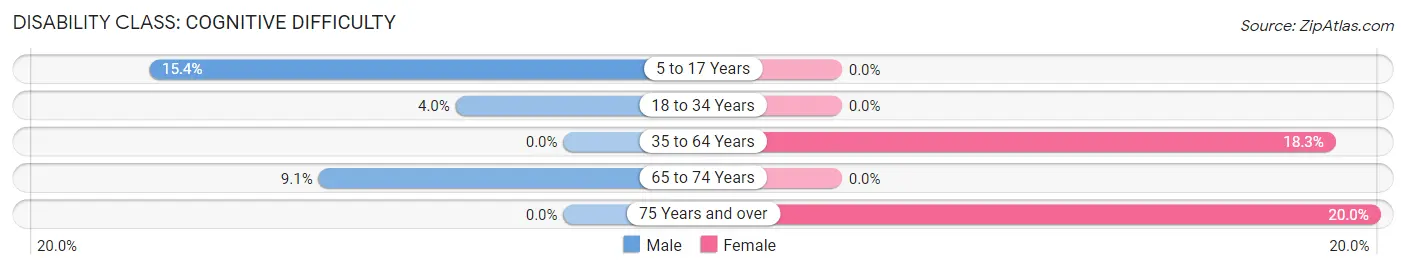
| Age Bracket | Male | Female |
| 5 to 17 Years | 2 (15.4%) | 0 (0.0%) |
| 18 to 34 Years | 1 (4.0%) | 0 (0.0%) |
| 35 to 64 Years | 0 (0.0%) | 11 (18.3%) |
| 65 to 74 Years | 1 (9.1%) | 0 (0.0%) |
| 75 Years and over | 0 (0.0%) | 1 (20.0%) |
Disability Class: Ambulatory Difficulty
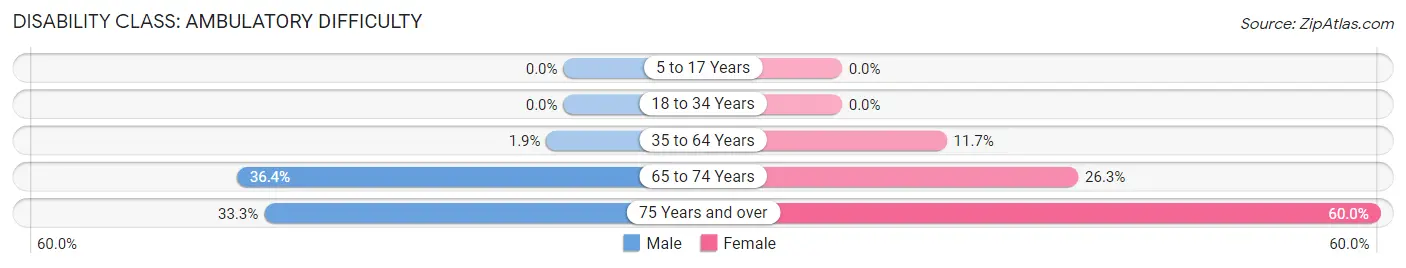
| Age Bracket | Male | Female |
| 5 to 17 Years | 0 (0.0%) | 0 (0.0%) |
| 18 to 34 Years | 0 (0.0%) | 0 (0.0%) |
| 35 to 64 Years | 1 (1.9%) | 7 (11.7%) |
| 65 to 74 Years | 4 (36.4%) | 5 (26.3%) |
| 75 Years and over | 1 (33.3%) | 3 (60.0%) |
Disability Class: Self-Care Difficulty
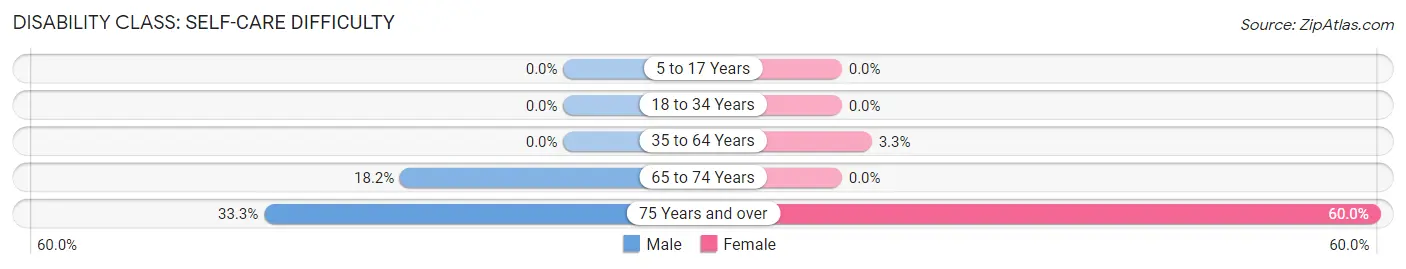
| Age Bracket | Male | Female |
| 5 to 17 Years | 0 (0.0%) | 0 (0.0%) |
| 18 to 34 Years | 0 (0.0%) | 0 (0.0%) |
| 35 to 64 Years | 0 (0.0%) | 2 (3.3%) |
| 65 to 74 Years | 2 (18.2%) | 0 (0.0%) |
| 75 Years and over | 1 (33.3%) | 3 (60.0%) |
Technology Access in Woodburn
Computing Device Access in Woodburn
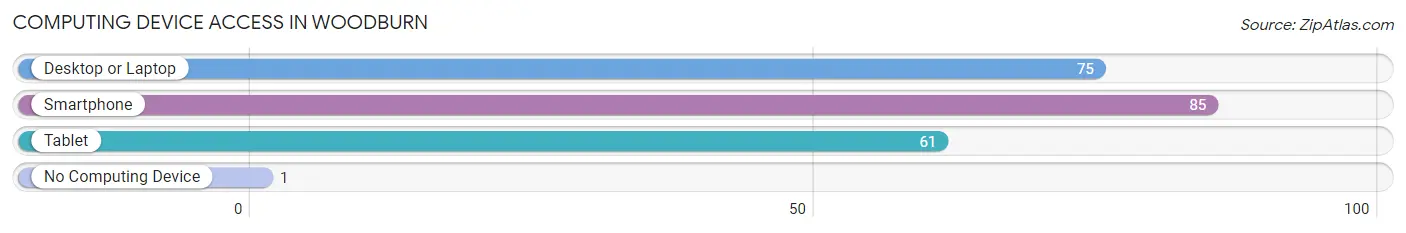
| Device Type | # Households | % Households |
| Desktop or Laptop | 75 | 81.5% |
| Smartphone | 85 | 92.4% |
| Tablet | 61 | 66.3% |
| No Computing Device | 1 | 1.1% |
| Total | 92 | 100.0% |
Internet Access in Woodburn
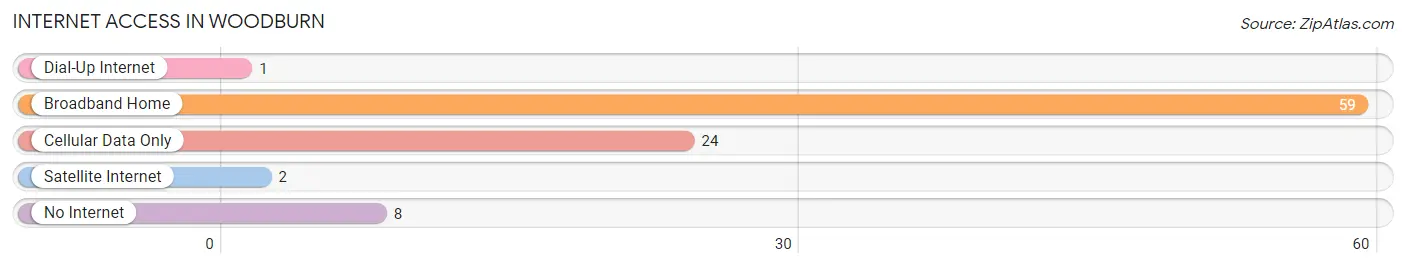
| Internet Type | # Households | % Households |
| Dial-Up Internet | 1 | 1.1% |
| Broadband Home | 59 | 64.1% |
| Cellular Data Only | 24 | 26.1% |
| Satellite Internet | 2 | 2.2% |
| No Internet | 8 | 8.7% |
| Total | 92 | 100.0% |
Woodburn Summary
Burnwood, Kentucky is a small town located in the western part of the state, in the foothills of the Appalachian Mountains. It is situated in the heart of the Daniel Boone National Forest, and is surrounded by lush forests and rolling hills. The town was founded in 1820, and has a population of just over 1,000 people.
Burnwood is located in the county of Warren, and is part of the Bowling Green Metropolitan Statistical Area. The town is situated along the banks of the Green River, and is home to several small businesses, including a grocery store, a hardware store, and a few restaurants. The town is also home to a small post office, and a few churches.
The town of Burnwood is known for its rich history and culture. The town was originally settled by a group of settlers from Virginia, who were looking for a place to call home. The town was named after the nearby Burnwood Creek, which was named after a local Native American tribe. The town was also home to a number of Civil War battles, and is home to a number of historic sites, including the Burnwood Cemetery, which is the final resting place of many of the town's earliest settlers.
The economy of Burnwood is largely based on agriculture and forestry. The town is home to a number of farms, and the surrounding area is home to a number of timber companies. The town is also home to a number of small businesses, including a grocery store, a hardware store, and a few restaurants.
The demographics of Burnwood are largely white, with a small percentage of African Americans, Hispanics, and Native Americans. The median household income in Burnwood is $35,000, and the median age is 44. The town is home to a number of churches, and is served by a number of public schools.
Burnwood is a small town with a rich history and culture. The town is home to a number of small businesses, and is surrounded by lush forests and rolling hills. The town is also home to a number of historic sites, and is served by a number of public schools. The town is largely white, with a small percentage of African Americans, Hispanics, and Native Americans. The median household income in Burnwood is $35,000, and the median age is 44.
Common Questions
What is Per Capita Income in Woodburn?
Per Capita income in Woodburn is $25,062.
What is the Median Family Income in Woodburn?
Median Family Income in Woodburn is $80,000.
What is the Median Household income in Woodburn?
Median Household Income in Woodburn is $66,250.
What is Income or Wage Gap in Woodburn?
Income or Wage Gap in Woodburn is 49.5%.
Women in Woodburn earn 50.5 cents for every dollar earned by a man.
What is Inequality or Gini Index in Woodburn?
Inequality or Gini Index in Woodburn is 0.36.
What is the Total Population of Woodburn?
Total Population of Woodburn is 306.
What is the Total Male Population of Woodburn?
Total Male Population of Woodburn is 119.
What is the Total Female Population of Woodburn?
Total Female Population of Woodburn is 187.
What is the Ratio of Males per 100 Females in Woodburn?
There are 63.64 Males per 100 Females in Woodburn.
What is the Ratio of Females per 100 Males in Woodburn?
There are 157.14 Females per 100 Males in Woodburn.
What is the Median Population Age in Woodburn?
Median Population Age in Woodburn is 52.4 Years.
What is the Average Family Size in Woodburn
Average Family Size in Woodburn is 3.0 People.
What is the Average Household Size in Woodburn
Average Household Size in Woodburn is 2.8 People.
How Large is the Labor Force in Woodburn?
There are 115 People in the Labor Forcein in Woodburn.
What is the Percentage of People in the Labor Force in Woodburn?
47.1% of People are in the Labor Force in Woodburn.
What is the Unemployment Rate in Woodburn?
Unemployment Rate in Woodburn is 5.2%.