Burnside, KY Map & Demographics
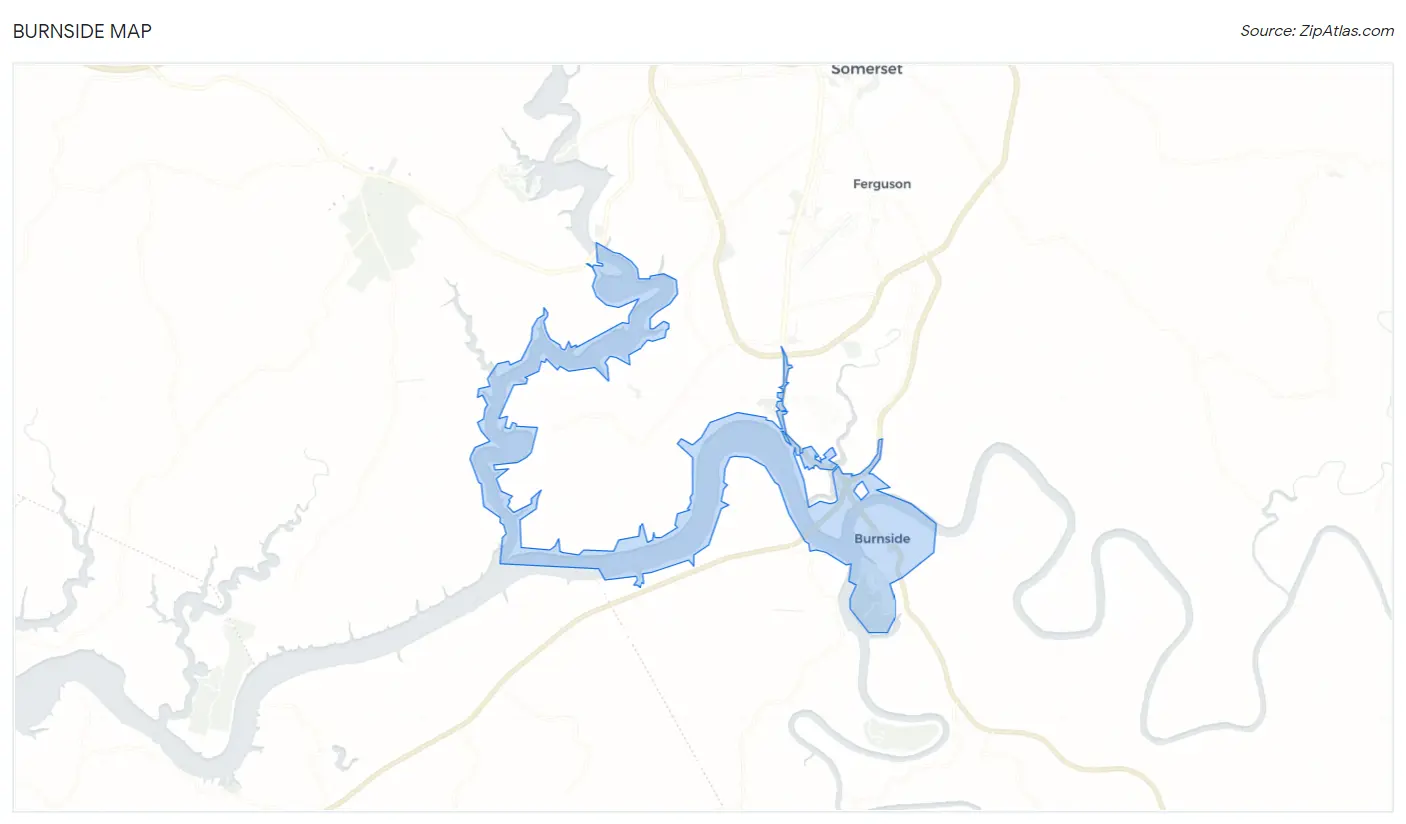
Burnside Map
Burnside Overview
$22,902
PER CAPITA INCOME
$52,143
AVG FAMILY INCOME
$52,847
AVG HOUSEHOLD INCOME
21.6%
WAGE / INCOME GAP [ % ]
78.4¢/ $1
WAGE / INCOME GAP [ $ ]
0.39
INEQUALITY / GINI INDEX
1,081
TOTAL POPULATION
474
MALE POPULATION
607
FEMALE POPULATION
78.09
MALES / 100 FEMALES
128.06
FEMALES / 100 MALES
40.0
MEDIAN AGE
2.9
AVG FAMILY SIZE
2.8
AVG HOUSEHOLD SIZE
385
LABOR FORCE [ PEOPLE ]
44.1%
PERCENT IN LABOR FORCE
2.6%
UNEMPLOYMENT RATE
Burnside Zip Codes
Burnside Area Codes
Income in Burnside
Income Overview in Burnside
Per Capita Income in Burnside is $22,902, while median incomes of families and households are $52,143 and $52,847 respectively.
| Characteristic | Number | Measure |
| Per Capita Income | 1,081 | $22,902 |
| Median Family Income | 296 | $52,143 |
| Mean Family Income | 296 | $68,172 |
| Median Household Income | 393 | $52,847 |
| Mean Household Income | 393 | $63,794 |
| Income Deficit | 296 | $0 |
| Wage / Income Gap (%) | 1,081 | 21.60% |
| Wage / Income Gap ($) | 1,081 | 78.40¢ per $1 |
| Gini / Inequality Index | 1,081 | 0.39 |
Earnings by Sex in Burnside
Average Earnings in Burnside are $33,723, $34,680 for men and $27,188 for women, a difference of 21.6%.
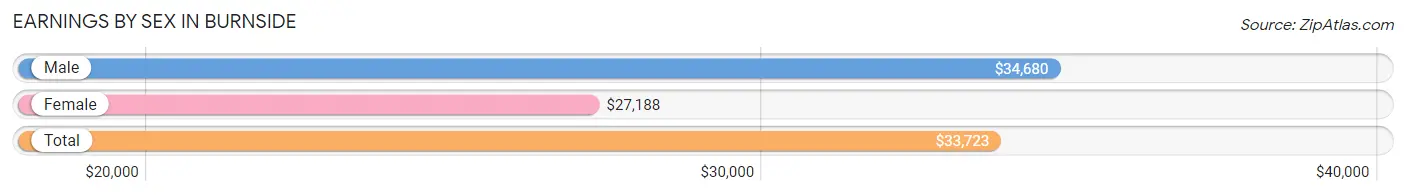
| Sex | Number | Average Earnings |
| Male | 203 (51.8%) | $34,680 |
| Female | 189 (48.2%) | $27,188 |
| Total | 392 (100.0%) | $33,723 |
Earnings by Sex by Income Bracket in Burnside
The most common earnings brackets in Burnside are $30,000 to $34,999 for men (43 | 21.2%) and $55,000 to $64,999 for women (23 | 12.2%).
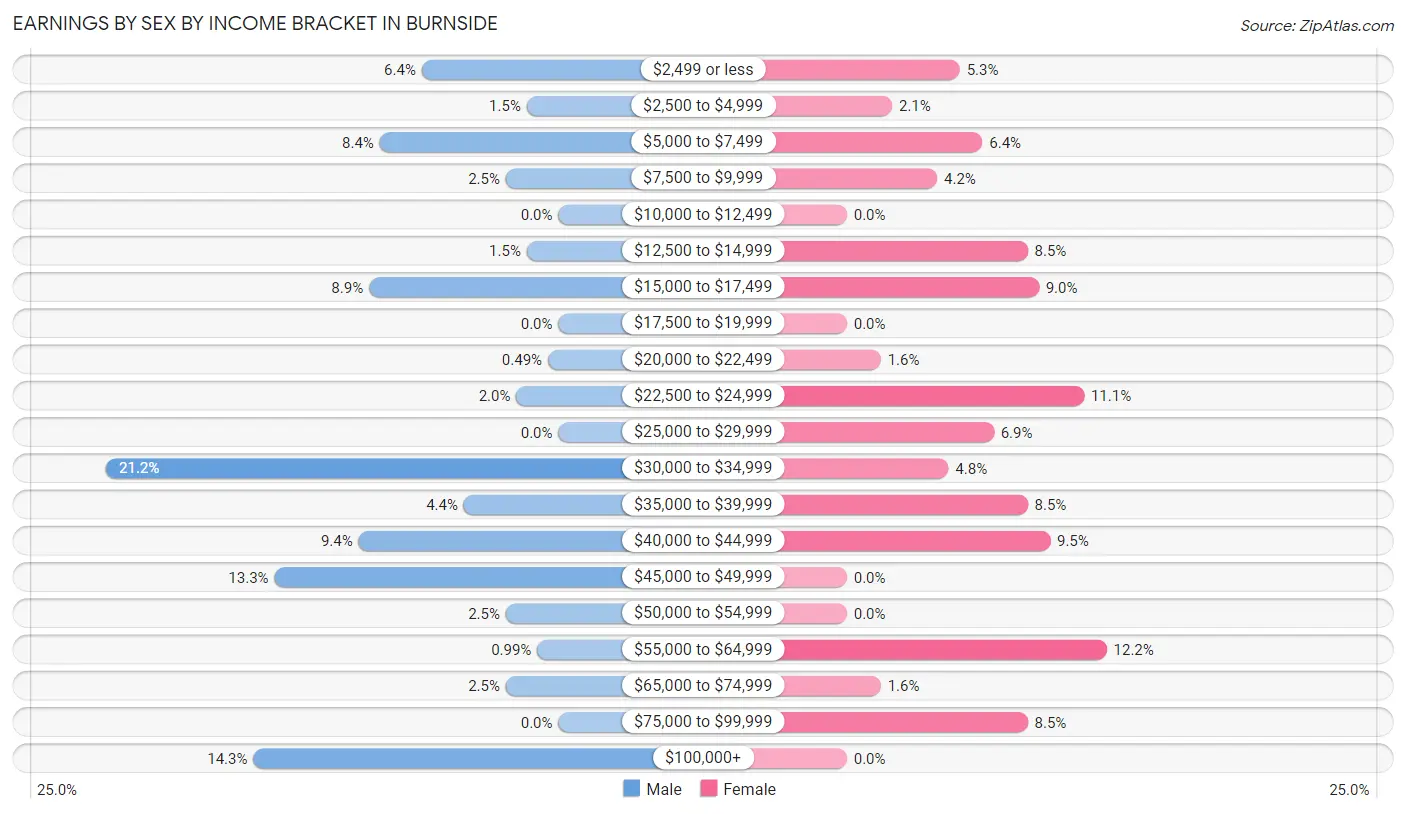
| Income | Male | Female |
| $2,499 or less | 13 (6.4%) | 10 (5.3%) |
| $2,500 to $4,999 | 3 (1.5%) | 4 (2.1%) |
| $5,000 to $7,499 | 17 (8.4%) | 12 (6.4%) |
| $7,500 to $9,999 | 5 (2.5%) | 8 (4.2%) |
| $10,000 to $12,499 | 0 (0.0%) | 0 (0.0%) |
| $12,500 to $14,999 | 3 (1.5%) | 16 (8.5%) |
| $15,000 to $17,499 | 18 (8.9%) | 17 (9.0%) |
| $17,500 to $19,999 | 0 (0.0%) | 0 (0.0%) |
| $20,000 to $22,499 | 1 (0.5%) | 3 (1.6%) |
| $22,500 to $24,999 | 4 (2.0%) | 21 (11.1%) |
| $25,000 to $29,999 | 0 (0.0%) | 13 (6.9%) |
| $30,000 to $34,999 | 43 (21.2%) | 9 (4.8%) |
| $35,000 to $39,999 | 9 (4.4%) | 16 (8.5%) |
| $40,000 to $44,999 | 19 (9.4%) | 18 (9.5%) |
| $45,000 to $49,999 | 27 (13.3%) | 0 (0.0%) |
| $50,000 to $54,999 | 5 (2.5%) | 0 (0.0%) |
| $55,000 to $64,999 | 2 (1.0%) | 23 (12.2%) |
| $65,000 to $74,999 | 5 (2.5%) | 3 (1.6%) |
| $75,000 to $99,999 | 0 (0.0%) | 16 (8.5%) |
| $100,000+ | 29 (14.3%) | 0 (0.0%) |
| Total | 203 (100.0%) | 189 (100.0%) |
Earnings by Sex by Educational Attainment in Burnside
Average earnings in Burnside are $34,913 for men and $35,000 for women, a difference of 0.3%. Men with an educational attainment of bachelor's degree enjoy the highest average annual earnings of $105,500, while those with high school diploma education earn the least with $34,375. Women with an educational attainment of graduate degree earn the most with the average annual earnings of $80,078, while those with college or associate's degree education have the smallest earnings of $20,417.
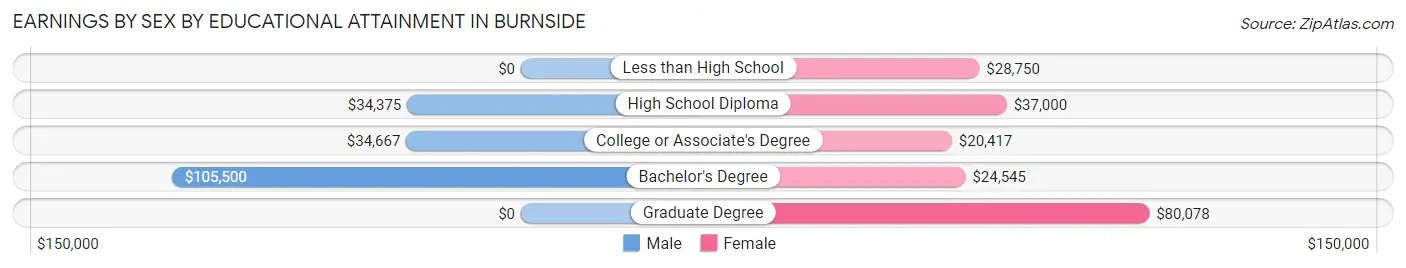
| Educational Attainment | Male Income | Female Income |
| Less than High School | - | - |
| High School Diploma | $34,375 | $37,000 |
| College or Associate's Degree | $34,667 | $20,417 |
| Bachelor's Degree | $105,500 | $24,545 |
| Graduate Degree | - | - |
| Total | $34,913 | $35,000 |
Family Income in Burnside
Family Income Brackets in Burnside
According to the Burnside family income data, there are 56 families falling into the $25,000 to $34,999 income range, which is the most common income bracket and makes up 18.9% of all families. Conversely, the $200,000+ income bracket is the least frequent group with only 2 families (0.7%) belonging to this category.
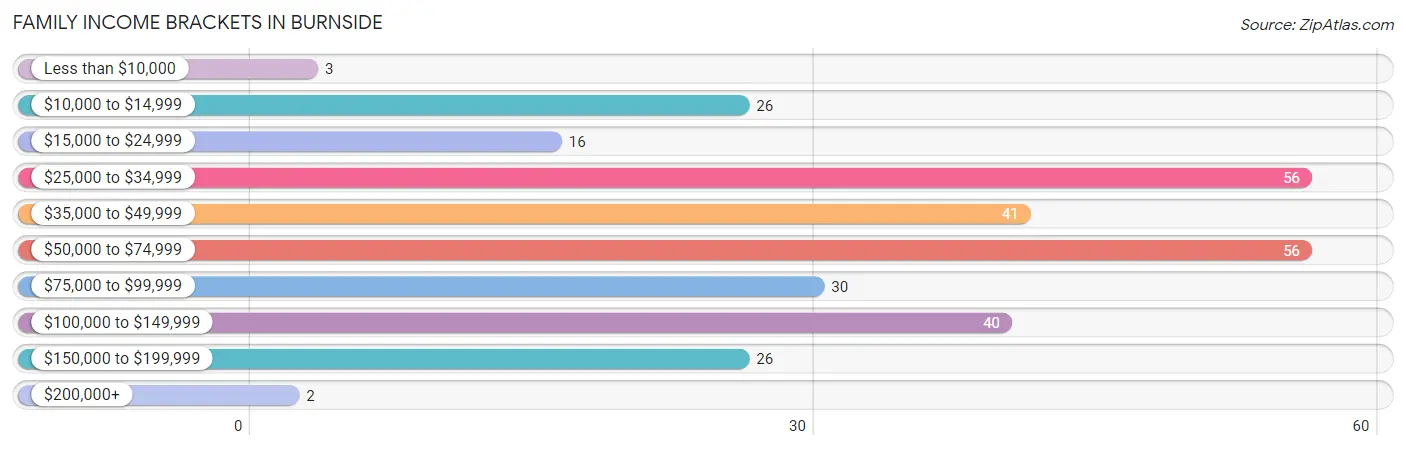
| Income Bracket | # Families | % Families |
| Less than $10,000 | 3 | 1.0% |
| $10,000 to $14,999 | 26 | 8.8% |
| $15,000 to $24,999 | 16 | 5.4% |
| $25,000 to $34,999 | 56 | 18.9% |
| $35,000 to $49,999 | 41 | 13.9% |
| $50,000 to $74,999 | 56 | 18.9% |
| $75,000 to $99,999 | 30 | 10.1% |
| $100,000 to $149,999 | 40 | 13.5% |
| $150,000 to $199,999 | 26 | 8.8% |
| $200,000+ | 2 | 0.7% |
Family Income by Famaliy Size in Burnside
5-person families (21 | 7.1%) account for the highest median family income in Burnside with $116,083 per family, while 3-person families (43 | 14.5%) have the highest median income of $37,250 per family member.
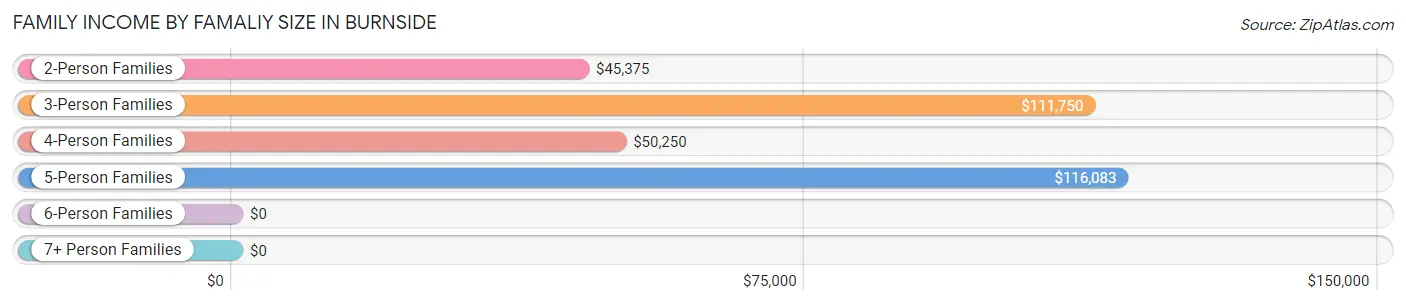
| Income Bracket | # Families | Median Income |
| 2-Person Families | 190 (64.2%) | $45,375 |
| 3-Person Families | 43 (14.5%) | $111,750 |
| 4-Person Families | 31 (10.5%) | $50,250 |
| 5-Person Families | 21 (7.1%) | $116,083 |
| 6-Person Families | 11 (3.7%) | $0 |
| 7+ Person Families | 0 (0.0%) | $0 |
| Total | 296 (100.0%) | $52,143 |
Family Income by Number of Earners in Burnside
The median family income in Burnside is $52,143, with families comprising 3+ earners (11) having the highest median family income of $112,250, while families with 1 earner (100) have the lowest median family income of $30,000, accounting for 3.7% and 33.8% of families, respectively.
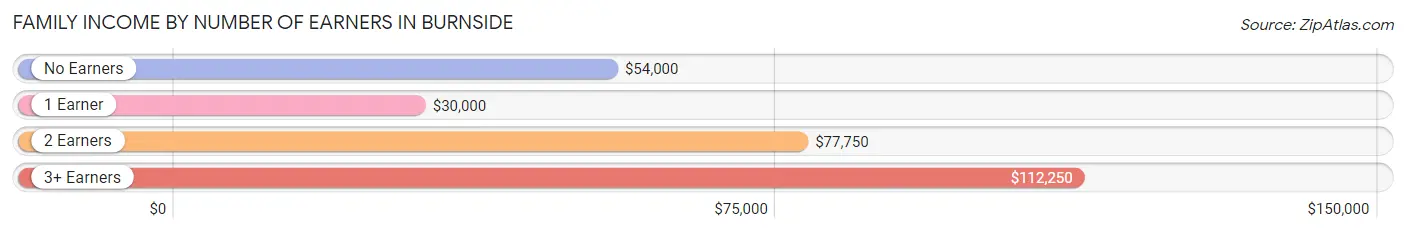
| Number of Earners | # Families | Median Income |
| No Earners | 98 (33.1%) | $54,000 |
| 1 Earner | 100 (33.8%) | $30,000 |
| 2 Earners | 87 (29.4%) | $77,750 |
| 3+ Earners | 11 (3.7%) | $112,250 |
| Total | 296 (100.0%) | $52,143 |
Household Income in Burnside
Household Income Brackets in Burnside
With 96 households falling in the category, the $50,000 to $74,999 income range is the most frequent in Burnside, accounting for 24.4% of all households. In contrast, only 2 households (0.5%) fall into the $200,000+ income bracket, making it the least populous group.
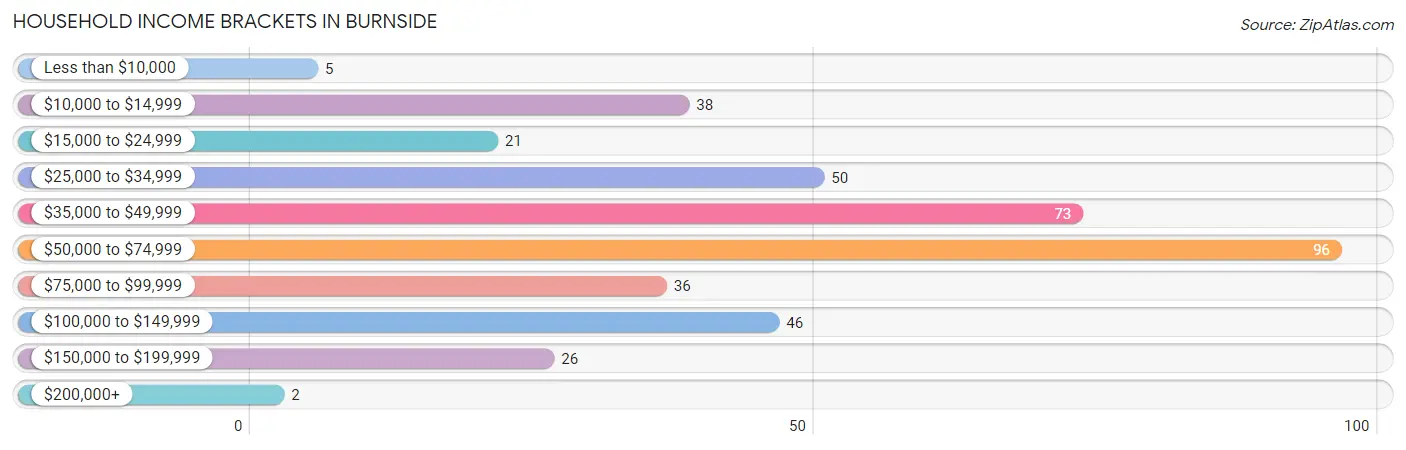
| Income Bracket | # Households | % Households |
| Less than $10,000 | 5 | 1.3% |
| $10,000 to $14,999 | 38 | 9.7% |
| $15,000 to $24,999 | 21 | 5.3% |
| $25,000 to $34,999 | 50 | 12.7% |
| $35,000 to $49,999 | 73 | 18.6% |
| $50,000 to $74,999 | 96 | 24.4% |
| $75,000 to $99,999 | 36 | 9.2% |
| $100,000 to $149,999 | 46 | 11.7% |
| $150,000 to $199,999 | 26 | 6.6% |
| $200,000+ | 2 | 0.5% |
Household Income by Householder Age in Burnside
The median household income in Burnside is $52,847, with the highest median household income of $53,571 found in the 65+ years age bracket for the primary householder. A total of 132 households (33.6%) fall into this category. Meanwhile, the 15 to 24 years age bracket for the primary householder has the lowest median household income of $0, with 13 households (3.3%) in this group.
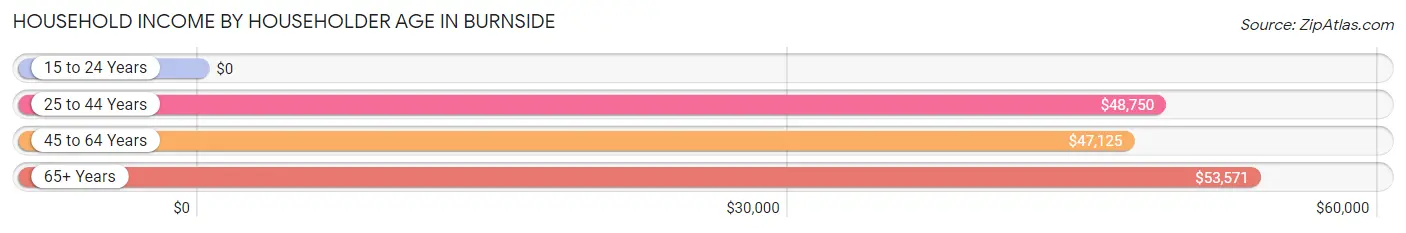
| Income Bracket | # Households | Median Income |
| 15 to 24 Years | 13 (3.3%) | $0 |
| 25 to 44 Years | 108 (27.5%) | $48,750 |
| 45 to 64 Years | 140 (35.6%) | $47,125 |
| 65+ Years | 132 (33.6%) | $53,571 |
| Total | 393 (100.0%) | $52,847 |
Poverty in Burnside
Income Below Poverty by Sex and Age in Burnside
With 17.1% poverty level for males and 28.1% for females among the residents of Burnside, 45 to 54 year old males and 35 to 44 year old females are the most vulnerable to poverty, with 15 males (39.5%) and 96 females (55.8%) in their respective age groups living below the poverty level.
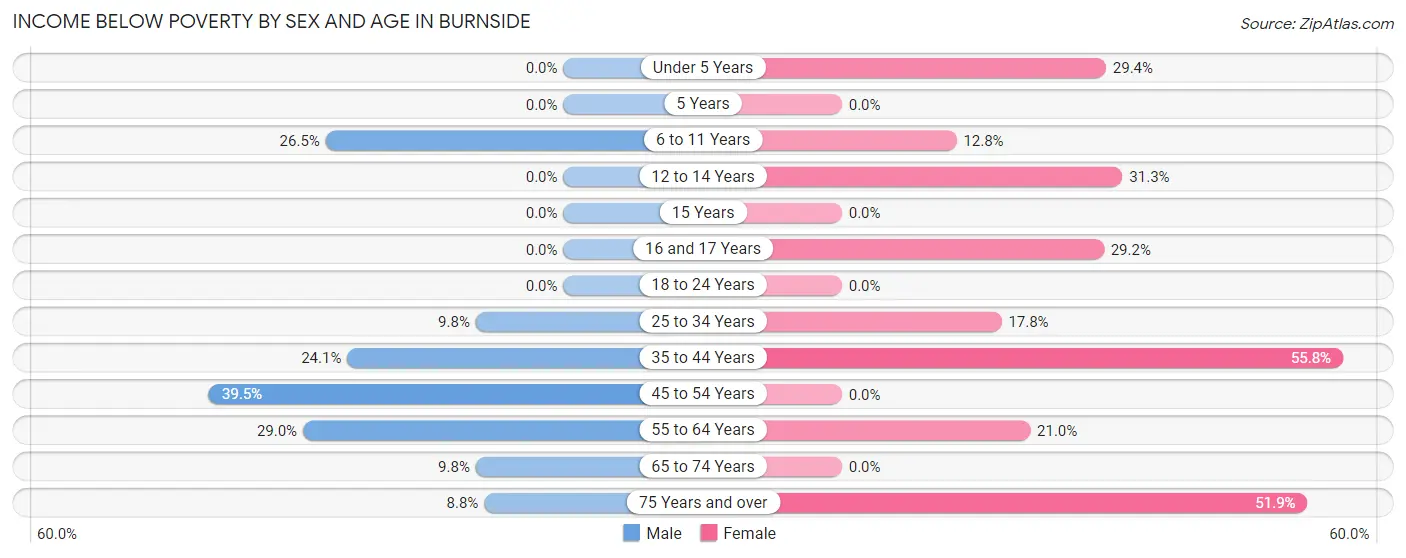
| Age Bracket | Male | Female |
| Under 5 Years | 0 (0.0%) | 5 (29.4%) |
| 5 Years | 0 (0.0%) | 0 (0.0%) |
| 6 to 11 Years | 9 (26.5%) | 6 (12.8%) |
| 12 to 14 Years | 0 (0.0%) | 5 (31.2%) |
| 15 Years | 0 (0.0%) | 0 (0.0%) |
| 16 and 17 Years | 0 (0.0%) | 7 (29.2%) |
| 18 to 24 Years | 0 (0.0%) | 0 (0.0%) |
| 25 to 34 Years | 4 (9.8%) | 8 (17.8%) |
| 35 to 44 Years | 13 (24.1%) | 96 (55.8%) |
| 45 to 54 Years | 15 (39.5%) | 0 (0.0%) |
| 55 to 64 Years | 29 (29.0%) | 13 (21.0%) |
| 65 to 74 Years | 8 (9.8%) | 0 (0.0%) |
| 75 Years and over | 3 (8.8%) | 28 (51.8%) |
| Total | 81 (17.1%) | 168 (28.1%) |
Income Above Poverty by Sex and Age in Burnside
According to the poverty statistics in Burnside, males aged under 5 years and females aged 5 years are the age groups that are most secure financially, with 100.0% of males and 100.0% of females in these age groups living above the poverty line.
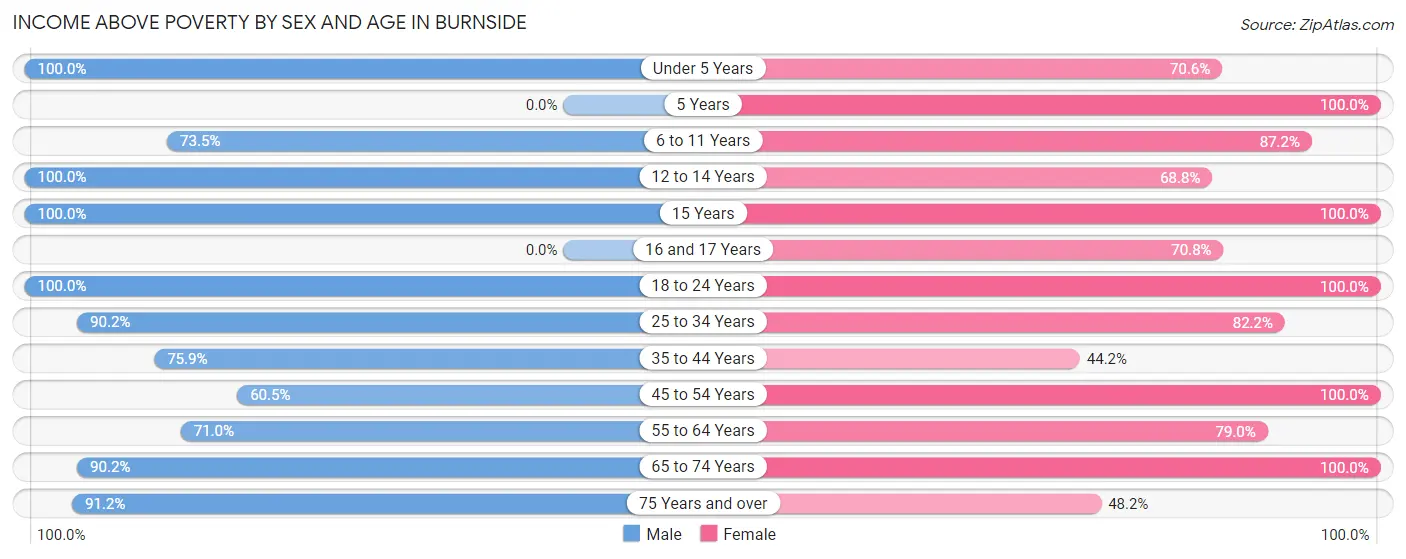
| Age Bracket | Male | Female |
| Under 5 Years | 20 (100.0%) | 12 (70.6%) |
| 5 Years | 0 (0.0%) | 22 (100.0%) |
| 6 to 11 Years | 25 (73.5%) | 41 (87.2%) |
| 12 to 14 Years | 8 (100.0%) | 11 (68.8%) |
| 15 Years | 27 (100.0%) | 6 (100.0%) |
| 16 and 17 Years | 0 (0.0%) | 17 (70.8%) |
| 18 to 24 Years | 36 (100.0%) | 30 (100.0%) |
| 25 to 34 Years | 37 (90.2%) | 37 (82.2%) |
| 35 to 44 Years | 41 (75.9%) | 76 (44.2%) |
| 45 to 54 Years | 23 (60.5%) | 35 (100.0%) |
| 55 to 64 Years | 71 (71.0%) | 49 (79.0%) |
| 65 to 74 Years | 74 (90.2%) | 67 (100.0%) |
| 75 Years and over | 31 (91.2%) | 26 (48.1%) |
| Total | 393 (82.9%) | 429 (71.9%) |
Income Below Poverty Among Married-Couple Families in Burnside
The poverty statistics for married-couple families in Burnside show that 4.7% or 10 of the total 212 families live below the poverty line. Families with no children have the highest poverty rate of 7.0%, comprising of 10 families. On the other hand, families with 1 or 2 children have the lowest poverty rate of 0.0%, which includes 0 families.
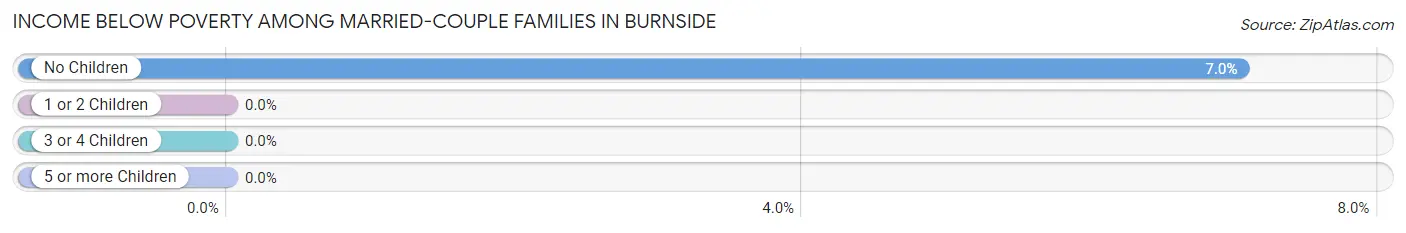
| Children | Above Poverty | Below Poverty |
| No Children | 132 (93.0%) | 10 (7.0%) |
| 1 or 2 Children | 44 (100.0%) | 0 (0.0%) |
| 3 or 4 Children | 26 (100.0%) | 0 (0.0%) |
| 5 or more Children | 0 (0.0%) | 0 (0.0%) |
| Total | 202 (95.3%) | 10 (4.7%) |
Income Below Poverty Among Single-Parent Households in Burnside
According to the poverty data in Burnside, 35.7% or 10 single-father households and 42.9% or 24 single-mother households are living below the poverty line. Among single-father households, those with no children have the highest poverty rate, with 10 households (43.5%) experiencing poverty. Likewise, among single-mother households, those with 3 or 4 children have the highest poverty rate, with 4 households (100.0%) falling below the poverty line.
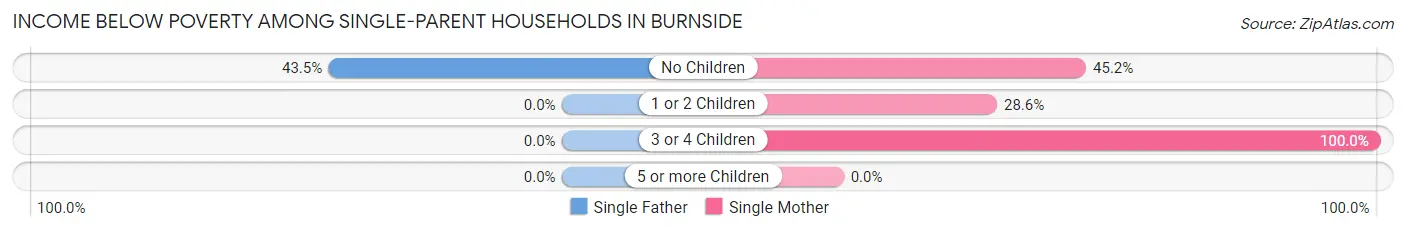
| Children | Single Father | Single Mother |
| No Children | 10 (43.5%) | 14 (45.2%) |
| 1 or 2 Children | 0 (0.0%) | 6 (28.6%) |
| 3 or 4 Children | 0 (0.0%) | 4 (100.0%) |
| 5 or more Children | 0 (0.0%) | 0 (0.0%) |
| Total | 10 (35.7%) | 24 (42.9%) |
Income Below Poverty Among Married-Couple vs Single-Parent Households in Burnside
The poverty data for Burnside shows that 10 of the married-couple family households (4.7%) and 34 of the single-parent households (40.5%) are living below the poverty level. Within the married-couple family households, those with no children have the highest poverty rate, with 10 households (7.0%) falling below the poverty line. Among the single-parent households, those with 3 or 4 children have the highest poverty rate, with 4 household (100.0%) living below poverty.
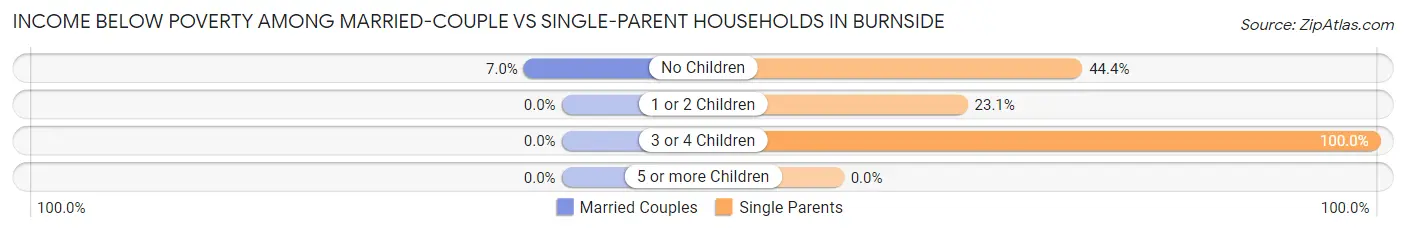
| Children | Married-Couple Families | Single-Parent Households |
| No Children | 10 (7.0%) | 24 (44.4%) |
| 1 or 2 Children | 0 (0.0%) | 6 (23.1%) |
| 3 or 4 Children | 0 (0.0%) | 4 (100.0%) |
| 5 or more Children | 0 (0.0%) | 0 (0.0%) |
| Total | 10 (4.7%) | 34 (40.5%) |
Race in Burnside
The most populous races in Burnside are White / Caucasian (1,036 | 95.8%), Hispanic or Latino (37 | 3.4%), and Some other Race (25 | 2.3%).
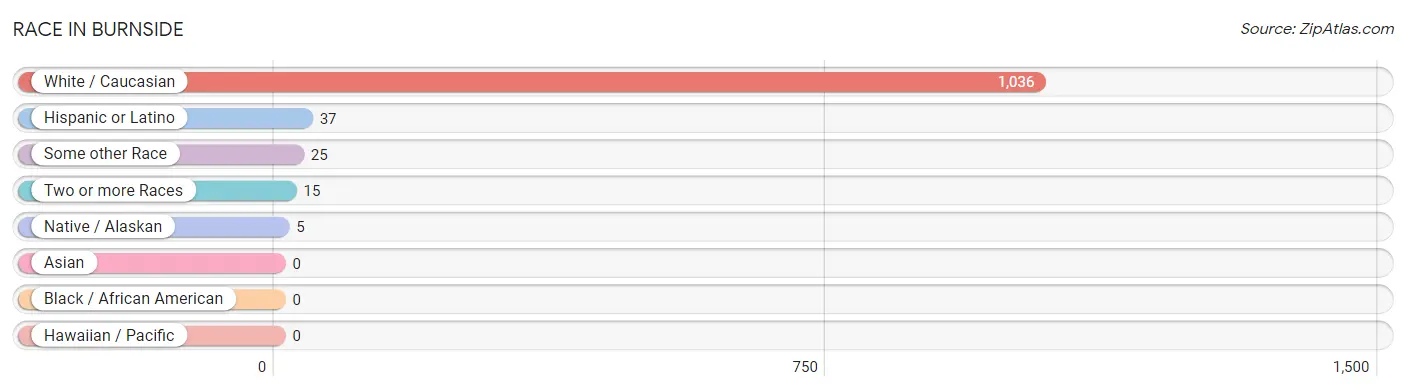
| Race | # Population | % Population |
| Asian | 0 | 0.0% |
| Black / African American | 0 | 0.0% |
| Hawaiian / Pacific | 0 | 0.0% |
| Hispanic or Latino | 37 | 3.4% |
| Native / Alaskan | 5 | 0.5% |
| White / Caucasian | 1,036 | 95.8% |
| Two or more Races | 15 | 1.4% |
| Some other Race | 25 | 2.3% |
| Total | 1,081 | 100.0% |
Ancestry in Burnside
The most populous ancestries reported in Burnside are English (133 | 12.3%), Irish (122 | 11.3%), American (92 | 8.5%), German (78 | 7.2%), and Scotch-Irish (40 | 3.7%), together accounting for 43.0% of all Burnside residents.
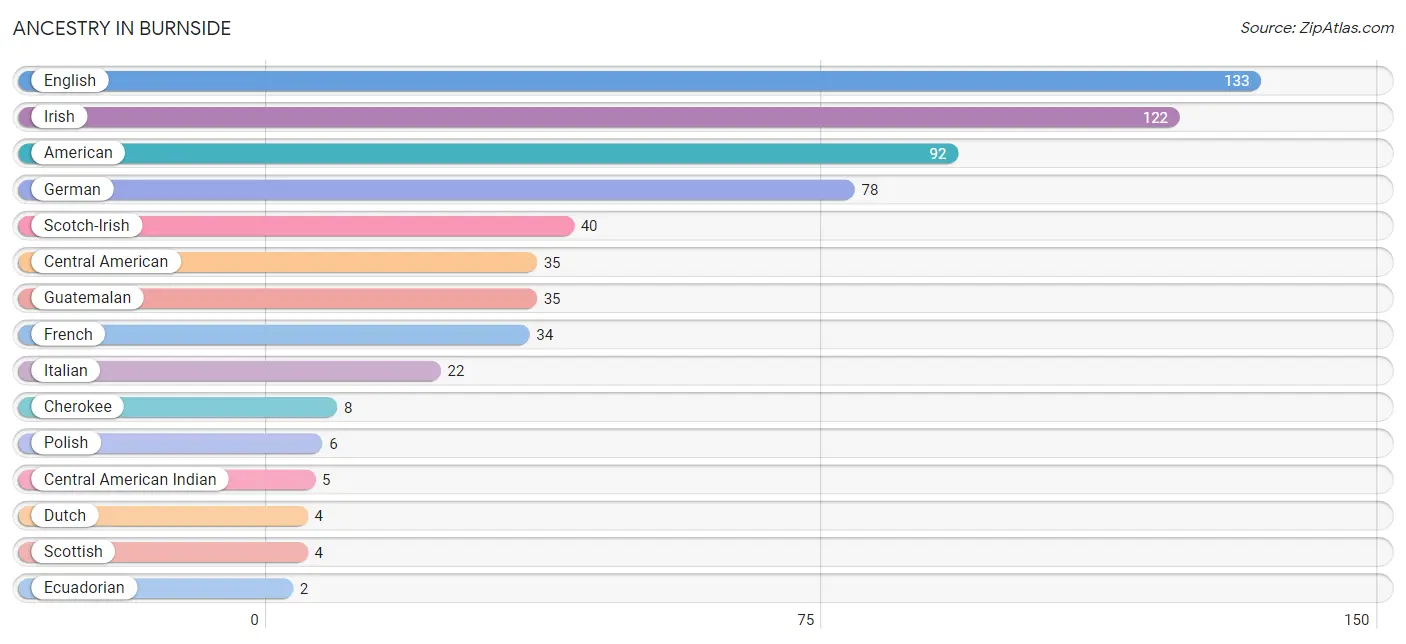
| Ancestry | # Population | % Population |
| American | 92 | 8.5% |
| Central American | 35 | 3.2% |
| Central American Indian | 5 | 0.5% |
| Cherokee | 8 | 0.7% |
| Dutch | 4 | 0.4% |
| Ecuadorian | 2 | 0.2% |
| English | 133 | 12.3% |
| French | 34 | 3.2% |
| French Canadian | 1 | 0.1% |
| German | 78 | 7.2% |
| Guatemalan | 35 | 3.2% |
| Irish | 122 | 11.3% |
| Italian | 22 | 2.0% |
| Polish | 6 | 0.6% |
| Scotch-Irish | 40 | 3.7% |
| Scottish | 4 | 0.4% |
| South American | 2 | 0.2% |
| South American Indian | 2 | 0.2% | View All 18 Rows |
Immigrants in Burnside
The most numerous immigrant groups reported in Burnside came from Central America (9 | 0.8%), Guatemala (9 | 0.8%), and Latin America (9 | 0.8%), together accounting for 2.5% of all Burnside residents.
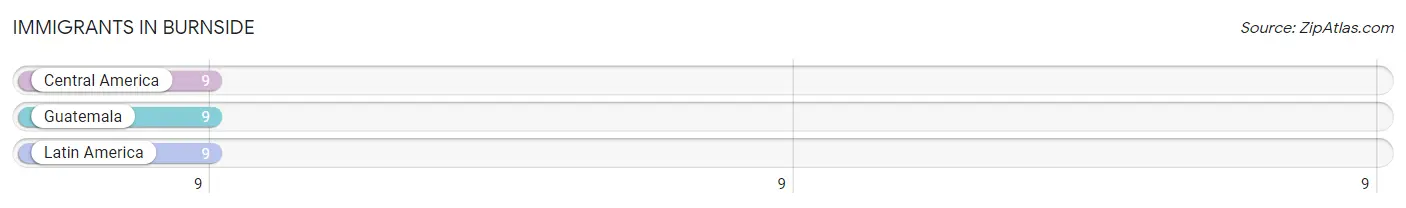
| Immigration Origin | # Population | % Population |
| Central America | 9 | 0.8% |
| Guatemala | 9 | 0.8% |
| Latin America | 9 | 0.8% | View All 3 Rows |
Sex and Age in Burnside
Sex and Age in Burnside
The most populous age groups in Burnside are 60 to 64 Years (75 | 15.8%) for men and 35 to 39 Years (126 | 20.8%) for women.
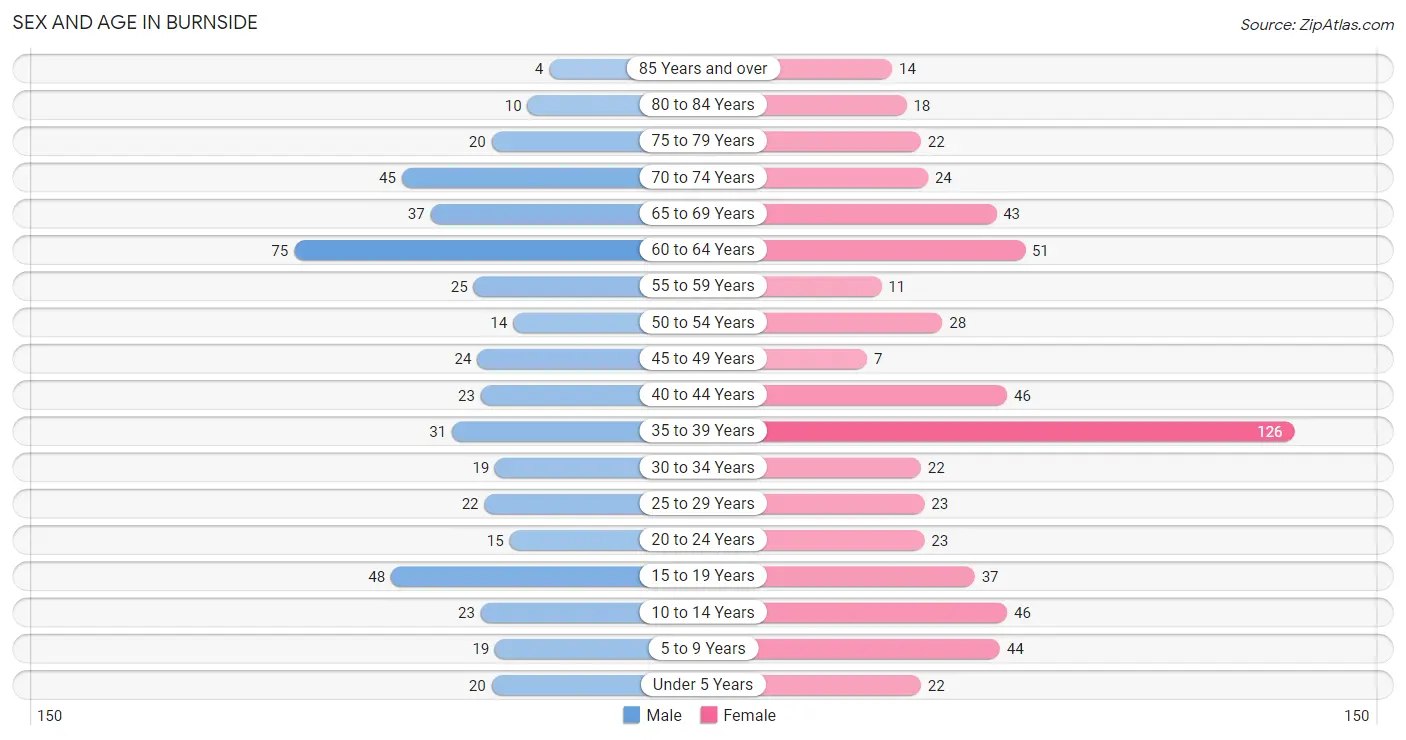
| Age Bracket | Male | Female |
| Under 5 Years | 20 (4.2%) | 22 (3.6%) |
| 5 to 9 Years | 19 (4.0%) | 44 (7.2%) |
| 10 to 14 Years | 23 (4.9%) | 46 (7.6%) |
| 15 to 19 Years | 48 (10.1%) | 37 (6.1%) |
| 20 to 24 Years | 15 (3.2%) | 23 (3.8%) |
| 25 to 29 Years | 22 (4.6%) | 23 (3.8%) |
| 30 to 34 Years | 19 (4.0%) | 22 (3.6%) |
| 35 to 39 Years | 31 (6.5%) | 126 (20.8%) |
| 40 to 44 Years | 23 (4.9%) | 46 (7.6%) |
| 45 to 49 Years | 24 (5.1%) | 7 (1.1%) |
| 50 to 54 Years | 14 (2.9%) | 28 (4.6%) |
| 55 to 59 Years | 25 (5.3%) | 11 (1.8%) |
| 60 to 64 Years | 75 (15.8%) | 51 (8.4%) |
| 65 to 69 Years | 37 (7.8%) | 43 (7.1%) |
| 70 to 74 Years | 45 (9.5%) | 24 (4.0%) |
| 75 to 79 Years | 20 (4.2%) | 22 (3.6%) |
| 80 to 84 Years | 10 (2.1%) | 18 (3.0%) |
| 85 Years and over | 4 (0.8%) | 14 (2.3%) |
| Total | 474 (100.0%) | 607 (100.0%) |
Families and Households in Burnside
Median Family Size in Burnside
The median family size in Burnside is 2.87 persons per family, with married-couple families (212 | 71.6%) accounting for the largest median family size of 3.01 persons per family. On the other hand, single female/mother families (56 | 18.9%) represent the smallest median family size with 2.45 persons per family.
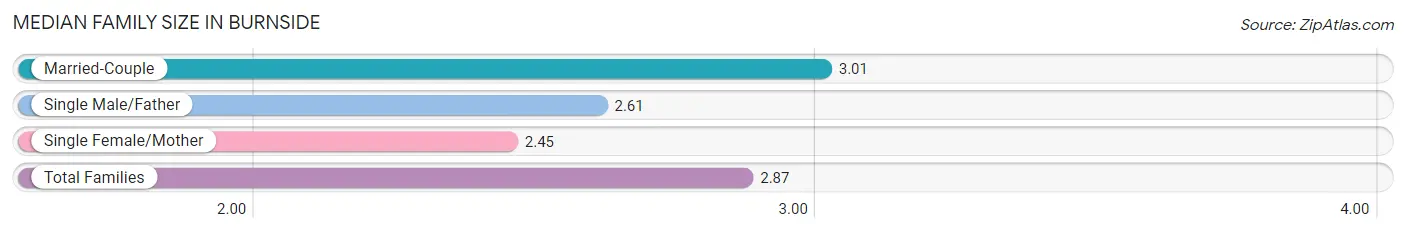
| Family Type | # Families | Family Size |
| Married-Couple | 212 (71.6%) | 3.01 |
| Single Male/Father | 28 (9.5%) | 2.61 |
| Single Female/Mother | 56 (18.9%) | 2.45 |
| Total Families | 296 (100.0%) | 2.87 |
Median Household Size in Burnside
The median household size in Burnside is 2.75 persons per household, with single male/father households (28 | 7.1%) accounting for the largest median household size of 3.14 persons per household. non-family households (97 | 24.7%) represent the smallest median household size with 2.03 persons per household.
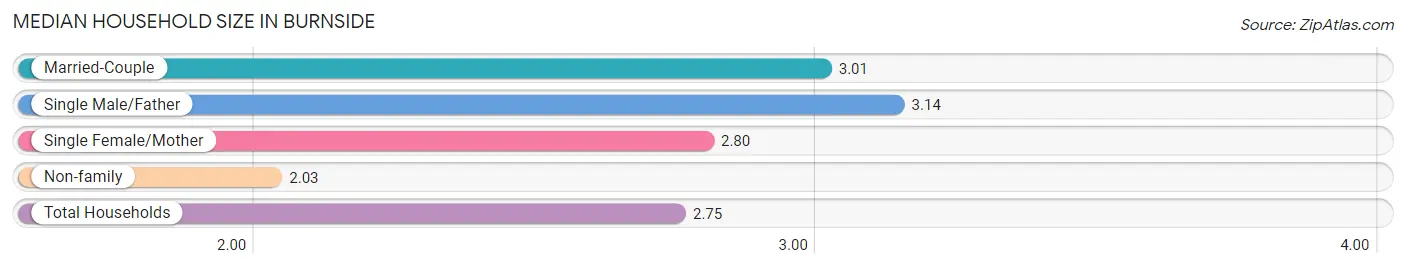
| Household Type | # Households | Household Size |
| Married-Couple | 212 (53.9%) | 3.01 |
| Single Male/Father | 28 (7.1%) | 3.14 |
| Single Female/Mother | 56 (14.2%) | 2.80 |
| Non-family | 97 (24.7%) | 2.03 |
| Total Households | 393 (100.0%) | 2.75 |
Household Size by Marriage Status in Burnside
Out of a total of 393 households in Burnside, 296 (75.3%) are family households, while 97 (24.7%) are nonfamily households. The most numerous type of family households are 2-person households, comprising 174, and the most common type of nonfamily households are 1-person households, comprising 65.
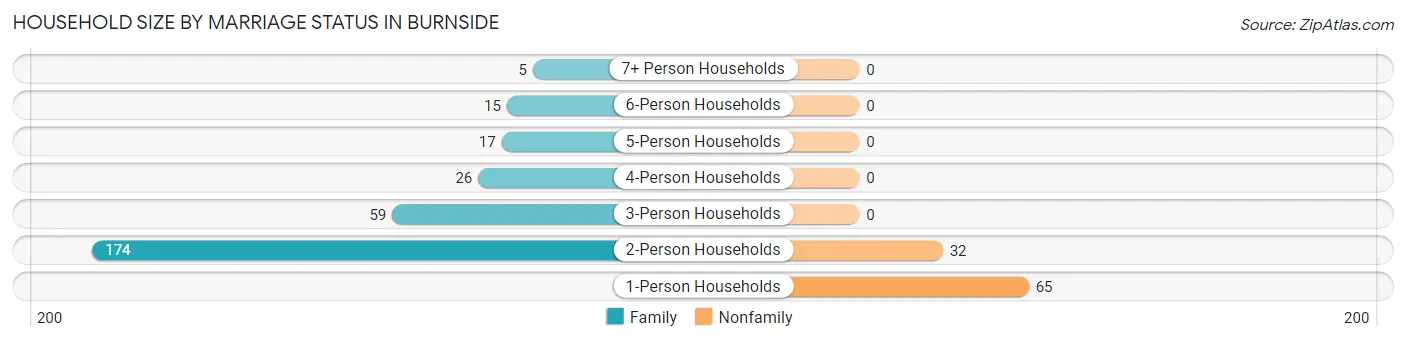
| Household Size | Family Households | Nonfamily Households |
| 1-Person Households | - | 65 (16.5%) |
| 2-Person Households | 174 (44.3%) | 32 (8.1%) |
| 3-Person Households | 59 (15.0%) | 0 (0.0%) |
| 4-Person Households | 26 (6.6%) | 0 (0.0%) |
| 5-Person Households | 17 (4.3%) | 0 (0.0%) |
| 6-Person Households | 15 (3.8%) | 0 (0.0%) |
| 7+ Person Households | 5 (1.3%) | 0 (0.0%) |
| Total | 296 (75.3%) | 97 (24.7%) |
Female Fertility in Burnside
Fertility by Age in Burnside
Average fertility rate in Burnside is 66.0 births per 1,000 women. Women in the age bracket of 20 to 34 years have the highest fertility rate with 147.0 births per 1,000 women. Women in the age bracket of 20 to 34 years acount for 52.6% of all women with births.
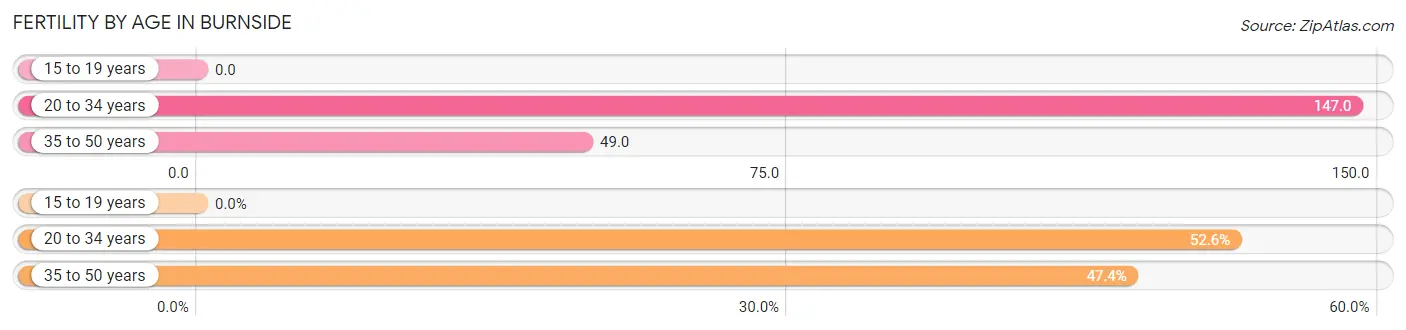
| Age Bracket | Women with Births | Births / 1,000 Women |
| 15 to 19 years | 0 (0.0%) | 0.0 |
| 20 to 34 years | 10 (52.6%) | 147.0 |
| 35 to 50 years | 9 (47.4%) | 49.0 |
| Total | 19 (100.0%) | 66.0 |
Fertility by Age by Marriage Status in Burnside
78.9% of women with births (19) in Burnside are married. The highest percentage of unmarried women with births falls into 35 to 50 years age bracket with 44.4% of them unmarried at the time of birth, while the lowest percentage of unmarried women with births belong to 20 to 34 years age bracket with 0.0% of them unmarried.
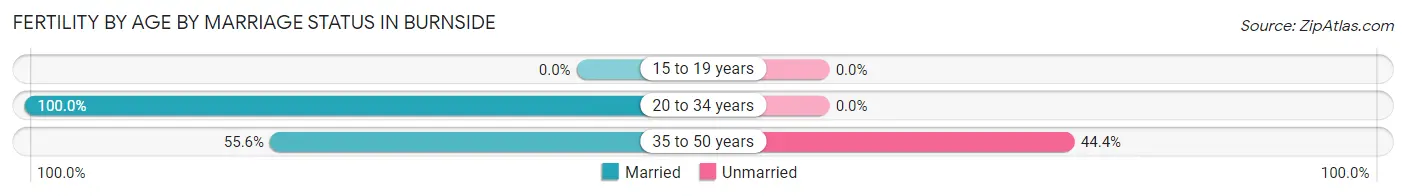
| Age Bracket | Married | Unmarried |
| 15 to 19 years | 0 (0.0%) | 0 (0.0%) |
| 20 to 34 years | 10 (100.0%) | 0 (0.0%) |
| 35 to 50 years | 5 (55.6%) | 4 (44.4%) |
| Total | 15 (78.9%) | 4 (21.0%) |
Fertility by Education in Burnside
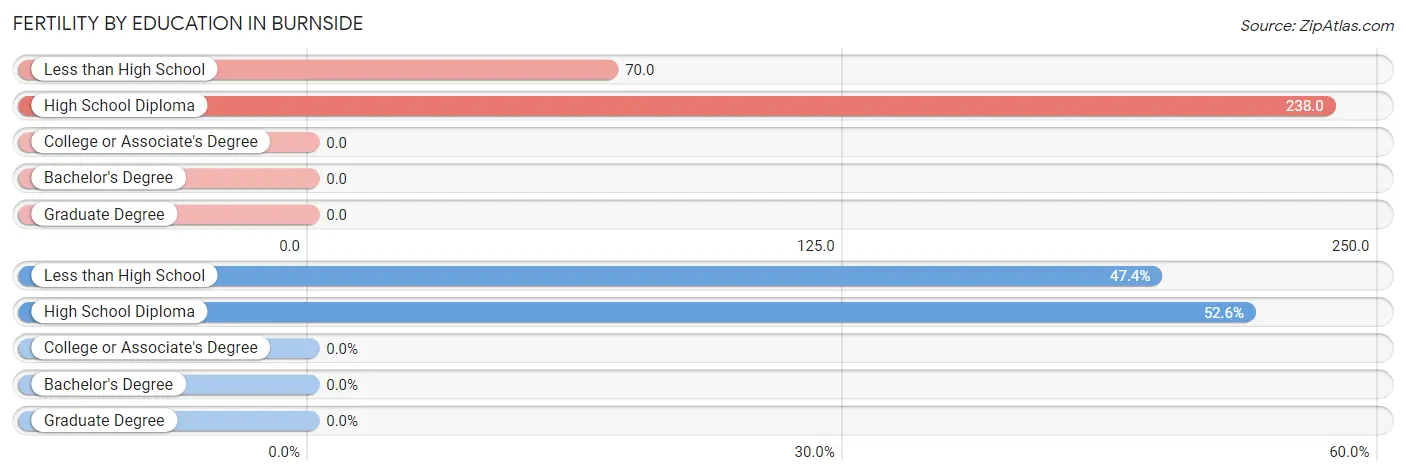
| Educational Attainment | Women with Births | Births / 1,000 Women |
| Less than High School | 9 (47.4%) | 70.0 |
| High School Diploma | 10 (52.6%) | 238.0 |
| College or Associate's Degree | 0 (0.0%) | 0.0 |
| Bachelor's Degree | 0 (0.0%) | 0.0 |
| Graduate Degree | 0 (0.0%) | 0.0 |
| Total | 19 (100.0%) | 66.0 |
Fertility by Education by Marriage Status in Burnside
21.0% of women with births in Burnside are unmarried. Women with the educational attainment of high school diploma are most likely to be married with 100.0% of them married at childbirth, while women with the educational attainment of less than high school are least likely to be married with 44.4% of them unmarried at childbirth.
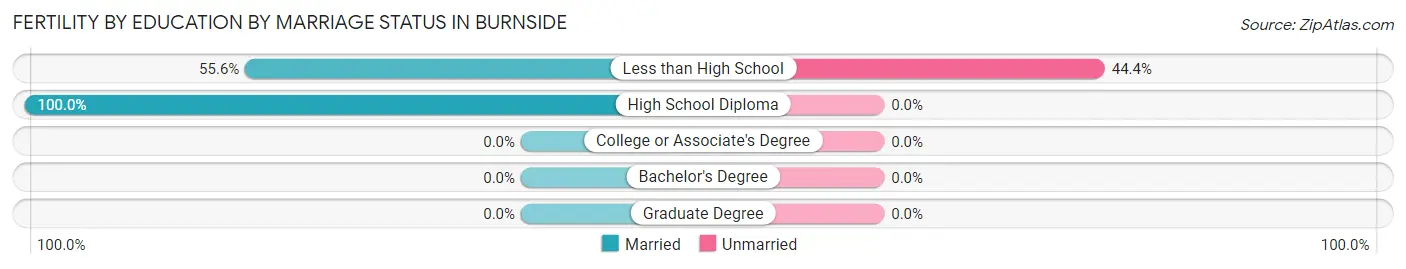
| Educational Attainment | Married | Unmarried |
| Less than High School | 5 (55.6%) | 4 (44.4%) |
| High School Diploma | 10 (100.0%) | 0 (0.0%) |
| College or Associate's Degree | 0 (0.0%) | 0 (0.0%) |
| Bachelor's Degree | 0 (0.0%) | 0 (0.0%) |
| Graduate Degree | 0 (0.0%) | 0 (0.0%) |
| Total | 15 (78.9%) | 4 (21.0%) |
Employment Characteristics in Burnside
Employment by Class of Employer in Burnside
Among the 375 employed individuals in Burnside, private company employees (279 | 74.4%), self-employed (not incorporated) (38 | 10.1%), and not-for-profit organizations (34 | 9.1%) make up the most common classes of employment.
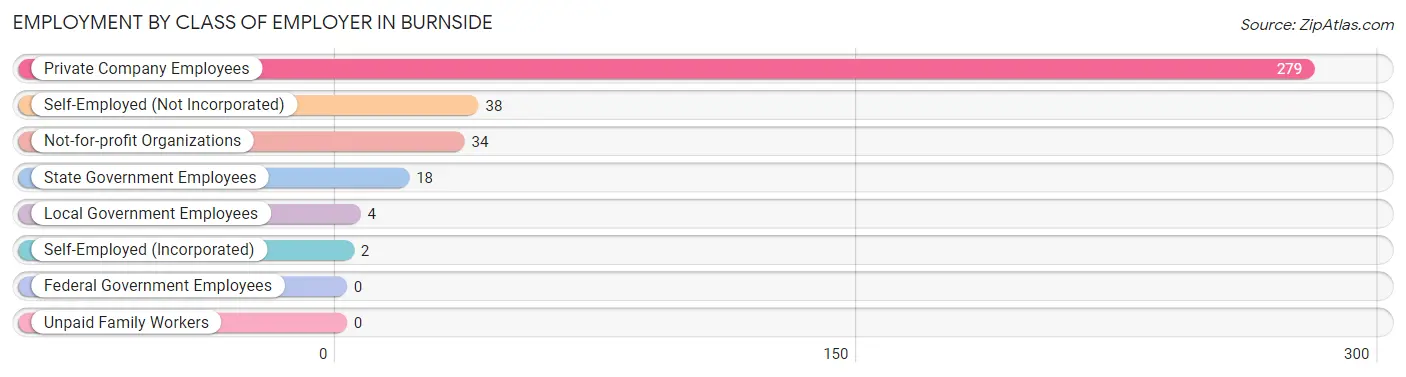
| Employer Class | # Employees | % Employees |
| Private Company Employees | 279 | 74.4% |
| Self-Employed (Incorporated) | 2 | 0.5% |
| Self-Employed (Not Incorporated) | 38 | 10.1% |
| Not-for-profit Organizations | 34 | 9.1% |
| Local Government Employees | 4 | 1.1% |
| State Government Employees | 18 | 4.8% |
| Federal Government Employees | 0 | 0.0% |
| Unpaid Family Workers | 0 | 0.0% |
| Total | 375 | 100.0% |
Employment Status by Age in Burnside
According to the labor force statistics for Burnside, out of the total population over 16 years of age (874), 44.1% or 385 individuals are in the labor force, with 2.6% or 10 of them unemployed. The age group with the highest labor force participation rate is 20 to 24 years, with 100.0% or 38 individuals in the labor force. Within the labor force, the 55 to 59 years age range has the highest percentage of unemployed individuals, with 26.3% or 5 of them being unemployed.
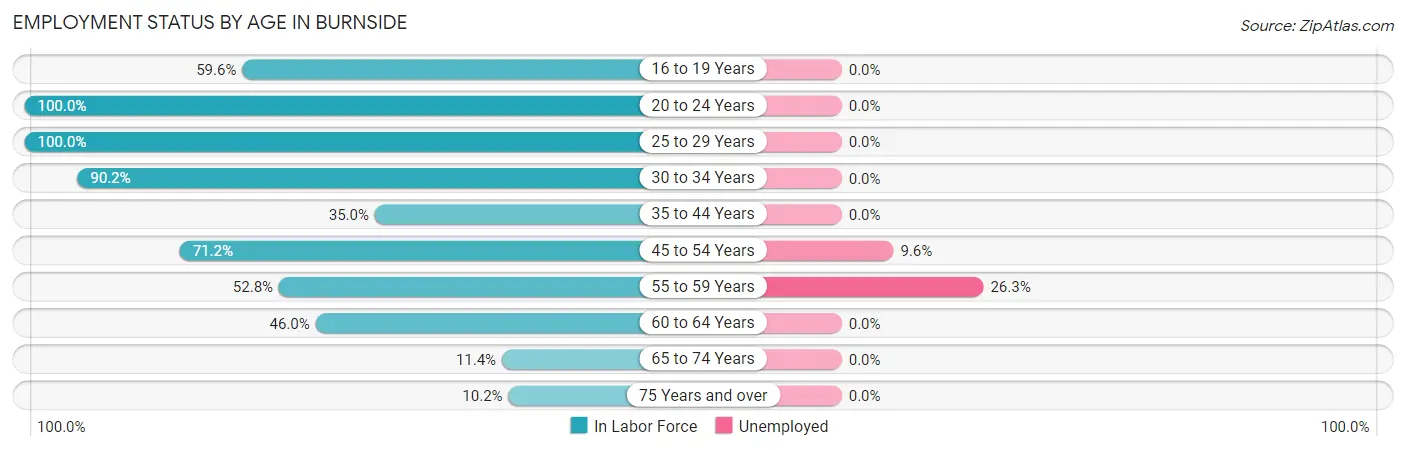
| Age Bracket | In Labor Force | Unemployed |
| 16 to 19 Years | 31 (59.6%) | 0 (0.0%) |
| 20 to 24 Years | 38 (100.0%) | 0 (0.0%) |
| 25 to 29 Years | 45 (100.0%) | 0 (0.0%) |
| 30 to 34 Years | 37 (90.2%) | 0 (0.0%) |
| 35 to 44 Years | 79 (35.0%) | 0 (0.0%) |
| 45 to 54 Years | 52 (71.2%) | 5 (9.6%) |
| 55 to 59 Years | 19 (52.8%) | 5 (26.3%) |
| 60 to 64 Years | 58 (46.0%) | 0 (0.0%) |
| 65 to 74 Years | 17 (11.4%) | 0 (0.0%) |
| 75 Years and over | 9 (10.2%) | 0 (0.0%) |
| Total | 385 (44.1%) | 10 (2.6%) |
Employment Status by Educational Attainment in Burnside
According to labor force statistics for Burnside, 53.0% of individuals (290) out of the total population between 25 and 64 years of age (547) are in the labor force, with 3.4% or 10 of them being unemployed. The group with the highest labor force participation rate are those with the educational attainment of college / associate degree, with 88.8% or 103 individuals in the labor force. Within the labor force, individuals with less than high school education have the highest percentage of unemployment, with 16.1% or 5 of them being unemployed.
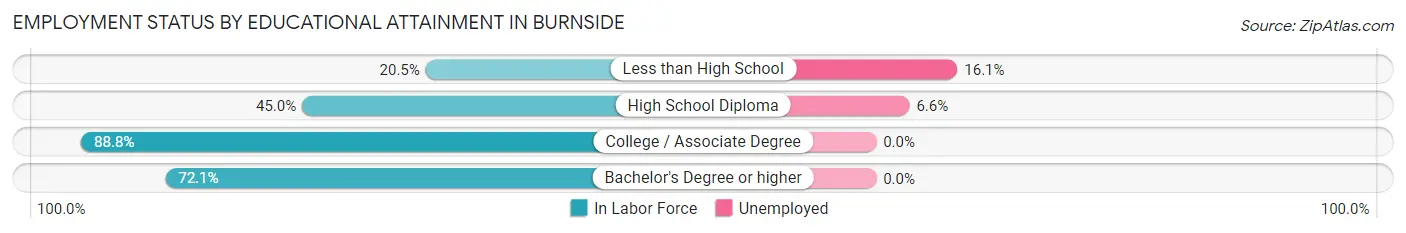
| Educational Attainment | In Labor Force | Unemployed |
| Less than High School | 31 (20.5%) | 24 (16.1%) |
| High School Diploma | 76 (45.0%) | 11 (6.6%) |
| College / Associate Degree | 103 (88.8%) | 0 (0.0%) |
| Bachelor's Degree or higher | 80 (72.1%) | 0 (0.0%) |
| Total | 290 (53.0%) | 19 (3.4%) |
Employment Occupations by Sex in Burnside
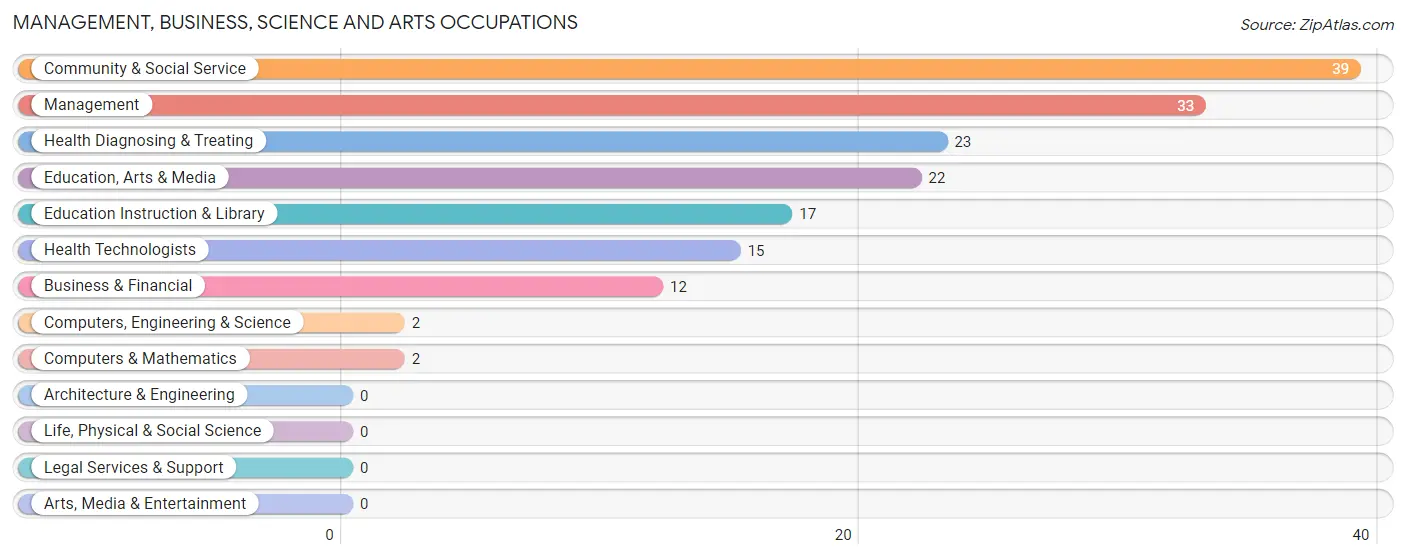
Management, Business, Science and Arts Occupations
The most common Management, Business, Science and Arts occupations in Burnside are Community & Social Service (39 | 10.4%), Management (33 | 8.8%), Health Diagnosing & Treating (23 | 6.1%), Education, Arts & Media (22 | 5.9%), and Education Instruction & Library (17 | 4.5%).
Management, Business, Science and Arts Occupations by Sex
Within the Management, Business, Science and Arts occupations in Burnside, the most male-oriented occupations are Management (100.0%), Health Diagnosing & Treating (100.0%), and Health Technologists (100.0%), while the most female-oriented occupations are Business & Financial (100.0%), Computers, Engineering & Science (100.0%), and Computers & Mathematics (100.0%).
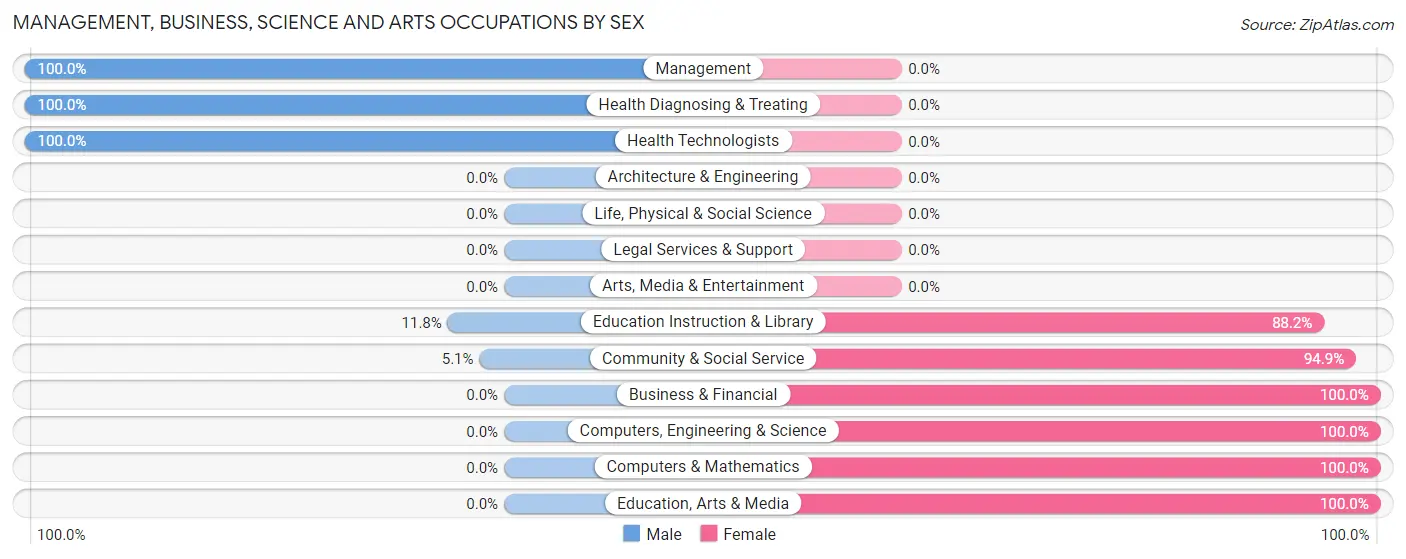
| Occupation | Male | Female |
| Management | 33 (100.0%) | 0 (0.0%) |
| Business & Financial | 0 (0.0%) | 12 (100.0%) |
| Computers, Engineering & Science | 0 (0.0%) | 2 (100.0%) |
| Computers & Mathematics | 0 (0.0%) | 2 (100.0%) |
| Architecture & Engineering | 0 (0.0%) | 0 (0.0%) |
| Life, Physical & Social Science | 0 (0.0%) | 0 (0.0%) |
| Community & Social Service | 2 (5.1%) | 37 (94.9%) |
| Education, Arts & Media | 0 (0.0%) | 22 (100.0%) |
| Legal Services & Support | 0 (0.0%) | 0 (0.0%) |
| Education Instruction & Library | 2 (11.8%) | 15 (88.2%) |
| Arts, Media & Entertainment | 0 (0.0%) | 0 (0.0%) |
| Health Diagnosing & Treating | 23 (100.0%) | 0 (0.0%) |
| Health Technologists | 15 (100.0%) | 0 (0.0%) |
| Total (Category) | 58 (53.2%) | 51 (46.8%) |
| Total (Overall) | 189 (50.4%) | 186 (49.6%) |
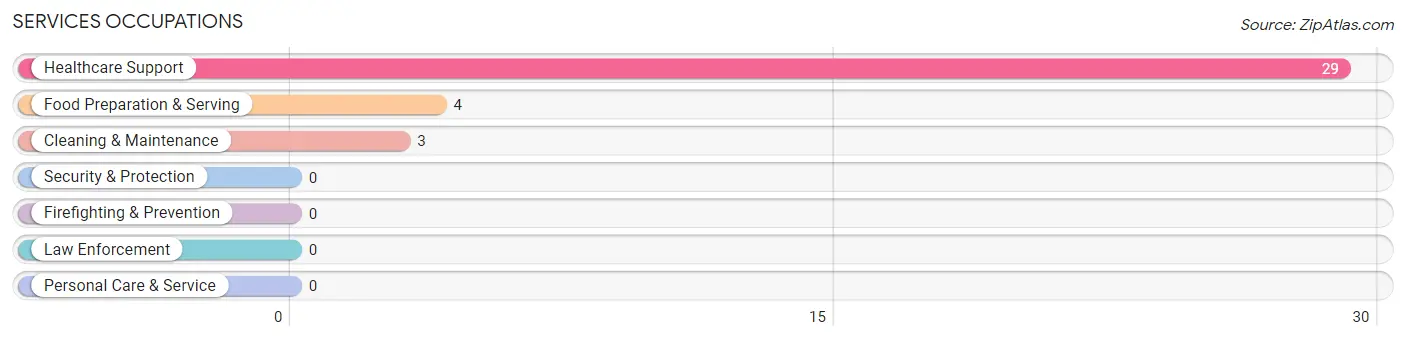
Services Occupations
The most common Services occupations in Burnside are Healthcare Support (29 | 7.7%), Food Preparation & Serving (4 | 1.1%), and Cleaning & Maintenance (3 | 0.8%).
Services Occupations by Sex
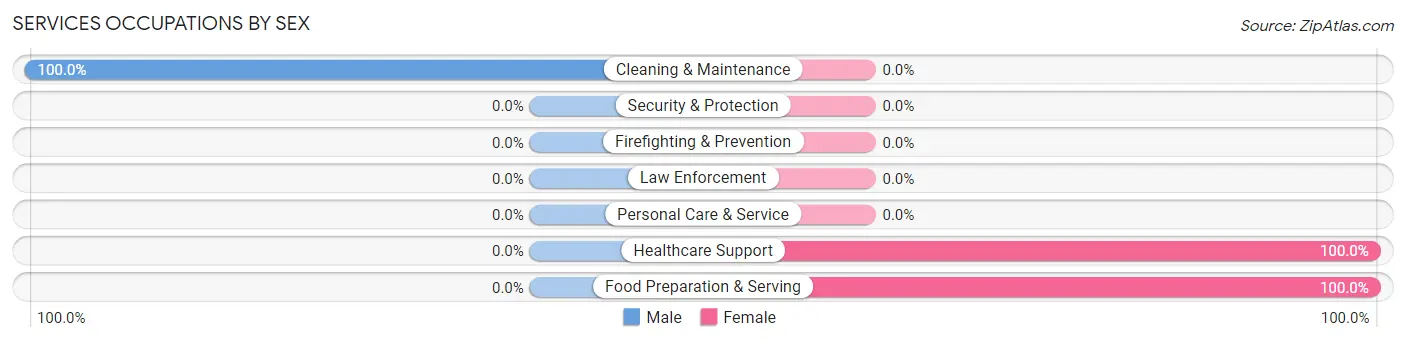
| Occupation | Male | Female |
| Healthcare Support | 0 (0.0%) | 29 (100.0%) |
| Security & Protection | 0 (0.0%) | 0 (0.0%) |
| Firefighting & Prevention | 0 (0.0%) | 0 (0.0%) |
| Law Enforcement | 0 (0.0%) | 0 (0.0%) |
| Food Preparation & Serving | 0 (0.0%) | 4 (100.0%) |
| Cleaning & Maintenance | 3 (100.0%) | 0 (0.0%) |
| Personal Care & Service | 0 (0.0%) | 0 (0.0%) |
| Total (Category) | 3 (8.3%) | 33 (91.7%) |
| Total (Overall) | 189 (50.4%) | 186 (49.6%) |
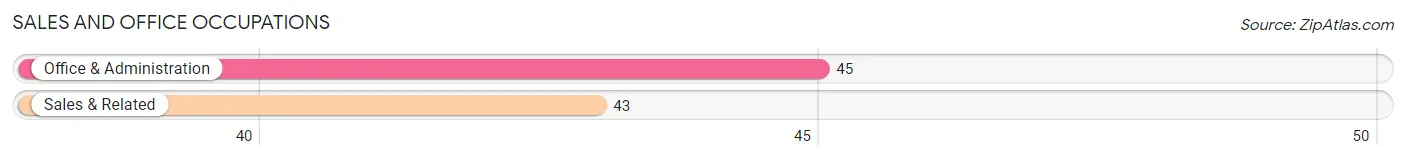
Sales and Office Occupations
The most common Sales and Office occupations in Burnside are Office & Administration (45 | 12.0%), and Sales & Related (43 | 11.5%).
Sales and Office Occupations by Sex
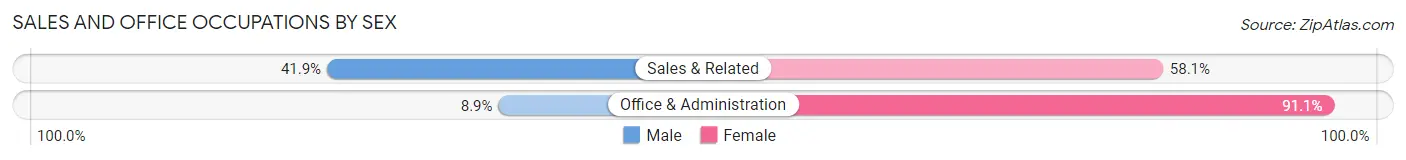
| Occupation | Male | Female |
| Sales & Related | 18 (41.9%) | 25 (58.1%) |
| Office & Administration | 4 (8.9%) | 41 (91.1%) |
| Total (Category) | 22 (25.0%) | 66 (75.0%) |
| Total (Overall) | 189 (50.4%) | 186 (49.6%) |
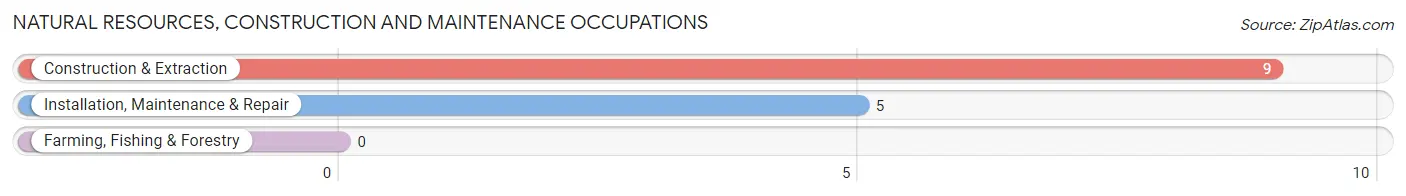
Natural Resources, Construction and Maintenance Occupations
The most common Natural Resources, Construction and Maintenance occupations in Burnside are Construction & Extraction (9 | 2.4%), and Installation, Maintenance & Repair (5 | 1.3%).
Natural Resources, Construction and Maintenance Occupations by Sex
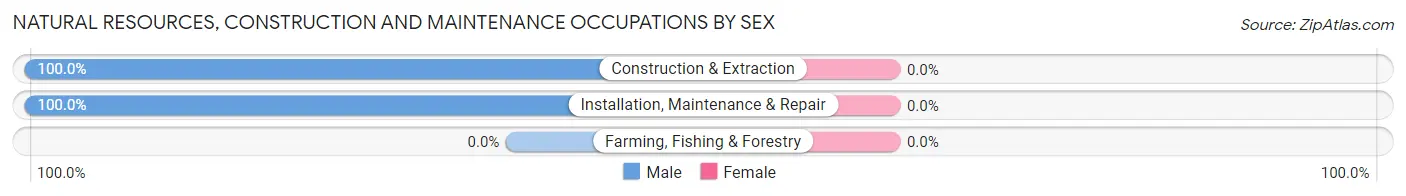
| Occupation | Male | Female |
| Farming, Fishing & Forestry | 0 (0.0%) | 0 (0.0%) |
| Construction & Extraction | 9 (100.0%) | 0 (0.0%) |
| Installation, Maintenance & Repair | 5 (100.0%) | 0 (0.0%) |
| Total (Category) | 14 (100.0%) | 0 (0.0%) |
| Total (Overall) | 189 (50.4%) | 186 (49.6%) |
Production, Transportation and Moving Occupations
The most common Production, Transportation and Moving occupations in Burnside are Production (69 | 18.4%), and Material Moving (59 | 15.7%).
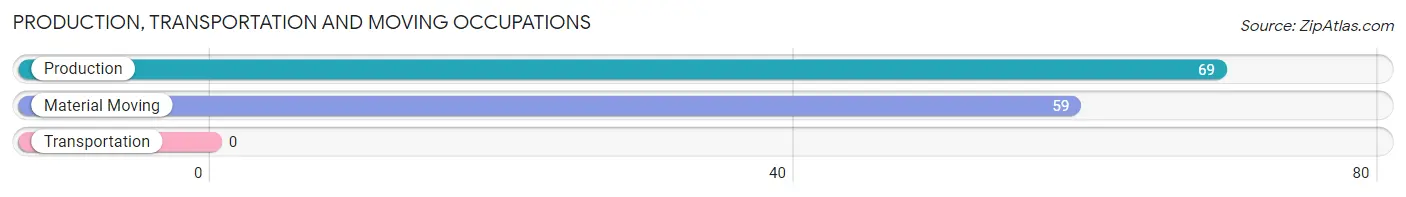
Production, Transportation and Moving Occupations by Sex
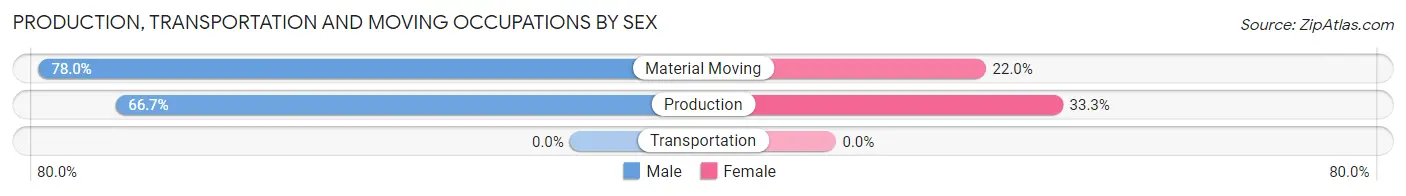
| Occupation | Male | Female |
| Production | 46 (66.7%) | 23 (33.3%) |
| Transportation | 0 (0.0%) | 0 (0.0%) |
| Material Moving | 46 (78.0%) | 13 (22.0%) |
| Total (Category) | 92 (71.9%) | 36 (28.1%) |
| Total (Overall) | 189 (50.4%) | 186 (49.6%) |
Employment Industries by Sex in Burnside
Employment Industries in Burnside
The major employment industries in Burnside include Manufacturing (133 | 35.5%), Health Care & Social Assistance (75 | 20.0%), Retail Trade (39 | 10.4%), Arts, Entertainment & Recreation (22 | 5.9%), and Educational Services (18 | 4.8%).
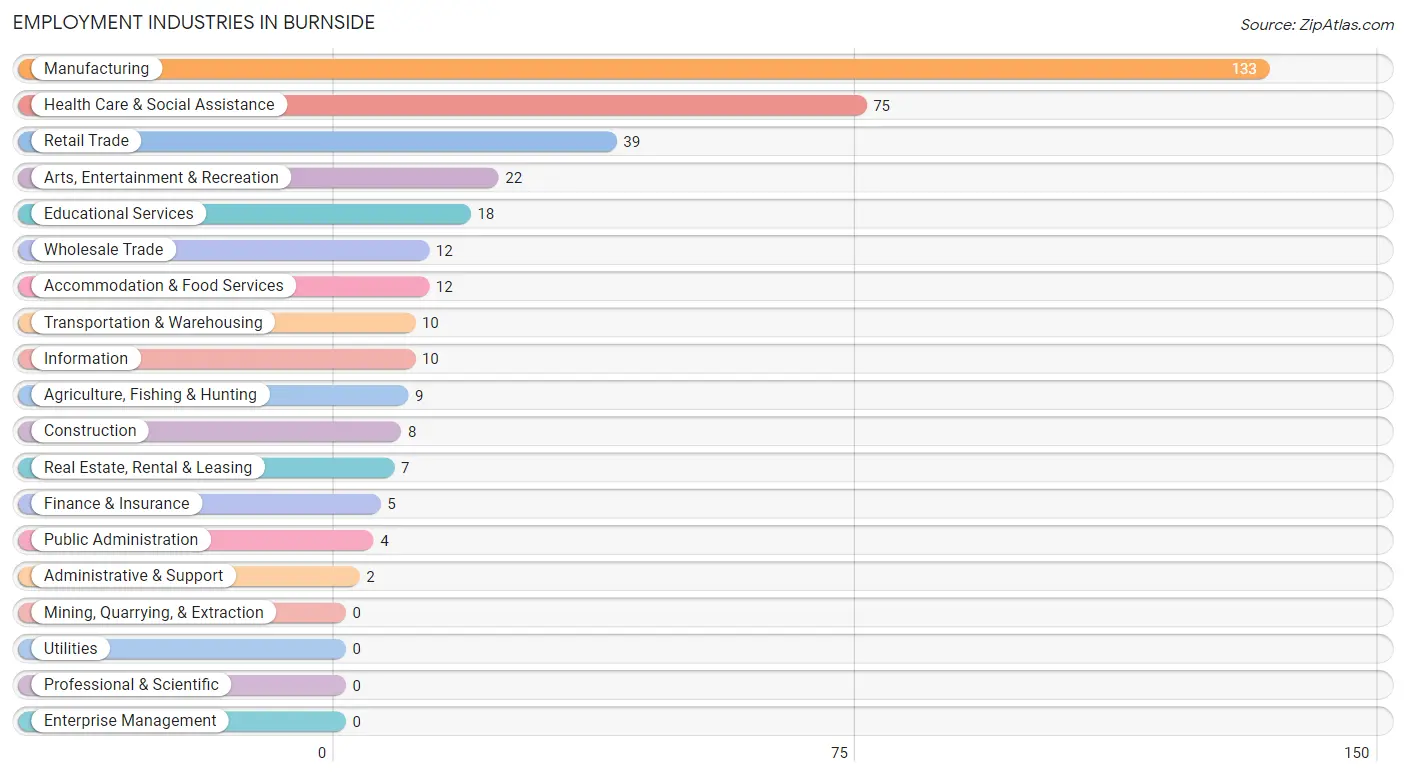
Employment Industries by Sex in Burnside
The Burnside industries that see more men than women are Agriculture, Fishing & Hunting (100.0%), Construction (100.0%), and Information (100.0%), whereas the industries that tend to have a higher number of women are Wholesale Trade (100.0%), Transportation & Warehousing (100.0%), and Finance & Insurance (100.0%).
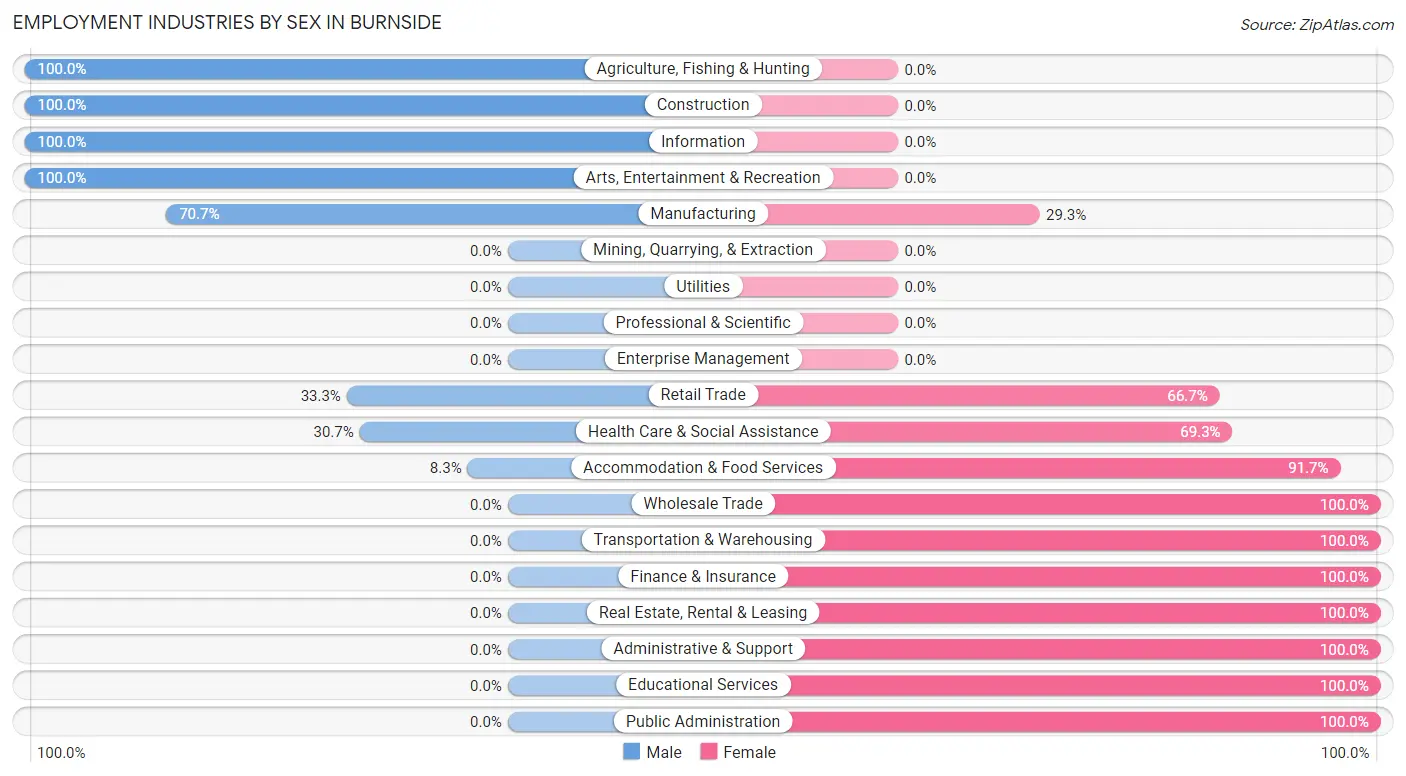
| Industry | Male | Female |
| Agriculture, Fishing & Hunting | 9 (100.0%) | 0 (0.0%) |
| Mining, Quarrying, & Extraction | 0 (0.0%) | 0 (0.0%) |
| Construction | 8 (100.0%) | 0 (0.0%) |
| Manufacturing | 94 (70.7%) | 39 (29.3%) |
| Wholesale Trade | 0 (0.0%) | 12 (100.0%) |
| Retail Trade | 13 (33.3%) | 26 (66.7%) |
| Transportation & Warehousing | 0 (0.0%) | 10 (100.0%) |
| Utilities | 0 (0.0%) | 0 (0.0%) |
| Information | 10 (100.0%) | 0 (0.0%) |
| Finance & Insurance | 0 (0.0%) | 5 (100.0%) |
| Real Estate, Rental & Leasing | 0 (0.0%) | 7 (100.0%) |
| Professional & Scientific | 0 (0.0%) | 0 (0.0%) |
| Enterprise Management | 0 (0.0%) | 0 (0.0%) |
| Administrative & Support | 0 (0.0%) | 2 (100.0%) |
| Educational Services | 0 (0.0%) | 18 (100.0%) |
| Health Care & Social Assistance | 23 (30.7%) | 52 (69.3%) |
| Arts, Entertainment & Recreation | 22 (100.0%) | 0 (0.0%) |
| Accommodation & Food Services | 1 (8.3%) | 11 (91.7%) |
| Public Administration | 0 (0.0%) | 4 (100.0%) |
| Total | 189 (50.4%) | 186 (49.6%) |
Education in Burnside
School Enrollment in Burnside
The most common levels of schooling among the 242 students in Burnside are middle school (85 | 35.1%), high school (61 | 25.2%), and college / undergraduate (42 | 17.4%).
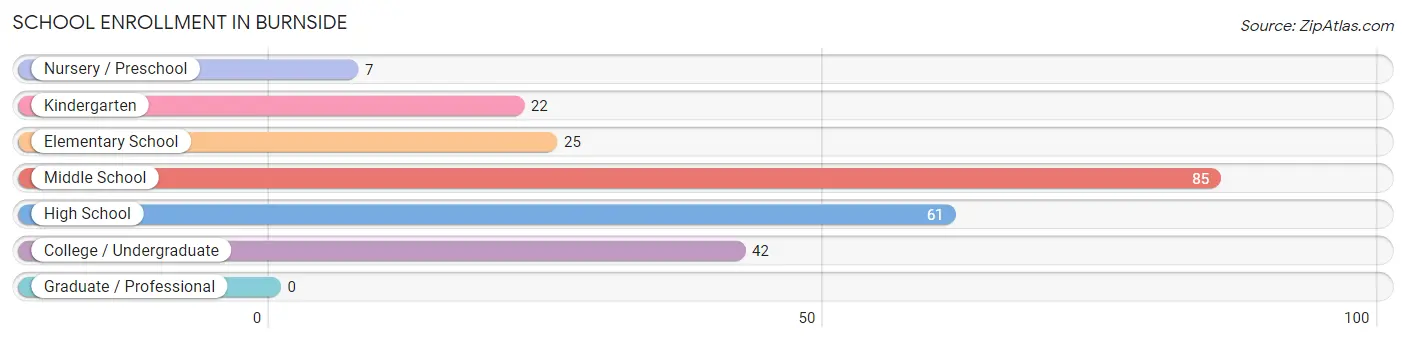
| School Level | # Students | % Students |
| Nursery / Preschool | 7 | 2.9% |
| Kindergarten | 22 | 9.1% |
| Elementary School | 25 | 10.3% |
| Middle School | 85 | 35.1% |
| High School | 61 | 25.2% |
| College / Undergraduate | 42 | 17.4% |
| Graduate / Professional | 0 | 0.0% |
| Total | 242 | 100.0% |
School Enrollment by Age by Funding Source in Burnside
Out of a total of 242 students who are enrolled in schools in Burnside, 21 (8.7%) attend a private institution, while the remaining 221 (91.3%) are enrolled in public schools. The age group of 18 to 19 year olds has the highest likelihood of being enrolled in private schools, with 8 (28.6% in the age bracket) enrolled. Conversely, the age group of 3 to 4 year olds has the lowest likelihood of being enrolled in a private school, with 7 (100.0% in the age bracket) attending a public institution.
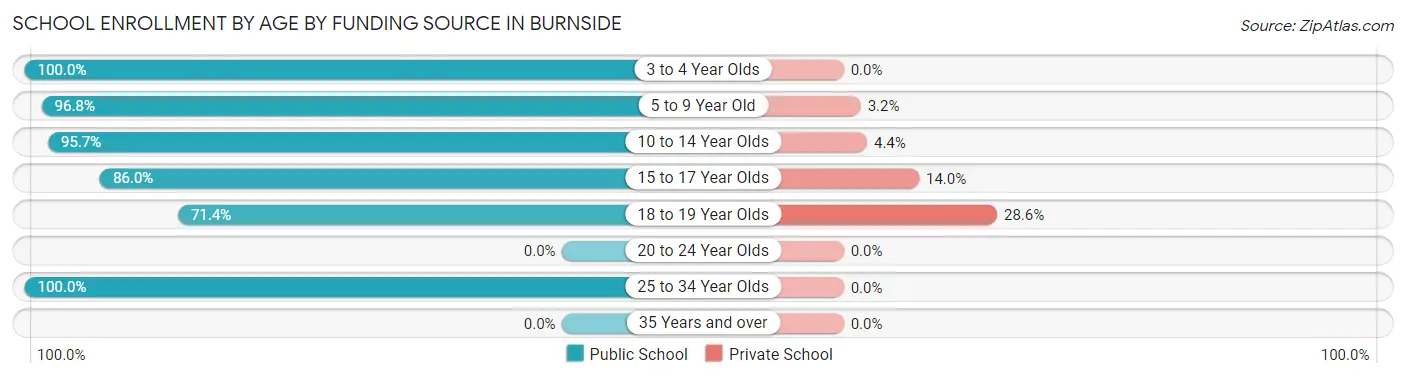
| Age Bracket | Public School | Private School |
| 3 to 4 Year Olds | 7 (100.0%) | 0 (0.0%) |
| 5 to 9 Year Old | 61 (96.8%) | 2 (3.2%) |
| 10 to 14 Year Olds | 66 (95.7%) | 3 (4.3%) |
| 15 to 17 Year Olds | 49 (86.0%) | 8 (14.0%) |
| 18 to 19 Year Olds | 20 (71.4%) | 8 (28.6%) |
| 20 to 24 Year Olds | 0 (0.0%) | 0 (0.0%) |
| 25 to 34 Year Olds | 18 (100.0%) | 0 (0.0%) |
| 35 Years and over | 0 (0.0%) | 0 (0.0%) |
| Total | 221 (91.3%) | 21 (8.7%) |
Educational Attainment by Field of Study in Burnside
Business (52 | 33.3%), arts & humanities (28 | 17.9%), psychology (21 | 13.5%), liberal arts & history (16 | 10.3%), and bio, nature & agricultural (15 | 9.6%) are the most common fields of study among 156 individuals in Burnside who have obtained a bachelor's degree or higher.
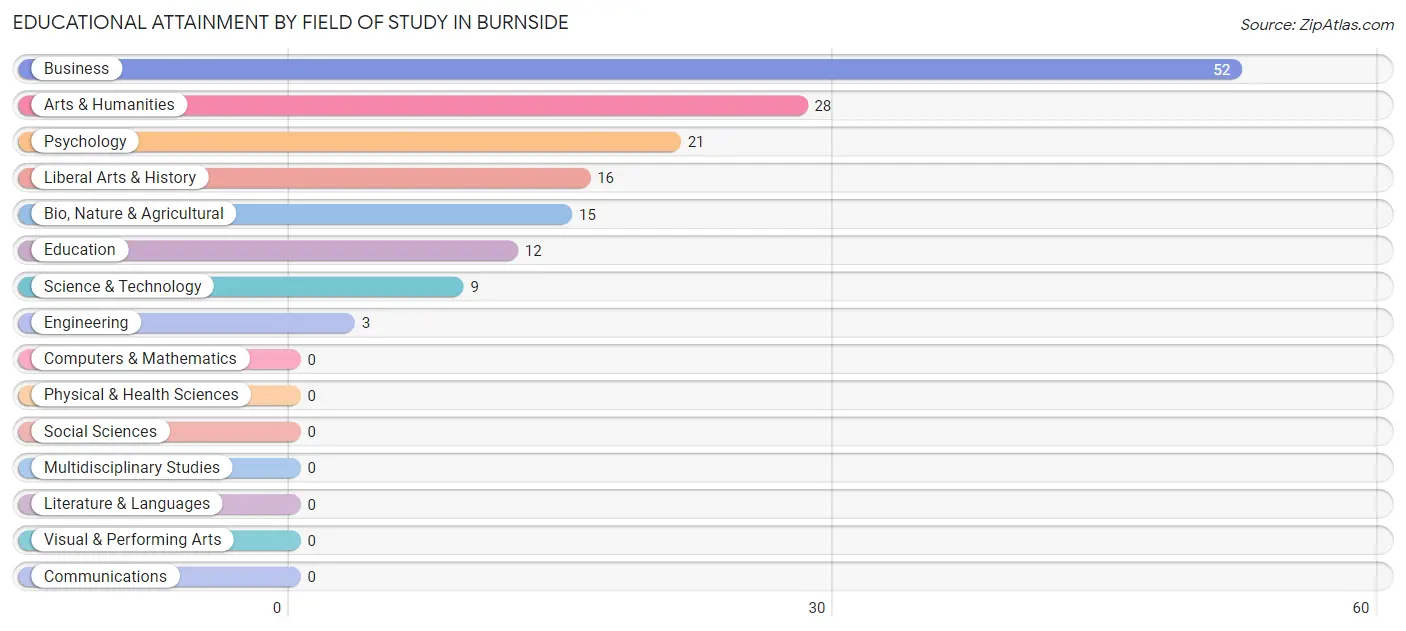
| Field of Study | # Graduates | % Graduates |
| Computers & Mathematics | 0 | 0.0% |
| Bio, Nature & Agricultural | 15 | 9.6% |
| Physical & Health Sciences | 0 | 0.0% |
| Psychology | 21 | 13.5% |
| Social Sciences | 0 | 0.0% |
| Engineering | 3 | 1.9% |
| Multidisciplinary Studies | 0 | 0.0% |
| Science & Technology | 9 | 5.8% |
| Business | 52 | 33.3% |
| Education | 12 | 7.7% |
| Literature & Languages | 0 | 0.0% |
| Liberal Arts & History | 16 | 10.3% |
| Visual & Performing Arts | 0 | 0.0% |
| Communications | 0 | 0.0% |
| Arts & Humanities | 28 | 17.9% |
| Total | 156 | 100.0% |
Transportation & Commute in Burnside
Vehicle Availability by Sex in Burnside
The most prevalent vehicle ownership categories in Burnside are males with 2 vehicles (135, accounting for 71.4%) and females with 2 vehicles (106, making up 72.6%).
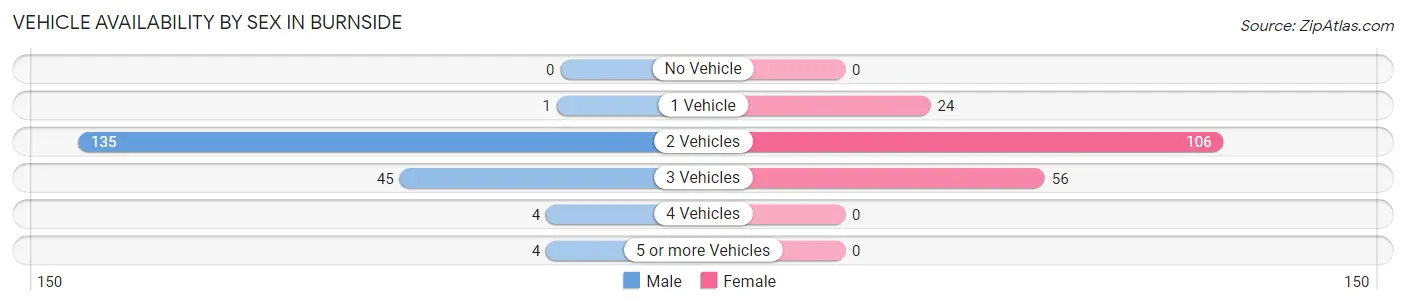
| Vehicles Available | Male | Female |
| No Vehicle | 0 (0.0%) | 0 (0.0%) |
| 1 Vehicle | 1 (0.5%) | 24 (12.9%) |
| 2 Vehicles | 135 (71.4%) | 106 (57.0%) |
| 3 Vehicles | 45 (23.8%) | 56 (30.1%) |
| 4 Vehicles | 4 (2.1%) | 0 (0.0%) |
| 5 or more Vehicles | 4 (2.1%) | 0 (0.0%) |
| Total | 189 (100.0%) | 186 (100.0%) |
Commute Time in Burnside
The most frequently occuring commute durations in Burnside are 15 to 19 minutes (81 commuters, 22.5%), 5 to 9 minutes (80 commuters, 22.2%), and 10 to 14 minutes (79 commuters, 21.9%).
| Commute Time | # Commuters | % Commuters |
| Less than 5 Minutes | 13 | 3.6% |
| 5 to 9 Minutes | 80 | 22.2% |
| 10 to 14 Minutes | 79 | 21.9% |
| 15 to 19 Minutes | 81 | 22.5% |
| 20 to 24 Minutes | 35 | 9.7% |
| 25 to 29 Minutes | 27 | 7.5% |
| 30 to 34 Minutes | 18 | 5.0% |
| 35 to 39 Minutes | 0 | 0.0% |
| 40 to 44 Minutes | 0 | 0.0% |
| 45 to 59 Minutes | 3 | 0.8% |
| 60 to 89 Minutes | 5 | 1.4% |
| 90 or more Minutes | 19 | 5.3% |
Commute Time by Sex in Burnside
The most common commute times in Burnside are 5 to 9 minutes (47 commuters, 26.3%) for males and 10 to 14 minutes (56 commuters, 30.9%) for females.
| Commute Time | Male | Female |
| Less than 5 Minutes | 0 (0.0%) | 13 (7.2%) |
| 5 to 9 Minutes | 47 (26.3%) | 33 (18.2%) |
| 10 to 14 Minutes | 23 (12.9%) | 56 (30.9%) |
| 15 to 19 Minutes | 35 (19.6%) | 46 (25.4%) |
| 20 to 24 Minutes | 19 (10.6%) | 16 (8.8%) |
| 25 to 29 Minutes | 27 (15.1%) | 0 (0.0%) |
| 30 to 34 Minutes | 4 (2.2%) | 14 (7.7%) |
| 35 to 39 Minutes | 0 (0.0%) | 0 (0.0%) |
| 40 to 44 Minutes | 0 (0.0%) | 0 (0.0%) |
| 45 to 59 Minutes | 0 (0.0%) | 3 (1.7%) |
| 60 to 89 Minutes | 5 (2.8%) | 0 (0.0%) |
| 90 or more Minutes | 19 (10.6%) | 0 (0.0%) |
Time of Departure to Work by Sex in Burnside
The most frequent times of departure to work in Burnside are 7:30 AM to 7:59 AM (27, 15.1%) for males and 7:30 AM to 7:59 AM (38, 21.0%) for females.
| Time of Departure | Male | Female |
| 12:00 AM to 4:59 AM | 15 (8.4%) | 9 (5.0%) |
| 5:00 AM to 5:29 AM | 0 (0.0%) | 30 (16.6%) |
| 5:30 AM to 5:59 AM | 12 (6.7%) | 4 (2.2%) |
| 6:00 AM to 6:29 AM | 25 (14.0%) | 0 (0.0%) |
| 6:30 AM to 6:59 AM | 17 (9.5%) | 0 (0.0%) |
| 7:00 AM to 7:29 AM | 22 (12.3%) | 15 (8.3%) |
| 7:30 AM to 7:59 AM | 27 (15.1%) | 38 (21.0%) |
| 8:00 AM to 8:29 AM | 14 (7.8%) | 12 (6.6%) |
| 8:30 AM to 8:59 AM | 0 (0.0%) | 12 (6.6%) |
| 9:00 AM to 9:59 AM | 26 (14.5%) | 28 (15.5%) |
| 10:00 AM to 10:59 AM | 0 (0.0%) | 7 (3.9%) |
| 11:00 AM to 11:59 AM | 0 (0.0%) | 0 (0.0%) |
| 12:00 PM to 3:59 PM | 20 (11.2%) | 3 (1.7%) |
| 4:00 PM to 11:59 PM | 1 (0.6%) | 23 (12.7%) |
| Total | 179 (100.0%) | 181 (100.0%) |
Housing Occupancy in Burnside
Occupancy by Ownership in Burnside
Of the total 393 dwellings in Burnside, owner-occupied units account for 359 (91.3%), while renter-occupied units make up 34 (8.6%).
| Occupancy | # Housing Units | % Housing Units |
| Owner Occupied Housing Units | 359 | 91.3% |
| Renter-Occupied Housing Units | 34 | 8.6% |
| Total Occupied Housing Units | 393 | 100.0% |
Occupancy by Household Size in Burnside
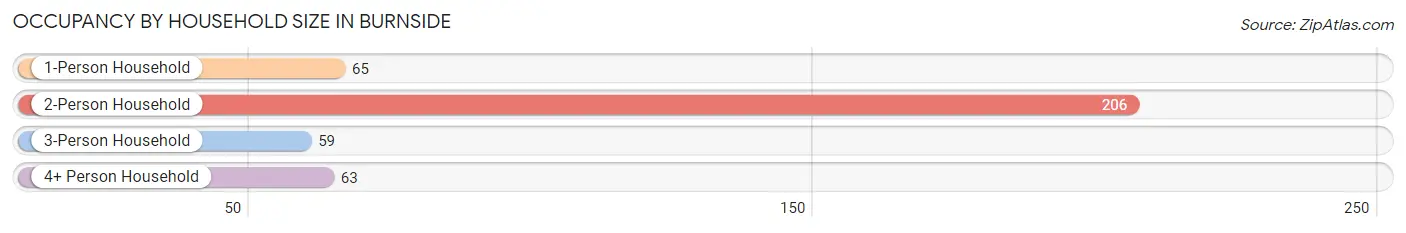
| Household Size | # Housing Units | % Housing Units |
| 1-Person Household | 65 | 16.5% |
| 2-Person Household | 206 | 52.4% |
| 3-Person Household | 59 | 15.0% |
| 4+ Person Household | 63 | 16.0% |
| Total Housing Units | 393 | 100.0% |
Occupancy by Ownership by Household Size in Burnside
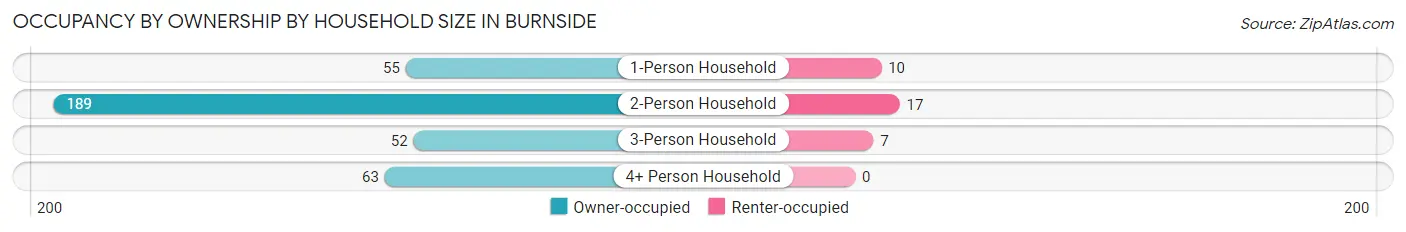
| Household Size | Owner-occupied | Renter-occupied |
| 1-Person Household | 55 (84.6%) | 10 (15.4%) |
| 2-Person Household | 189 (91.7%) | 17 (8.3%) |
| 3-Person Household | 52 (88.1%) | 7 (11.9%) |
| 4+ Person Household | 63 (100.0%) | 0 (0.0%) |
| Total Housing Units | 359 (91.3%) | 34 (8.6%) |
Occupancy by Educational Attainment in Burnside
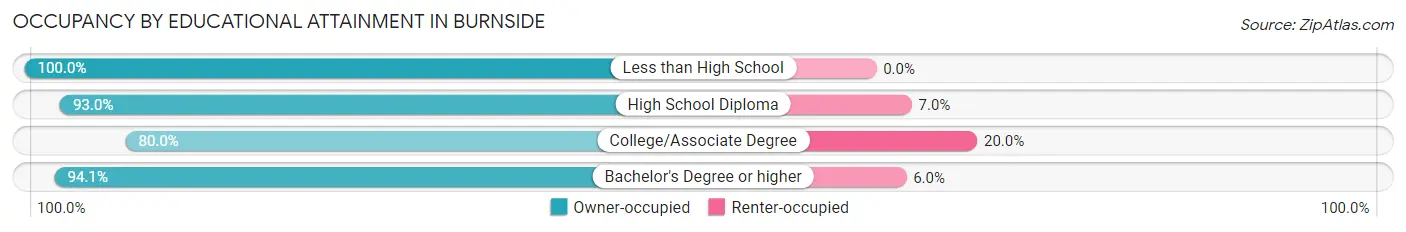
| Household Size | Owner-occupied | Renter-occupied |
| Less than High School | 53 (100.0%) | 0 (0.0%) |
| High School Diploma | 159 (93.0%) | 12 (7.0%) |
| College/Associate Degree | 68 (80.0%) | 17 (20.0%) |
| Bachelor's Degree or higher | 79 (94.1%) | 5 (5.9%) |
Occupancy by Age of Householder in Burnside
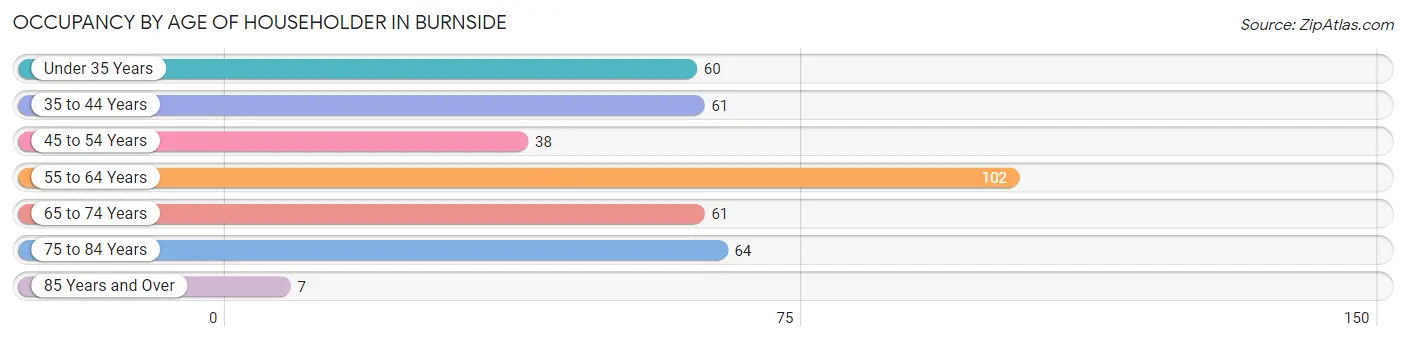
| Age Bracket | # Households | % Households |
| Under 35 Years | 60 | 15.3% |
| 35 to 44 Years | 61 | 15.5% |
| 45 to 54 Years | 38 | 9.7% |
| 55 to 64 Years | 102 | 26.0% |
| 65 to 74 Years | 61 | 15.5% |
| 75 to 84 Years | 64 | 16.3% |
| 85 Years and Over | 7 | 1.8% |
| Total | 393 | 100.0% |
Housing Finances in Burnside
Median Income by Occupancy in Burnside
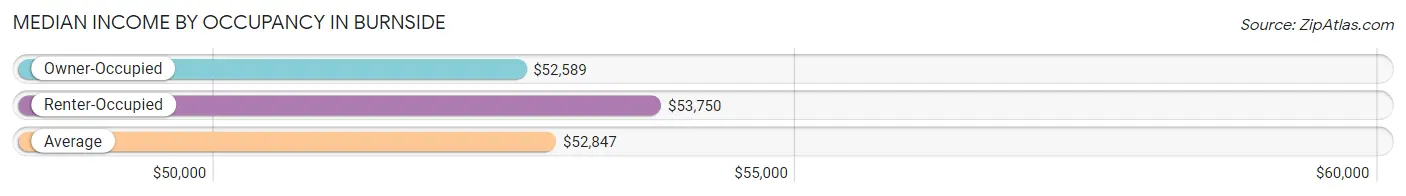
| Occupancy Type | # Households | Median Income |
| Owner-Occupied | 359 (91.3%) | $52,589 |
| Renter-Occupied | 34 (8.6%) | $53,750 |
| Average | 393 (100.0%) | $52,847 |
Occupancy by Householder Income Bracket in Burnside
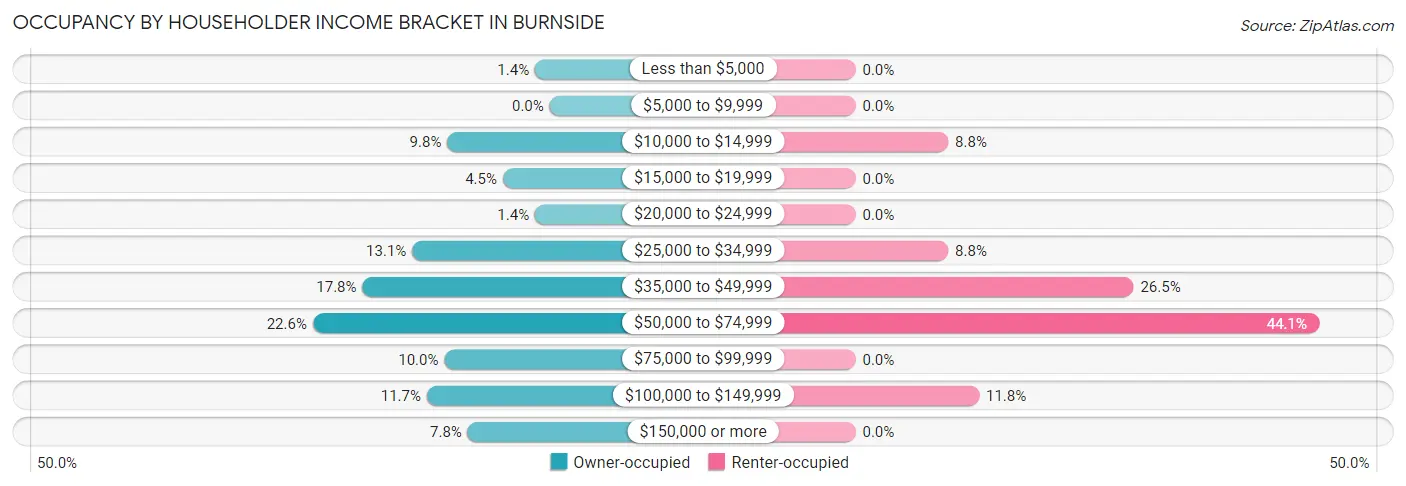
| Income Bracket | Owner-occupied | Renter-occupied |
| Less than $5,000 | 5 (1.4%) | 0 (0.0%) |
| $5,000 to $9,999 | 0 (0.0%) | 0 (0.0%) |
| $10,000 to $14,999 | 35 (9.8%) | 3 (8.8%) |
| $15,000 to $19,999 | 16 (4.5%) | 0 (0.0%) |
| $20,000 to $24,999 | 5 (1.4%) | 0 (0.0%) |
| $25,000 to $34,999 | 47 (13.1%) | 3 (8.8%) |
| $35,000 to $49,999 | 64 (17.8%) | 9 (26.5%) |
| $50,000 to $74,999 | 81 (22.6%) | 15 (44.1%) |
| $75,000 to $99,999 | 36 (10.0%) | 0 (0.0%) |
| $100,000 to $149,999 | 42 (11.7%) | 4 (11.8%) |
| $150,000 or more | 28 (7.8%) | 0 (0.0%) |
| Total | 359 (100.0%) | 34 (100.0%) |
Monthly Housing Cost Tiers in Burnside
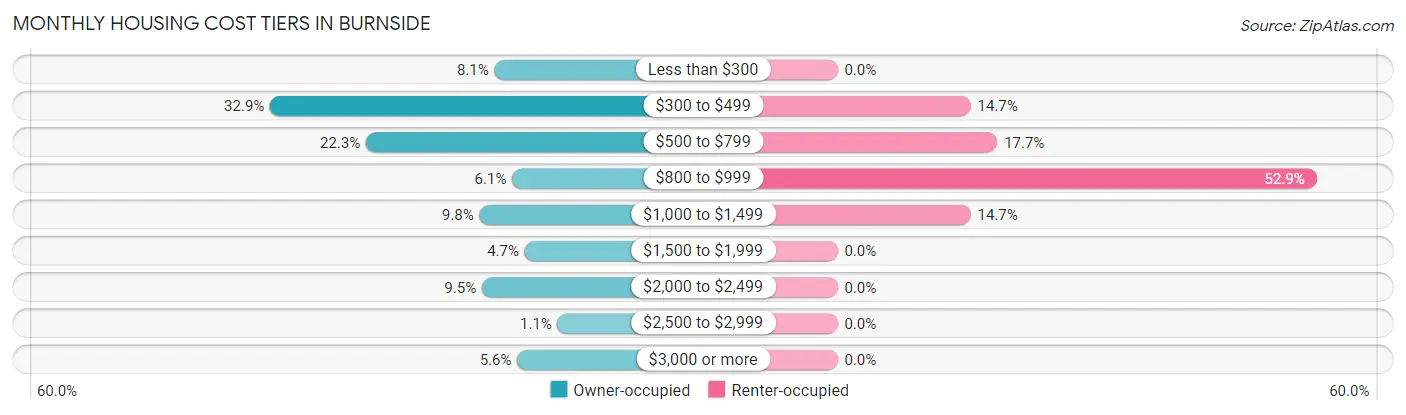
| Monthly Cost | Owner-occupied | Renter-occupied |
| Less than $300 | 29 (8.1%) | 0 (0.0%) |
| $300 to $499 | 118 (32.9%) | 5 (14.7%) |
| $500 to $799 | 80 (22.3%) | 6 (17.6%) |
| $800 to $999 | 22 (6.1%) | 18 (52.9%) |
| $1,000 to $1,499 | 35 (9.8%) | 5 (14.7%) |
| $1,500 to $1,999 | 17 (4.7%) | 0 (0.0%) |
| $2,000 to $2,499 | 34 (9.5%) | 0 (0.0%) |
| $2,500 to $2,999 | 4 (1.1%) | 0 (0.0%) |
| $3,000 or more | 20 (5.6%) | 0 (0.0%) |
| Total | 359 (100.0%) | 34 (100.0%) |
Physical Housing Characteristics in Burnside
Housing Structures in Burnside
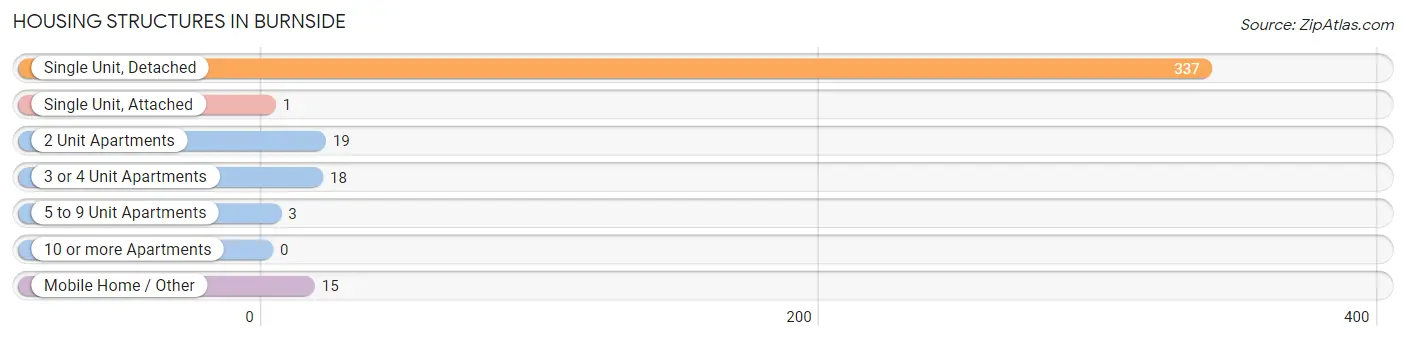
| Structure Type | # Housing Units | % Housing Units |
| Single Unit, Detached | 337 | 85.8% |
| Single Unit, Attached | 1 | 0.3% |
| 2 Unit Apartments | 19 | 4.8% |
| 3 or 4 Unit Apartments | 18 | 4.6% |
| 5 to 9 Unit Apartments | 3 | 0.8% |
| 10 or more Apartments | 0 | 0.0% |
| Mobile Home / Other | 15 | 3.8% |
| Total | 393 | 100.0% |
Housing Structures by Occupancy in Burnside
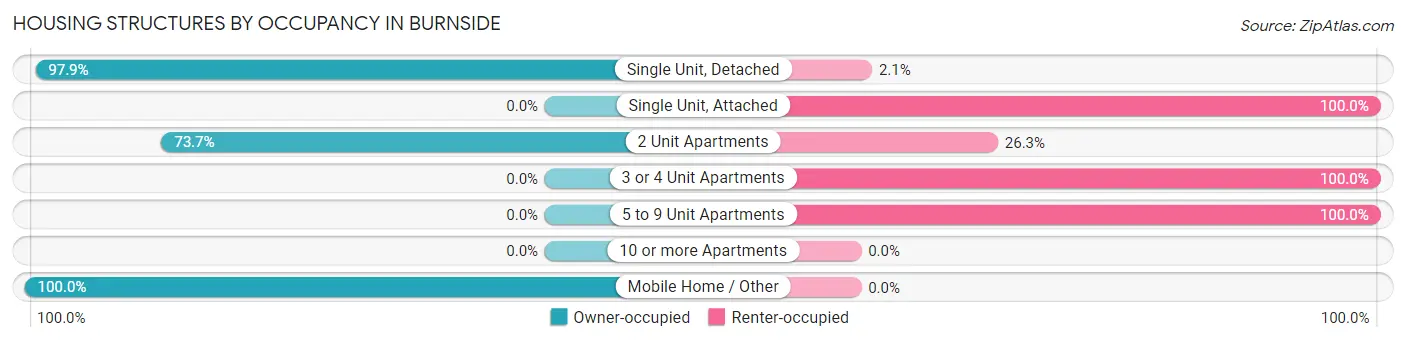
| Structure Type | Owner-occupied | Renter-occupied |
| Single Unit, Detached | 330 (97.9%) | 7 (2.1%) |
| Single Unit, Attached | 0 (0.0%) | 1 (100.0%) |
| 2 Unit Apartments | 14 (73.7%) | 5 (26.3%) |
| 3 or 4 Unit Apartments | 0 (0.0%) | 18 (100.0%) |
| 5 to 9 Unit Apartments | 0 (0.0%) | 3 (100.0%) |
| 10 or more Apartments | 0 (0.0%) | 0 (0.0%) |
| Mobile Home / Other | 15 (100.0%) | 0 (0.0%) |
| Total | 359 (91.3%) | 34 (8.6%) |
Housing Structures by Number of Rooms in Burnside
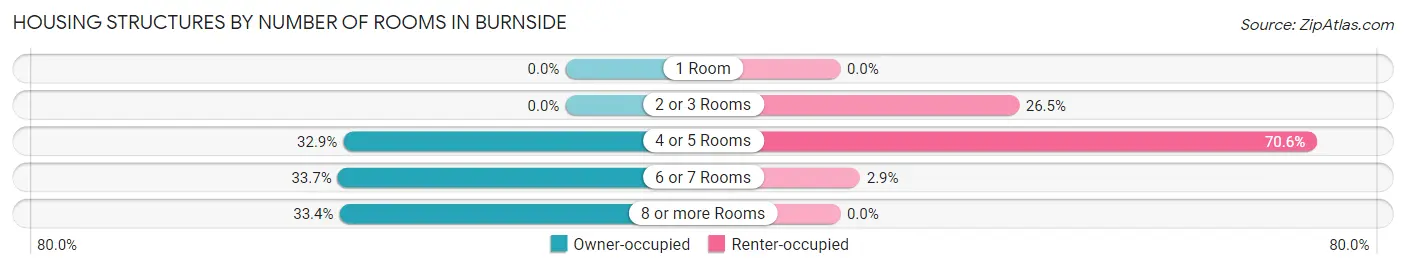
| Number of Rooms | Owner-occupied | Renter-occupied |
| 1 Room | 0 (0.0%) | 0 (0.0%) |
| 2 or 3 Rooms | 0 (0.0%) | 9 (26.5%) |
| 4 or 5 Rooms | 118 (32.9%) | 24 (70.6%) |
| 6 or 7 Rooms | 121 (33.7%) | 1 (2.9%) |
| 8 or more Rooms | 120 (33.4%) | 0 (0.0%) |
| Total | 359 (100.0%) | 34 (100.0%) |
Housing Structure by Heating Type in Burnside
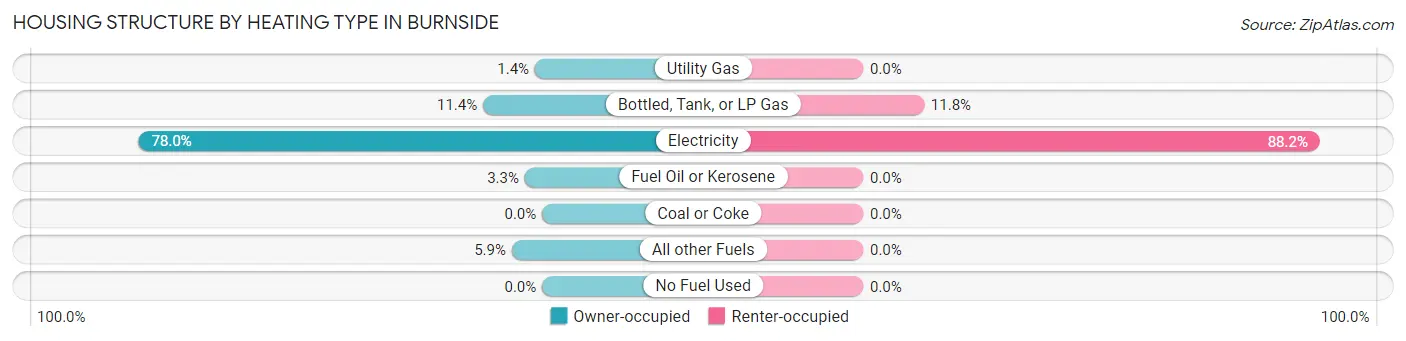
| Heating Type | Owner-occupied | Renter-occupied |
| Utility Gas | 5 (1.4%) | 0 (0.0%) |
| Bottled, Tank, or LP Gas | 41 (11.4%) | 4 (11.8%) |
| Electricity | 280 (78.0%) | 30 (88.2%) |
| Fuel Oil or Kerosene | 12 (3.3%) | 0 (0.0%) |
| Coal or Coke | 0 (0.0%) | 0 (0.0%) |
| All other Fuels | 21 (5.9%) | 0 (0.0%) |
| No Fuel Used | 0 (0.0%) | 0 (0.0%) |
| Total | 359 (100.0%) | 34 (100.0%) |
Household Vehicle Usage in Burnside
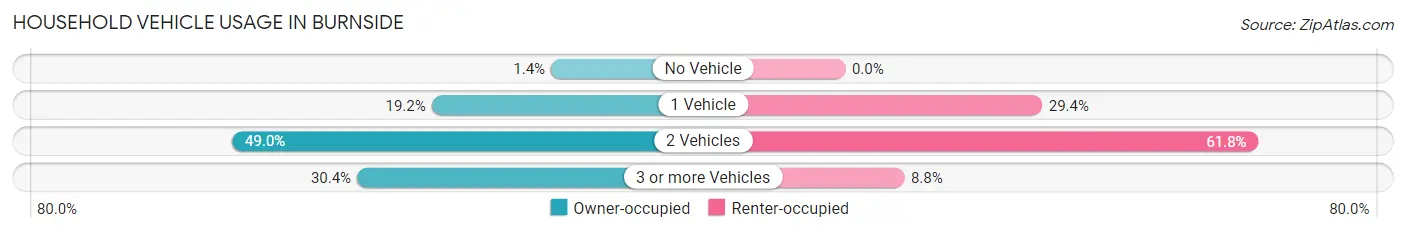
| Vehicles per Household | Owner-occupied | Renter-occupied |
| No Vehicle | 5 (1.4%) | 0 (0.0%) |
| 1 Vehicle | 69 (19.2%) | 10 (29.4%) |
| 2 Vehicles | 176 (49.0%) | 21 (61.8%) |
| 3 or more Vehicles | 109 (30.4%) | 3 (8.8%) |
| Total | 359 (100.0%) | 34 (100.0%) |
Real Estate & Mortgages in Burnside
Real Estate and Mortgage Overview in Burnside
| Characteristic | Without Mortgage | With Mortgage |
| Housing Units | 212 | 147 |
| Median Property Value | $133,900 | $182,700 |
| Median Household Income | $37,167 | $6 |
| Monthly Housing Costs | $444 | $20 |
| Real Estate Taxes | $1,009 | $2 |
Property Value by Mortgage Status in Burnside
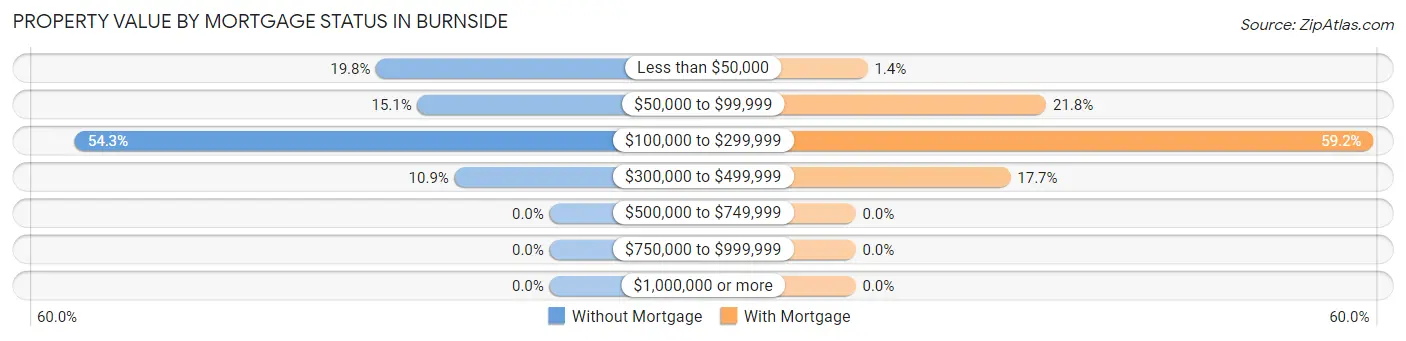
| Property Value | Without Mortgage | With Mortgage |
| Less than $50,000 | 42 (19.8%) | 2 (1.4%) |
| $50,000 to $99,999 | 32 (15.1%) | 32 (21.8%) |
| $100,000 to $299,999 | 115 (54.2%) | 87 (59.2%) |
| $300,000 to $499,999 | 23 (10.8%) | 26 (17.7%) |
| $500,000 to $749,999 | 0 (0.0%) | 0 (0.0%) |
| $750,000 to $999,999 | 0 (0.0%) | 0 (0.0%) |
| $1,000,000 or more | 0 (0.0%) | 0 (0.0%) |
| Total | 212 (100.0%) | 147 (100.0%) |
Household Income by Mortgage Status in Burnside
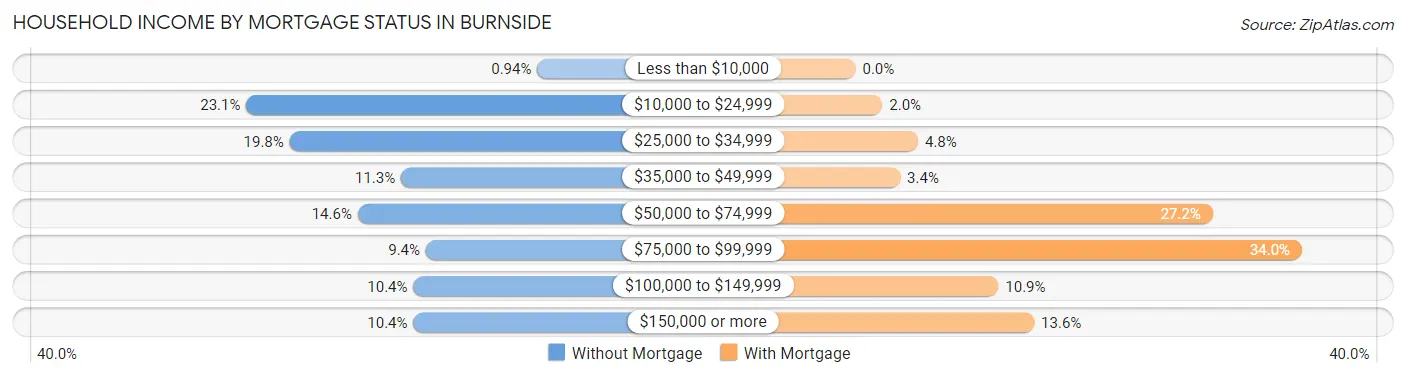
| Household Income | Without Mortgage | With Mortgage |
| Less than $10,000 | 2 (0.9%) | 0 (0.0%) |
| $10,000 to $24,999 | 49 (23.1%) | 3 (2.0%) |
| $25,000 to $34,999 | 42 (19.8%) | 7 (4.8%) |
| $35,000 to $49,999 | 24 (11.3%) | 5 (3.4%) |
| $50,000 to $74,999 | 31 (14.6%) | 40 (27.2%) |
| $75,000 to $99,999 | 20 (9.4%) | 50 (34.0%) |
| $100,000 to $149,999 | 22 (10.4%) | 16 (10.9%) |
| $150,000 or more | 22 (10.4%) | 20 (13.6%) |
| Total | 212 (100.0%) | 147 (100.0%) |
Property Value to Household Income Ratio in Burnside
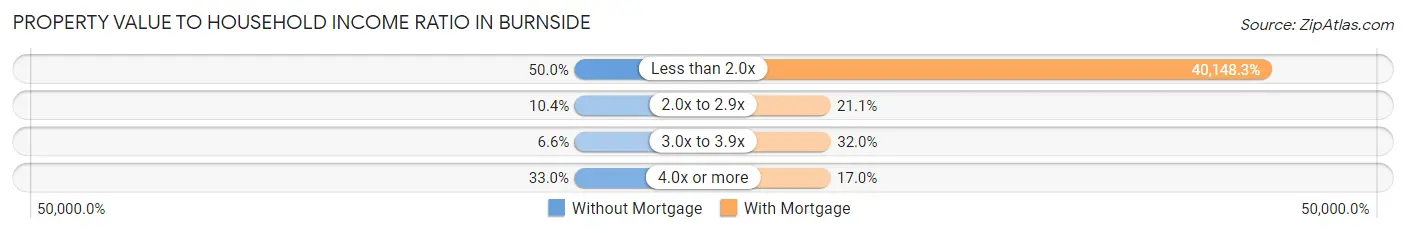
| Value-to-Income Ratio | Without Mortgage | With Mortgage |
| Less than 2.0x | 106 (50.0%) | 59,018 (40,148.3%) |
| 2.0x to 2.9x | 22 (10.4%) | 31 (21.1%) |
| 3.0x to 3.9x | 14 (6.6%) | 47 (32.0%) |
| 4.0x or more | 70 (33.0%) | 25 (17.0%) |
| Total | 212 (100.0%) | 147 (100.0%) |
Real Estate Taxes by Mortgage Status in Burnside
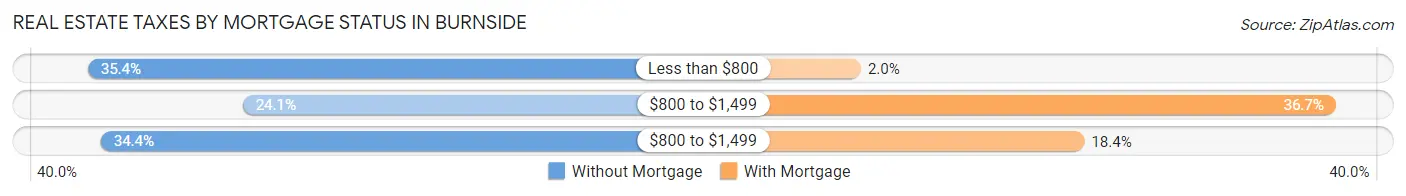
| Property Taxes | Without Mortgage | With Mortgage |
| Less than $800 | 75 (35.4%) | 3 (2.0%) |
| $800 to $1,499 | 51 (24.1%) | 54 (36.7%) |
| $800 to $1,499 | 73 (34.4%) | 27 (18.4%) |
| Total | 212 (100.0%) | 147 (100.0%) |
Health & Disability in Burnside
Health Insurance Coverage by Age in Burnside
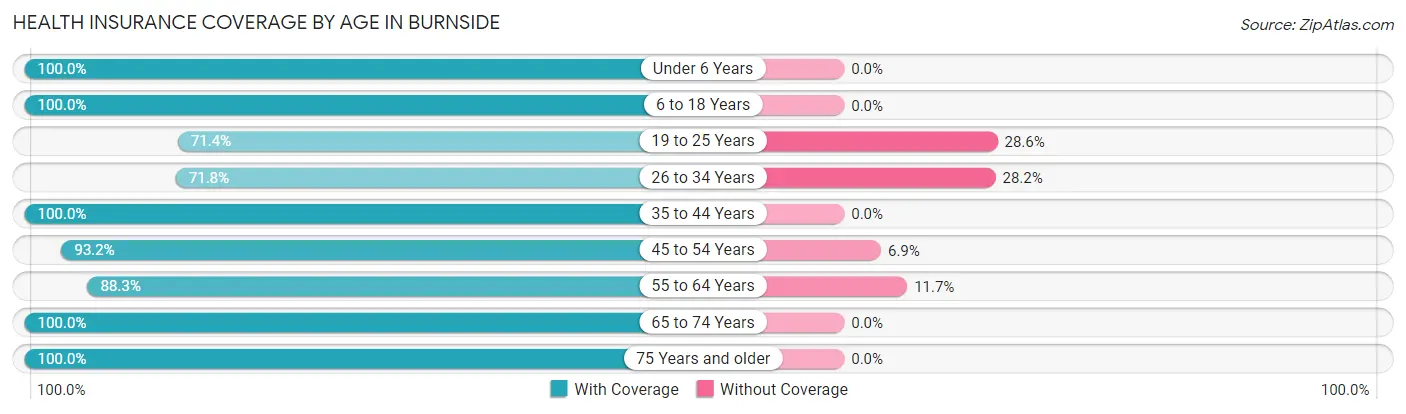
| Age Bracket | With Coverage | Without Coverage |
| Under 6 Years | 69 (100.0%) | 0 (0.0%) |
| 6 to 18 Years | 173 (100.0%) | 0 (0.0%) |
| 19 to 25 Years | 45 (71.4%) | 18 (28.6%) |
| 26 to 34 Years | 56 (71.8%) | 22 (28.2%) |
| 35 to 44 Years | 226 (100.0%) | 0 (0.0%) |
| 45 to 54 Years | 68 (93.1%) | 5 (6.9%) |
| 55 to 64 Years | 143 (88.3%) | 19 (11.7%) |
| 65 to 74 Years | 149 (100.0%) | 0 (0.0%) |
| 75 Years and older | 88 (100.0%) | 0 (0.0%) |
| Total | 1,017 (94.1%) | 64 (5.9%) |
Health Insurance Coverage by Citizenship Status in Burnside
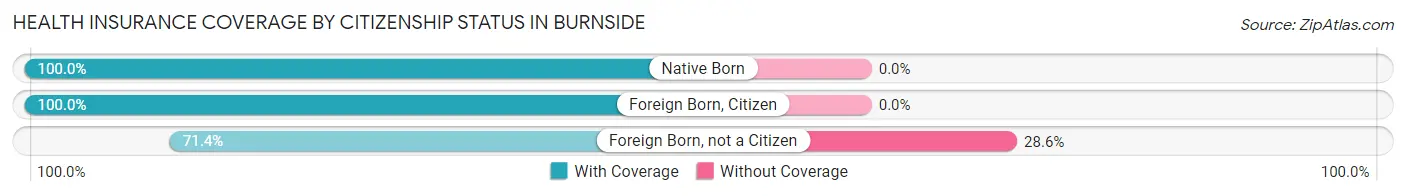
| Citizenship Status | With Coverage | Without Coverage |
| Native Born | 69 (100.0%) | 0 (0.0%) |
| Foreign Born, Citizen | 173 (100.0%) | 0 (0.0%) |
| Foreign Born, not a Citizen | 45 (71.4%) | 18 (28.6%) |
Health Insurance Coverage by Household Income in Burnside
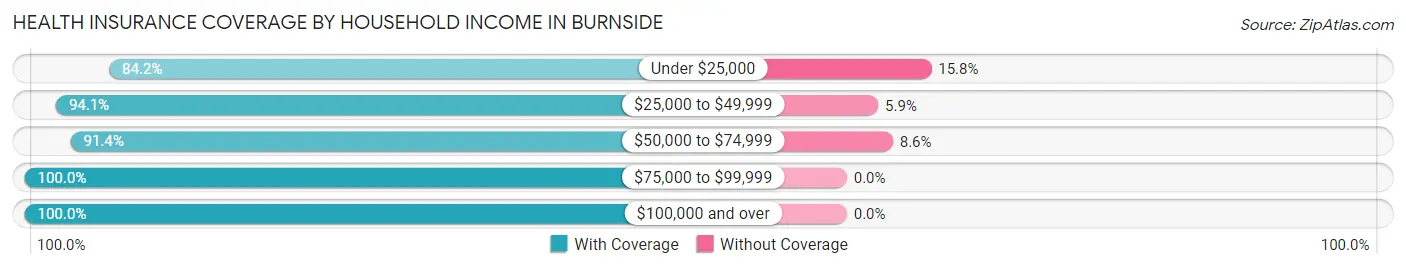
| Household Income | With Coverage | Without Coverage |
| Under $25,000 | 101 (84.2%) | 19 (15.8%) |
| $25,000 to $49,999 | 272 (94.1%) | 17 (5.9%) |
| $50,000 to $74,999 | 297 (91.4%) | 28 (8.6%) |
| $75,000 to $99,999 | 113 (100.0%) | 0 (0.0%) |
| $100,000 and over | 234 (100.0%) | 0 (0.0%) |
Public vs Private Health Insurance Coverage by Age in Burnside
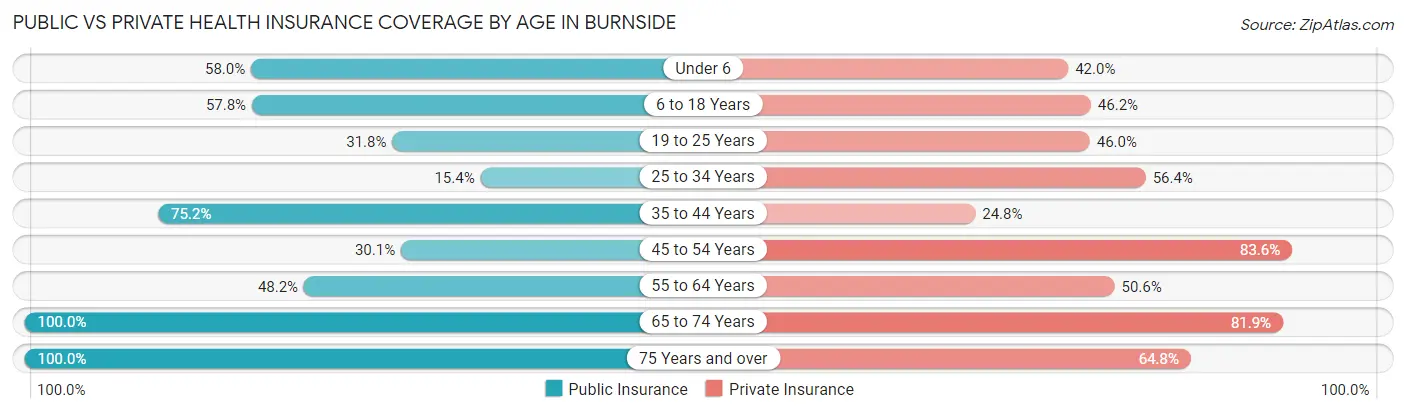
| Age Bracket | Public Insurance | Private Insurance |
| Under 6 | 40 (58.0%) | 29 (42.0%) |
| 6 to 18 Years | 100 (57.8%) | 80 (46.2%) |
| 19 to 25 Years | 20 (31.8%) | 29 (46.0%) |
| 25 to 34 Years | 12 (15.4%) | 44 (56.4%) |
| 35 to 44 Years | 170 (75.2%) | 56 (24.8%) |
| 45 to 54 Years | 22 (30.1%) | 61 (83.6%) |
| 55 to 64 Years | 78 (48.1%) | 82 (50.6%) |
| 65 to 74 Years | 149 (100.0%) | 122 (81.9%) |
| 75 Years and over | 88 (100.0%) | 57 (64.8%) |
| Total | 679 (62.8%) | 560 (51.8%) |
Disability Status by Sex by Age in Burnside
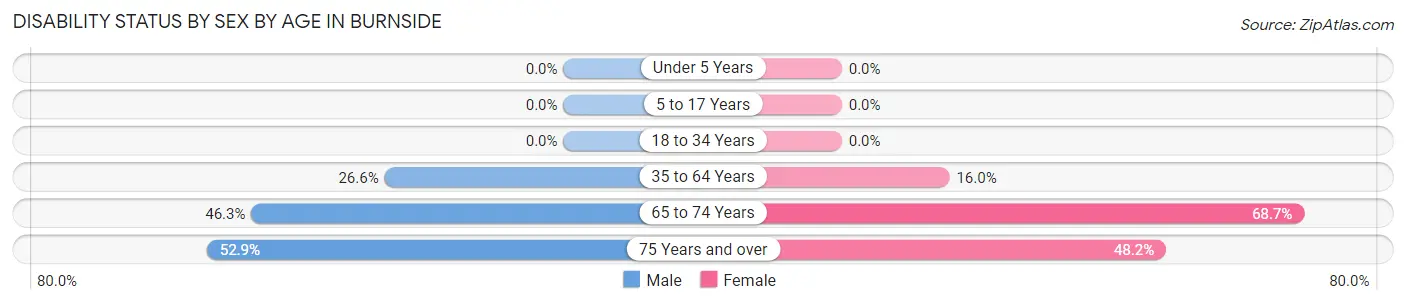
| Age Bracket | Male | Female |
| Under 5 Years | 0 (0.0%) | 0 (0.0%) |
| 5 to 17 Years | 0 (0.0%) | 0 (0.0%) |
| 18 to 34 Years | 0 (0.0%) | 0 (0.0%) |
| 35 to 64 Years | 51 (26.6%) | 43 (16.0%) |
| 65 to 74 Years | 38 (46.3%) | 46 (68.7%) |
| 75 Years and over | 18 (52.9%) | 26 (48.1%) |
Disability Class by Sex by Age in Burnside
Disability Class: Hearing Difficulty
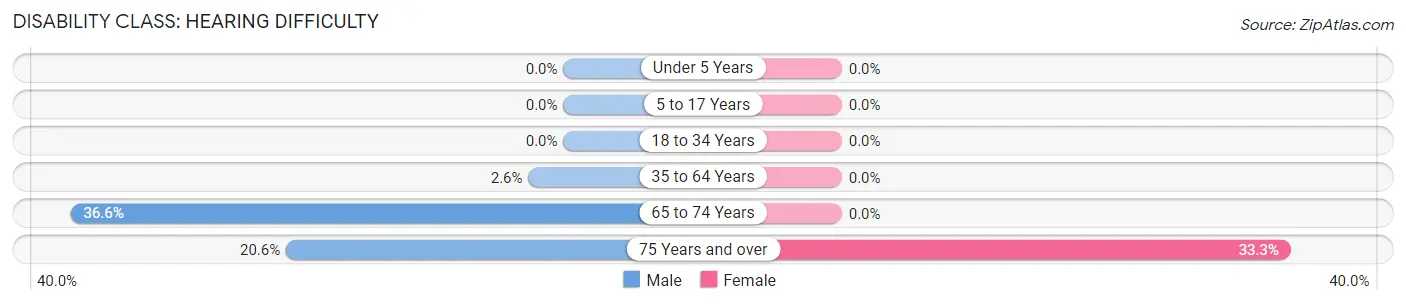
| Age Bracket | Male | Female |
| Under 5 Years | 0 (0.0%) | 0 (0.0%) |
| 5 to 17 Years | 0 (0.0%) | 0 (0.0%) |
| 18 to 34 Years | 0 (0.0%) | 0 (0.0%) |
| 35 to 64 Years | 5 (2.6%) | 0 (0.0%) |
| 65 to 74 Years | 30 (36.6%) | 0 (0.0%) |
| 75 Years and over | 7 (20.6%) | 18 (33.3%) |
Disability Class: Vision Difficulty
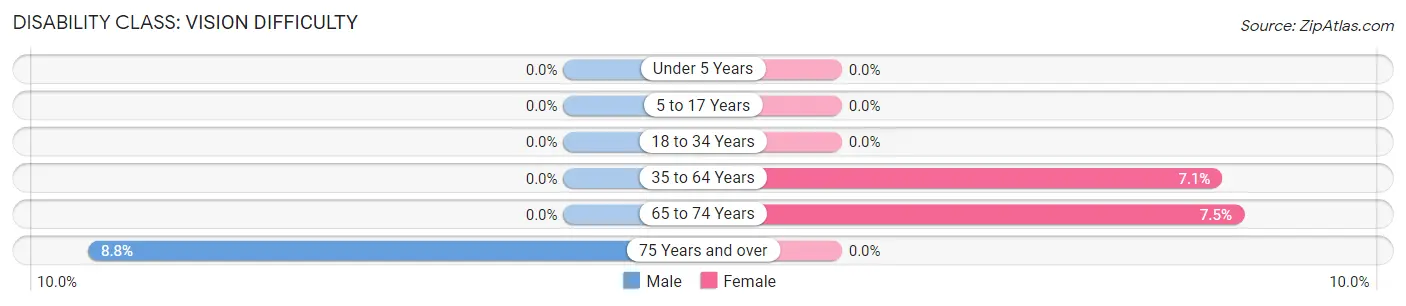
| Age Bracket | Male | Female |
| Under 5 Years | 0 (0.0%) | 0 (0.0%) |
| 5 to 17 Years | 0 (0.0%) | 0 (0.0%) |
| 18 to 34 Years | 0 (0.0%) | 0 (0.0%) |
| 35 to 64 Years | 0 (0.0%) | 19 (7.1%) |
| 65 to 74 Years | 0 (0.0%) | 5 (7.5%) |
| 75 Years and over | 3 (8.8%) | 0 (0.0%) |
Disability Class: Cognitive Difficulty
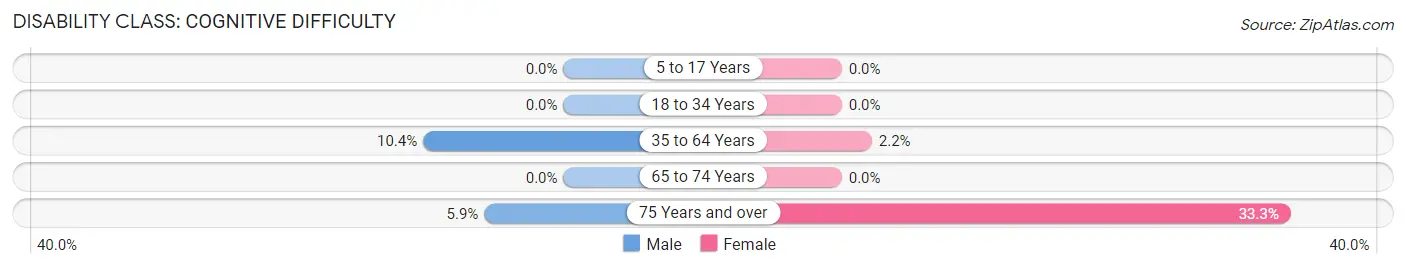
| Age Bracket | Male | Female |
| 5 to 17 Years | 0 (0.0%) | 0 (0.0%) |
| 18 to 34 Years | 0 (0.0%) | 0 (0.0%) |
| 35 to 64 Years | 20 (10.4%) | 6 (2.2%) |
| 65 to 74 Years | 0 (0.0%) | 0 (0.0%) |
| 75 Years and over | 2 (5.9%) | 18 (33.3%) |
Disability Class: Ambulatory Difficulty
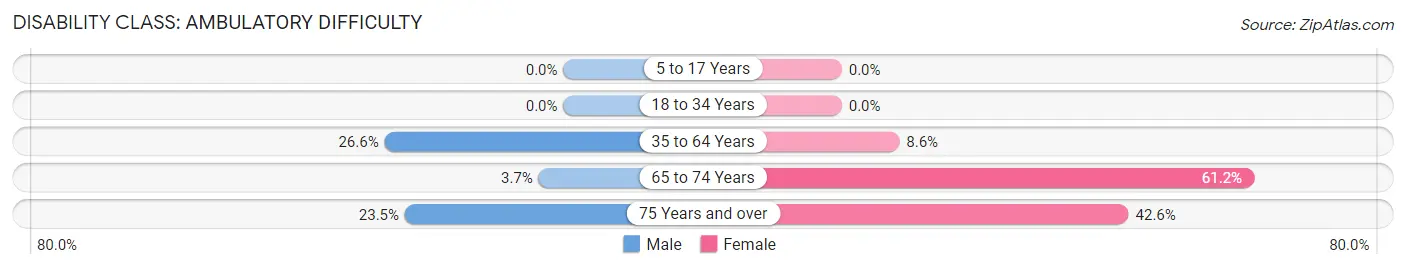
| Age Bracket | Male | Female |
| 5 to 17 Years | 0 (0.0%) | 0 (0.0%) |
| 18 to 34 Years | 0 (0.0%) | 0 (0.0%) |
| 35 to 64 Years | 51 (26.6%) | 23 (8.6%) |
| 65 to 74 Years | 3 (3.7%) | 41 (61.2%) |
| 75 Years and over | 8 (23.5%) | 23 (42.6%) |
Disability Class: Self-Care Difficulty
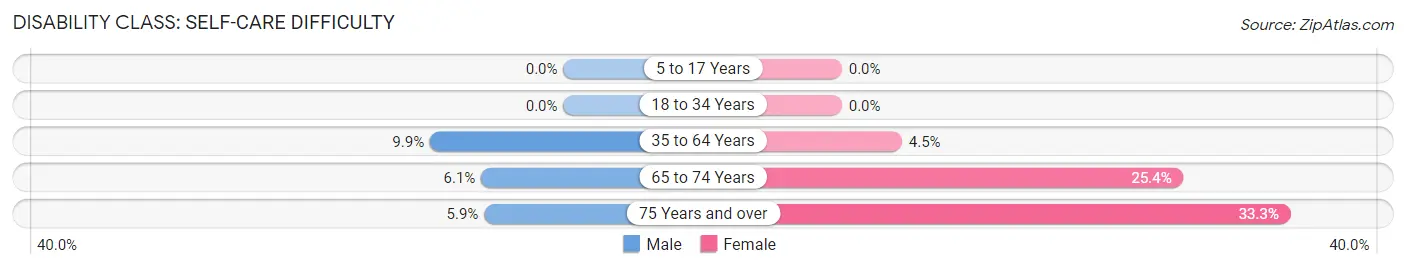
| Age Bracket | Male | Female |
| 5 to 17 Years | 0 (0.0%) | 0 (0.0%) |
| 18 to 34 Years | 0 (0.0%) | 0 (0.0%) |
| 35 to 64 Years | 19 (9.9%) | 12 (4.5%) |
| 65 to 74 Years | 5 (6.1%) | 17 (25.4%) |
| 75 Years and over | 2 (5.9%) | 18 (33.3%) |
Technology Access in Burnside
Computing Device Access in Burnside
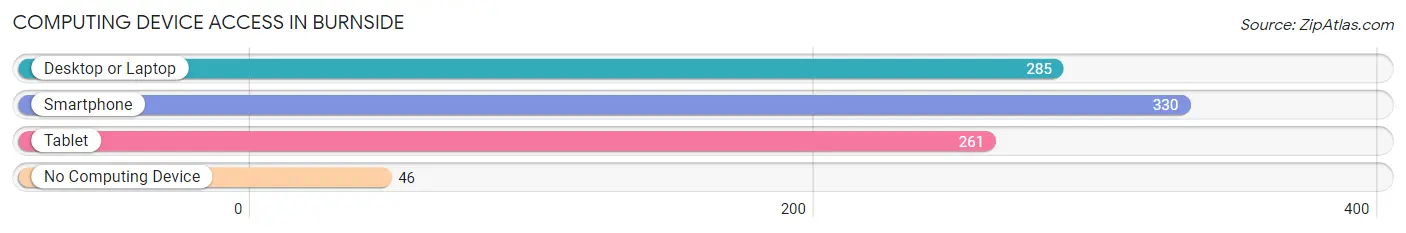
| Device Type | # Households | % Households |
| Desktop or Laptop | 285 | 72.5% |
| Smartphone | 330 | 84.0% |
| Tablet | 261 | 66.4% |
| No Computing Device | 46 | 11.7% |
| Total | 393 | 100.0% |
Internet Access in Burnside
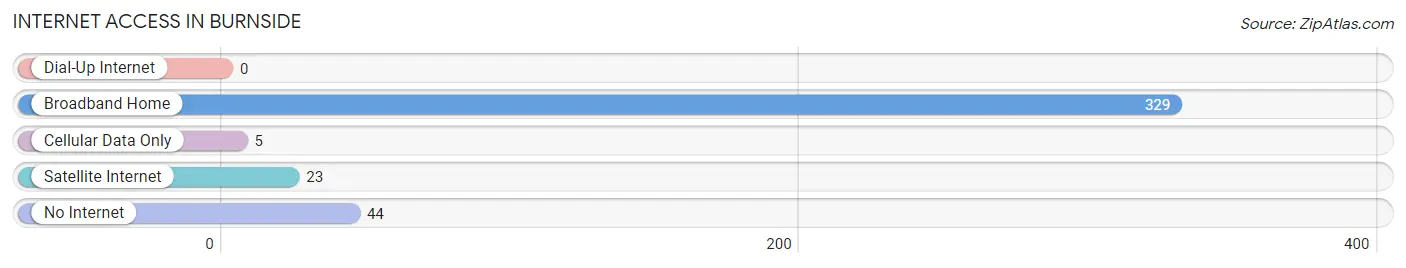
| Internet Type | # Households | % Households |
| Dial-Up Internet | 0 | 0.0% |
| Broadband Home | 329 | 83.7% |
| Cellular Data Only | 5 | 1.3% |
| Satellite Internet | 23 | 5.9% |
| No Internet | 44 | 11.2% |
| Total | 393 | 100.0% |
Burnside Summary
Burnside, Kentucky is a small town located in Pulaski County, Kentucky. It is situated on the banks of Lake Cumberland, a large reservoir created by the U.S. Army Corps of Engineers in the 1950s. The town has a population of approximately 1,500 people and is part of the Somerset-Pulaski County Micropolitan Statistical Area.
History
Burnside was founded in 1883 by the Louisville and Nashville Railroad. The town was named after Confederate General Ambrose Burnside, who was born in nearby Liberty, Kentucky. The town was originally a stop on the railroad line, and it quickly grew into a small community. In the early 1900s, the town was home to a number of businesses, including a hotel, a general store, a blacksmith shop, and a sawmill.
In the 1950s, the U.S. Army Corps of Engineers began construction of Lake Cumberland, a large reservoir that would eventually cover much of the surrounding area. The lake was completed in 1952, and the town of Burnside was relocated to higher ground. The lake has since become a popular destination for fishing, boating, and other recreational activities.
Geography
Burnside is located in Pulaski County, Kentucky, on the banks of Lake Cumberland. The town is situated at an elevation of 645 feet above sea level. The town is surrounded by rolling hills and forests, and the lake provides a scenic backdrop. The nearest major city is Somerset, which is located about 20 miles to the north.
Economy
The economy of Burnside is largely based on tourism. The town is a popular destination for fishing, boating, and other recreational activities. There are several marinas and boat ramps located in the area, as well as a number of restaurants and lodging options. The town also has a number of small businesses, including a grocery store, a hardware store, and a gas station.
Demographics
As of the 2010 census, the population of Burnside was 1,500. The racial makeup of the town was 97.3% White, 0.7% African American, 0.3% Native American, 0.3% Asian, and 1.3% from other races. The median household income was $30,000, and the median family income was $35,000. The per capita income was $15,000.
Conclusion
Burnside, Kentucky is a small town located in Pulaski County, Kentucky. It is situated on the banks of Lake Cumberland, a large reservoir created by the U.S. Army Corps of Engineers in the 1950s. The town has a population of approximately 1,500 people and is part of the Somerset-Pulaski County Micropolitan Statistical Area. The economy of Burnside is largely based on tourism, and the town is a popular destination for fishing, boating, and other recreational activities. The racial makeup of the town is predominantly White, with a small percentage of African American, Native American, and Asian residents. The median household income is $30,000, and the per capita income is $15,000.
Common Questions
What is Per Capita Income in Burnside?
Per Capita income in Burnside is $22,902.
What is the Median Family Income in Burnside?
Median Family Income in Burnside is $52,143.
What is the Median Household income in Burnside?
Median Household Income in Burnside is $52,847.
What is Income or Wage Gap in Burnside?
Income or Wage Gap in Burnside is 21.6%.
Women in Burnside earn 78.4 cents for every dollar earned by a man.
What is Inequality or Gini Index in Burnside?
Inequality or Gini Index in Burnside is 0.39.
What is the Total Population of Burnside?
Total Population of Burnside is 1,081.
What is the Total Male Population of Burnside?
Total Male Population of Burnside is 474.
What is the Total Female Population of Burnside?
Total Female Population of Burnside is 607.
What is the Ratio of Males per 100 Females in Burnside?
There are 78.09 Males per 100 Females in Burnside.
What is the Ratio of Females per 100 Males in Burnside?
There are 128.06 Females per 100 Males in Burnside.
What is the Median Population Age in Burnside?
Median Population Age in Burnside is 40.0 Years.
What is the Average Family Size in Burnside
Average Family Size in Burnside is 2.9 People.
What is the Average Household Size in Burnside
Average Household Size in Burnside is 2.8 People.
How Large is the Labor Force in Burnside?
There are 385 People in the Labor Forcein in Burnside.
What is the Percentage of People in the Labor Force in Burnside?
44.1% of People are in the Labor Force in Burnside.
What is the Unemployment Rate in Burnside?
Unemployment Rate in Burnside is 2.6%.