Liberty, KY Map & Demographics
Liberty Map
Liberty Overview
$19,718
PER CAPITA INCOME
$51,583
AVG FAMILY INCOME
$28,347
AVG HOUSEHOLD INCOME
26.5%
WAGE / INCOME GAP [ % ]
73.5¢/ $1
WAGE / INCOME GAP [ $ ]
0.47
INEQUALITY / GINI INDEX
2,164
TOTAL POPULATION
931
MALE POPULATION
1,233
FEMALE POPULATION
75.51
MALES / 100 FEMALES
132.44
FEMALES / 100 MALES
42.8
MEDIAN AGE
2.7
AVG FAMILY SIZE
2.0
AVG HOUSEHOLD SIZE
878
LABOR FORCE [ PEOPLE ]
44.2%
PERCENT IN LABOR FORCE
18.4%
UNEMPLOYMENT RATE
Liberty Zip Codes
Liberty Area Codes
Income in Liberty
Income Overview in Liberty
Per Capita Income in Liberty is $19,718, while median incomes of families and households are $51,583 and $28,347 respectively.
| Characteristic | Number | Measure |
| Per Capita Income | 2,164 | $19,718 |
| Median Family Income | 431 | $51,583 |
| Mean Family Income | 431 | $57,457 |
| Median Household Income | 887 | $28,347 |
| Mean Household Income | 887 | $43,219 |
| Income Deficit | 431 | $0 |
| Wage / Income Gap (%) | 2,164 | 26.55% |
| Wage / Income Gap ($) | 2,164 | 73.45¢ per $1 |
| Gini / Inequality Index | 2,164 | 0.47 |
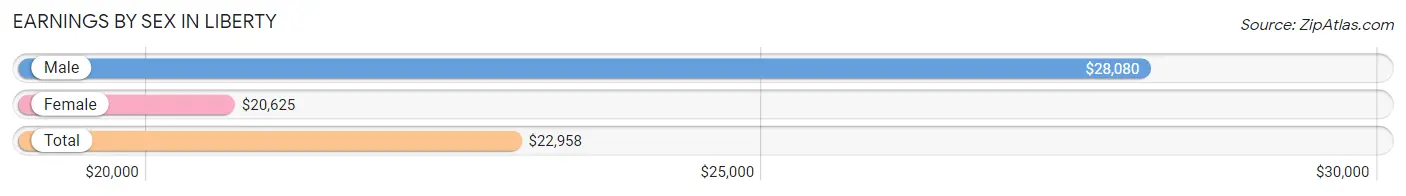
Earnings by Sex in Liberty
Average Earnings in Liberty are $22,958, $28,080 for men and $20,625 for women, a difference of 26.6%.
| Sex | Number | Average Earnings |
| Male | 533 (51.0%) | $28,080 |
| Female | 512 (49.0%) | $20,625 |
| Total | 1,045 (100.0%) | $22,958 |
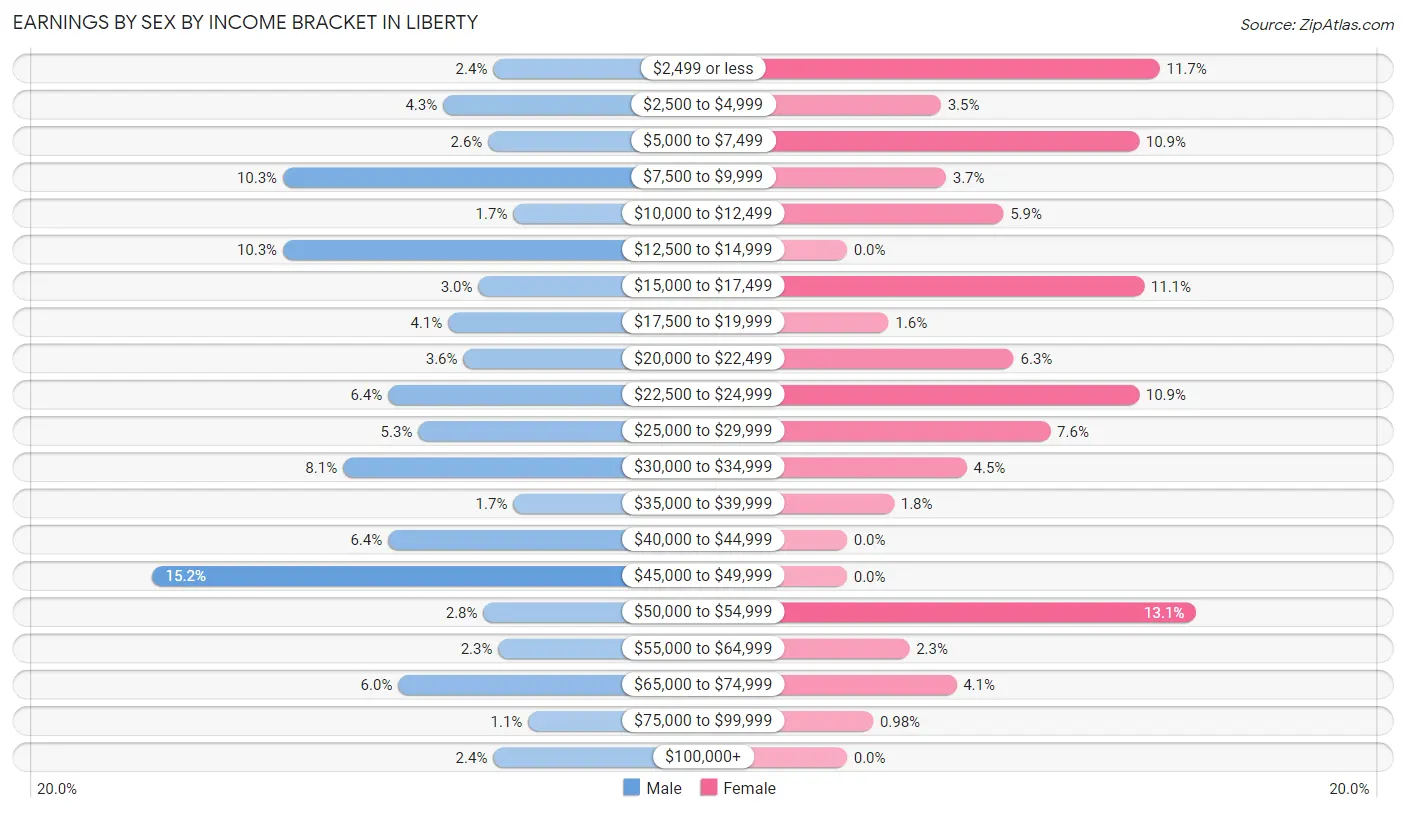
Earnings by Sex by Income Bracket in Liberty
The most common earnings brackets in Liberty are $45,000 to $49,999 for men (81 | 15.2%) and $50,000 to $54,999 for women (67 | 13.1%).
| Income | Male | Female |
| $2,499 or less | 13 (2.4%) | 60 (11.7%) |
| $2,500 to $4,999 | 23 (4.3%) | 18 (3.5%) |
| $5,000 to $7,499 | 14 (2.6%) | 56 (10.9%) |
| $7,500 to $9,999 | 55 (10.3%) | 19 (3.7%) |
| $10,000 to $12,499 | 9 (1.7%) | 30 (5.9%) |
| $12,500 to $14,999 | 55 (10.3%) | 0 (0.0%) |
| $15,000 to $17,499 | 16 (3.0%) | 57 (11.1%) |
| $17,500 to $19,999 | 22 (4.1%) | 8 (1.6%) |
| $20,000 to $22,499 | 19 (3.6%) | 32 (6.2%) |
| $22,500 to $24,999 | 34 (6.4%) | 56 (10.9%) |
| $25,000 to $29,999 | 28 (5.2%) | 39 (7.6%) |
| $30,000 to $34,999 | 43 (8.1%) | 23 (4.5%) |
| $35,000 to $39,999 | 9 (1.7%) | 9 (1.8%) |
| $40,000 to $44,999 | 34 (6.4%) | 0 (0.0%) |
| $45,000 to $49,999 | 81 (15.2%) | 0 (0.0%) |
| $50,000 to $54,999 | 15 (2.8%) | 67 (13.1%) |
| $55,000 to $64,999 | 12 (2.2%) | 12 (2.3%) |
| $65,000 to $74,999 | 32 (6.0%) | 21 (4.1%) |
| $75,000 to $99,999 | 6 (1.1%) | 5 (1.0%) |
| $100,000+ | 13 (2.4%) | 0 (0.0%) |
| Total | 533 (100.0%) | 512 (100.0%) |
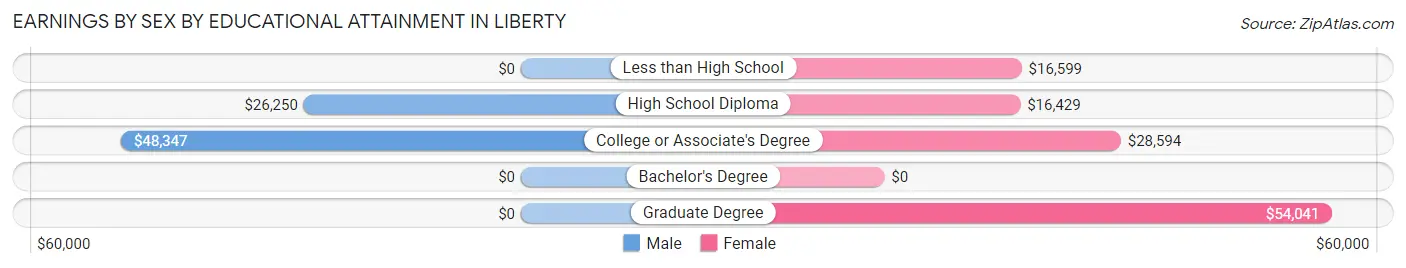
Earnings by Sex by Educational Attainment in Liberty
Average earnings in Liberty are $29,777 for men and $23,556 for women, a difference of 20.9%. Men with an educational attainment of college or associate's degree enjoy the highest average annual earnings of $48,347, while those with high school diploma education earn the least with $26,250. Women with an educational attainment of graduate degree earn the most with the average annual earnings of $54,041, while those with high school diploma education have the smallest earnings of $16,429.
| Educational Attainment | Male Income | Female Income |
| Less than High School | - | - |
| High School Diploma | $26,250 | $16,429 |
| College or Associate's Degree | $48,347 | $28,594 |
| Bachelor's Degree | - | - |
| Graduate Degree | - | - |
| Total | $29,777 | $23,556 |
Family Income in Liberty
Family Income Brackets in Liberty
According to the Liberty family income data, there are 98 families falling into the $50,000 to $74,999 income range, which is the most common income bracket and makes up 22.7% of all families. Conversely, the $150,000 to $199,999 income bracket is the least frequent group with only 5 families (1.2%) belonging to this category.
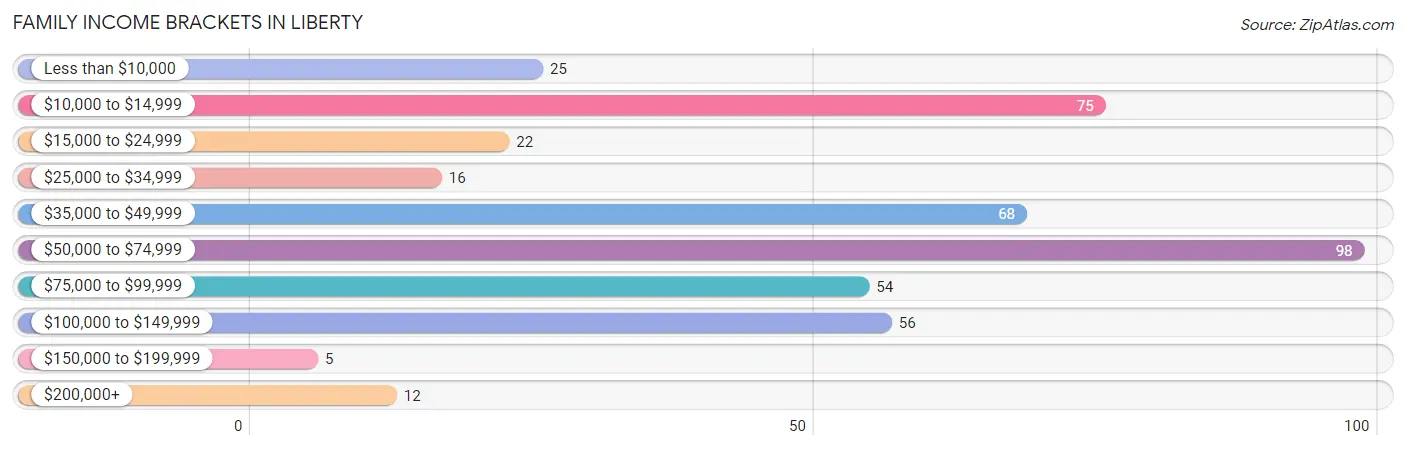
| Income Bracket | # Families | % Families |
| Less than $10,000 | 25 | 5.8% |
| $10,000 to $14,999 | 75 | 17.4% |
| $15,000 to $24,999 | 22 | 5.1% |
| $25,000 to $34,999 | 16 | 3.7% |
| $35,000 to $49,999 | 68 | 15.8% |
| $50,000 to $74,999 | 98 | 22.7% |
| $75,000 to $99,999 | 54 | 12.5% |
| $100,000 to $149,999 | 56 | 13.0% |
| $150,000 to $199,999 | 5 | 1.2% |
| $200,000+ | 12 | 2.8% |
Family Income by Famaliy Size in Liberty
4-person families (38 | 8.8%) account for the highest median family income in Liberty with $81,667 per family, while 4-person families (38 | 8.8%) have the highest median income of $20,417 per family member.
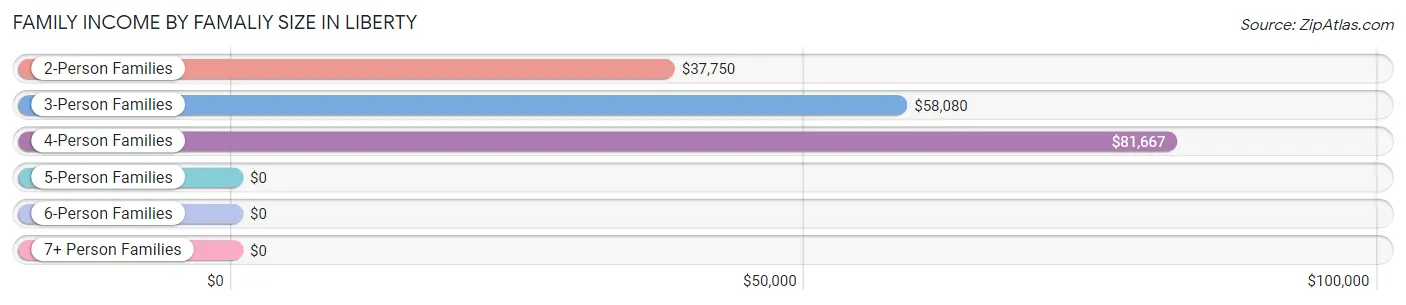
| Income Bracket | # Families | Median Income |
| 2-Person Families | 273 (63.3%) | $37,750 |
| 3-Person Families | 95 (22.0%) | $58,080 |
| 4-Person Families | 38 (8.8%) | $81,667 |
| 5-Person Families | 6 (1.4%) | $0 |
| 6-Person Families | 0 (0.0%) | $0 |
| 7+ Person Families | 19 (4.4%) | $0 |
| Total | 431 (100.0%) | $51,583 |
Family Income by Number of Earners in Liberty
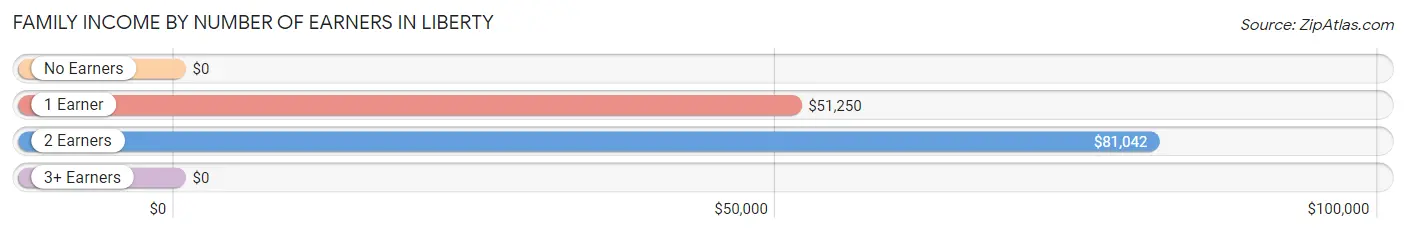
| Number of Earners | # Families | Median Income |
| No Earners | 116 (26.9%) | $0 |
| 1 Earner | 166 (38.5%) | $51,250 |
| 2 Earners | 115 (26.7%) | $81,042 |
| 3+ Earners | 34 (7.9%) | $0 |
| Total | 431 (100.0%) | $51,583 |
Household Income in Liberty
Household Income Brackets in Liberty
With 220 households falling in the category, the $10,000 to $14,999 income range is the most frequent in Liberty, accounting for 24.8% of all households. In contrast, only 12 households (1.3%) fall into the $150,000 to $199,999 income bracket, making it the least populous group.
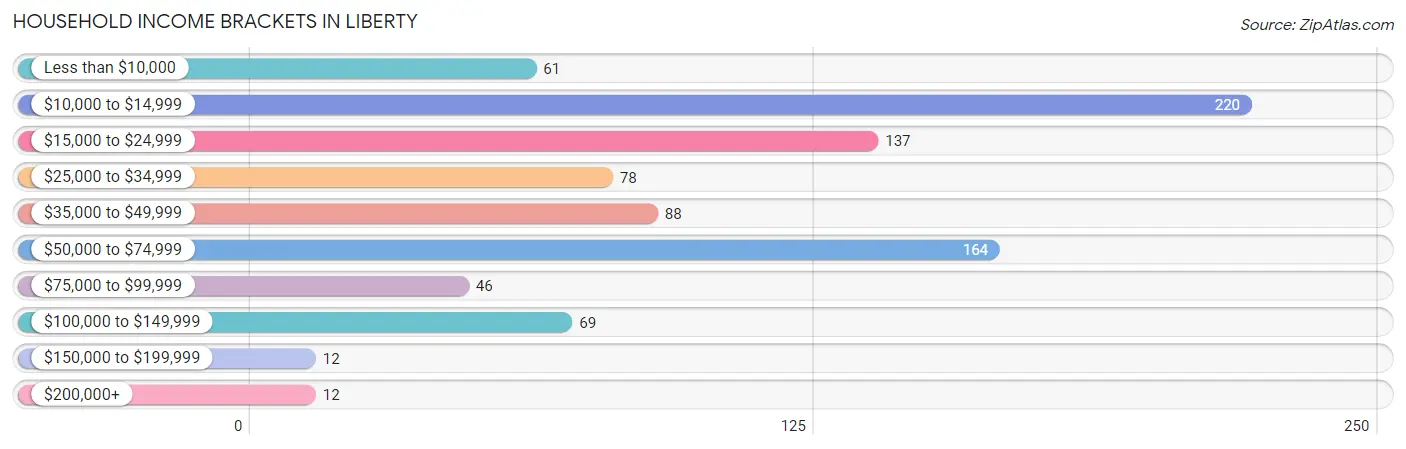
| Income Bracket | # Households | % Households |
| Less than $10,000 | 61 | 6.9% |
| $10,000 to $14,999 | 220 | 24.8% |
| $15,000 to $24,999 | 137 | 15.4% |
| $25,000 to $34,999 | 78 | 8.8% |
| $35,000 to $49,999 | 88 | 9.9% |
| $50,000 to $74,999 | 164 | 18.5% |
| $75,000 to $99,999 | 46 | 5.2% |
| $100,000 to $149,999 | 69 | 7.8% |
| $150,000 to $199,999 | 12 | 1.4% |
| $200,000+ | 12 | 1.4% |
Household Income by Householder Age in Liberty
The median household income in Liberty is $28,347, with the highest median household income of $58,071 found in the 25 to 44 years age bracket for the primary householder. A total of 224 households (25.3%) fall into this category. Meanwhile, the 15 to 24 years age bracket for the primary householder has the lowest median household income of $0, with 85 households (9.6%) in this group.
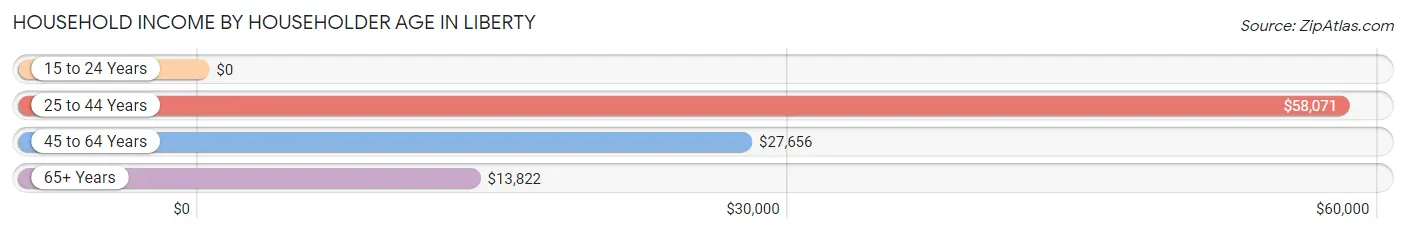
| Income Bracket | # Households | Median Income |
| 15 to 24 Years | 85 (9.6%) | $0 |
| 25 to 44 Years | 224 (25.3%) | $58,071 |
| 45 to 64 Years | 287 (32.4%) | $27,656 |
| 65+ Years | 291 (32.8%) | $13,822 |
| Total | 887 (100.0%) | $28,347 |
Poverty in Liberty
Income Below Poverty by Sex and Age in Liberty
With 22.2% poverty level for males and 35.8% for females among the residents of Liberty, 16 and 17 year old males and 65 to 74 year old females are the most vulnerable to poverty, with 55 males (59.1%) and 116 females (66.3%) in their respective age groups living below the poverty level.
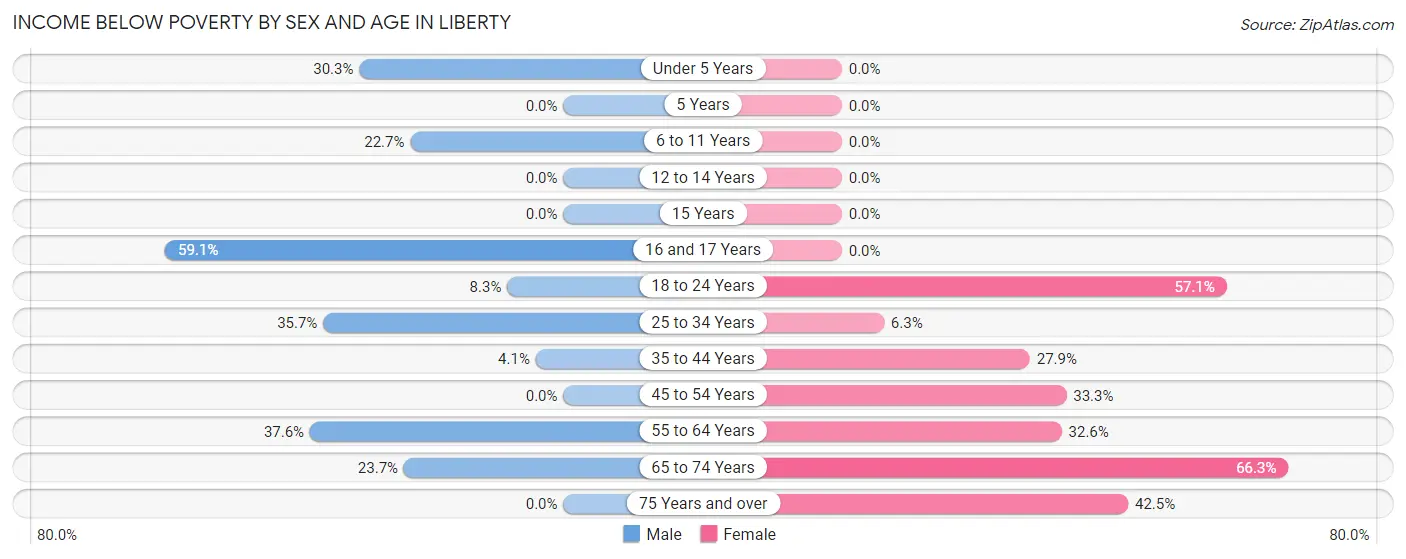
| Age Bracket | Male | Female |
| Under 5 Years | 10 (30.3%) | 0 (0.0%) |
| 5 Years | 0 (0.0%) | 0 (0.0%) |
| 6 to 11 Years | 5 (22.7%) | 0 (0.0%) |
| 12 to 14 Years | 0 (0.0%) | 0 (0.0%) |
| 15 Years | 0 (0.0%) | 0 (0.0%) |
| 16 and 17 Years | 55 (59.1%) | 0 (0.0%) |
| 18 to 24 Years | 5 (8.3%) | 68 (57.1%) |
| 25 to 34 Years | 46 (35.7%) | 8 (6.2%) |
| 35 to 44 Years | 5 (4.1%) | 43 (27.9%) |
| 45 to 54 Years | 0 (0.0%) | 25 (33.3%) |
| 55 to 64 Years | 35 (37.6%) | 63 (32.6%) |
| 65 to 74 Years | 9 (23.7%) | 116 (66.3%) |
| 75 Years and over | 0 (0.0%) | 51 (42.5%) |
| Total | 170 (22.2%) | 374 (35.8%) |
Income Above Poverty by Sex and Age in Liberty
According to the poverty statistics in Liberty, males aged 12 to 14 years and females aged under 5 years are the age groups that are most secure financially, with 100.0% of males and 100.0% of females in these age groups living above the poverty line.
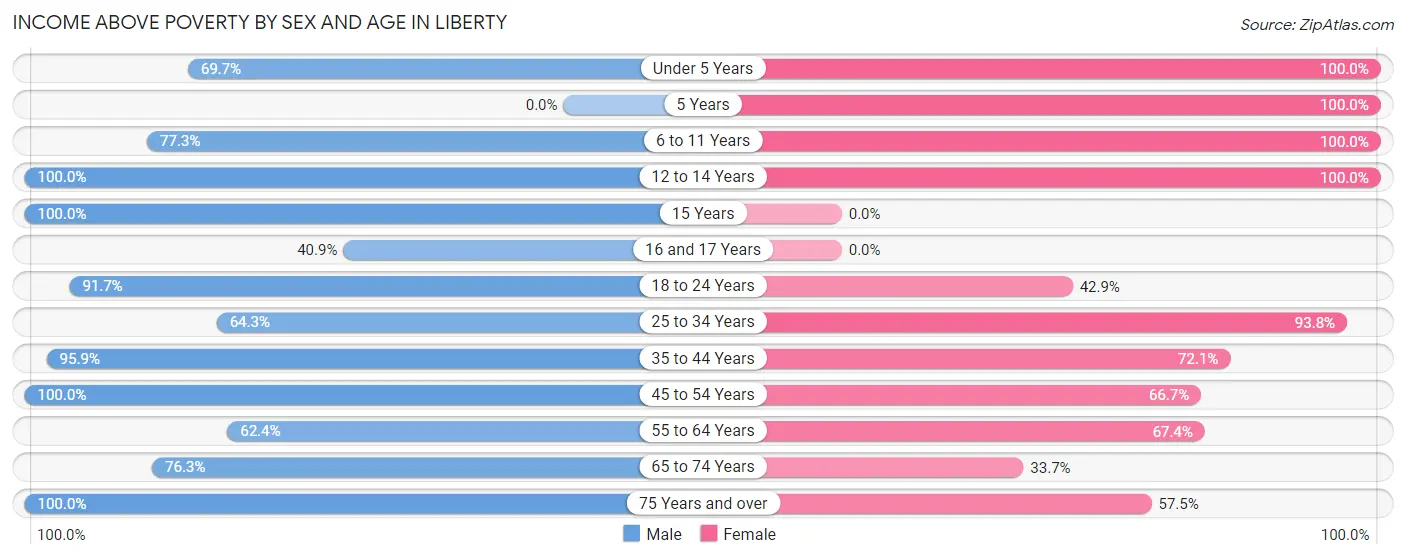
| Age Bracket | Male | Female |
| Under 5 Years | 23 (69.7%) | 6 (100.0%) |
| 5 Years | 0 (0.0%) | 13 (100.0%) |
| 6 to 11 Years | 17 (77.3%) | 33 (100.0%) |
| 12 to 14 Years | 25 (100.0%) | 29 (100.0%) |
| 15 Years | 16 (100.0%) | 0 (0.0%) |
| 16 and 17 Years | 38 (40.9%) | 0 (0.0%) |
| 18 to 24 Years | 55 (91.7%) | 51 (42.9%) |
| 25 to 34 Years | 83 (64.3%) | 120 (93.8%) |
| 35 to 44 Years | 117 (95.9%) | 111 (72.1%) |
| 45 to 54 Years | 93 (100.0%) | 50 (66.7%) |
| 55 to 64 Years | 58 (62.4%) | 130 (67.4%) |
| 65 to 74 Years | 29 (76.3%) | 59 (33.7%) |
| 75 Years and over | 41 (100.0%) | 69 (57.5%) |
| Total | 595 (77.8%) | 671 (64.2%) |
Income Below Poverty Among Married-Couple Families in Liberty
The poverty statistics for married-couple families in Liberty show that 9.4% or 23 of the total 245 families live below the poverty line. Families with no children have the highest poverty rate of 14.7%, comprising of 23 families. On the other hand, families with 1 or 2 children have the lowest poverty rate of 0.0%, which includes 0 families.
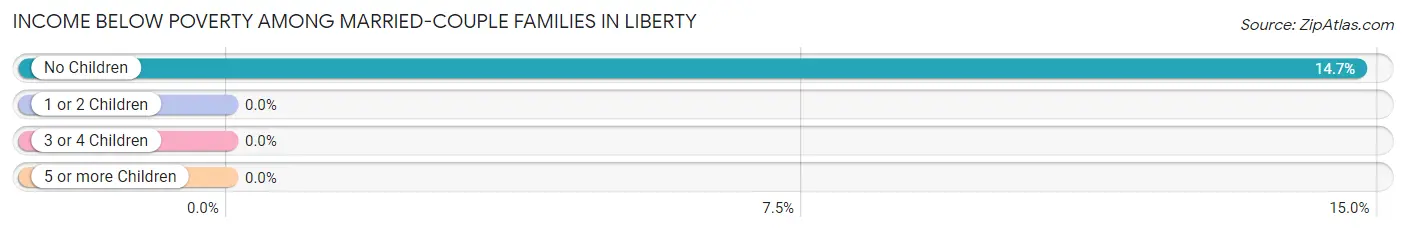
| Children | Above Poverty | Below Poverty |
| No Children | 133 (85.3%) | 23 (14.7%) |
| 1 or 2 Children | 89 (100.0%) | 0 (0.0%) |
| 3 or 4 Children | 0 (0.0%) | 0 (0.0%) |
| 5 or more Children | 0 (0.0%) | 0 (0.0%) |
| Total | 222 (90.6%) | 23 (9.4%) |
Income Below Poverty Among Single-Parent Households in Liberty
According to the poverty data in Liberty, 7.7% or 5 single-father households and 77.7% or 94 single-mother households are living below the poverty line. Among single-father households, those with 1 or 2 children have the highest poverty rate, with 5 households (12.5%) experiencing poverty. Likewise, among single-mother households, those with 1 or 2 children have the highest poverty rate, with 69 households (97.2%) falling below the poverty line.
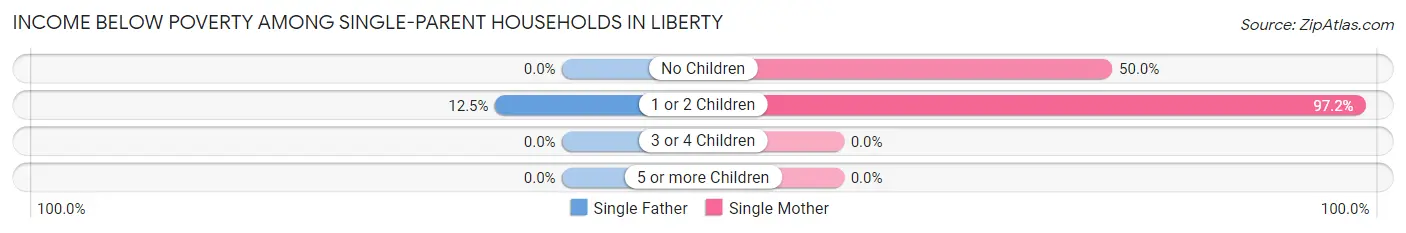
| Children | Single Father | Single Mother |
| No Children | 0 (0.0%) | 25 (50.0%) |
| 1 or 2 Children | 5 (12.5%) | 69 (97.2%) |
| 3 or 4 Children | 0 (0.0%) | 0 (0.0%) |
| 5 or more Children | 0 (0.0%) | 0 (0.0%) |
| Total | 5 (7.7%) | 94 (77.7%) |
Income Below Poverty Among Married-Couple vs Single-Parent Households in Liberty
The poverty data for Liberty shows that 23 of the married-couple family households (9.4%) and 99 of the single-parent households (53.2%) are living below the poverty level. Within the married-couple family households, those with no children have the highest poverty rate, with 23 households (14.7%) falling below the poverty line. Among the single-parent households, those with 1 or 2 children have the highest poverty rate, with 74 household (66.7%) living below poverty.
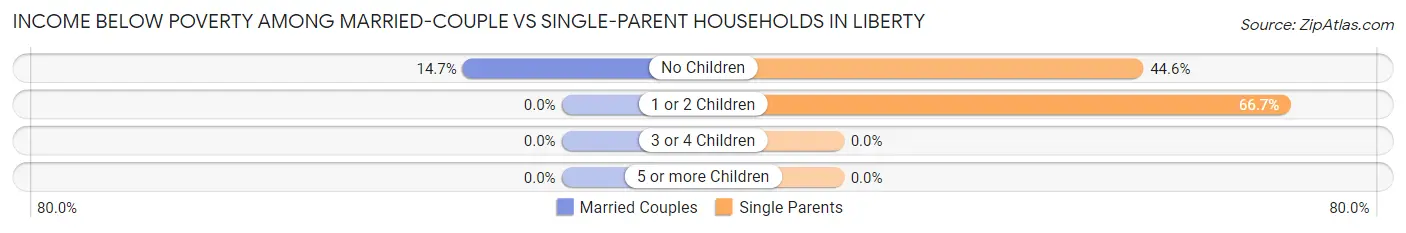
| Children | Married-Couple Families | Single-Parent Households |
| No Children | 23 (14.7%) | 25 (44.6%) |
| 1 or 2 Children | 0 (0.0%) | 74 (66.7%) |
| 3 or 4 Children | 0 (0.0%) | 0 (0.0%) |
| 5 or more Children | 0 (0.0%) | 0 (0.0%) |
| Total | 23 (9.4%) | 99 (53.2%) |
Race in Liberty
The most populous races in Liberty are White / Caucasian (2,015 | 93.1%), Hispanic or Latino (232 | 10.7%), and Two or more Races (112 | 5.2%).
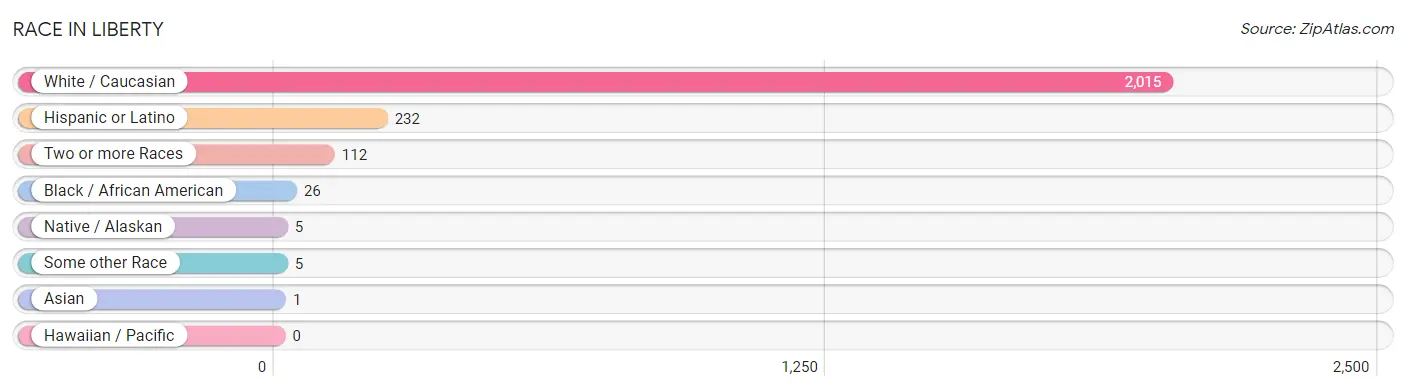
| Race | # Population | % Population |
| Asian | 1 | 0.1% |
| Black / African American | 26 | 1.2% |
| Hawaiian / Pacific | 0 | 0.0% |
| Hispanic or Latino | 232 | 10.7% |
| Native / Alaskan | 5 | 0.2% |
| White / Caucasian | 2,015 | 93.1% |
| Two or more Races | 112 | 5.2% |
| Some other Race | 5 | 0.2% |
| Total | 2,164 | 100.0% |
Ancestry in Liberty
The most populous ancestries reported in Liberty are American (524 | 24.2%), Mexican (224 | 10.3%), English (218 | 10.1%), Irish (115 | 5.3%), and German (51 | 2.4%), together accounting for 52.3% of all Liberty residents.
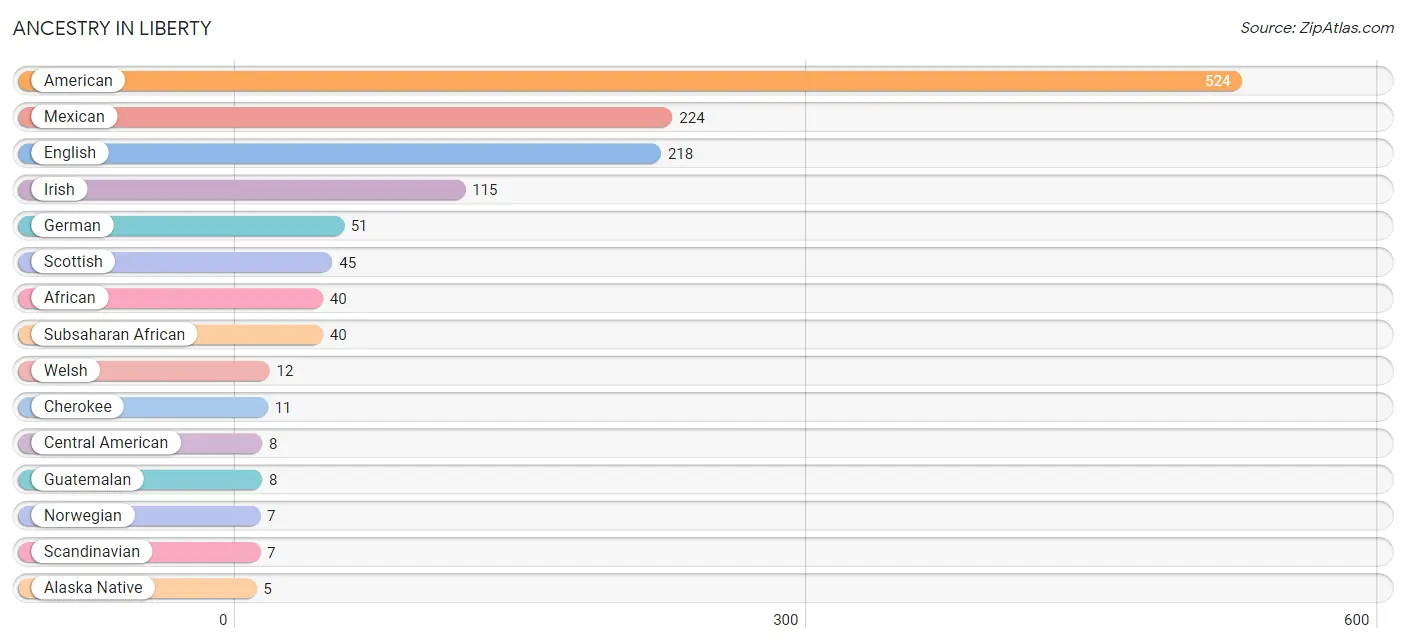
| Ancestry | # Population | % Population |
| African | 40 | 1.8% |
| Alaska Native | 5 | 0.2% |
| American | 524 | 24.2% |
| Central American | 8 | 0.4% |
| Cherokee | 11 | 0.5% |
| English | 218 | 10.1% |
| French | 4 | 0.2% |
| German | 51 | 2.4% |
| Guatemalan | 8 | 0.4% |
| Irish | 115 | 5.3% |
| Mexican | 224 | 10.3% |
| Norwegian | 7 | 0.3% |
| Pakistani | 1 | 0.1% |
| Scandinavian | 7 | 0.3% |
| Scotch-Irish | 5 | 0.2% |
| Scottish | 45 | 2.1% |
| Subsaharan African | 40 | 1.8% |
| Welsh | 12 | 0.5% | View All 18 Rows |
Immigrants in Liberty
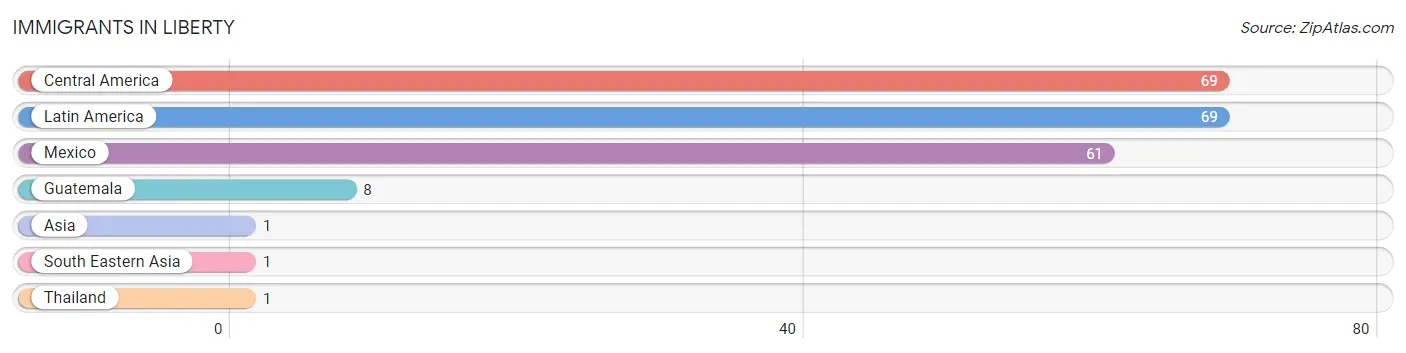
The most numerous immigrant groups reported in Liberty came from Central America (69 | 3.2%), Latin America (69 | 3.2%), Mexico (61 | 2.8%), Guatemala (8 | 0.4%), and Asia (1 | 0.1%), together accounting for 9.6% of all Liberty residents.
| Immigration Origin | # Population | % Population |
| Asia | 1 | 0.1% |
| Central America | 69 | 3.2% |
| Guatemala | 8 | 0.4% |
| Latin America | 69 | 3.2% |
| Mexico | 61 | 2.8% |
| South Eastern Asia | 1 | 0.1% |
| Thailand | 1 | 0.1% | View All 7 Rows |
Sex and Age in Liberty
Sex and Age in Liberty
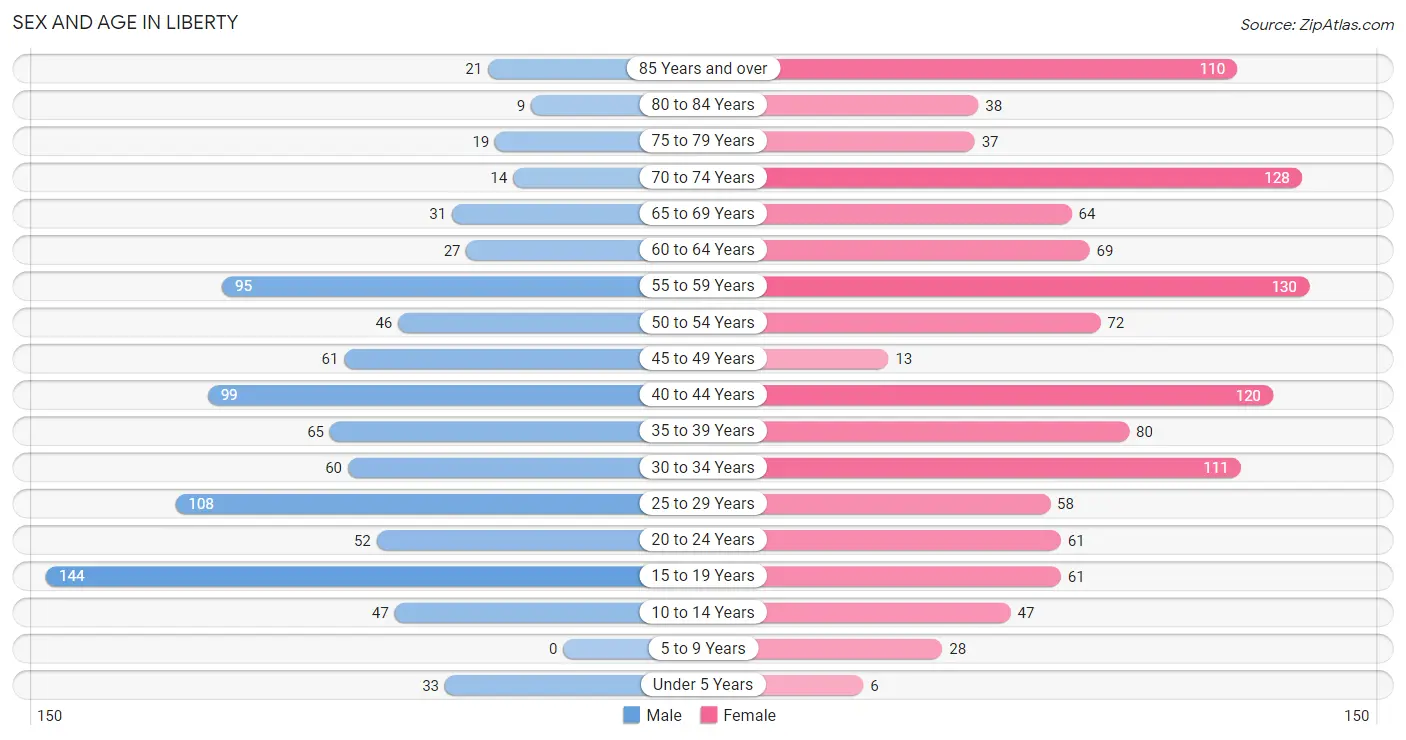
The most populous age groups in Liberty are 15 to 19 Years (144 | 15.5%) for men and 55 to 59 Years (130 | 10.5%) for women.
| Age Bracket | Male | Female |
| Under 5 Years | 33 (3.5%) | 6 (0.5%) |
| 5 to 9 Years | 0 (0.0%) | 28 (2.3%) |
| 10 to 14 Years | 47 (5.1%) | 47 (3.8%) |
| 15 to 19 Years | 144 (15.5%) | 61 (5.0%) |
| 20 to 24 Years | 52 (5.6%) | 61 (5.0%) |
| 25 to 29 Years | 108 (11.6%) | 58 (4.7%) |
| 30 to 34 Years | 60 (6.4%) | 111 (9.0%) |
| 35 to 39 Years | 65 (7.0%) | 80 (6.5%) |
| 40 to 44 Years | 99 (10.6%) | 120 (9.7%) |
| 45 to 49 Years | 61 (6.6%) | 13 (1.1%) |
| 50 to 54 Years | 46 (4.9%) | 72 (5.8%) |
| 55 to 59 Years | 95 (10.2%) | 130 (10.5%) |
| 60 to 64 Years | 27 (2.9%) | 69 (5.6%) |
| 65 to 69 Years | 31 (3.3%) | 64 (5.2%) |
| 70 to 74 Years | 14 (1.5%) | 128 (10.4%) |
| 75 to 79 Years | 19 (2.0%) | 37 (3.0%) |
| 80 to 84 Years | 9 (1.0%) | 38 (3.1%) |
| 85 Years and over | 21 (2.3%) | 110 (8.9%) |
| Total | 931 (100.0%) | 1,233 (100.0%) |
Families and Households in Liberty
Median Family Size in Liberty
The median family size in Liberty is 2.73 persons per family, with single male/father families (65 | 15.1%) accounting for the largest median family size of 4.45 persons per family. On the other hand, single female/mother families (121 | 28.1%) represent the smallest median family size with 2.06 persons per family.
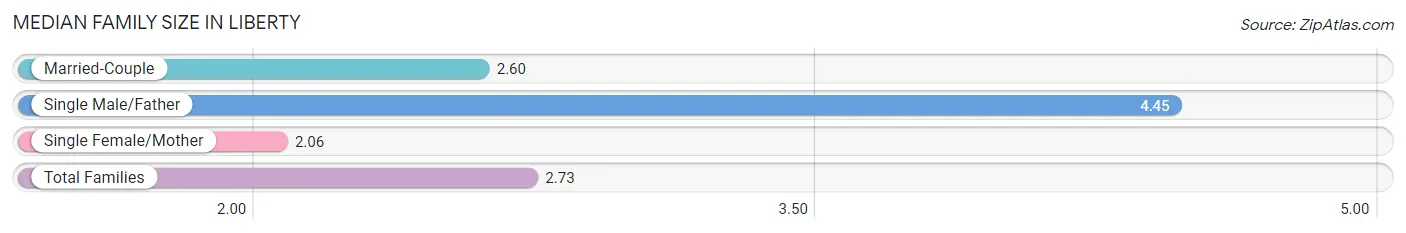
| Family Type | # Families | Family Size |
| Married-Couple | 245 (56.8%) | 2.60 |
| Single Male/Father | 65 (15.1%) | 4.45 |
| Single Female/Mother | 121 (28.1%) | 2.06 |
| Total Families | 431 (100.0%) | 2.73 |
Median Household Size in Liberty
The median household size in Liberty is 2.04 persons per household, with single male/father households (65 | 7.3%) accounting for the largest median household size of 4.8 persons per household. non-family households (456 | 51.4%) represent the smallest median household size with 1.25 persons per household.
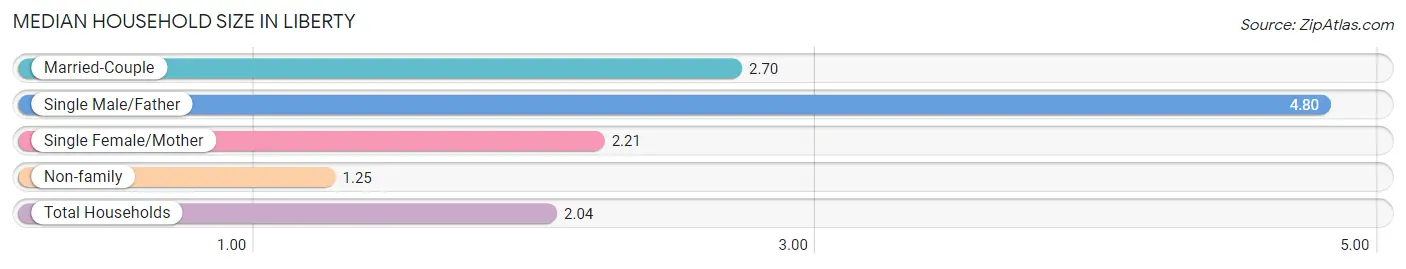
| Household Type | # Households | Household Size |
| Married-Couple | 245 (27.6%) | 2.70 |
| Single Male/Father | 65 (7.3%) | 4.80 |
| Single Female/Mother | 121 (13.6%) | 2.21 |
| Non-family | 456 (51.4%) | 1.25 |
| Total Households | 887 (100.0%) | 2.04 |
Household Size by Marriage Status in Liberty
Out of a total of 887 households in Liberty, 431 (48.6%) are family households, while 456 (51.4%) are nonfamily households. The most numerous type of family households are 2-person households, comprising 234, and the most common type of nonfamily households are 1-person households, comprising 389.
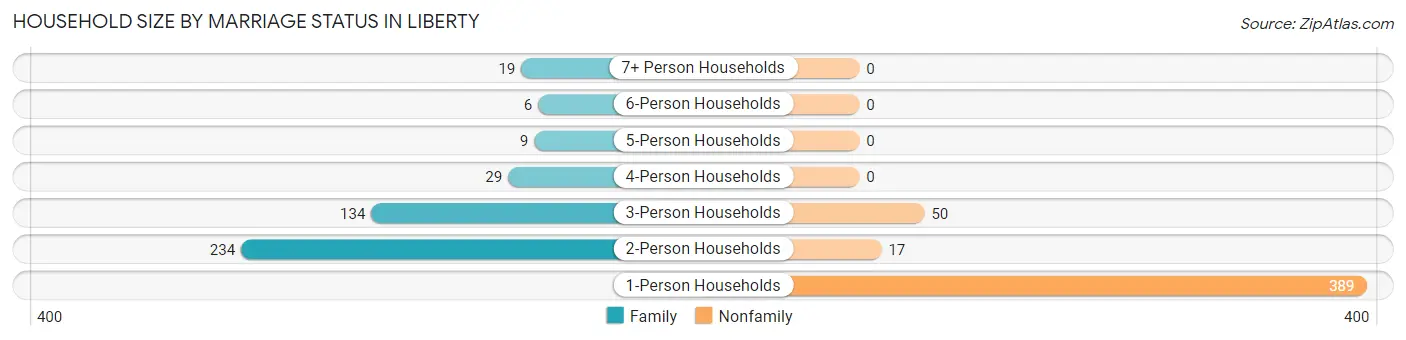
| Household Size | Family Households | Nonfamily Households |
| 1-Person Households | - | 389 (43.9%) |
| 2-Person Households | 234 (26.4%) | 17 (1.9%) |
| 3-Person Households | 134 (15.1%) | 50 (5.6%) |
| 4-Person Households | 29 (3.3%) | 0 (0.0%) |
| 5-Person Households | 9 (1.0%) | 0 (0.0%) |
| 6-Person Households | 6 (0.7%) | 0 (0.0%) |
| 7+ Person Households | 19 (2.1%) | 0 (0.0%) |
| Total | 431 (48.6%) | 456 (51.4%) |
Female Fertility in Liberty
Fertility by Age in Liberty
Average fertility rate in Liberty is 41.0 births per 1,000 women. Women in the age bracket of 20 to 34 years have the highest fertility rate with 91.0 births per 1,000 women. Women in the age bracket of 20 to 34 years acount for 100.0% of all women with births.
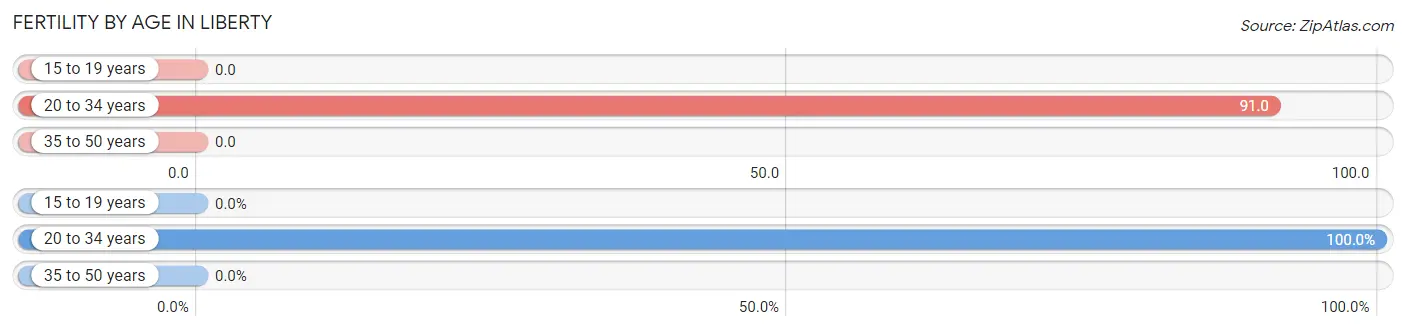
| Age Bracket | Women with Births | Births / 1,000 Women |
| 15 to 19 years | 0 (0.0%) | 0.0 |
| 20 to 34 years | 21 (100.0%) | 91.0 |
| 35 to 50 years | 0 (0.0%) | 0.0 |
| Total | 21 (100.0%) | 41.0 |
Fertility by Age by Marriage Status in Liberty
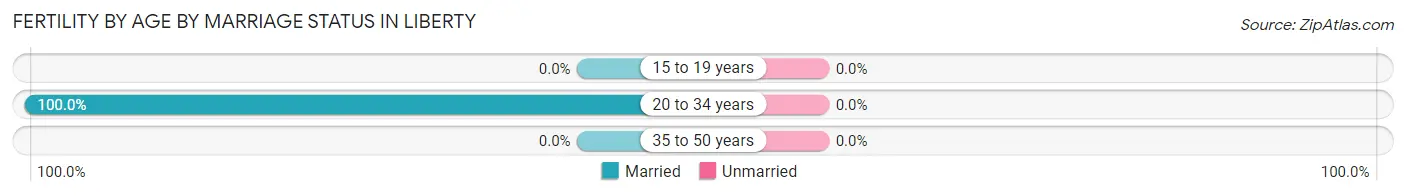
| Age Bracket | Married | Unmarried |
| 15 to 19 years | 0 (0.0%) | 0 (0.0%) |
| 20 to 34 years | 21 (100.0%) | 0 (0.0%) |
| 35 to 50 years | 0 (0.0%) | 0 (0.0%) |
| Total | 21 (100.0%) | 0 (0.0%) |
Fertility by Education in Liberty
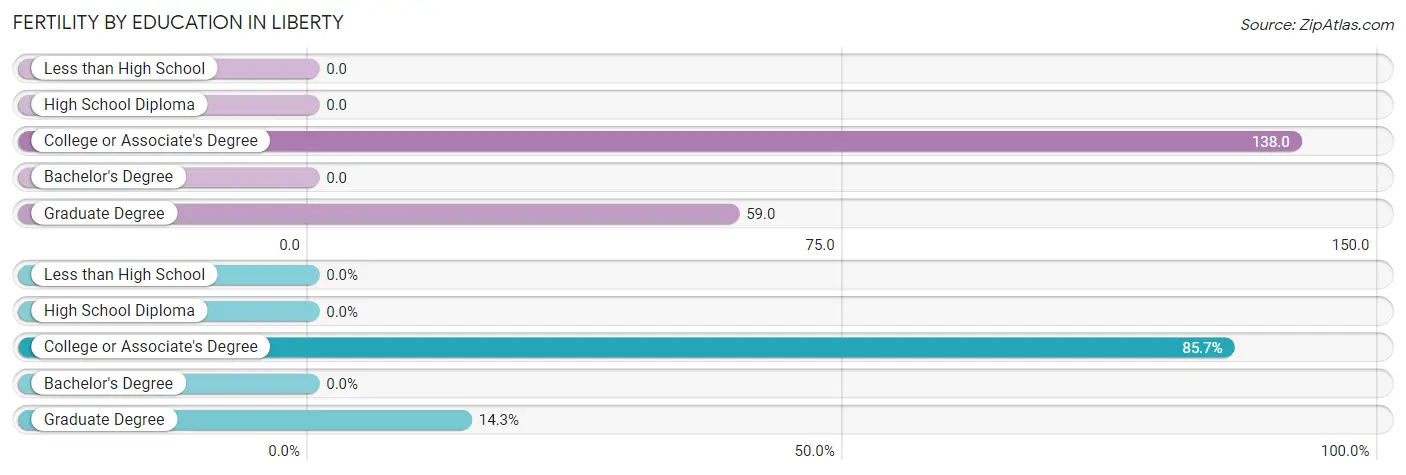
| Educational Attainment | Women with Births | Births / 1,000 Women |
| Less than High School | 0 (0.0%) | 0.0 |
| High School Diploma | 0 (0.0%) | 0.0 |
| College or Associate's Degree | 18 (85.7%) | 138.0 |
| Bachelor's Degree | 0 (0.0%) | 0.0 |
| Graduate Degree | 3 (14.3%) | 59.0 |
| Total | 21 (100.0%) | 41.0 |
Fertility by Education by Marriage Status in Liberty
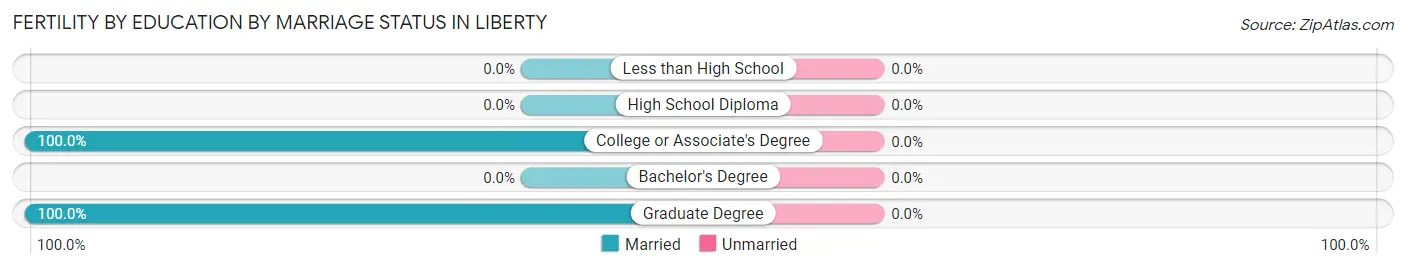
| Educational Attainment | Married | Unmarried |
| Less than High School | 0 (0.0%) | 0 (0.0%) |
| High School Diploma | 0 (0.0%) | 0 (0.0%) |
| College or Associate's Degree | 18 (100.0%) | 0 (0.0%) |
| Bachelor's Degree | 0 (0.0%) | 0 (0.0%) |
| Graduate Degree | 3 (100.0%) | 0 (0.0%) |
| Total | 21 (100.0%) | 0 (0.0%) |
Employment Characteristics in Liberty
Employment by Class of Employer in Liberty
Among the 716 employed individuals in Liberty, private company employees (566 | 79.0%), local government employees (67 | 9.4%), and state government employees (43 | 6.0%) make up the most common classes of employment.
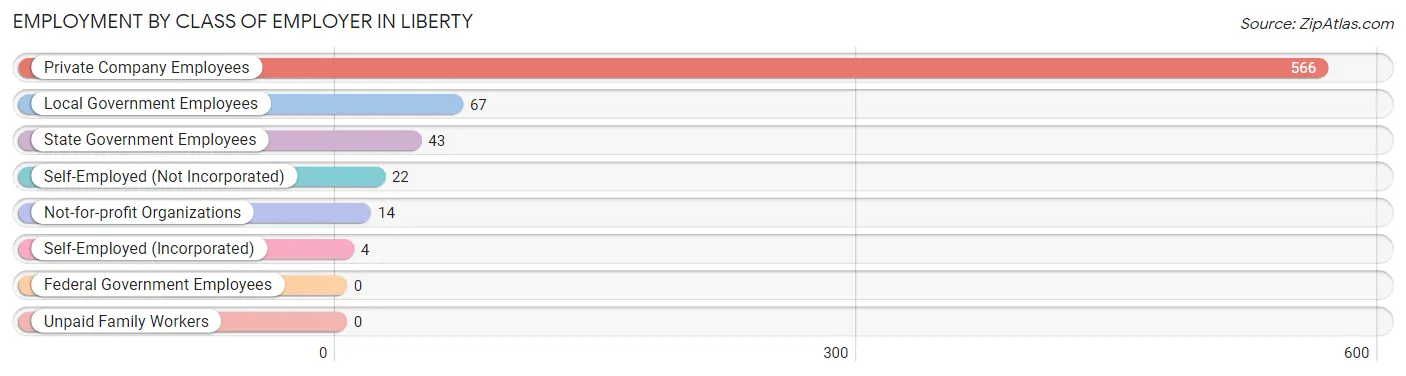
| Employer Class | # Employees | % Employees |
| Private Company Employees | 566 | 79.0% |
| Self-Employed (Incorporated) | 4 | 0.6% |
| Self-Employed (Not Incorporated) | 22 | 3.1% |
| Not-for-profit Organizations | 14 | 2.0% |
| Local Government Employees | 67 | 9.4% |
| State Government Employees | 43 | 6.0% |
| Federal Government Employees | 0 | 0.0% |
| Unpaid Family Workers | 0 | 0.0% |
| Total | 716 | 100.0% |
Employment Status by Age in Liberty
According to the labor force statistics for Liberty, out of the total population over 16 years of age (1,987), 44.2% or 878 individuals are in the labor force, with 18.4% or 162 of them unemployed. The age group with the highest labor force participation rate is 45 to 54 years, with 71.4% or 137 individuals in the labor force. Within the labor force, the 16 to 19 years age range has the highest percentage of unemployed individuals, with 77.5% or 79 of them being unemployed.
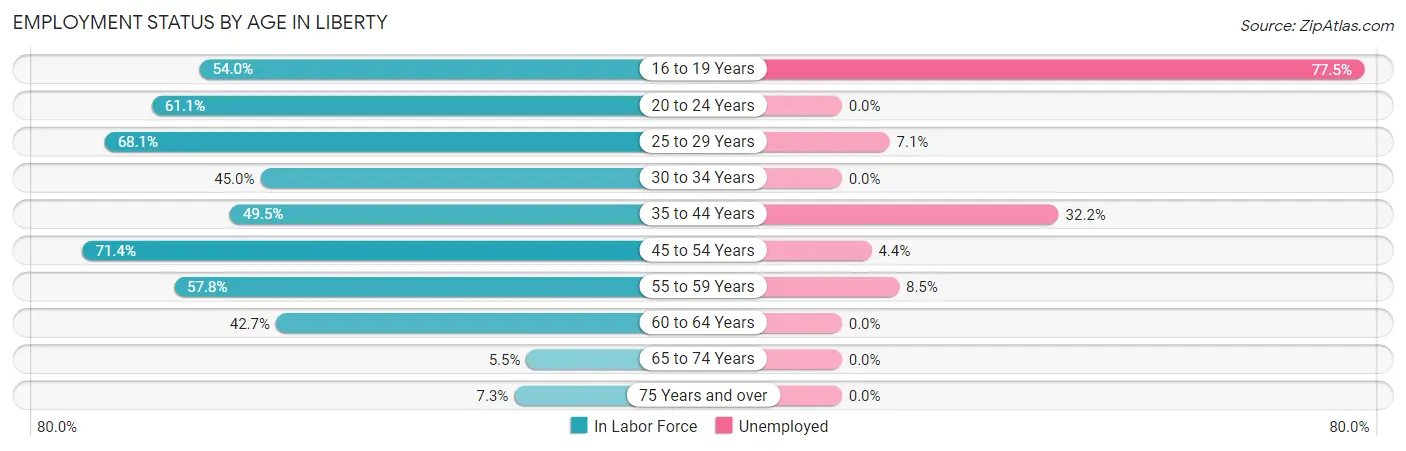
| Age Bracket | In Labor Force | Unemployed |
| 16 to 19 Years | 102 (54.0%) | 79 (77.5%) |
| 20 to 24 Years | 69 (61.1%) | 0 (0.0%) |
| 25 to 29 Years | 113 (68.1%) | 8 (7.1%) |
| 30 to 34 Years | 77 (45.0%) | 0 (0.0%) |
| 35 to 44 Years | 180 (49.5%) | 58 (32.2%) |
| 45 to 54 Years | 137 (71.4%) | 6 (4.4%) |
| 55 to 59 Years | 130 (57.8%) | 11 (8.5%) |
| 60 to 64 Years | 41 (42.7%) | 0 (0.0%) |
| 65 to 74 Years | 13 (5.5%) | 0 (0.0%) |
| 75 Years and over | 17 (7.3%) | 0 (0.0%) |
| Total | 878 (44.2%) | 162 (18.4%) |
Employment Status by Educational Attainment in Liberty
According to labor force statistics for Liberty, 55.8% of individuals (677) out of the total population between 25 and 64 years of age (1,214) are in the labor force, with 12.2% or 83 of them being unemployed. The group with the highest labor force participation rate are those with the educational attainment of bachelor's degree or higher, with 79.5% or 136 individuals in the labor force. Within the labor force, individuals with bachelor's degree or higher education have the highest percentage of unemployment, with 19.9% or 27 of them being unemployed.
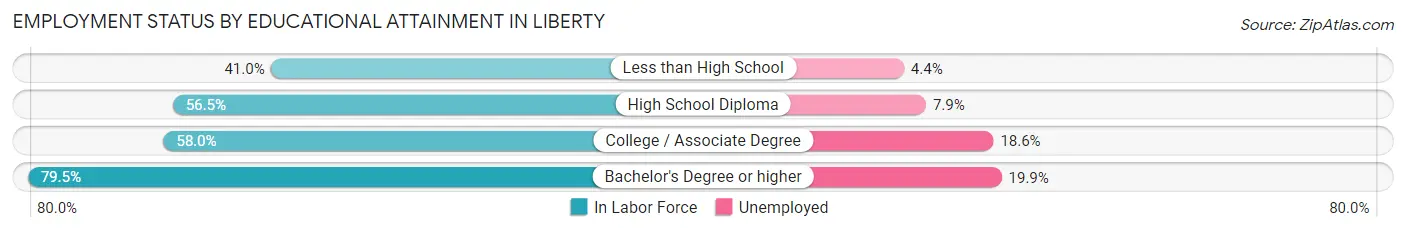
| Educational Attainment | In Labor Force | Unemployed |
| Less than High School | 136 (41.0%) | 15 (4.4%) |
| High School Diploma | 239 (56.5%) | 33 (7.9%) |
| College / Associate Degree | 167 (58.0%) | 54 (18.6%) |
| Bachelor's Degree or higher | 136 (79.5%) | 34 (19.9%) |
| Total | 677 (55.8%) | 148 (12.2%) |
Employment Occupations by Sex in Liberty
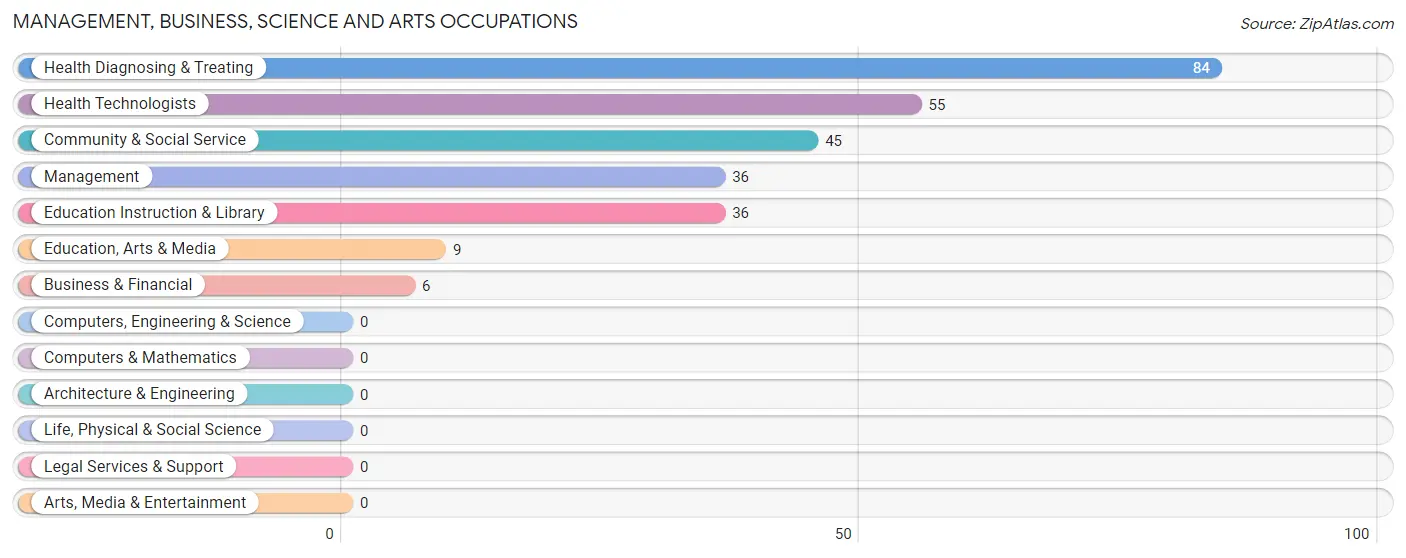
Management, Business, Science and Arts Occupations
The most common Management, Business, Science and Arts occupations in Liberty are Health Diagnosing & Treating (84 | 11.7%), Health Technologists (55 | 7.7%), Community & Social Service (45 | 6.3%), Management (36 | 5.0%), and Education Instruction & Library (36 | 5.0%).
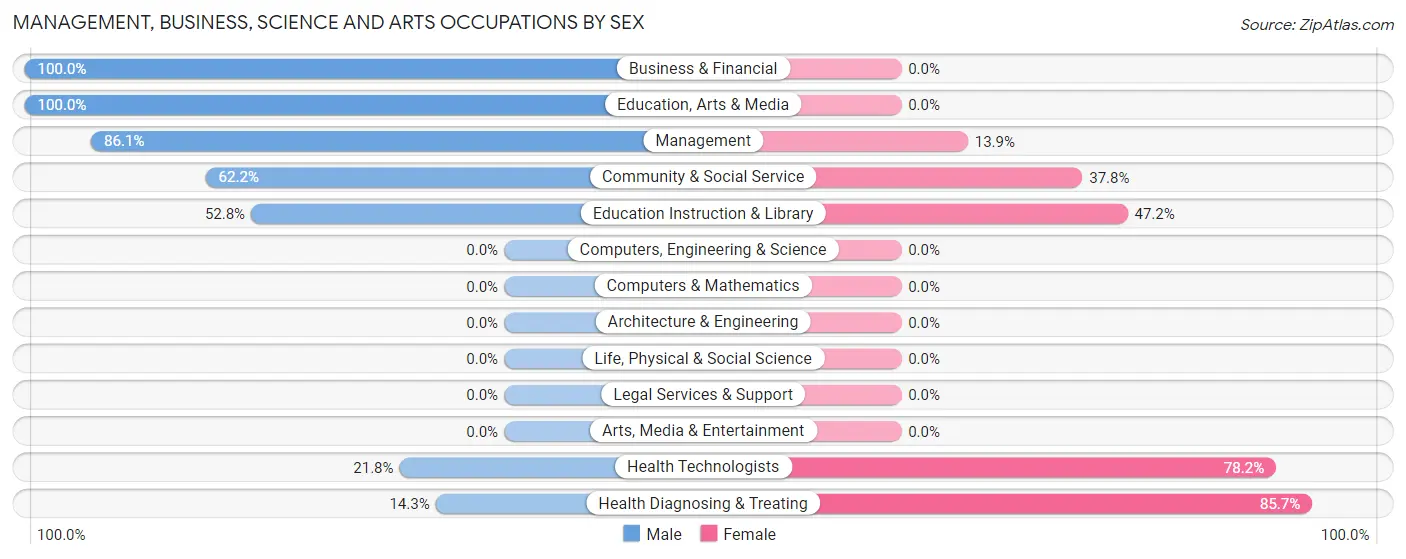
Management, Business, Science and Arts Occupations by Sex
Within the Management, Business, Science and Arts occupations in Liberty, the most male-oriented occupations are Business & Financial (100.0%), Education, Arts & Media (100.0%), and Management (86.1%), while the most female-oriented occupations are Health Diagnosing & Treating (85.7%), Health Technologists (78.2%), and Education Instruction & Library (47.2%).
| Occupation | Male | Female |
| Management | 31 (86.1%) | 5 (13.9%) |
| Business & Financial | 6 (100.0%) | 0 (0.0%) |
| Computers, Engineering & Science | 0 (0.0%) | 0 (0.0%) |
| Computers & Mathematics | 0 (0.0%) | 0 (0.0%) |
| Architecture & Engineering | 0 (0.0%) | 0 (0.0%) |
| Life, Physical & Social Science | 0 (0.0%) | 0 (0.0%) |
| Community & Social Service | 28 (62.2%) | 17 (37.8%) |
| Education, Arts & Media | 9 (100.0%) | 0 (0.0%) |
| Legal Services & Support | 0 (0.0%) | 0 (0.0%) |
| Education Instruction & Library | 19 (52.8%) | 17 (47.2%) |
| Arts, Media & Entertainment | 0 (0.0%) | 0 (0.0%) |
| Health Diagnosing & Treating | 12 (14.3%) | 72 (85.7%) |
| Health Technologists | 12 (21.8%) | 43 (78.2%) |
| Total (Category) | 77 (45.0%) | 94 (55.0%) |
| Total (Overall) | 370 (51.6%) | 347 (48.4%) |
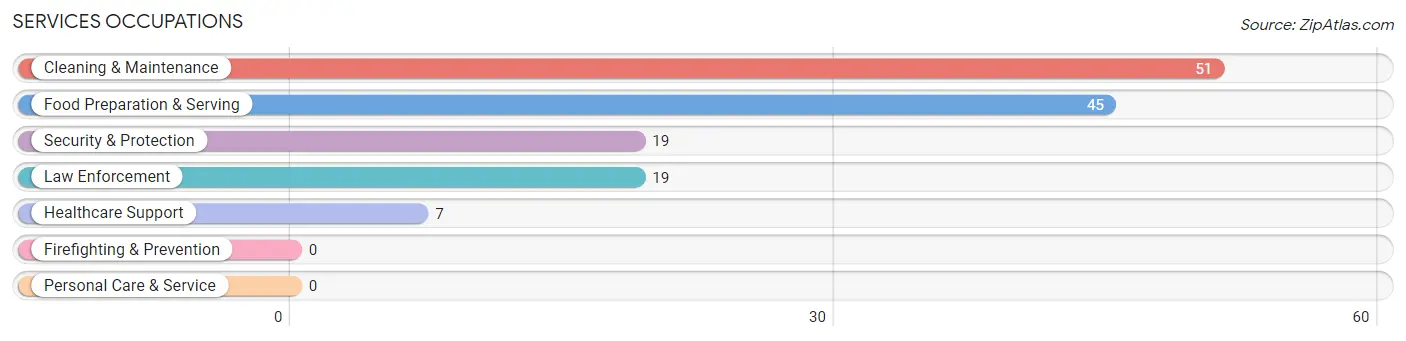
Services Occupations
The most common Services occupations in Liberty are Cleaning & Maintenance (51 | 7.1%), Food Preparation & Serving (45 | 6.3%), Security & Protection (19 | 2.6%), Law Enforcement (19 | 2.6%), and Healthcare Support (7 | 1.0%).
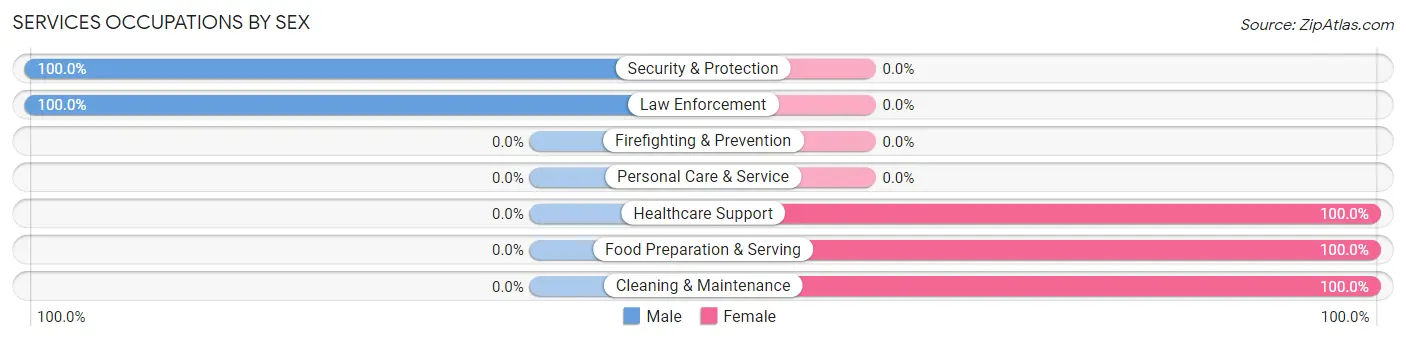
Services Occupations by Sex
Within the Services occupations in Liberty, the most male-oriented occupations are Security & Protection (100.0%), and Law Enforcement (100.0%), while the most female-oriented occupations are Healthcare Support (100.0%), Food Preparation & Serving (100.0%), and Cleaning & Maintenance (100.0%).
| Occupation | Male | Female |
| Healthcare Support | 0 (0.0%) | 7 (100.0%) |
| Security & Protection | 19 (100.0%) | 0 (0.0%) |
| Firefighting & Prevention | 0 (0.0%) | 0 (0.0%) |
| Law Enforcement | 19 (100.0%) | 0 (0.0%) |
| Food Preparation & Serving | 0 (0.0%) | 45 (100.0%) |
| Cleaning & Maintenance | 0 (0.0%) | 51 (100.0%) |
| Personal Care & Service | 0 (0.0%) | 0 (0.0%) |
| Total (Category) | 19 (15.6%) | 103 (84.4%) |
| Total (Overall) | 370 (51.6%) | 347 (48.4%) |
Sales and Office Occupations
The most common Sales and Office occupations in Liberty are Office & Administration (97 | 13.5%), and Sales & Related (70 | 9.8%).
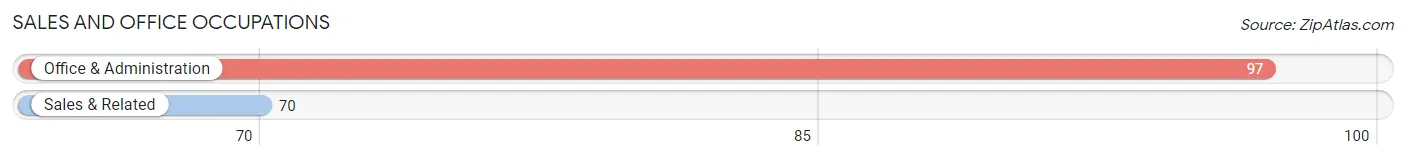
Sales and Office Occupations by Sex
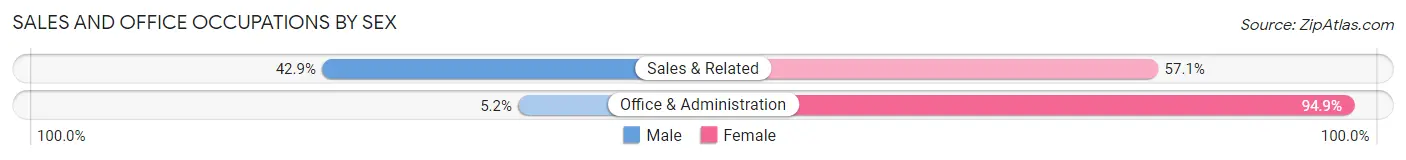
| Occupation | Male | Female |
| Sales & Related | 30 (42.9%) | 40 (57.1%) |
| Office & Administration | 5 (5.1%) | 92 (94.9%) |
| Total (Category) | 35 (21.0%) | 132 (79.0%) |
| Total (Overall) | 370 (51.6%) | 347 (48.4%) |
Natural Resources, Construction and Maintenance Occupations
The most common Natural Resources, Construction and Maintenance occupations in Liberty are Installation, Maintenance & Repair (46 | 6.4%), and Construction & Extraction (36 | 5.0%).
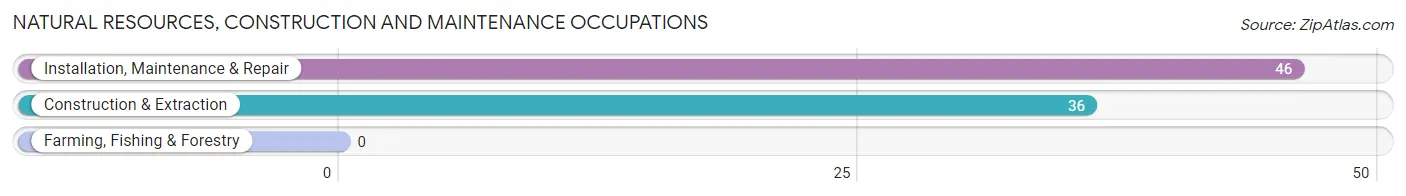
Natural Resources, Construction and Maintenance Occupations by Sex
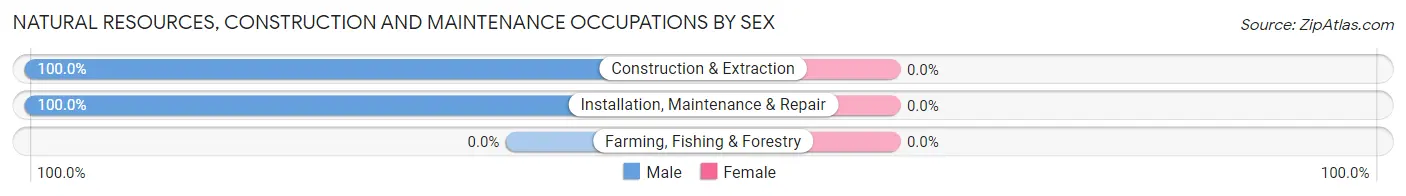
| Occupation | Male | Female |
| Farming, Fishing & Forestry | 0 (0.0%) | 0 (0.0%) |
| Construction & Extraction | 36 (100.0%) | 0 (0.0%) |
| Installation, Maintenance & Repair | 46 (100.0%) | 0 (0.0%) |
| Total (Category) | 82 (100.0%) | 0 (0.0%) |
| Total (Overall) | 370 (51.6%) | 347 (48.4%) |
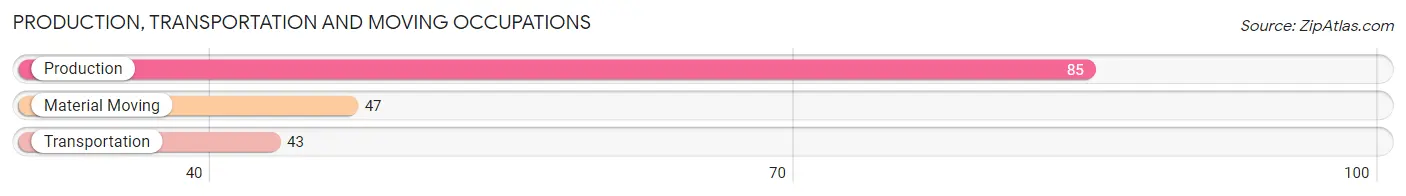
Production, Transportation and Moving Occupations
The most common Production, Transportation and Moving occupations in Liberty are Production (85 | 11.8%), Material Moving (47 | 6.6%), and Transportation (43 | 6.0%).
Production, Transportation and Moving Occupations by Sex
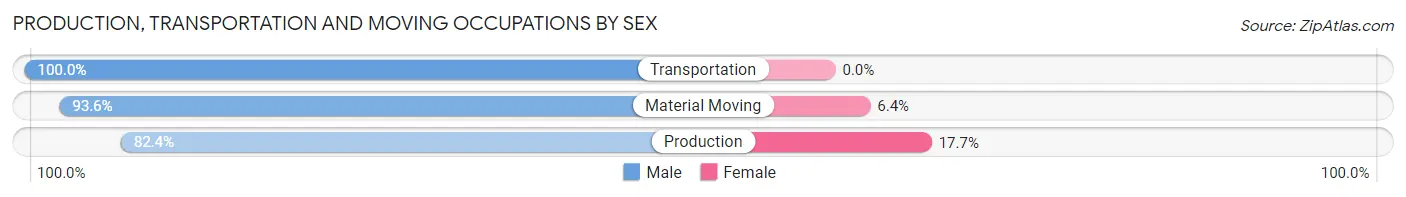
| Occupation | Male | Female |
| Production | 70 (82.4%) | 15 (17.6%) |
| Transportation | 43 (100.0%) | 0 (0.0%) |
| Material Moving | 44 (93.6%) | 3 (6.4%) |
| Total (Category) | 157 (89.7%) | 18 (10.3%) |
| Total (Overall) | 370 (51.6%) | 347 (48.4%) |
Employment Industries by Sex in Liberty
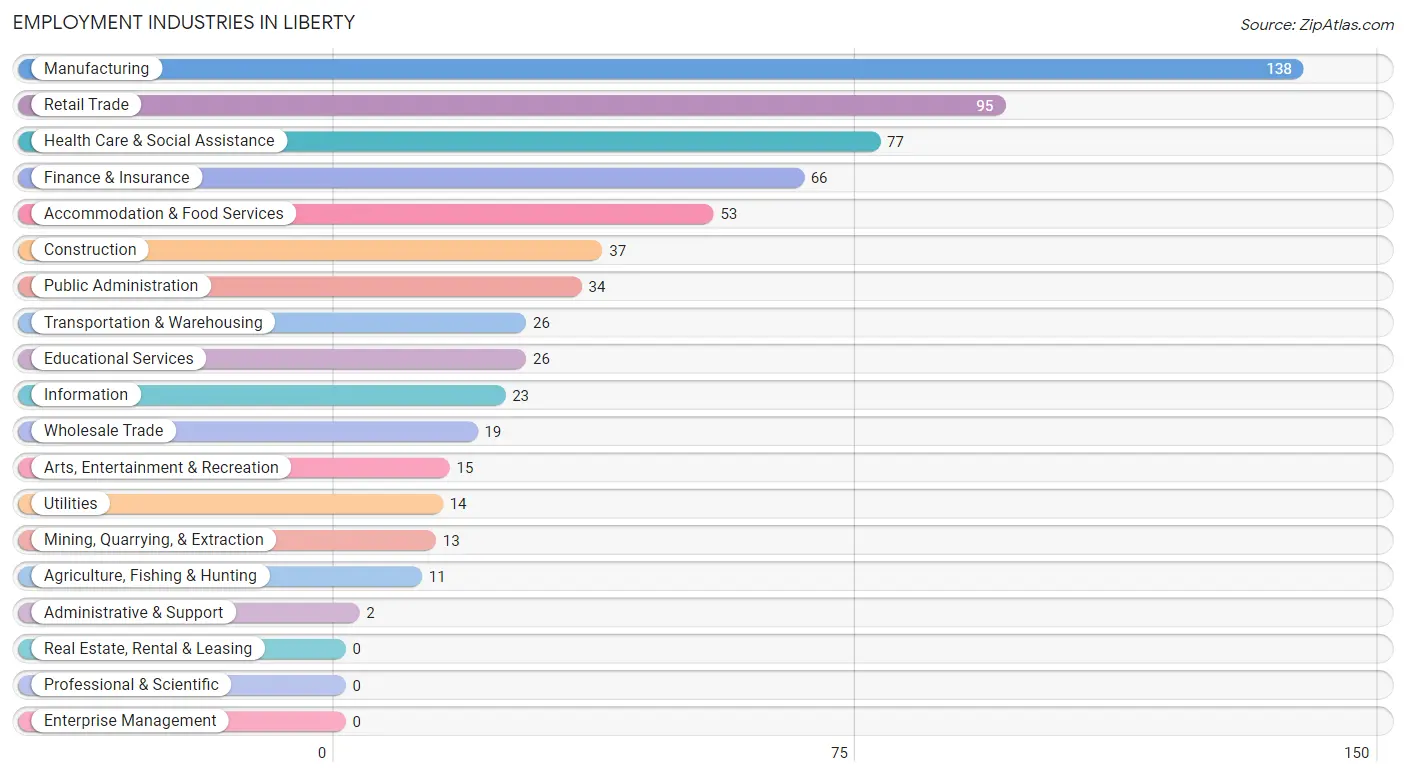
Employment Industries in Liberty
The major employment industries in Liberty include Manufacturing (138 | 19.3%), Retail Trade (95 | 13.3%), Health Care & Social Assistance (77 | 10.7%), Finance & Insurance (66 | 9.2%), and Accommodation & Food Services (53 | 7.4%).
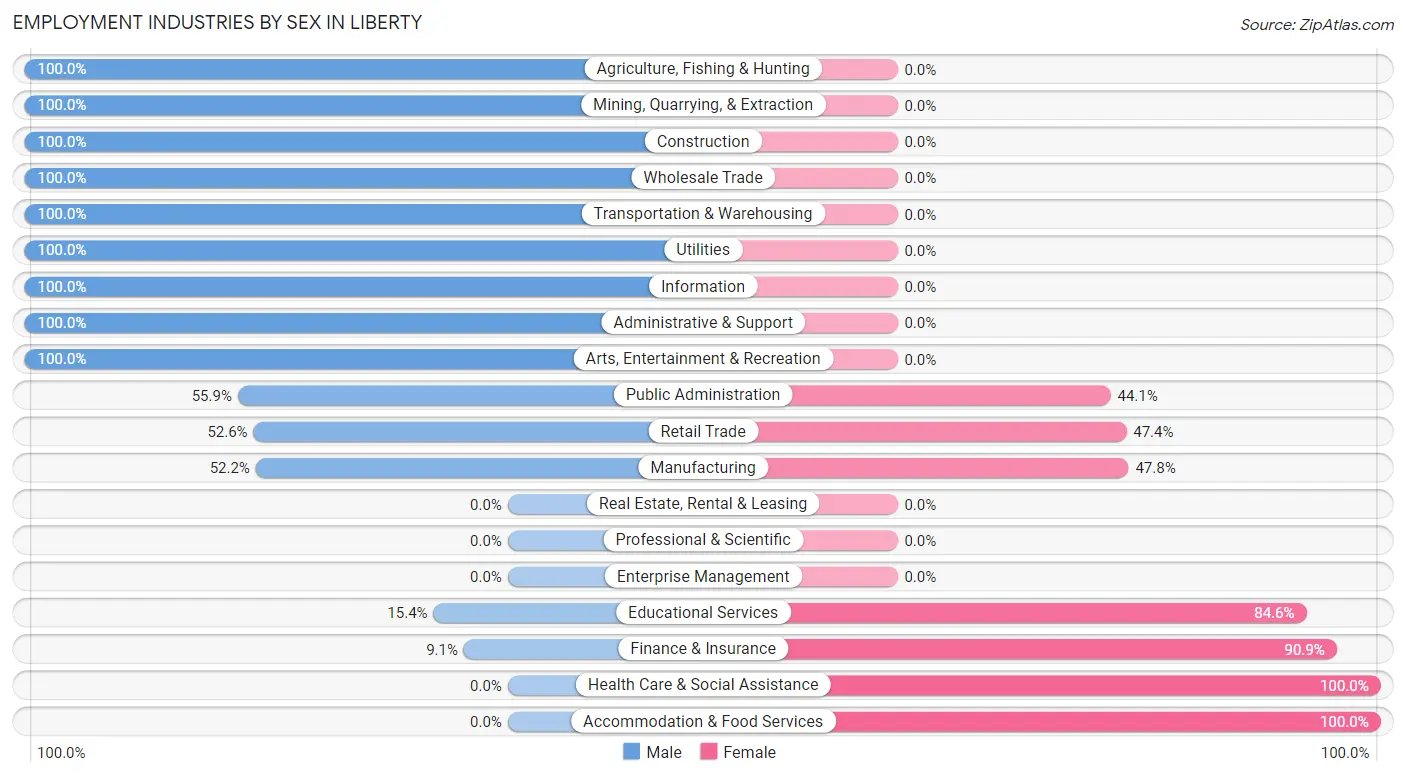
Employment Industries by Sex in Liberty
The Liberty industries that see more men than women are Agriculture, Fishing & Hunting (100.0%), Mining, Quarrying, & Extraction (100.0%), and Construction (100.0%), whereas the industries that tend to have a higher number of women are Health Care & Social Assistance (100.0%), Accommodation & Food Services (100.0%), and Finance & Insurance (90.9%).
| Industry | Male | Female |
| Agriculture, Fishing & Hunting | 11 (100.0%) | 0 (0.0%) |
| Mining, Quarrying, & Extraction | 13 (100.0%) | 0 (0.0%) |
| Construction | 37 (100.0%) | 0 (0.0%) |
| Manufacturing | 72 (52.2%) | 66 (47.8%) |
| Wholesale Trade | 19 (100.0%) | 0 (0.0%) |
| Retail Trade | 50 (52.6%) | 45 (47.4%) |
| Transportation & Warehousing | 26 (100.0%) | 0 (0.0%) |
| Utilities | 14 (100.0%) | 0 (0.0%) |
| Information | 23 (100.0%) | 0 (0.0%) |
| Finance & Insurance | 6 (9.1%) | 60 (90.9%) |
| Real Estate, Rental & Leasing | 0 (0.0%) | 0 (0.0%) |
| Professional & Scientific | 0 (0.0%) | 0 (0.0%) |
| Enterprise Management | 0 (0.0%) | 0 (0.0%) |
| Administrative & Support | 2 (100.0%) | 0 (0.0%) |
| Educational Services | 4 (15.4%) | 22 (84.6%) |
| Health Care & Social Assistance | 0 (0.0%) | 77 (100.0%) |
| Arts, Entertainment & Recreation | 15 (100.0%) | 0 (0.0%) |
| Accommodation & Food Services | 0 (0.0%) | 53 (100.0%) |
| Public Administration | 19 (55.9%) | 15 (44.1%) |
| Total | 370 (51.6%) | 347 (48.4%) |
Education in Liberty
School Enrollment in Liberty
The most common levels of schooling among the 261 students in Liberty are high school (106 | 40.6%), middle school (60 | 23.0%), and college / undergraduate (56 | 21.5%).
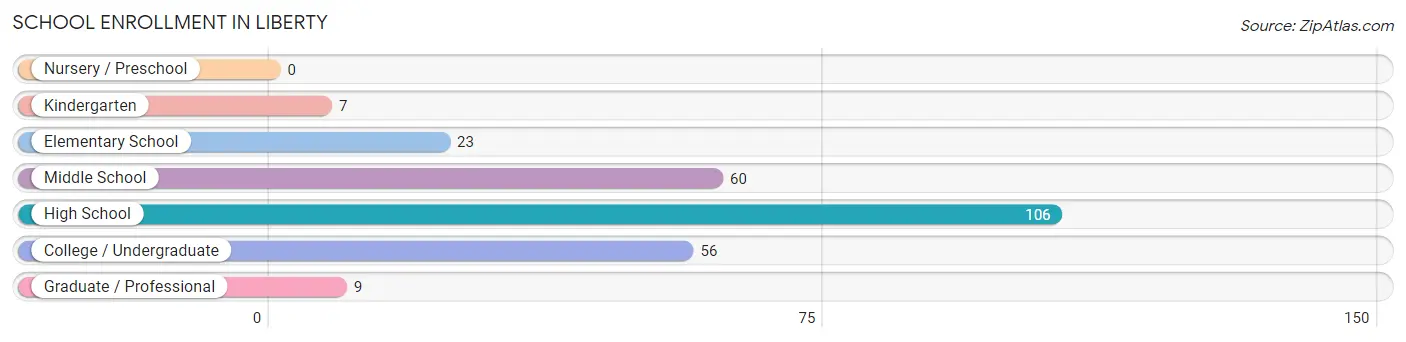
| School Level | # Students | % Students |
| Nursery / Preschool | 0 | 0.0% |
| Kindergarten | 7 | 2.7% |
| Elementary School | 23 | 8.8% |
| Middle School | 60 | 23.0% |
| High School | 106 | 40.6% |
| College / Undergraduate | 56 | 21.5% |
| Graduate / Professional | 9 | 3.5% |
| Total | 261 | 100.0% |
School Enrollment by Age by Funding Source in Liberty
Out of a total of 261 students who are enrolled in schools in Liberty, 43 (16.5%) attend a private institution, while the remaining 218 (83.5%) are enrolled in public schools. The age group of 20 to 24 year olds has the highest likelihood of being enrolled in private schools, with 25 (56.8% in the age bracket) enrolled. Conversely, the age group of 5 to 9 year old has the lowest likelihood of being enrolled in a private school, with 16 (100.0% in the age bracket) attending a public institution.
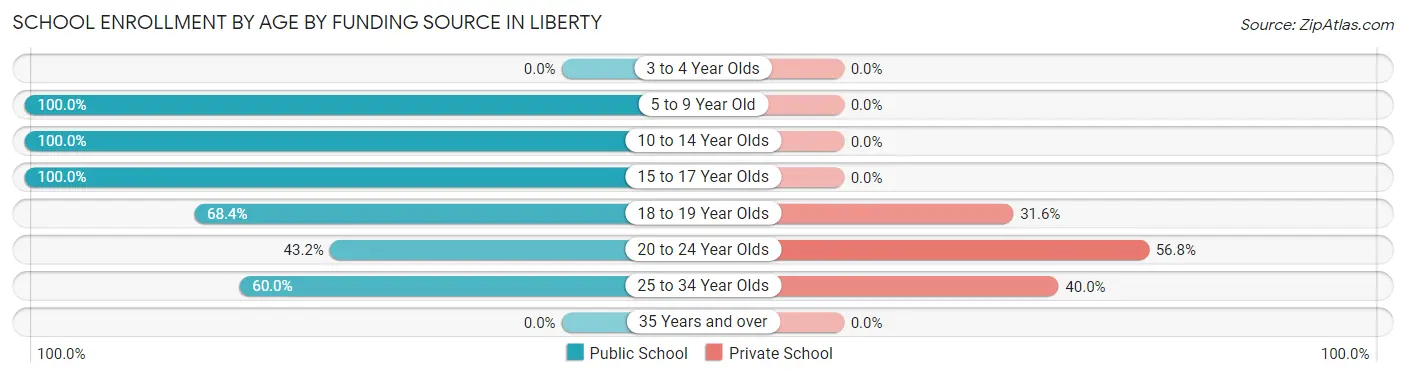
| Age Bracket | Public School | Private School |
| 3 to 4 Year Olds | 0 (0.0%) | 0 (0.0%) |
| 5 to 9 Year Old | 16 (100.0%) | 0 (0.0%) |
| 10 to 14 Year Olds | 94 (100.0%) | 0 (0.0%) |
| 15 to 17 Year Olds | 54 (100.0%) | 0 (0.0%) |
| 18 to 19 Year Olds | 26 (68.4%) | 12 (31.6%) |
| 20 to 24 Year Olds | 19 (43.2%) | 25 (56.8%) |
| 25 to 34 Year Olds | 9 (60.0%) | 6 (40.0%) |
| 35 Years and over | 0 (0.0%) | 0 (0.0%) |
| Total | 218 (83.5%) | 43 (16.5%) |
Educational Attainment by Field of Study in Liberty
Business (72 | 33.5%), science & technology (64 | 29.8%), education (44 | 20.5%), liberal arts & history (8 | 3.7%), and physical & health sciences (6 | 2.8%) are the most common fields of study among 215 individuals in Liberty who have obtained a bachelor's degree or higher.
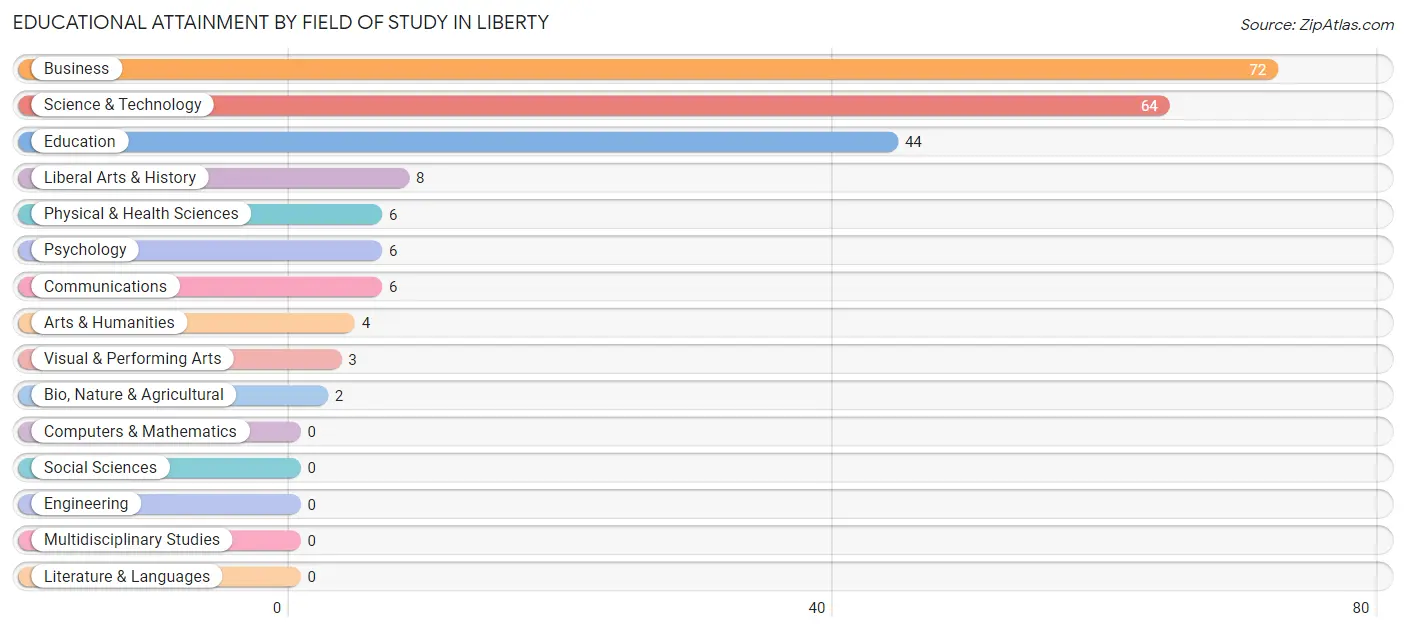
| Field of Study | # Graduates | % Graduates |
| Computers & Mathematics | 0 | 0.0% |
| Bio, Nature & Agricultural | 2 | 0.9% |
| Physical & Health Sciences | 6 | 2.8% |
| Psychology | 6 | 2.8% |
| Social Sciences | 0 | 0.0% |
| Engineering | 0 | 0.0% |
| Multidisciplinary Studies | 0 | 0.0% |
| Science & Technology | 64 | 29.8% |
| Business | 72 | 33.5% |
| Education | 44 | 20.5% |
| Literature & Languages | 0 | 0.0% |
| Liberal Arts & History | 8 | 3.7% |
| Visual & Performing Arts | 3 | 1.4% |
| Communications | 6 | 2.8% |
| Arts & Humanities | 4 | 1.9% |
| Total | 215 | 100.0% |
Transportation & Commute in Liberty
Vehicle Availability by Sex in Liberty
The most prevalent vehicle ownership categories in Liberty are males with 2 vehicles (197, accounting for 53.2%) and females with 2 vehicles (143, making up 56.9%).
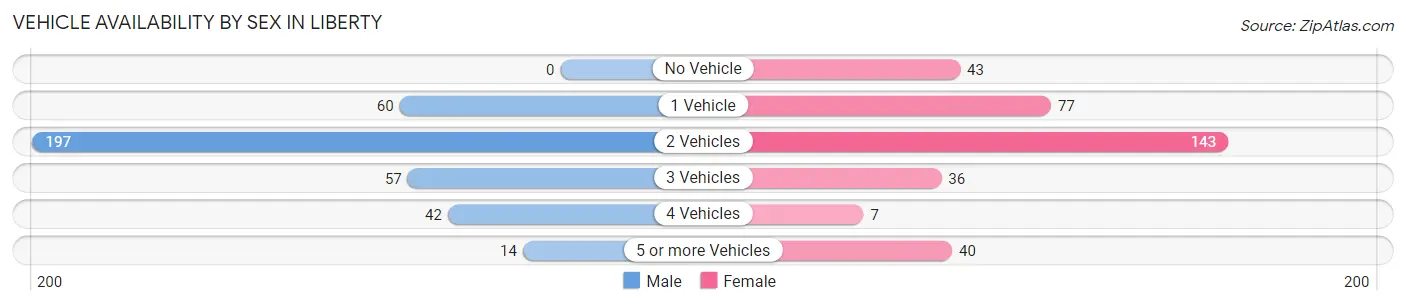
| Vehicles Available | Male | Female |
| No Vehicle | 0 (0.0%) | 43 (12.4%) |
| 1 Vehicle | 60 (16.2%) | 77 (22.3%) |
| 2 Vehicles | 197 (53.2%) | 143 (41.3%) |
| 3 Vehicles | 57 (15.4%) | 36 (10.4%) |
| 4 Vehicles | 42 (11.4%) | 7 (2.0%) |
| 5 or more Vehicles | 14 (3.8%) | 40 (11.6%) |
| Total | 370 (100.0%) | 346 (100.0%) |
Commute Time in Liberty
The most frequently occuring commute durations in Liberty are 5 to 9 minutes (249 commuters, 35.3%), 35 to 39 minutes (81 commuters, 11.5%), and 10 to 14 minutes (67 commuters, 9.5%).
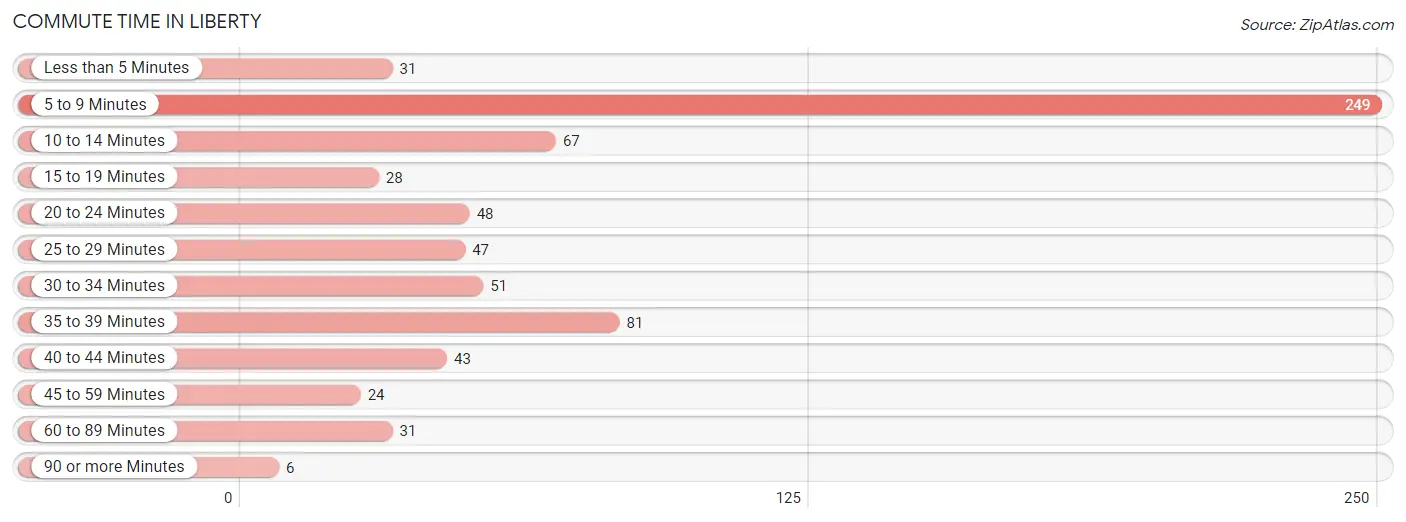
| Commute Time | # Commuters | % Commuters |
| Less than 5 Minutes | 31 | 4.4% |
| 5 to 9 Minutes | 249 | 35.3% |
| 10 to 14 Minutes | 67 | 9.5% |
| 15 to 19 Minutes | 28 | 4.0% |
| 20 to 24 Minutes | 48 | 6.8% |
| 25 to 29 Minutes | 47 | 6.7% |
| 30 to 34 Minutes | 51 | 7.2% |
| 35 to 39 Minutes | 81 | 11.5% |
| 40 to 44 Minutes | 43 | 6.1% |
| 45 to 59 Minutes | 24 | 3.4% |
| 60 to 89 Minutes | 31 | 4.4% |
| 90 or more Minutes | 6 | 0.9% |
Commute Time by Sex in Liberty
The most common commute times in Liberty are 5 to 9 minutes (100 commuters, 27.8%) for males and 5 to 9 minutes (149 commuters, 43.1%) for females.
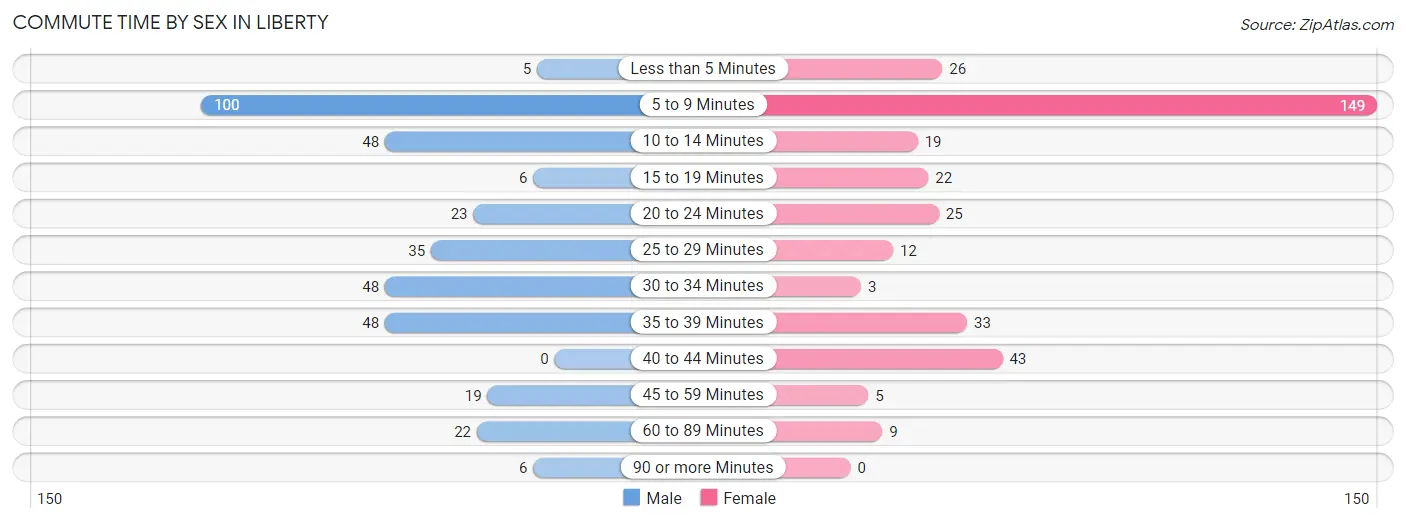
| Commute Time | Male | Female |
| Less than 5 Minutes | 5 (1.4%) | 26 (7.5%) |
| 5 to 9 Minutes | 100 (27.8%) | 149 (43.1%) |
| 10 to 14 Minutes | 48 (13.3%) | 19 (5.5%) |
| 15 to 19 Minutes | 6 (1.7%) | 22 (6.4%) |
| 20 to 24 Minutes | 23 (6.4%) | 25 (7.2%) |
| 25 to 29 Minutes | 35 (9.7%) | 12 (3.5%) |
| 30 to 34 Minutes | 48 (13.3%) | 3 (0.9%) |
| 35 to 39 Minutes | 48 (13.3%) | 33 (9.5%) |
| 40 to 44 Minutes | 0 (0.0%) | 43 (12.4%) |
| 45 to 59 Minutes | 19 (5.3%) | 5 (1.5%) |
| 60 to 89 Minutes | 22 (6.1%) | 9 (2.6%) |
| 90 or more Minutes | 6 (1.7%) | 0 (0.0%) |
Time of Departure to Work by Sex in Liberty
The most frequent times of departure to work in Liberty are 7:30 AM to 7:59 AM (95, 26.4%) for males and 5:30 AM to 5:59 AM (58, 16.8%) for females.
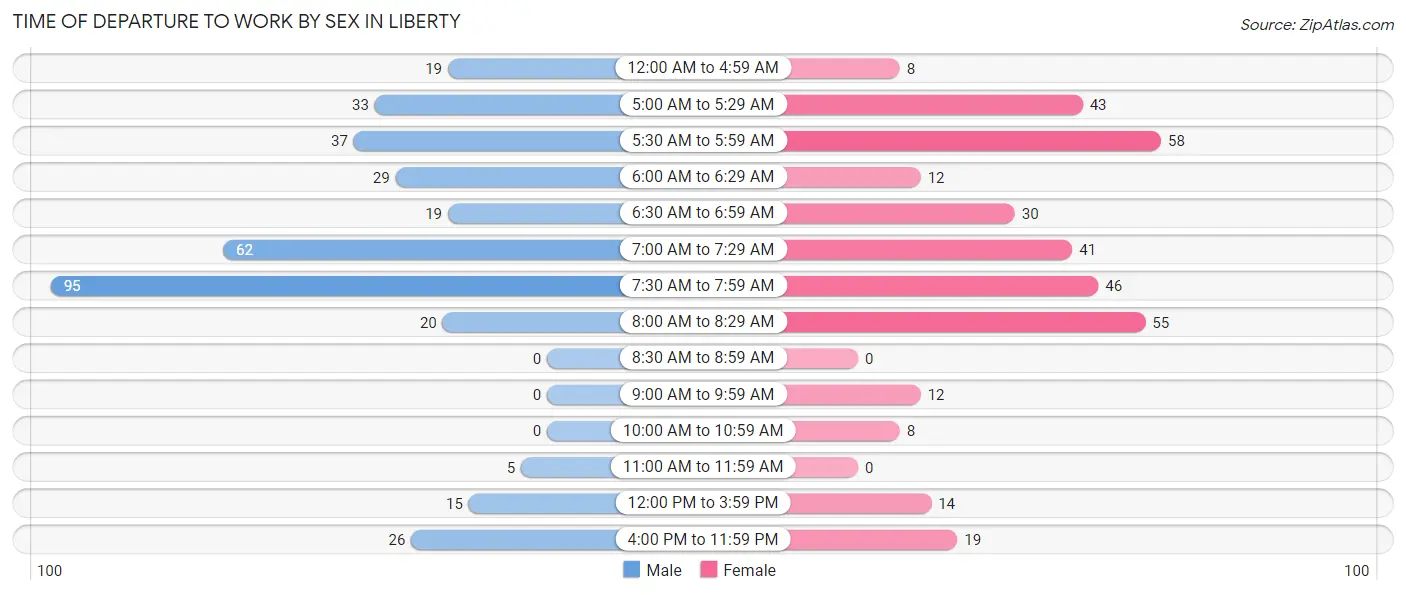
| Time of Departure | Male | Female |
| 12:00 AM to 4:59 AM | 19 (5.3%) | 8 (2.3%) |
| 5:00 AM to 5:29 AM | 33 (9.2%) | 43 (12.4%) |
| 5:30 AM to 5:59 AM | 37 (10.3%) | 58 (16.8%) |
| 6:00 AM to 6:29 AM | 29 (8.1%) | 12 (3.5%) |
| 6:30 AM to 6:59 AM | 19 (5.3%) | 30 (8.7%) |
| 7:00 AM to 7:29 AM | 62 (17.2%) | 41 (11.8%) |
| 7:30 AM to 7:59 AM | 95 (26.4%) | 46 (13.3%) |
| 8:00 AM to 8:29 AM | 20 (5.6%) | 55 (15.9%) |
| 8:30 AM to 8:59 AM | 0 (0.0%) | 0 (0.0%) |
| 9:00 AM to 9:59 AM | 0 (0.0%) | 12 (3.5%) |
| 10:00 AM to 10:59 AM | 0 (0.0%) | 8 (2.3%) |
| 11:00 AM to 11:59 AM | 5 (1.4%) | 0 (0.0%) |
| 12:00 PM to 3:59 PM | 15 (4.2%) | 14 (4.1%) |
| 4:00 PM to 11:59 PM | 26 (7.2%) | 19 (5.5%) |
| Total | 360 (100.0%) | 346 (100.0%) |
Housing Occupancy in Liberty
Occupancy by Ownership in Liberty
Of the total 887 dwellings in Liberty, owner-occupied units account for 374 (42.2%), while renter-occupied units make up 513 (57.8%).
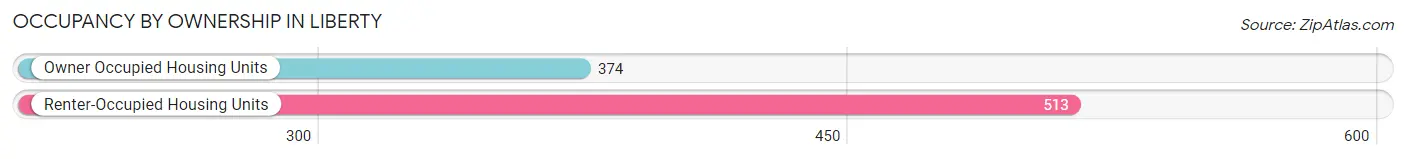
| Occupancy | # Housing Units | % Housing Units |
| Owner Occupied Housing Units | 374 | 42.2% |
| Renter-Occupied Housing Units | 513 | 57.8% |
| Total Occupied Housing Units | 887 | 100.0% |
Occupancy by Household Size in Liberty
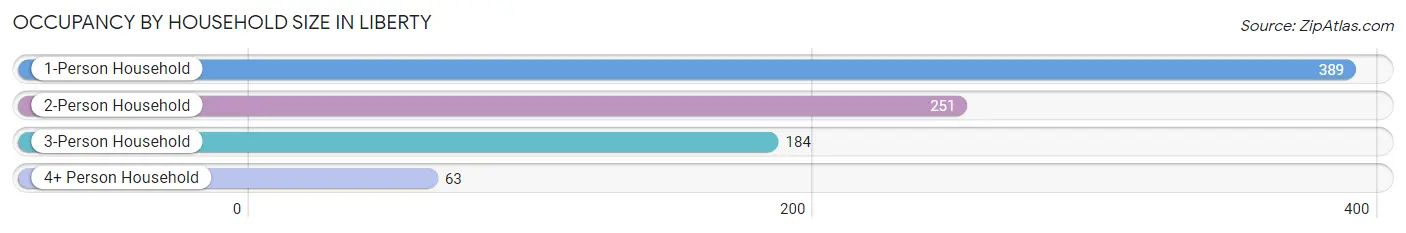
| Household Size | # Housing Units | % Housing Units |
| 1-Person Household | 389 | 43.9% |
| 2-Person Household | 251 | 28.3% |
| 3-Person Household | 184 | 20.7% |
| 4+ Person Household | 63 | 7.1% |
| Total Housing Units | 887 | 100.0% |
Occupancy by Ownership by Household Size in Liberty
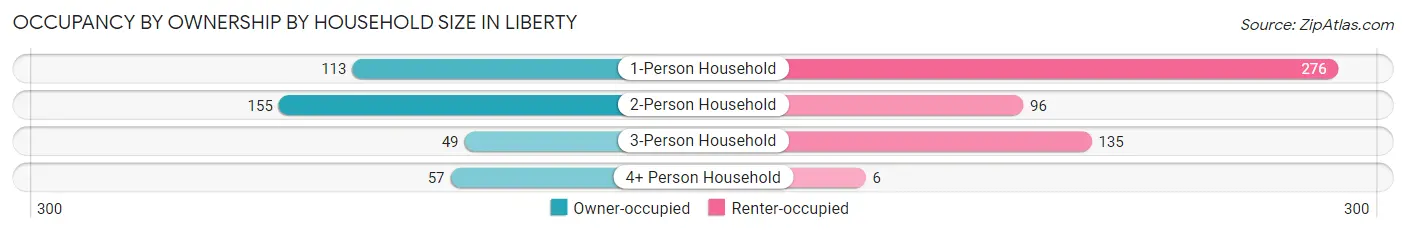
| Household Size | Owner-occupied | Renter-occupied |
| 1-Person Household | 113 (29.0%) | 276 (71.0%) |
| 2-Person Household | 155 (61.8%) | 96 (38.3%) |
| 3-Person Household | 49 (26.6%) | 135 (73.4%) |
| 4+ Person Household | 57 (90.5%) | 6 (9.5%) |
| Total Housing Units | 374 (42.2%) | 513 (57.8%) |
Occupancy by Educational Attainment in Liberty
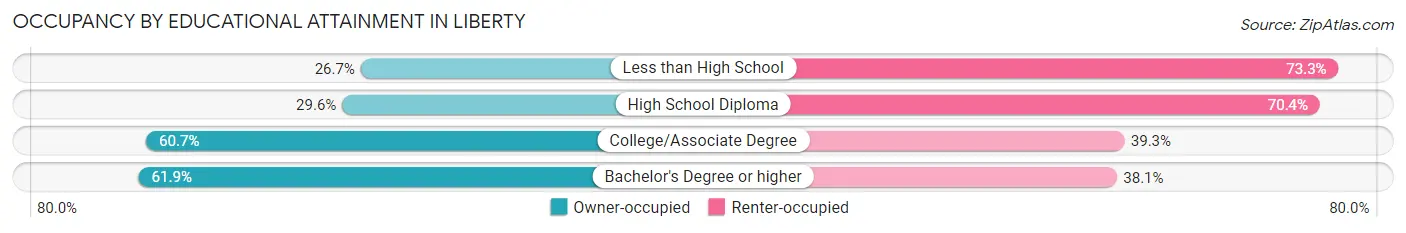
| Household Size | Owner-occupied | Renter-occupied |
| Less than High School | 71 (26.7%) | 195 (73.3%) |
| High School Diploma | 72 (29.6%) | 171 (70.4%) |
| College/Associate Degree | 153 (60.7%) | 99 (39.3%) |
| Bachelor's Degree or higher | 78 (61.9%) | 48 (38.1%) |
Occupancy by Age of Householder in Liberty
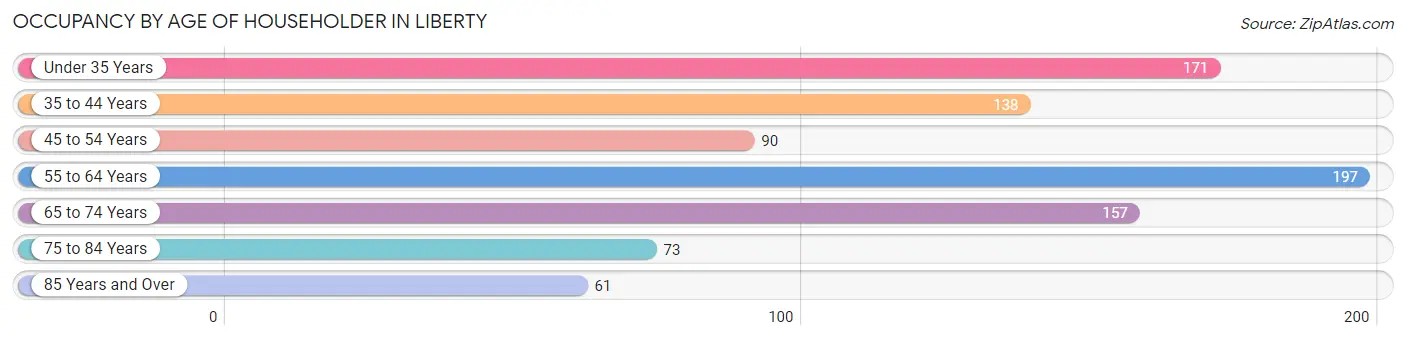
| Age Bracket | # Households | % Households |
| Under 35 Years | 171 | 19.3% |
| 35 to 44 Years | 138 | 15.6% |
| 45 to 54 Years | 90 | 10.2% |
| 55 to 64 Years | 197 | 22.2% |
| 65 to 74 Years | 157 | 17.7% |
| 75 to 84 Years | 73 | 8.2% |
| 85 Years and Over | 61 | 6.9% |
| Total | 887 | 100.0% |
Housing Finances in Liberty
Median Income by Occupancy in Liberty
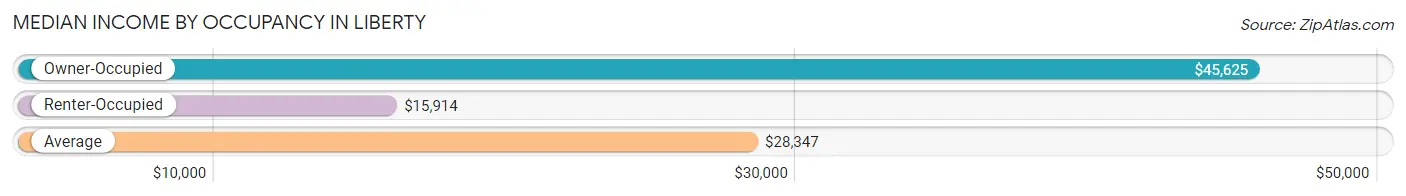
| Occupancy Type | # Households | Median Income |
| Owner-Occupied | 374 (42.2%) | $45,625 |
| Renter-Occupied | 513 (57.8%) | $15,914 |
| Average | 887 (100.0%) | $28,347 |
Occupancy by Householder Income Bracket in Liberty
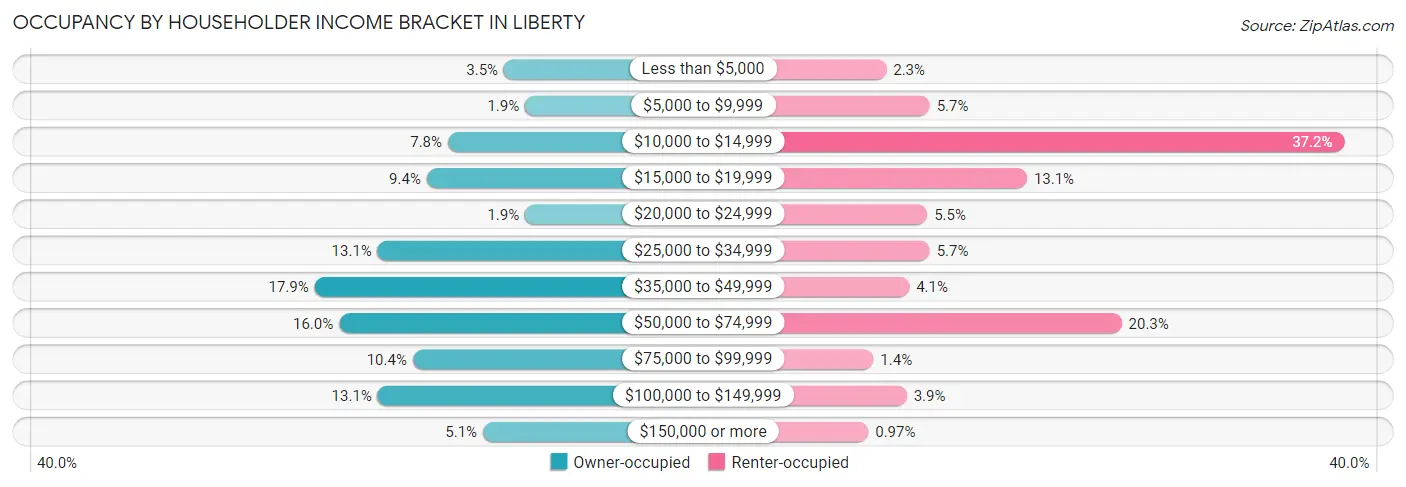
| Income Bracket | Owner-occupied | Renter-occupied |
| Less than $5,000 | 13 (3.5%) | 12 (2.3%) |
| $5,000 to $9,999 | 7 (1.9%) | 29 (5.7%) |
| $10,000 to $14,999 | 29 (7.7%) | 191 (37.2%) |
| $15,000 to $19,999 | 35 (9.4%) | 67 (13.1%) |
| $20,000 to $24,999 | 7 (1.9%) | 28 (5.5%) |
| $25,000 to $34,999 | 49 (13.1%) | 29 (5.7%) |
| $35,000 to $49,999 | 67 (17.9%) | 21 (4.1%) |
| $50,000 to $74,999 | 60 (16.0%) | 104 (20.3%) |
| $75,000 to $99,999 | 39 (10.4%) | 7 (1.4%) |
| $100,000 to $149,999 | 49 (13.1%) | 20 (3.9%) |
| $150,000 or more | 19 (5.1%) | 5 (1.0%) |
| Total | 374 (100.0%) | 513 (100.0%) |
Monthly Housing Cost Tiers in Liberty
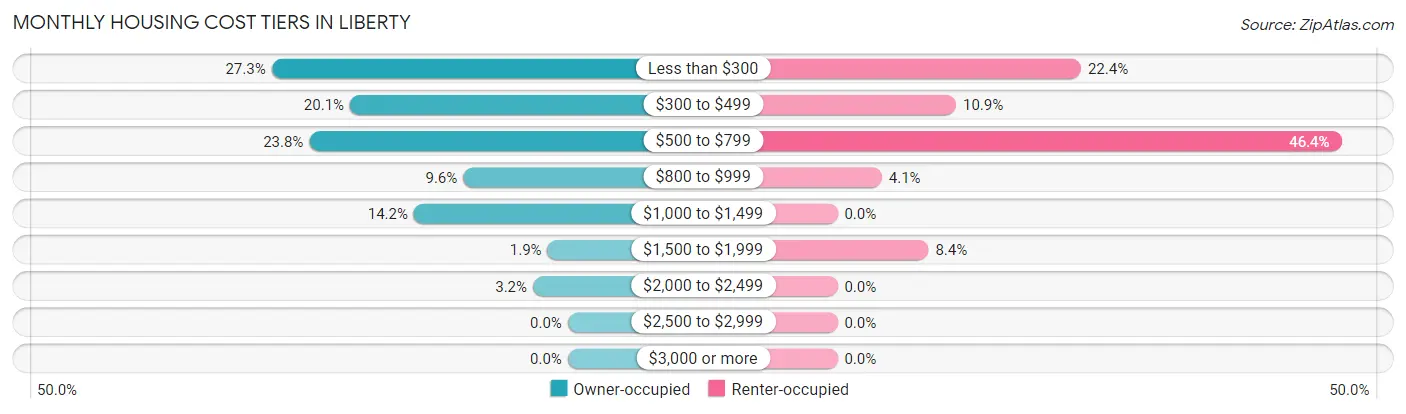
| Monthly Cost | Owner-occupied | Renter-occupied |
| Less than $300 | 102 (27.3%) | 115 (22.4%) |
| $300 to $499 | 75 (20.1%) | 56 (10.9%) |
| $500 to $799 | 89 (23.8%) | 238 (46.4%) |
| $800 to $999 | 36 (9.6%) | 21 (4.1%) |
| $1,000 to $1,499 | 53 (14.2%) | 0 (0.0%) |
| $1,500 to $1,999 | 7 (1.9%) | 43 (8.4%) |
| $2,000 to $2,499 | 12 (3.2%) | 0 (0.0%) |
| $2,500 to $2,999 | 0 (0.0%) | 0 (0.0%) |
| $3,000 or more | 0 (0.0%) | 0 (0.0%) |
| Total | 374 (100.0%) | 513 (100.0%) |
Physical Housing Characteristics in Liberty
Housing Structures in Liberty
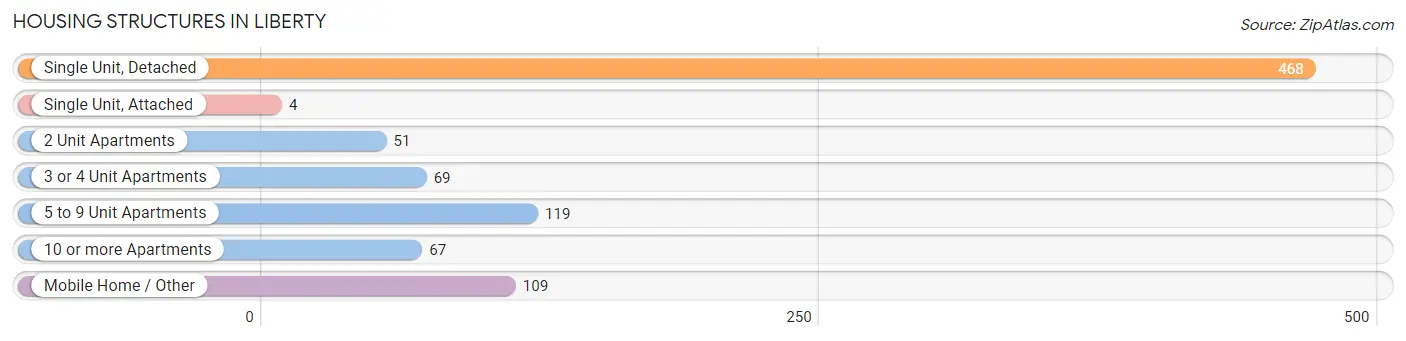
| Structure Type | # Housing Units | % Housing Units |
| Single Unit, Detached | 468 | 52.8% |
| Single Unit, Attached | 4 | 0.4% |
| 2 Unit Apartments | 51 | 5.8% |
| 3 or 4 Unit Apartments | 69 | 7.8% |
| 5 to 9 Unit Apartments | 119 | 13.4% |
| 10 or more Apartments | 67 | 7.5% |
| Mobile Home / Other | 109 | 12.3% |
| Total | 887 | 100.0% |
Housing Structures by Occupancy in Liberty
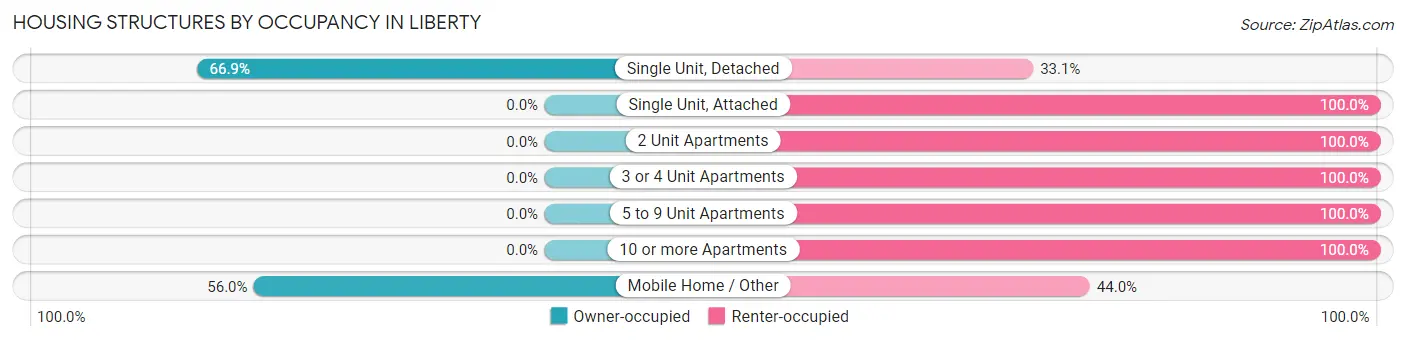
| Structure Type | Owner-occupied | Renter-occupied |
| Single Unit, Detached | 313 (66.9%) | 155 (33.1%) |
| Single Unit, Attached | 0 (0.0%) | 4 (100.0%) |
| 2 Unit Apartments | 0 (0.0%) | 51 (100.0%) |
| 3 or 4 Unit Apartments | 0 (0.0%) | 69 (100.0%) |
| 5 to 9 Unit Apartments | 0 (0.0%) | 119 (100.0%) |
| 10 or more Apartments | 0 (0.0%) | 67 (100.0%) |
| Mobile Home / Other | 61 (56.0%) | 48 (44.0%) |
| Total | 374 (42.2%) | 513 (57.8%) |
Housing Structures by Number of Rooms in Liberty
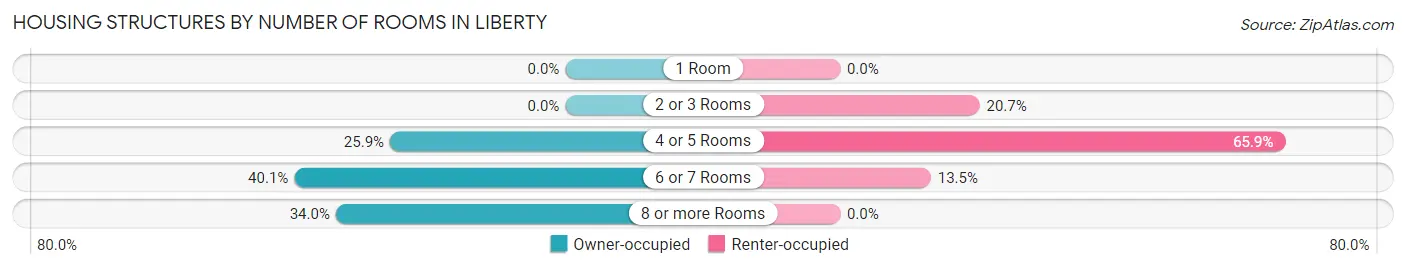
| Number of Rooms | Owner-occupied | Renter-occupied |
| 1 Room | 0 (0.0%) | 0 (0.0%) |
| 2 or 3 Rooms | 0 (0.0%) | 106 (20.7%) |
| 4 or 5 Rooms | 97 (25.9%) | 338 (65.9%) |
| 6 or 7 Rooms | 150 (40.1%) | 69 (13.5%) |
| 8 or more Rooms | 127 (34.0%) | 0 (0.0%) |
| Total | 374 (100.0%) | 513 (100.0%) |
Housing Structure by Heating Type in Liberty
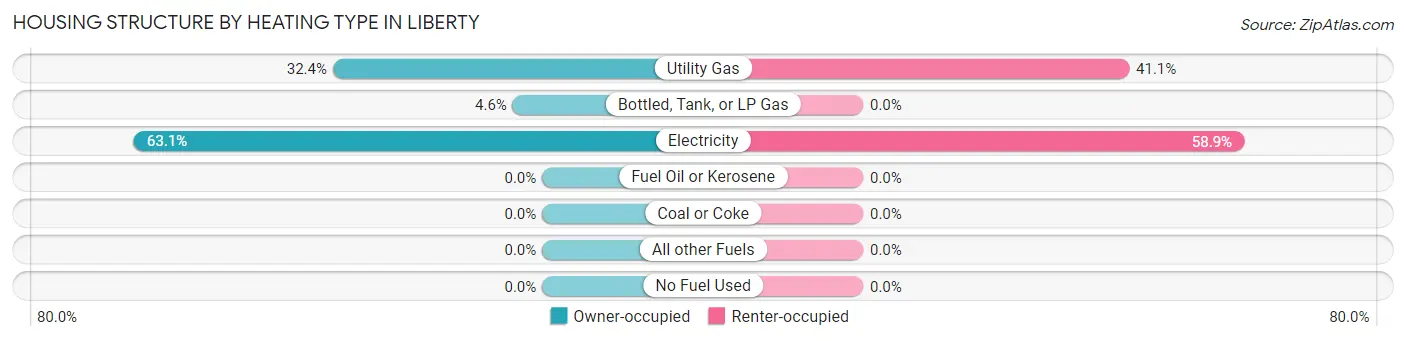
| Heating Type | Owner-occupied | Renter-occupied |
| Utility Gas | 121 (32.4%) | 211 (41.1%) |
| Bottled, Tank, or LP Gas | 17 (4.5%) | 0 (0.0%) |
| Electricity | 236 (63.1%) | 302 (58.9%) |
| Fuel Oil or Kerosene | 0 (0.0%) | 0 (0.0%) |
| Coal or Coke | 0 (0.0%) | 0 (0.0%) |
| All other Fuels | 0 (0.0%) | 0 (0.0%) |
| No Fuel Used | 0 (0.0%) | 0 (0.0%) |
| Total | 374 (100.0%) | 513 (100.0%) |
Household Vehicle Usage in Liberty
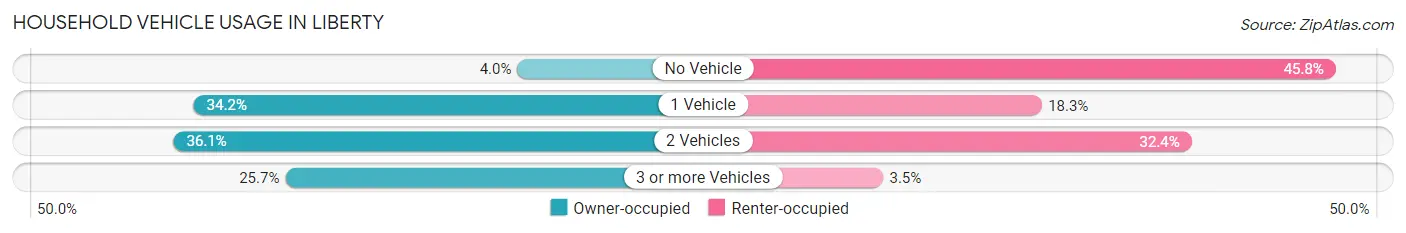
| Vehicles per Household | Owner-occupied | Renter-occupied |
| No Vehicle | 15 (4.0%) | 235 (45.8%) |
| 1 Vehicle | 128 (34.2%) | 94 (18.3%) |
| 2 Vehicles | 135 (36.1%) | 166 (32.4%) |
| 3 or more Vehicles | 96 (25.7%) | 18 (3.5%) |
| Total | 374 (100.0%) | 513 (100.0%) |
Real Estate & Mortgages in Liberty
Real Estate and Mortgage Overview in Liberty
| Characteristic | Without Mortgage | With Mortgage |
| Housing Units | 227 | 147 |
| Median Property Value | $102,900 | $113,900 |
| Median Household Income | $36,458 | $7 |
| Monthly Housing Costs | $321 | $0 |
| Real Estate Taxes | $438 | $7 |
Property Value by Mortgage Status in Liberty
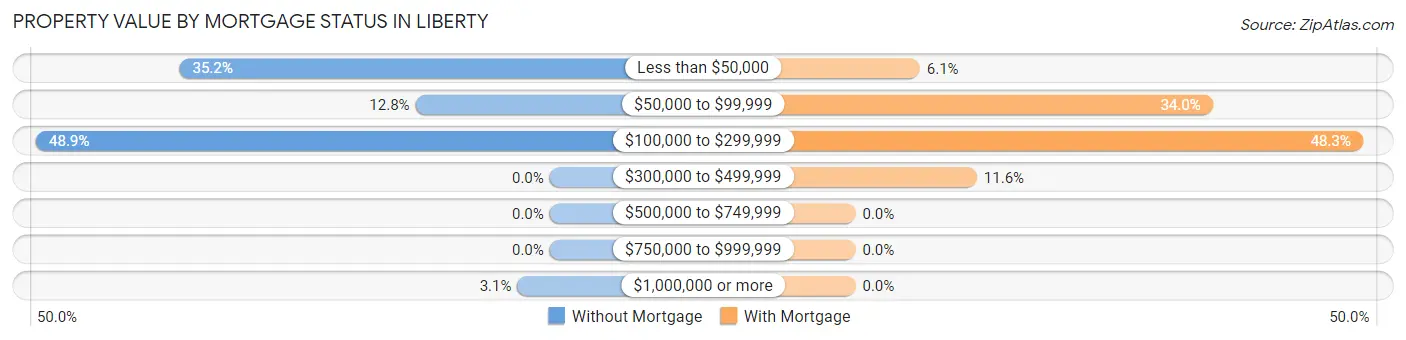
| Property Value | Without Mortgage | With Mortgage |
| Less than $50,000 | 80 (35.2%) | 9 (6.1%) |
| $50,000 to $99,999 | 29 (12.8%) | 50 (34.0%) |
| $100,000 to $299,999 | 111 (48.9%) | 71 (48.3%) |
| $300,000 to $499,999 | 0 (0.0%) | 17 (11.6%) |
| $500,000 to $749,999 | 0 (0.0%) | 0 (0.0%) |
| $750,000 to $999,999 | 0 (0.0%) | 0 (0.0%) |
| $1,000,000 or more | 7 (3.1%) | 0 (0.0%) |
| Total | 227 (100.0%) | 147 (100.0%) |
Household Income by Mortgage Status in Liberty
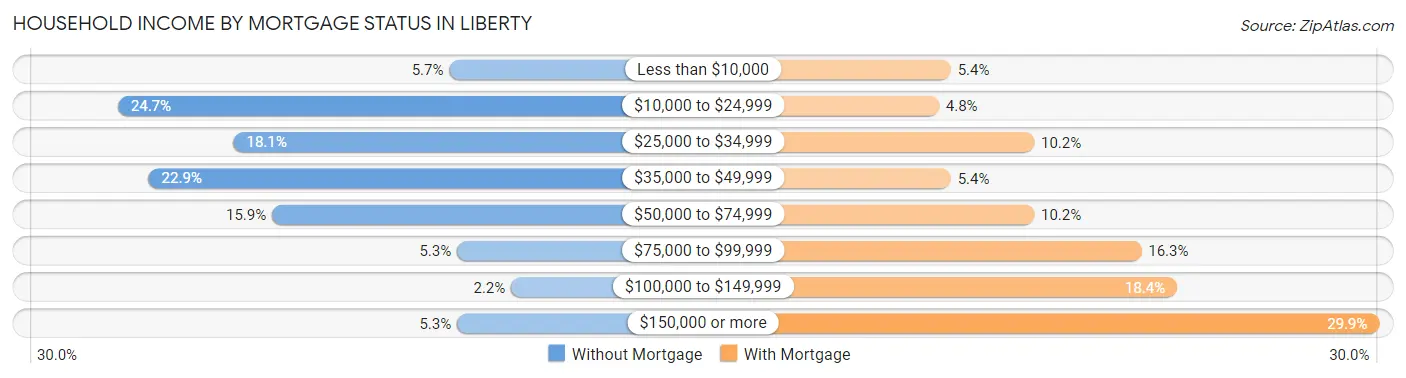
| Household Income | Without Mortgage | With Mortgage |
| Less than $10,000 | 13 (5.7%) | 8 (5.4%) |
| $10,000 to $24,999 | 56 (24.7%) | 7 (4.8%) |
| $25,000 to $34,999 | 41 (18.1%) | 15 (10.2%) |
| $35,000 to $49,999 | 52 (22.9%) | 8 (5.4%) |
| $50,000 to $74,999 | 36 (15.9%) | 15 (10.2%) |
| $75,000 to $99,999 | 12 (5.3%) | 24 (16.3%) |
| $100,000 to $149,999 | 5 (2.2%) | 27 (18.4%) |
| $150,000 or more | 12 (5.3%) | 44 (29.9%) |
| Total | 227 (100.0%) | 147 (100.0%) |
Property Value to Household Income Ratio in Liberty
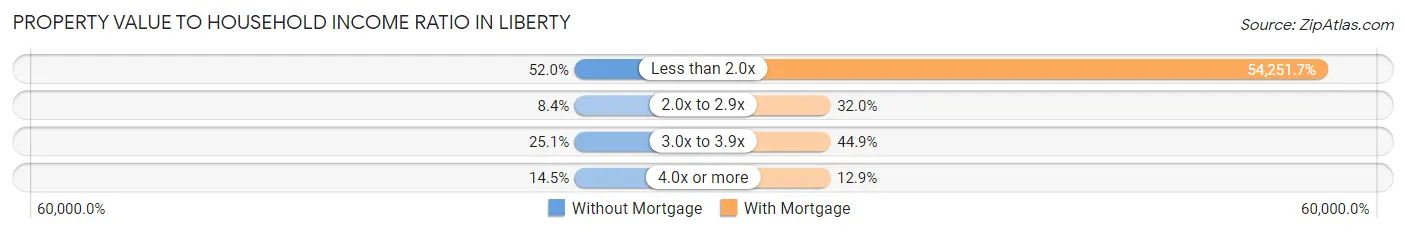
| Value-to-Income Ratio | Without Mortgage | With Mortgage |
| Less than 2.0x | 118 (52.0%) | 79,750 (54,251.7%) |
| 2.0x to 2.9x | 19 (8.4%) | 47 (32.0%) |
| 3.0x to 3.9x | 57 (25.1%) | 66 (44.9%) |
| 4.0x or more | 33 (14.5%) | 19 (12.9%) |
| Total | 227 (100.0%) | 147 (100.0%) |
Real Estate Taxes by Mortgage Status in Liberty
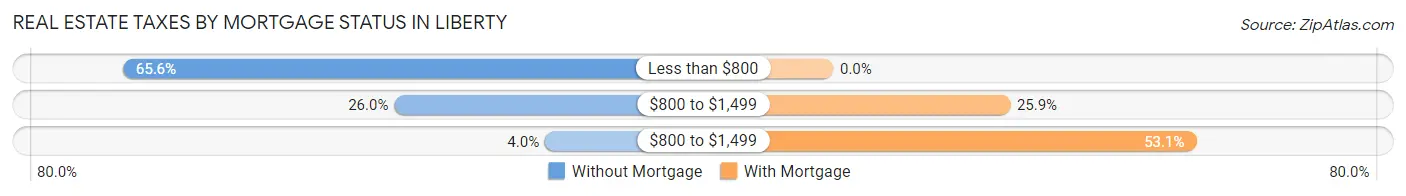
| Property Taxes | Without Mortgage | With Mortgage |
| Less than $800 | 149 (65.6%) | 0 (0.0%) |
| $800 to $1,499 | 59 (26.0%) | 38 (25.9%) |
| $800 to $1,499 | 9 (4.0%) | 78 (53.1%) |
| Total | 227 (100.0%) | 147 (100.0%) |
Health & Disability in Liberty
Health Insurance Coverage by Age in Liberty
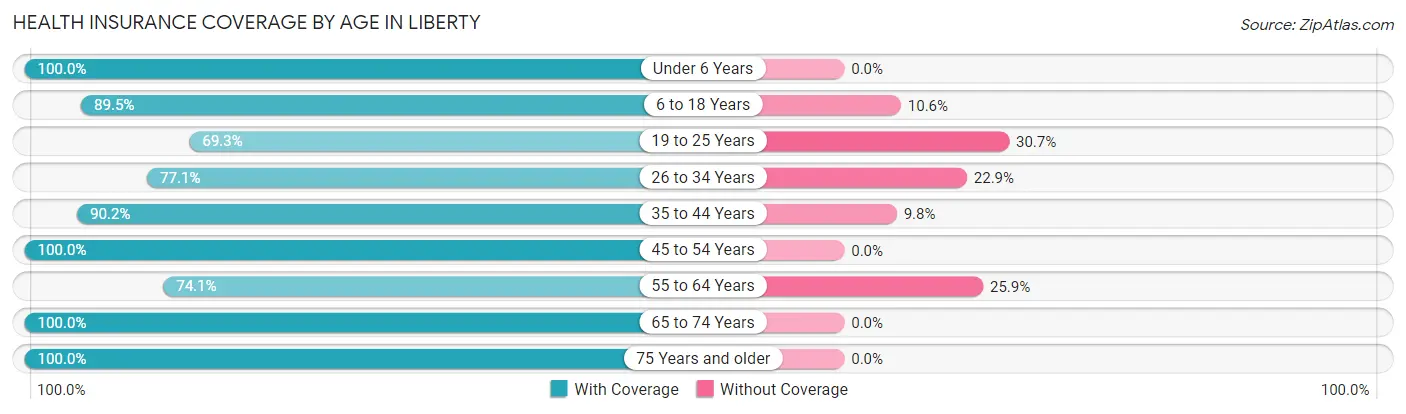
| Age Bracket | With Coverage | Without Coverage |
| Under 6 Years | 52 (100.0%) | 0 (0.0%) |
| 6 to 18 Years | 229 (89.4%) | 27 (10.5%) |
| 19 to 25 Years | 106 (69.3%) | 47 (30.7%) |
| 26 to 34 Years | 189 (77.1%) | 56 (22.9%) |
| 35 to 44 Years | 249 (90.2%) | 27 (9.8%) |
| 45 to 54 Years | 168 (100.0%) | 0 (0.0%) |
| 55 to 64 Years | 212 (74.1%) | 74 (25.9%) |
| 65 to 74 Years | 213 (100.0%) | 0 (0.0%) |
| 75 Years and older | 161 (100.0%) | 0 (0.0%) |
| Total | 1,579 (87.2%) | 231 (12.8%) |
Health Insurance Coverage by Citizenship Status in Liberty
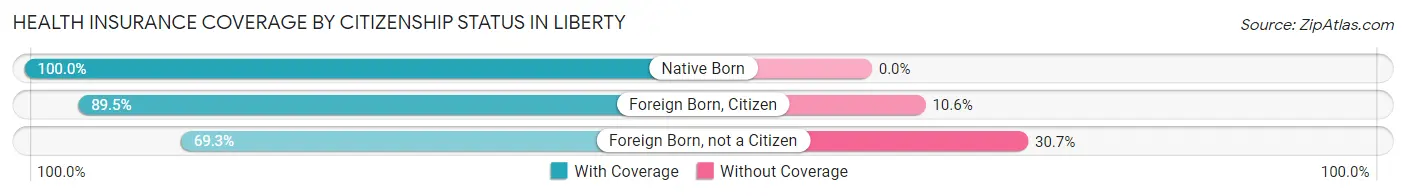
| Citizenship Status | With Coverage | Without Coverage |
| Native Born | 52 (100.0%) | 0 (0.0%) |
| Foreign Born, Citizen | 229 (89.4%) | 27 (10.5%) |
| Foreign Born, not a Citizen | 106 (69.3%) | 47 (30.7%) |
Health Insurance Coverage by Household Income in Liberty
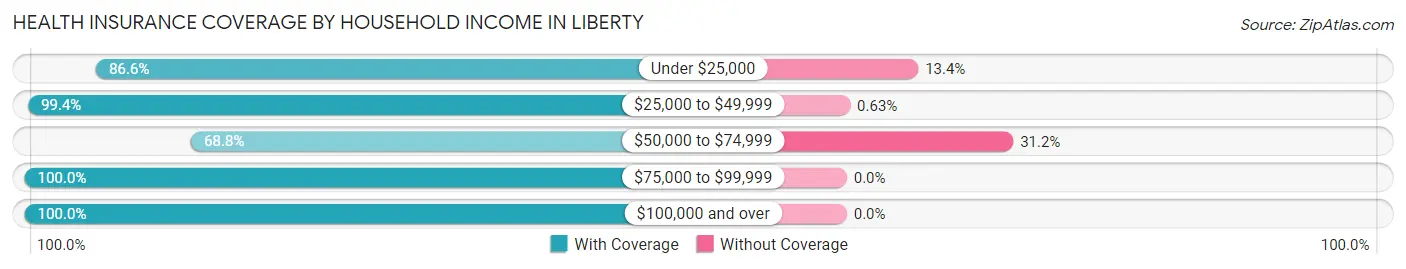
| Household Income | With Coverage | Without Coverage |
| Under $25,000 | 453 (86.6%) | 70 (13.4%) |
| $25,000 to $49,999 | 316 (99.4%) | 2 (0.6%) |
| $50,000 to $74,999 | 351 (68.8%) | 159 (31.2%) |
| $75,000 to $99,999 | 147 (100.0%) | 0 (0.0%) |
| $100,000 and over | 312 (100.0%) | 0 (0.0%) |
Public vs Private Health Insurance Coverage by Age in Liberty
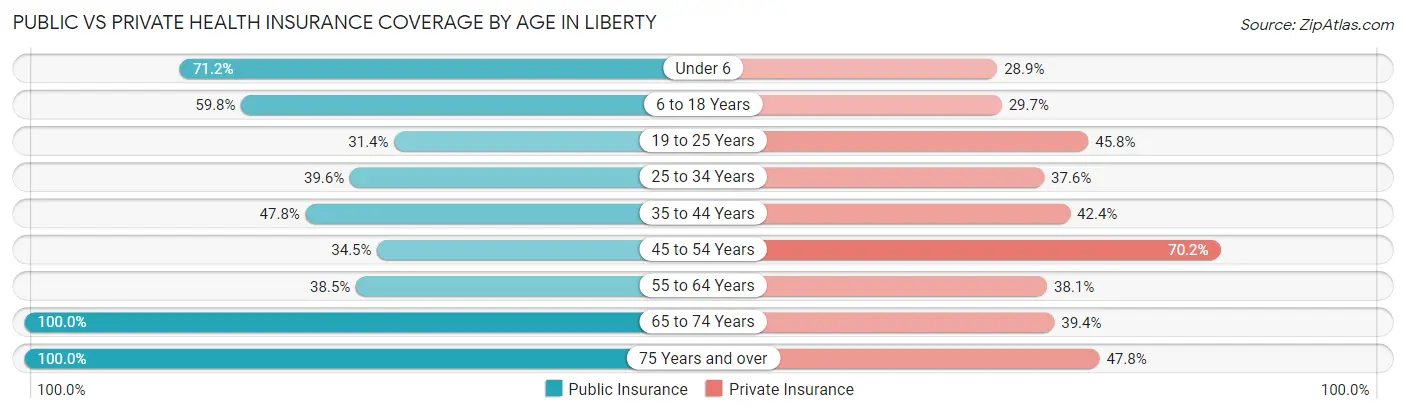
| Age Bracket | Public Insurance | Private Insurance |
| Under 6 | 37 (71.2%) | 15 (28.8%) |
| 6 to 18 Years | 153 (59.8%) | 76 (29.7%) |
| 19 to 25 Years | 48 (31.4%) | 70 (45.8%) |
| 25 to 34 Years | 97 (39.6%) | 92 (37.6%) |
| 35 to 44 Years | 132 (47.8%) | 117 (42.4%) |
| 45 to 54 Years | 58 (34.5%) | 118 (70.2%) |
| 55 to 64 Years | 110 (38.5%) | 109 (38.1%) |
| 65 to 74 Years | 213 (100.0%) | 84 (39.4%) |
| 75 Years and over | 161 (100.0%) | 77 (47.8%) |
| Total | 1,009 (55.7%) | 758 (41.9%) |
Disability Status by Sex by Age in Liberty
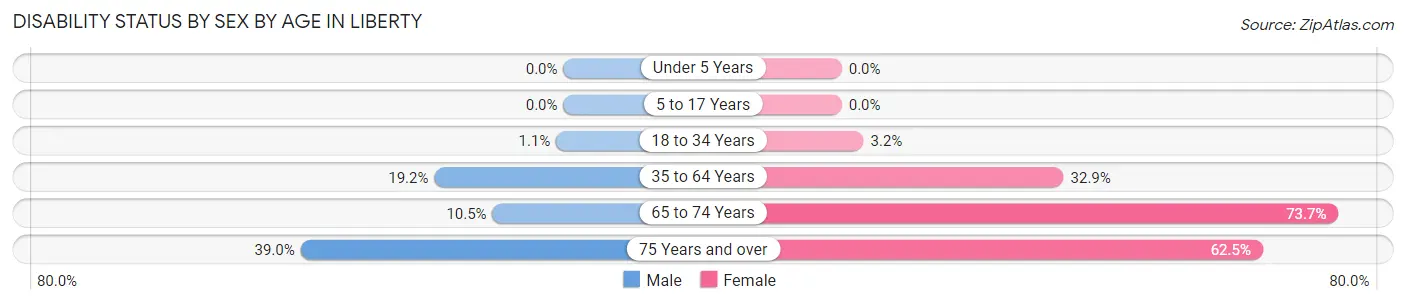
| Age Bracket | Male | Female |
| Under 5 Years | 0 (0.0%) | 0 (0.0%) |
| 5 to 17 Years | 0 (0.0%) | 0 (0.0%) |
| 18 to 34 Years | 2 (1.1%) | 8 (3.2%) |
| 35 to 64 Years | 59 (19.2%) | 139 (32.9%) |
| 65 to 74 Years | 4 (10.5%) | 129 (73.7%) |
| 75 Years and over | 16 (39.0%) | 75 (62.5%) |
Disability Class by Sex by Age in Liberty
Disability Class: Hearing Difficulty
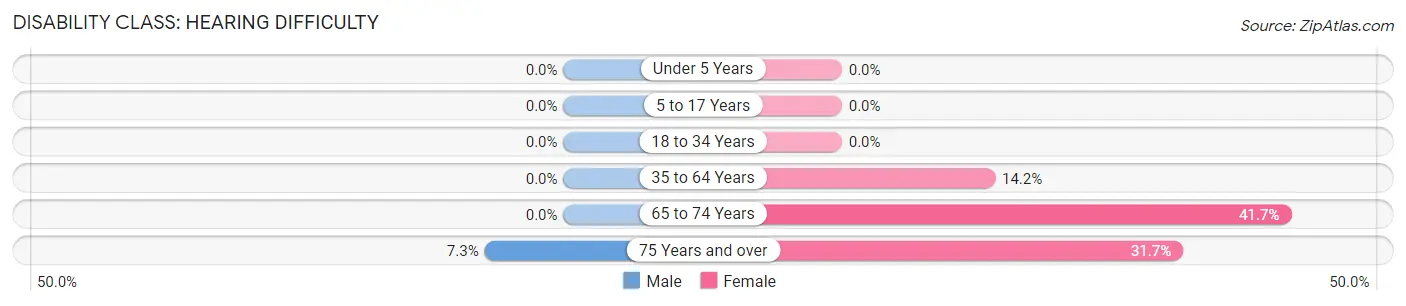
| Age Bracket | Male | Female |
| Under 5 Years | 0 (0.0%) | 0 (0.0%) |
| 5 to 17 Years | 0 (0.0%) | 0 (0.0%) |
| 18 to 34 Years | 0 (0.0%) | 0 (0.0%) |
| 35 to 64 Years | 0 (0.0%) | 60 (14.2%) |
| 65 to 74 Years | 0 (0.0%) | 73 (41.7%) |
| 75 Years and over | 3 (7.3%) | 38 (31.7%) |
Disability Class: Vision Difficulty
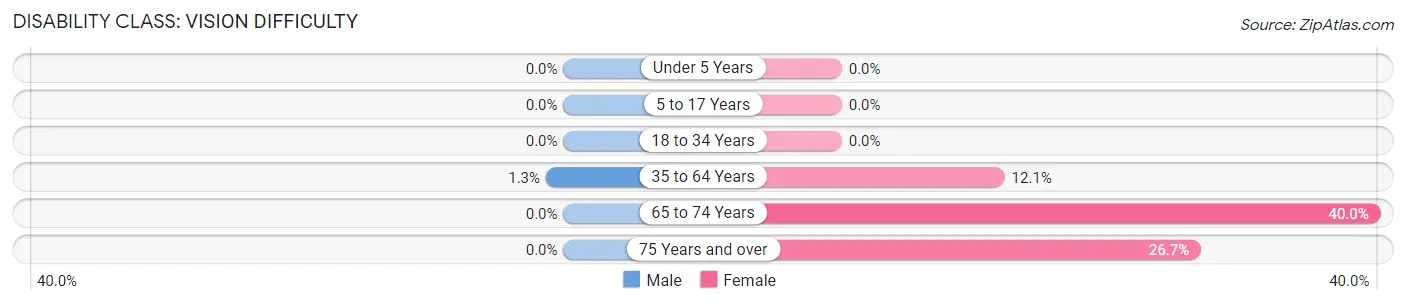
| Age Bracket | Male | Female |
| Under 5 Years | 0 (0.0%) | 0 (0.0%) |
| 5 to 17 Years | 0 (0.0%) | 0 (0.0%) |
| 18 to 34 Years | 0 (0.0%) | 0 (0.0%) |
| 35 to 64 Years | 4 (1.3%) | 51 (12.1%) |
| 65 to 74 Years | 0 (0.0%) | 70 (40.0%) |
| 75 Years and over | 0 (0.0%) | 32 (26.7%) |
Disability Class: Cognitive Difficulty
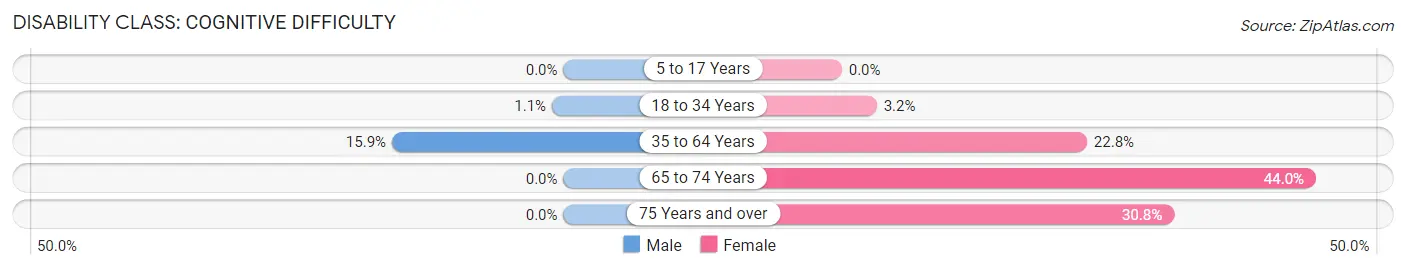
| Age Bracket | Male | Female |
| 5 to 17 Years | 0 (0.0%) | 0 (0.0%) |
| 18 to 34 Years | 2 (1.1%) | 8 (3.2%) |
| 35 to 64 Years | 49 (15.9%) | 96 (22.8%) |
| 65 to 74 Years | 0 (0.0%) | 77 (44.0%) |
| 75 Years and over | 0 (0.0%) | 37 (30.8%) |
Disability Class: Ambulatory Difficulty
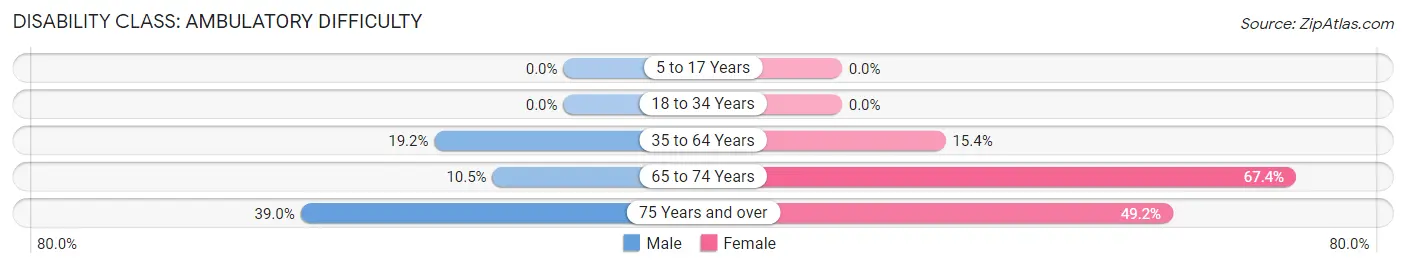
| Age Bracket | Male | Female |
| 5 to 17 Years | 0 (0.0%) | 0 (0.0%) |
| 18 to 34 Years | 0 (0.0%) | 0 (0.0%) |
| 35 to 64 Years | 59 (19.2%) | 65 (15.4%) |
| 65 to 74 Years | 4 (10.5%) | 118 (67.4%) |
| 75 Years and over | 16 (39.0%) | 59 (49.2%) |
Disability Class: Self-Care Difficulty
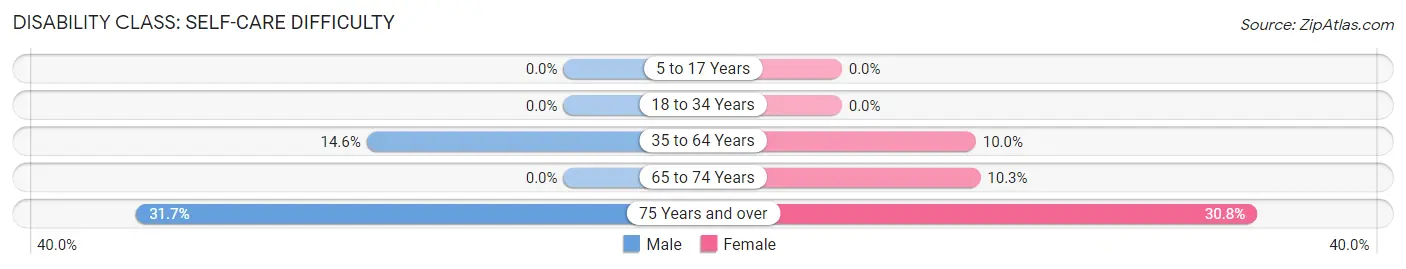
| Age Bracket | Male | Female |
| 5 to 17 Years | 0 (0.0%) | 0 (0.0%) |
| 18 to 34 Years | 0 (0.0%) | 0 (0.0%) |
| 35 to 64 Years | 45 (14.6%) | 42 (10.0%) |
| 65 to 74 Years | 0 (0.0%) | 18 (10.3%) |
| 75 Years and over | 13 (31.7%) | 37 (30.8%) |
Technology Access in Liberty
Computing Device Access in Liberty
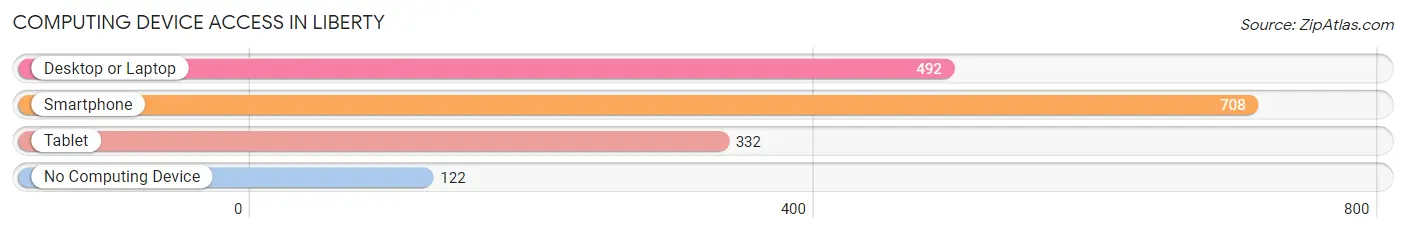
| Device Type | # Households | % Households |
| Desktop or Laptop | 492 | 55.5% |
| Smartphone | 708 | 79.8% |
| Tablet | 332 | 37.4% |
| No Computing Device | 122 | 13.8% |
| Total | 887 | 100.0% |
Internet Access in Liberty
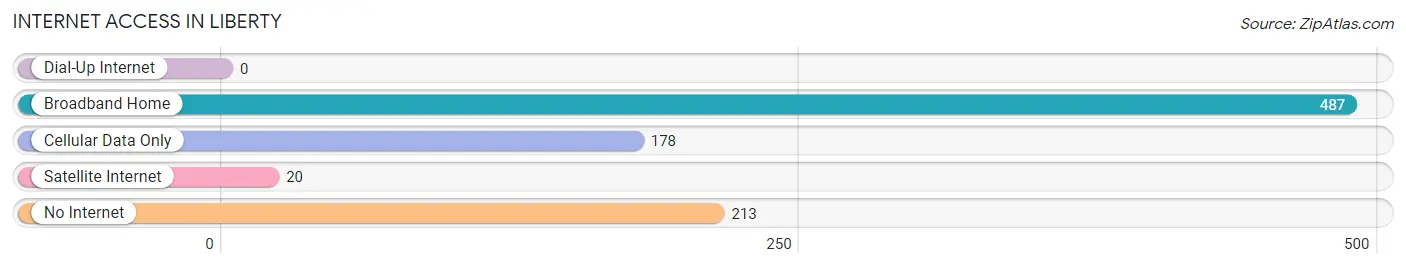
| Internet Type | # Households | % Households |
| Dial-Up Internet | 0 | 0.0% |
| Broadband Home | 487 | 54.9% |
| Cellular Data Only | 178 | 20.1% |
| Satellite Internet | 20 | 2.2% |
| No Internet | 213 | 24.0% |
| Total | 887 | 100.0% |
Liberty Summary
Liberty, Kentucky is a small city located in Casey County, Kentucky. It is the county seat of Casey County and is located in the heart of the Bluegrass Region of Kentucky. The city has a population of 2,717 as of the 2010 census.
Geography
Liberty is located in the Bluegrass Region of Kentucky, in the center of Casey County. It is situated at the intersection of US 127 and KY 70. The city is located in the rolling hills of the region, and is surrounded by farmland. The city is located approximately 70 miles south of Louisville, Kentucky and approximately 90 miles north of Nashville, Tennessee.
History
The area that is now Liberty was first settled in the early 1800s by settlers from Virginia and North Carolina. The town was originally known as Poplar Grove, and was later renamed Liberty in 1817. The town was officially incorporated in 1820.
In the early years of the town, Liberty was a center of commerce and industry. The town was home to several mills, a distillery, and a tannery. The town was also home to a large number of stores and shops.
In the late 1800s, Liberty was a major stop on the Louisville and Nashville Railroad. The railroad brought a great deal of economic growth to the town, and it became a major shipping center for the region.
In the early 1900s, Liberty was home to a large number of tobacco warehouses. The town was also home to a large number of tobacco farmers. The tobacco industry was a major source of income for the town until the mid-1900s, when the industry began to decline.
Economy
Today, Liberty is a small, rural town with a population of just over 2,700. The town is home to a number of small businesses, including a few restaurants, a grocery store, and a few retail stores. The town is also home to a number of small manufacturing companies.
The town is also home to a number of farms, which produce a variety of crops, including tobacco, corn, soybeans, and hay. The town is also home to a number of horse farms, which are a major source of income for the town.
Demographics
As of the 2010 census, Liberty had a population of 2,717. The racial makeup of the town was 97.2% White, 0.7% African American, 0.2% Native American, 0.2% Asian, 0.1% Pacific Islander, 0.7% from other races, and 0.9% from two or more races. Hispanic or Latino of any race were 1.3% of the population.
The median income for a household in Liberty was $30,938, and the median income for a family was $37,917. The per capita income for the town was $17,845. About 17.2% of families and 20.2% of the population were below the poverty line, including 28.2% of those under age 18 and 16.2% of those age 65 or over.
Conclusion
Liberty, Kentucky is a small city located in the Bluegrass Region of Kentucky. It is the county seat of Casey County and is home to a population of just over 2,700. The town is home to a number of small businesses, farms, and manufacturing companies. The town is also home to a number of tobacco farms, which are a major source of income for the town. The median income for a household in Liberty is $30,938, and the median income for a family is $37,917. The town has a diverse population, with 97.2% of the population being White, 0.7% African American, 0.2% Native American, 0.2% Asian, 0.1% Pacific Islander, 0.7% from other races, and 0.9% from two or more races.
Common Questions
What is Per Capita Income in Liberty?
Per Capita income in Liberty is $19,718.
What is the Median Family Income in Liberty?
Median Family Income in Liberty is $51,583.
What is the Median Household income in Liberty?
Median Household Income in Liberty is $28,347.
What is Income or Wage Gap in Liberty?
Income or Wage Gap in Liberty is 26.5%.
Women in Liberty earn 73.5 cents for every dollar earned by a man.
What is Inequality or Gini Index in Liberty?
Inequality or Gini Index in Liberty is 0.47.
What is the Total Population of Liberty?
Total Population of Liberty is 2,164.
What is the Total Male Population of Liberty?
Total Male Population of Liberty is 931.
What is the Total Female Population of Liberty?
Total Female Population of Liberty is 1,233.
What is the Ratio of Males per 100 Females in Liberty?
There are 75.51 Males per 100 Females in Liberty.
What is the Ratio of Females per 100 Males in Liberty?
There are 132.44 Females per 100 Males in Liberty.
What is the Median Population Age in Liberty?
Median Population Age in Liberty is 42.8 Years.
What is the Average Family Size in Liberty
Average Family Size in Liberty is 2.7 People.
What is the Average Household Size in Liberty
Average Household Size in Liberty is 2.0 People.
How Large is the Labor Force in Liberty?
There are 878 People in the Labor Forcein in Liberty.
What is the Percentage of People in the Labor Force in Liberty?
44.2% of People are in the Labor Force in Liberty.
What is the Unemployment Rate in Liberty?
Unemployment Rate in Liberty is 18.4%.