Plantation, KY Map & Demographics
Plantation Map
Plantation Overview
$36,214
PER CAPITA INCOME
$77,083
AVG FAMILY INCOME
$71,250
AVG HOUSEHOLD INCOME
35.3%
WAGE / INCOME GAP [ % ]
64.7¢/ $1
WAGE / INCOME GAP [ $ ]
$15,336
FAMILY INCOME DEFICIT
0.44
INEQUALITY / GINI INDEX
890
TOTAL POPULATION
392
MALE POPULATION
498
FEMALE POPULATION
78.71
MALES / 100 FEMALES
127.04
FEMALES / 100 MALES
32.0
MEDIAN AGE
3.4
AVG FAMILY SIZE
2.7
AVG HOUSEHOLD SIZE
477
LABOR FORCE [ PEOPLE ]
78.6%
PERCENT IN LABOR FORCE
3.6%
UNEMPLOYMENT RATE
Plantation Area Codes
Income in Plantation
Income Overview in Plantation
Per Capita Income in Plantation is $36,214, while median incomes of families and households are $77,083 and $71,250 respectively.
| Characteristic | Number | Measure |
| Per Capita Income | 890 | $36,214 |
| Median Family Income | 217 | $77,083 |
| Mean Family Income | 217 | $110,854 |
| Median Household Income | 325 | $71,250 |
| Mean Household Income | 325 | $96,802 |
| Income Deficit | 217 | $15,336 |
| Wage / Income Gap (%) | 890 | 35.26% |
| Wage / Income Gap ($) | 890 | 64.74¢ per $1 |
| Gini / Inequality Index | 890 | 0.44 |
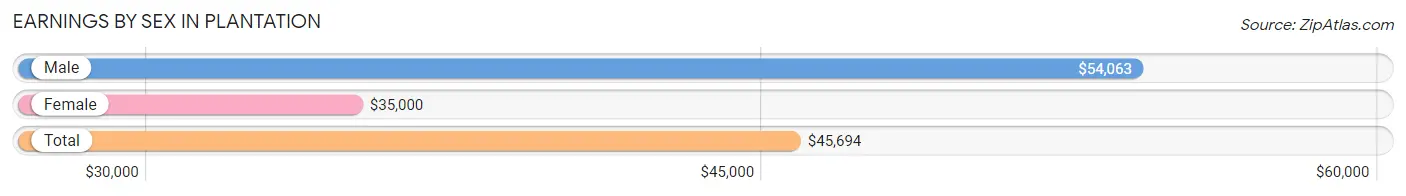
Earnings by Sex in Plantation
Average Earnings in Plantation are $45,694, $54,063 for men and $35,000 for women, a difference of 35.3%.
| Sex | Number | Average Earnings |
| Male | 235 (47.7%) | $54,063 |
| Female | 258 (52.3%) | $35,000 |
| Total | 493 (100.0%) | $45,694 |
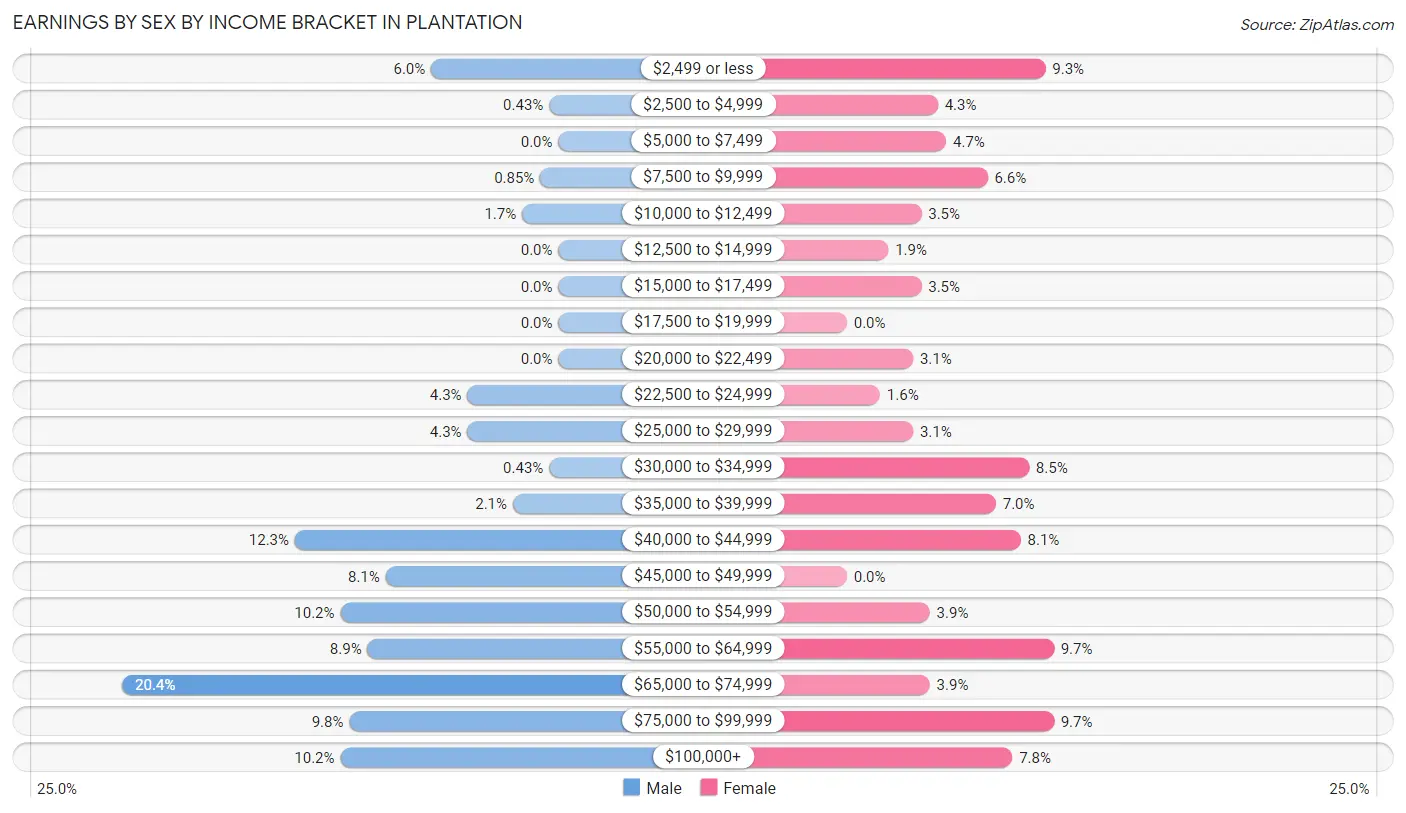
Earnings by Sex by Income Bracket in Plantation
The most common earnings brackets in Plantation are $65,000 to $74,999 for men (48 | 20.4%) and $55,000 to $64,999 for women (25 | 9.7%).
| Income | Male | Female |
| $2,499 or less | 14 (6.0%) | 24 (9.3%) |
| $2,500 to $4,999 | 1 (0.4%) | 11 (4.3%) |
| $5,000 to $7,499 | 0 (0.0%) | 12 (4.6%) |
| $7,500 to $9,999 | 2 (0.9%) | 17 (6.6%) |
| $10,000 to $12,499 | 4 (1.7%) | 9 (3.5%) |
| $12,500 to $14,999 | 0 (0.0%) | 5 (1.9%) |
| $15,000 to $17,499 | 0 (0.0%) | 9 (3.5%) |
| $17,500 to $19,999 | 0 (0.0%) | 0 (0.0%) |
| $20,000 to $22,499 | 0 (0.0%) | 8 (3.1%) |
| $22,500 to $24,999 | 10 (4.3%) | 4 (1.5%) |
| $25,000 to $29,999 | 10 (4.3%) | 8 (3.1%) |
| $30,000 to $34,999 | 1 (0.4%) | 22 (8.5%) |
| $35,000 to $39,999 | 5 (2.1%) | 18 (7.0%) |
| $40,000 to $44,999 | 29 (12.3%) | 21 (8.1%) |
| $45,000 to $49,999 | 19 (8.1%) | 0 (0.0%) |
| $50,000 to $54,999 | 24 (10.2%) | 10 (3.9%) |
| $55,000 to $64,999 | 21 (8.9%) | 25 (9.7%) |
| $65,000 to $74,999 | 48 (20.4%) | 10 (3.9%) |
| $75,000 to $99,999 | 23 (9.8%) | 25 (9.7%) |
| $100,000+ | 24 (10.2%) | 20 (7.7%) |
| Total | 235 (100.0%) | 258 (100.0%) |
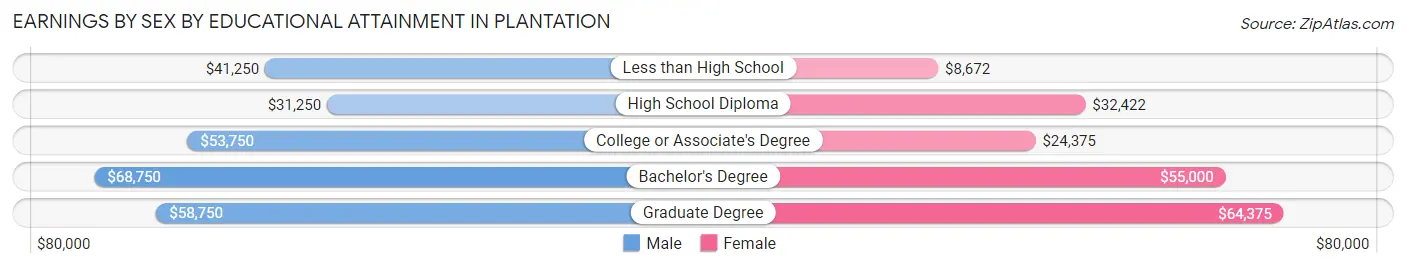
Earnings by Sex by Educational Attainment in Plantation
Average earnings in Plantation are $52,188 for men and $36,161 for women, a difference of 30.7%. Men with an educational attainment of bachelor's degree enjoy the highest average annual earnings of $68,750, while those with high school diploma education earn the least with $31,250. Women with an educational attainment of graduate degree earn the most with the average annual earnings of $64,375, while those with less than high school education have the smallest earnings of $8,672.
| Educational Attainment | Male Income | Female Income |
| Less than High School | $41,250 | $8,672 |
| High School Diploma | $31,250 | $32,422 |
| College or Associate's Degree | $53,750 | $24,375 |
| Bachelor's Degree | $68,750 | $55,000 |
| Graduate Degree | $58,750 | $64,375 |
| Total | $52,188 | $36,161 |
Family Income in Plantation
Family Income Brackets in Plantation
According to the Plantation family income data, there are 67 families falling into the $100,000 to $149,999 income range, which is the most common income bracket and makes up 30.9% of all families. Conversely, the $15,000 to $24,999 income bracket is the least frequent group with only 2 families (0.9%) belonging to this category.
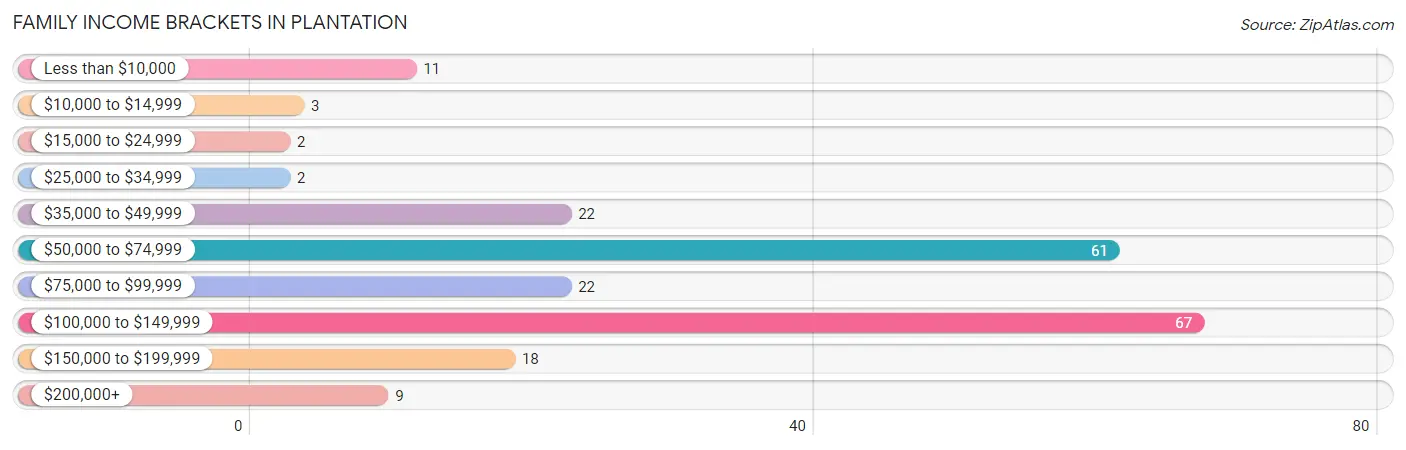
| Income Bracket | # Families | % Families |
| Less than $10,000 | 11 | 5.1% |
| $10,000 to $14,999 | 3 | 1.4% |
| $15,000 to $24,999 | 2 | 0.9% |
| $25,000 to $34,999 | 2 | 0.9% |
| $35,000 to $49,999 | 22 | 10.1% |
| $50,000 to $74,999 | 61 | 28.1% |
| $75,000 to $99,999 | 22 | 10.1% |
| $100,000 to $149,999 | 67 | 30.9% |
| $150,000 to $199,999 | 18 | 8.3% |
| $200,000+ | 9 | 4.1% |
Family Income by Famaliy Size in Plantation
4-person families (52 | 24.0%) account for the highest median family income in Plantation with $117,500 per family, while 2-person families (79 | 36.4%) have the highest median income of $34,792 per family member.
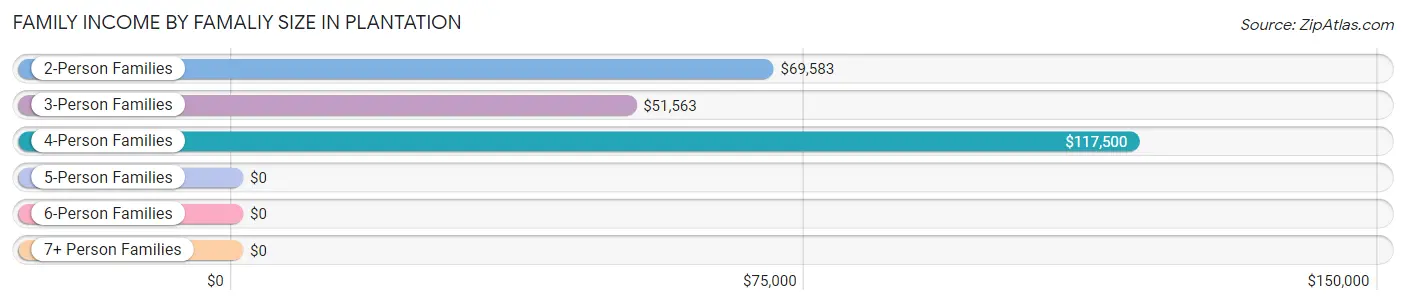
| Income Bracket | # Families | Median Income |
| 2-Person Families | 79 (36.4%) | $69,583 |
| 3-Person Families | 70 (32.3%) | $51,563 |
| 4-Person Families | 52 (24.0%) | $117,500 |
| 5-Person Families | 2 (0.9%) | $0 |
| 6-Person Families | 14 (6.5%) | $0 |
| 7+ Person Families | 0 (0.0%) | $0 |
| Total | 217 (100.0%) | $77,083 |
Family Income by Number of Earners in Plantation
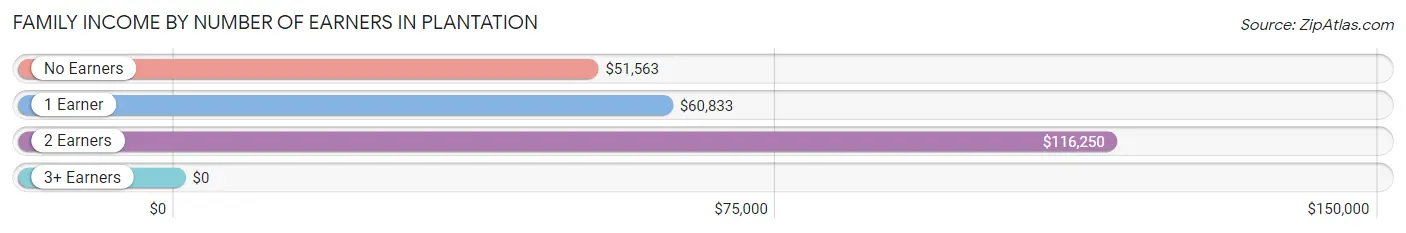
| Number of Earners | # Families | Median Income |
| No Earners | 5 (2.3%) | $51,563 |
| 1 Earner | 76 (35.0%) | $60,833 |
| 2 Earners | 106 (48.8%) | $116,250 |
| 3+ Earners | 30 (13.8%) | $0 |
| Total | 217 (100.0%) | $77,083 |
Household Income in Plantation
Household Income Brackets in Plantation
With 83 households falling in the category, the $50,000 to $74,999 income range is the most frequent in Plantation, accounting for 25.5% of all households. In contrast, only 10 households (3.1%) fall into the $15,000 to $24,999 income bracket, making it the least populous group.
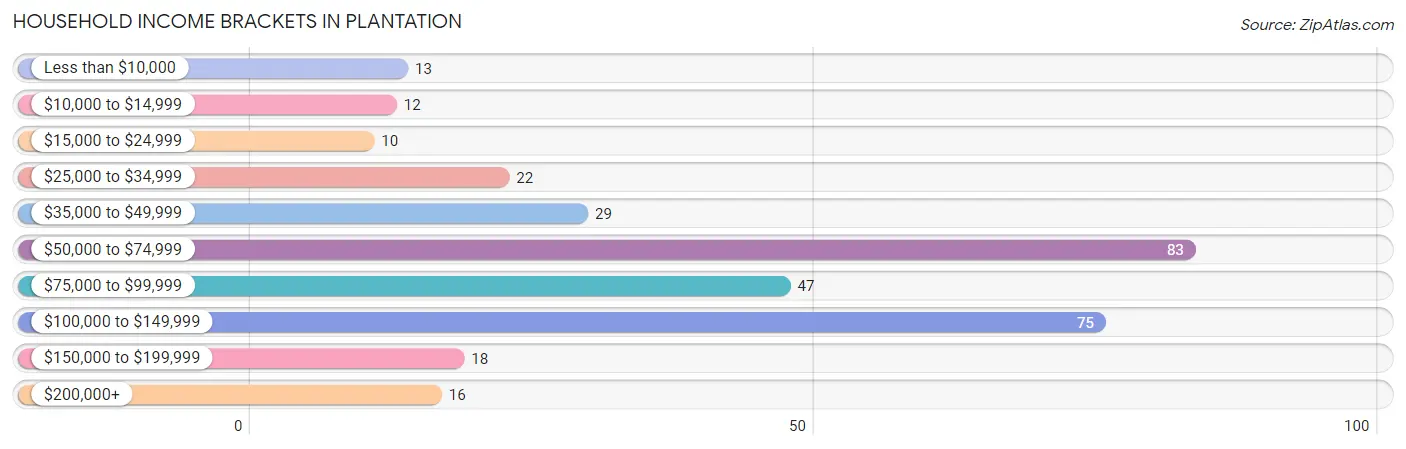
| Income Bracket | # Households | % Households |
| Less than $10,000 | 13 | 4.0% |
| $10,000 to $14,999 | 12 | 3.7% |
| $15,000 to $24,999 | 10 | 3.1% |
| $25,000 to $34,999 | 22 | 6.8% |
| $35,000 to $49,999 | 29 | 8.9% |
| $50,000 to $74,999 | 83 | 25.5% |
| $75,000 to $99,999 | 47 | 14.5% |
| $100,000 to $149,999 | 75 | 23.1% |
| $150,000 to $199,999 | 18 | 5.5% |
| $200,000+ | 16 | 4.9% |
Household Income by Householder Age in Plantation
The median household income in Plantation is $71,250, with the highest median household income of $105,714 found in the 15 to 24 years age bracket for the primary householder. A total of 20 households (6.1%) fall into this category. Meanwhile, the 45 to 64 years age bracket for the primary householder has the lowest median household income of $55,625, with 155 households (47.7%) in this group.
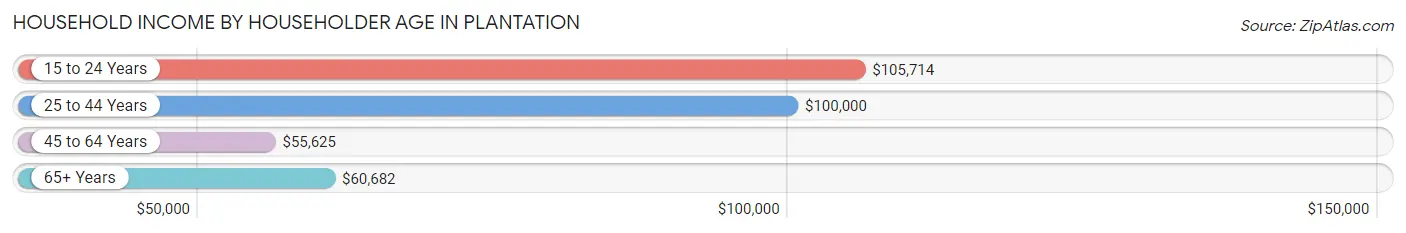
| Income Bracket | # Households | Median Income |
| 15 to 24 Years | 20 (6.1%) | $105,714 |
| 25 to 44 Years | 102 (31.4%) | $100,000 |
| 45 to 64 Years | 155 (47.7%) | $55,625 |
| 65+ Years | 48 (14.8%) | $60,682 |
| Total | 325 (100.0%) | $71,250 |
Poverty in Plantation
Income Below Poverty by Sex and Age in Plantation
With 3.6% poverty level for males and 10.4% for females among the residents of Plantation, 12 to 14 year old males and 18 to 24 year old females are the most vulnerable to poverty, with 3 males (16.7%) and 11 females (55.0%) in their respective age groups living below the poverty level.
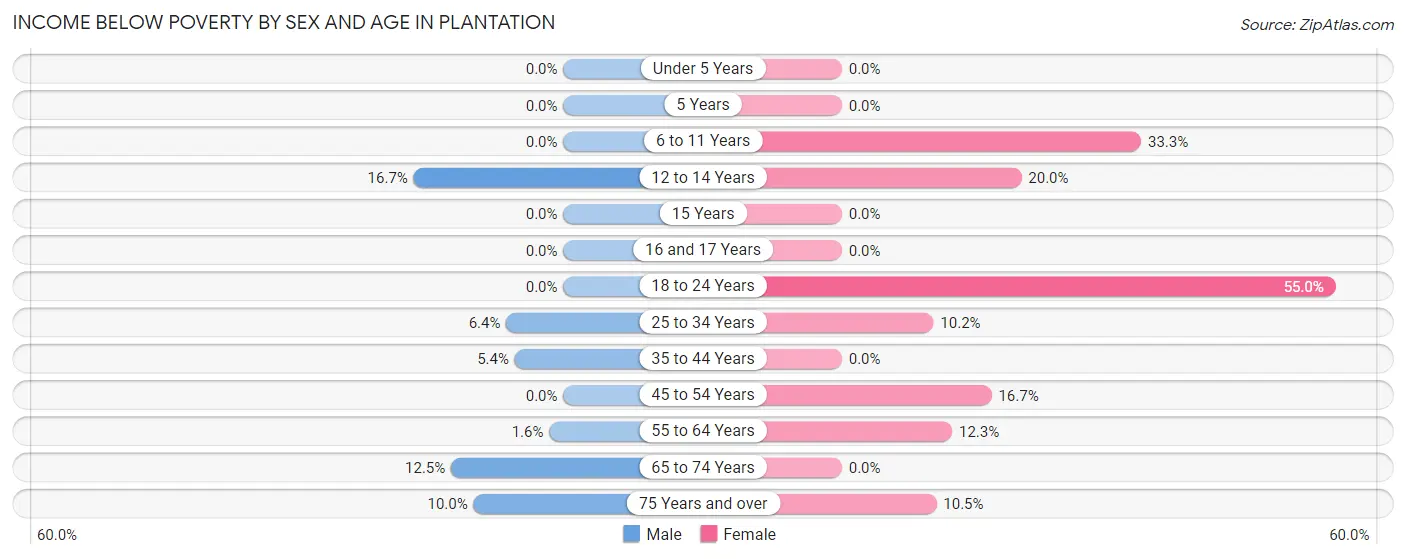
| Age Bracket | Male | Female |
| Under 5 Years | 0 (0.0%) | 0 (0.0%) |
| 5 Years | 0 (0.0%) | 0 (0.0%) |
| 6 to 11 Years | 0 (0.0%) | 5 (33.3%) |
| 12 to 14 Years | 3 (16.7%) | 5 (20.0%) |
| 15 Years | 0 (0.0%) | 0 (0.0%) |
| 16 and 17 Years | 0 (0.0%) | 0 (0.0%) |
| 18 to 24 Years | 0 (0.0%) | 11 (55.0%) |
| 25 to 34 Years | 4 (6.4%) | 10 (10.2%) |
| 35 to 44 Years | 2 (5.4%) | 0 (0.0%) |
| 45 to 54 Years | 0 (0.0%) | 12 (16.7%) |
| 55 to 64 Years | 1 (1.6%) | 7 (12.3%) |
| 65 to 74 Years | 3 (12.5%) | 0 (0.0%) |
| 75 Years and over | 1 (10.0%) | 2 (10.5%) |
| Total | 14 (3.6%) | 52 (10.4%) |
Income Above Poverty by Sex and Age in Plantation
According to the poverty statistics in Plantation, males aged under 5 years and females aged under 5 years are the age groups that are most secure financially, with 100.0% of males and 100.0% of females in these age groups living above the poverty line.
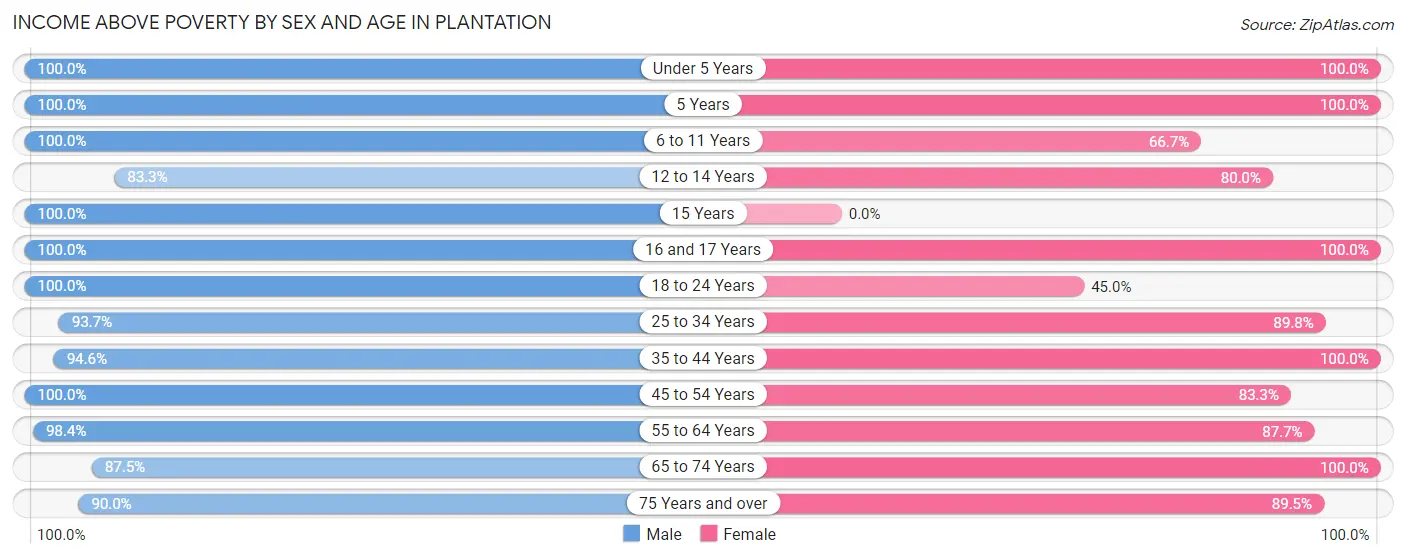
| Age Bracket | Male | Female |
| Under 5 Years | 71 (100.0%) | 79 (100.0%) |
| 5 Years | 2 (100.0%) | 34 (100.0%) |
| 6 to 11 Years | 35 (100.0%) | 10 (66.7%) |
| 12 to 14 Years | 15 (83.3%) | 20 (80.0%) |
| 15 Years | 2 (100.0%) | 0 (0.0%) |
| 16 and 17 Years | 3 (100.0%) | 10 (100.0%) |
| 18 to 24 Years | 23 (100.0%) | 9 (45.0%) |
| 25 to 34 Years | 59 (93.6%) | 88 (89.8%) |
| 35 to 44 Years | 35 (94.6%) | 47 (100.0%) |
| 45 to 54 Years | 38 (100.0%) | 60 (83.3%) |
| 55 to 64 Years | 63 (98.4%) | 50 (87.7%) |
| 65 to 74 Years | 21 (87.5%) | 22 (100.0%) |
| 75 Years and over | 9 (90.0%) | 17 (89.5%) |
| Total | 376 (96.4%) | 446 (89.6%) |
Income Below Poverty Among Married-Couple Families in Plantation
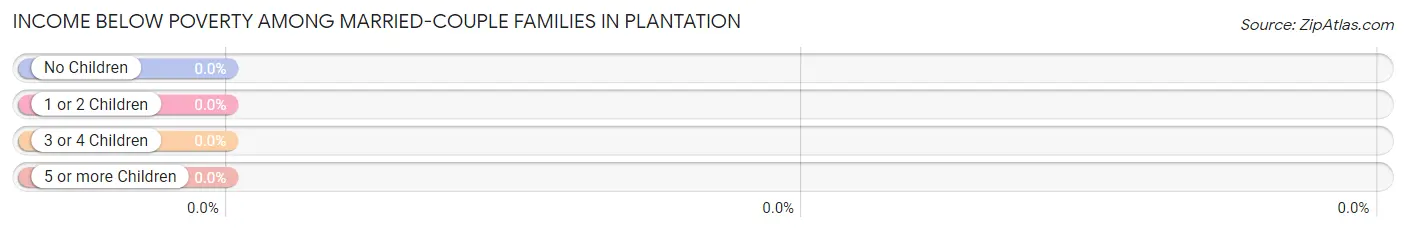
| Children | Above Poverty | Below Poverty |
| No Children | 78 (100.0%) | 0 (0.0%) |
| 1 or 2 Children | 76 (100.0%) | 0 (0.0%) |
| 3 or 4 Children | 14 (100.0%) | 0 (0.0%) |
| 5 or more Children | 0 (0.0%) | 0 (0.0%) |
| Total | 168 (100.0%) | 0 (0.0%) |
Income Below Poverty Among Single-Parent Households in Plantation
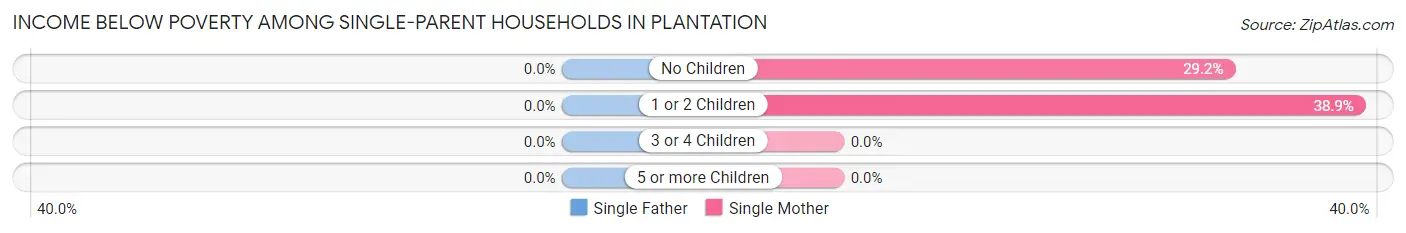
| Children | Single Father | Single Mother |
| No Children | 0 (0.0%) | 7 (29.2%) |
| 1 or 2 Children | 0 (0.0%) | 7 (38.9%) |
| 3 or 4 Children | 0 (0.0%) | 0 (0.0%) |
| 5 or more Children | 0 (0.0%) | 0 (0.0%) |
| Total | 0 (0.0%) | 14 (31.8%) |
Income Below Poverty Among Married-Couple vs Single-Parent Households in Plantation
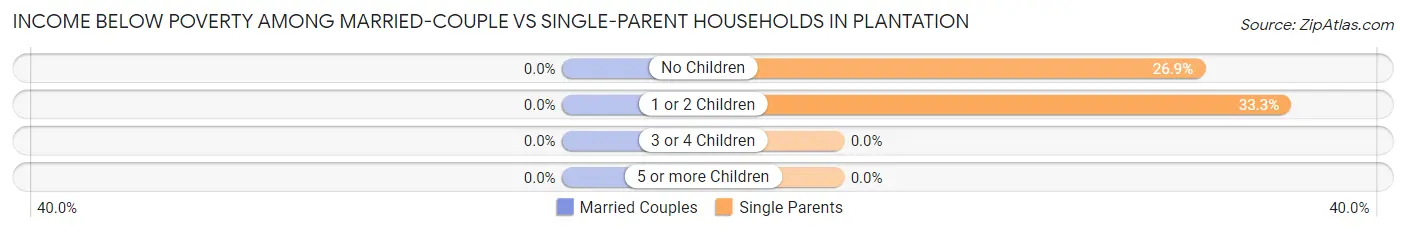
| Children | Married-Couple Families | Single-Parent Households |
| No Children | 0 (0.0%) | 7 (26.9%) |
| 1 or 2 Children | 0 (0.0%) | 7 (33.3%) |
| 3 or 4 Children | 0 (0.0%) | 0 (0.0%) |
| 5 or more Children | 0 (0.0%) | 0 (0.0%) |
| Total | 0 (0.0%) | 14 (28.6%) |
Race in Plantation
The most populous races in Plantation are White / Caucasian (721 | 81.0%), Black / African American (102 | 11.5%), and Two or more Races (36 | 4.0%).
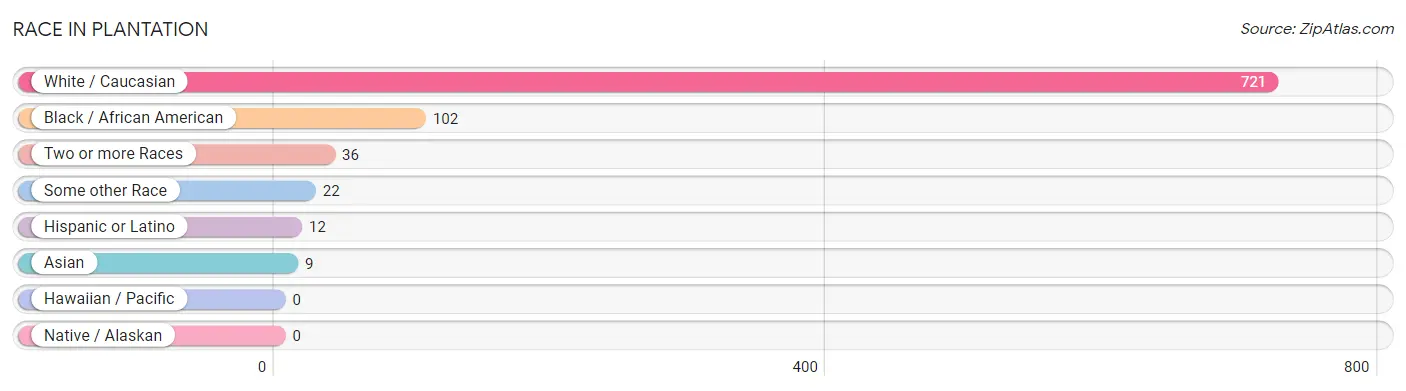
| Race | # Population | % Population |
| Asian | 9 | 1.0% |
| Black / African American | 102 | 11.5% |
| Hawaiian / Pacific | 0 | 0.0% |
| Hispanic or Latino | 12 | 1.3% |
| Native / Alaskan | 0 | 0.0% |
| White / Caucasian | 721 | 81.0% |
| Two or more Races | 36 | 4.0% |
| Some other Race | 22 | 2.5% |
| Total | 890 | 100.0% |
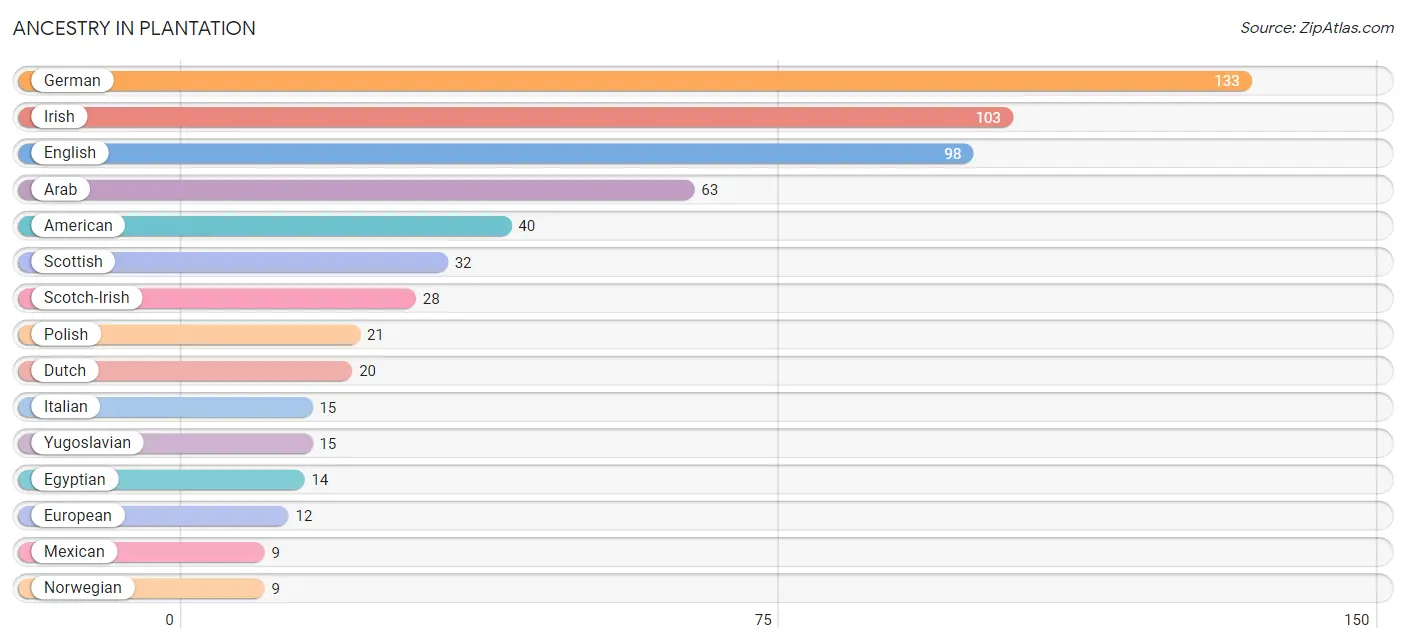
Ancestry in Plantation
The most populous ancestries reported in Plantation are German (133 | 14.9%), Irish (103 | 11.6%), English (98 | 11.0%), Arab (63 | 7.1%), and American (40 | 4.5%), together accounting for 49.1% of all Plantation residents.
| Ancestry | # Population | % Population |
| American | 40 | 4.5% |
| Arab | 63 | 7.1% |
| Armenian | 2 | 0.2% |
| Bhutanese | 8 | 0.9% |
| British | 2 | 0.2% |
| Burmese | 7 | 0.8% |
| Czech | 2 | 0.2% |
| Dutch | 20 | 2.2% |
| Egyptian | 14 | 1.6% |
| English | 98 | 11.0% |
| European | 12 | 1.3% |
| Finnish | 2 | 0.2% |
| French | 5 | 0.6% |
| German | 133 | 14.9% |
| Hungarian | 2 | 0.2% |
| Indian (Asian) | 6 | 0.7% |
| Irish | 103 | 11.6% |
| Italian | 15 | 1.7% |
| Korean | 2 | 0.2% |
| Mexican | 9 | 1.0% |
| Native Hawaiian | 3 | 0.3% |
| Northern European | 6 | 0.7% |
| Norwegian | 9 | 1.0% |
| Pakistani | 4 | 0.4% |
| Polish | 21 | 2.4% |
| Puerto Rican | 3 | 0.3% |
| Russian | 6 | 0.7% |
| Scandinavian | 7 | 0.8% |
| Scotch-Irish | 28 | 3.2% |
| Scottish | 32 | 3.6% |
| Sioux | 6 | 0.7% |
| Swiss | 2 | 0.2% |
| Thai | 6 | 0.7% |
| Welsh | 1 | 0.1% |
| Yugoslavian | 15 | 1.7% | View All 35 Rows |
Immigrants in Plantation
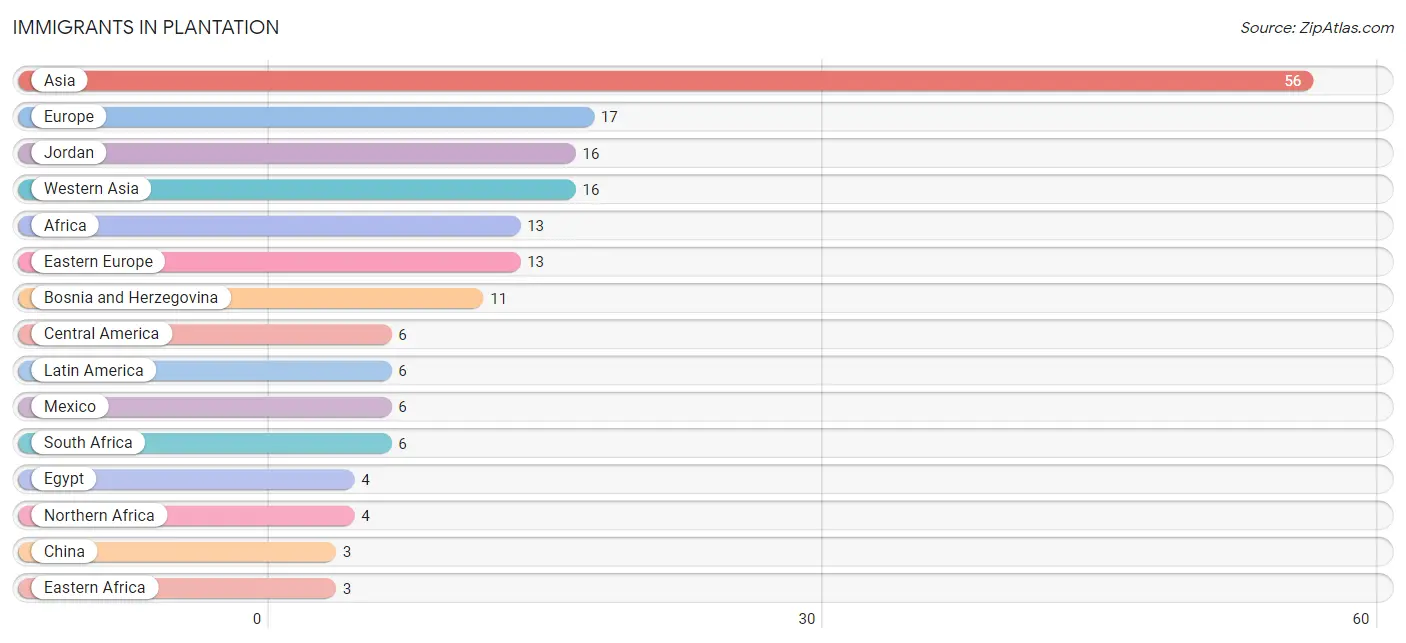
The most numerous immigrant groups reported in Plantation came from Asia (56 | 6.3%), Europe (17 | 1.9%), Jordan (16 | 1.8%), Western Asia (16 | 1.8%), and Africa (13 | 1.5%), together accounting for 13.3% of all Plantation residents.
| Immigration Origin | # Population | % Population |
| Africa | 13 | 1.5% |
| Asia | 56 | 6.3% |
| Bosnia and Herzegovina | 11 | 1.2% |
| Canada | 2 | 0.2% |
| Central America | 6 | 0.7% |
| China | 3 | 0.3% |
| Eastern Africa | 3 | 0.3% |
| Eastern Asia | 3 | 0.3% |
| Eastern Europe | 13 | 1.5% |
| Egypt | 4 | 0.4% |
| England | 2 | 0.2% |
| Europe | 17 | 1.9% |
| Germany | 2 | 0.2% |
| Hong Kong | 1 | 0.1% |
| India | 2 | 0.2% |
| Jordan | 16 | 1.8% |
| Kenya | 3 | 0.3% |
| Latin America | 6 | 0.7% |
| Mexico | 6 | 0.7% |
| Northern Africa | 4 | 0.4% |
| Northern Europe | 2 | 0.2% |
| South Africa | 6 | 0.7% |
| South Central Asia | 2 | 0.2% |
| South Eastern Asia | 2 | 0.2% |
| Thailand | 2 | 0.2% |
| Western Asia | 16 | 1.8% |
| Western Europe | 2 | 0.2% | View All 27 Rows |
Sex and Age in Plantation
Sex and Age in Plantation
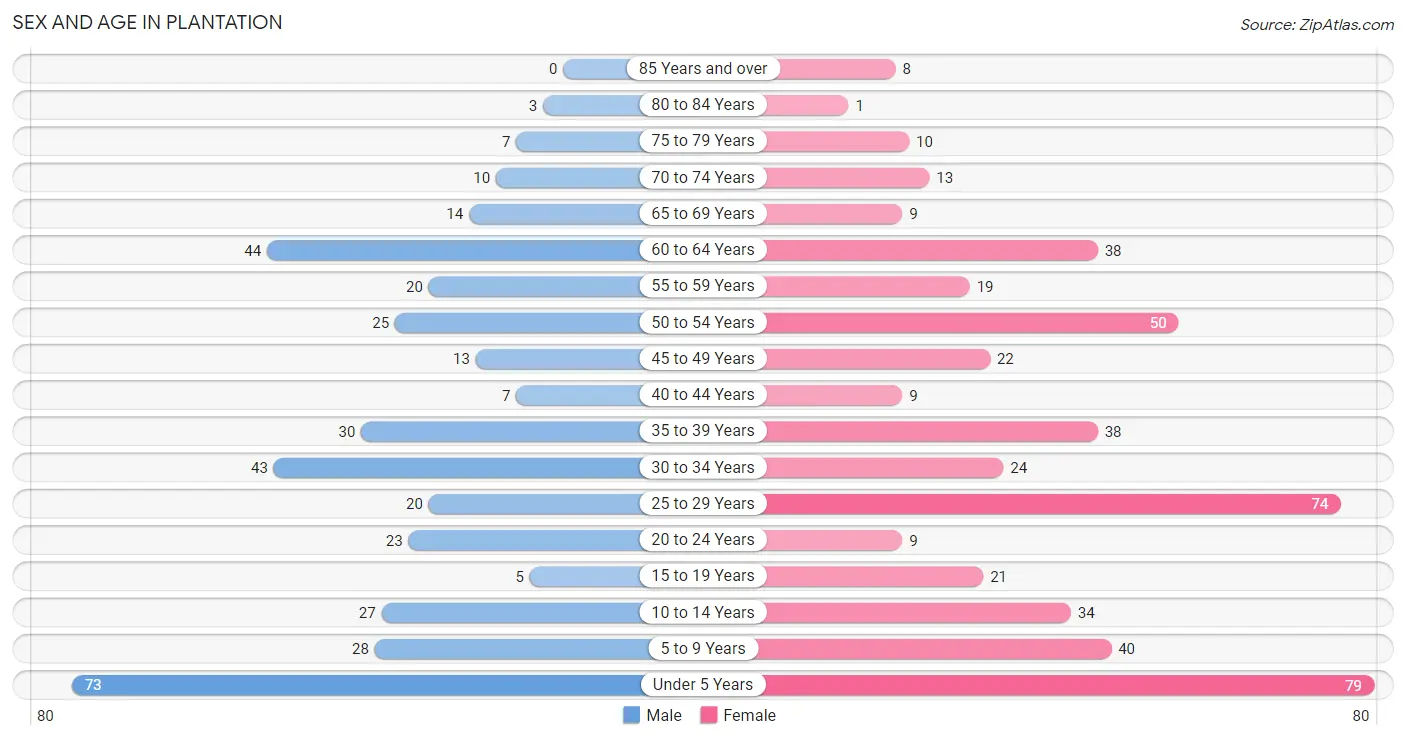
The most populous age groups in Plantation are Under 5 Years (73 | 18.6%) for men and Under 5 Years (79 | 15.9%) for women.
| Age Bracket | Male | Female |
| Under 5 Years | 73 (18.6%) | 79 (15.9%) |
| 5 to 9 Years | 28 (7.1%) | 40 (8.0%) |
| 10 to 14 Years | 27 (6.9%) | 34 (6.8%) |
| 15 to 19 Years | 5 (1.3%) | 21 (4.2%) |
| 20 to 24 Years | 23 (5.9%) | 9 (1.8%) |
| 25 to 29 Years | 20 (5.1%) | 74 (14.9%) |
| 30 to 34 Years | 43 (11.0%) | 24 (4.8%) |
| 35 to 39 Years | 30 (7.6%) | 38 (7.6%) |
| 40 to 44 Years | 7 (1.8%) | 9 (1.8%) |
| 45 to 49 Years | 13 (3.3%) | 22 (4.4%) |
| 50 to 54 Years | 25 (6.4%) | 50 (10.0%) |
| 55 to 59 Years | 20 (5.1%) | 19 (3.8%) |
| 60 to 64 Years | 44 (11.2%) | 38 (7.6%) |
| 65 to 69 Years | 14 (3.6%) | 9 (1.8%) |
| 70 to 74 Years | 10 (2.5%) | 13 (2.6%) |
| 75 to 79 Years | 7 (1.8%) | 10 (2.0%) |
| 80 to 84 Years | 3 (0.8%) | 1 (0.2%) |
| 85 Years and over | 0 (0.0%) | 8 (1.6%) |
| Total | 392 (100.0%) | 498 (100.0%) |
Families and Households in Plantation
Median Family Size in Plantation
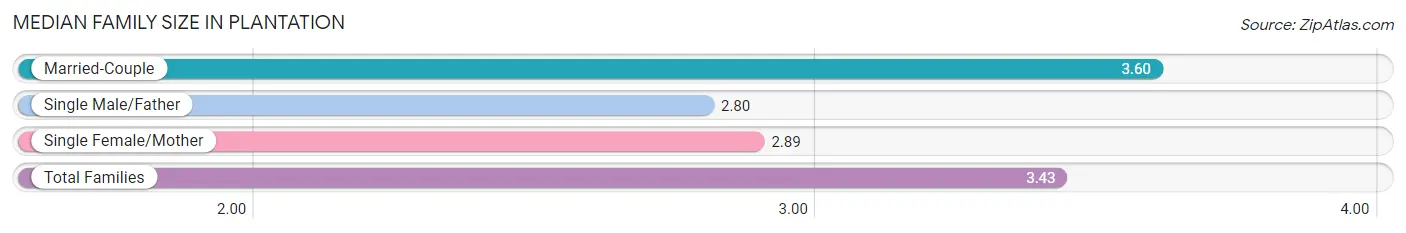
The median family size in Plantation is 3.43 persons per family, with married-couple families (168 | 77.4%) accounting for the largest median family size of 3.6 persons per family. On the other hand, single male/father families (5 | 2.3%) represent the smallest median family size with 2.80 persons per family.
| Family Type | # Families | Family Size |
| Married-Couple | 168 (77.4%) | 3.60 |
| Single Male/Father | 5 (2.3%) | 2.80 |
| Single Female/Mother | 44 (20.3%) | 2.89 |
| Total Families | 217 (100.0%) | 3.43 |
Median Household Size in Plantation
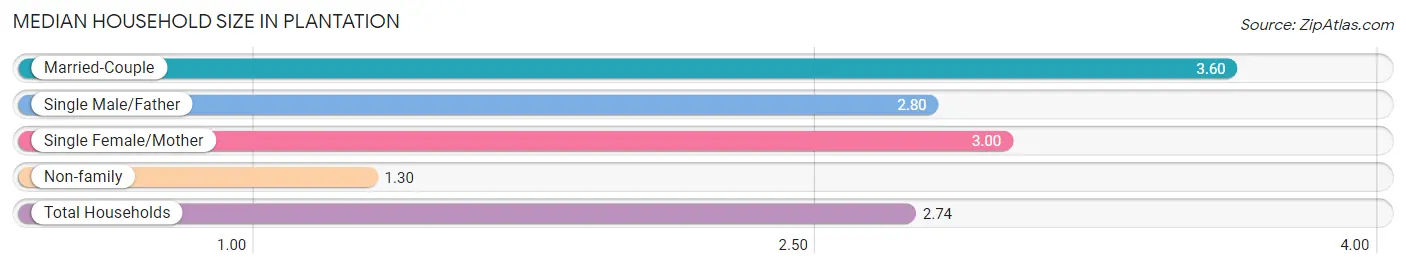
The median household size in Plantation is 2.74 persons per household, with married-couple households (168 | 51.7%) accounting for the largest median household size of 3.6 persons per household. non-family households (108 | 33.2%) represent the smallest median household size with 1.30 persons per household.
| Household Type | # Households | Household Size |
| Married-Couple | 168 (51.7%) | 3.60 |
| Single Male/Father | 5 (1.5%) | 2.80 |
| Single Female/Mother | 44 (13.5%) | 3.00 |
| Non-family | 108 (33.2%) | 1.30 |
| Total Households | 325 (100.0%) | 2.74 |
Household Size by Marriage Status in Plantation
Out of a total of 325 households in Plantation, 217 (66.8%) are family households, while 108 (33.2%) are nonfamily households. The most numerous type of family households are 2-person households, comprising 77, and the most common type of nonfamily households are 1-person households, comprising 83.
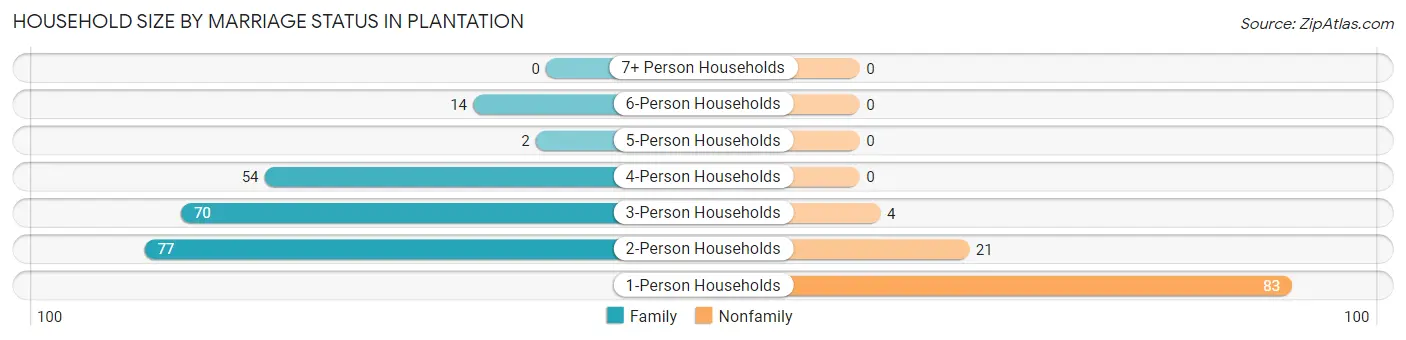
| Household Size | Family Households | Nonfamily Households |
| 1-Person Households | - | 83 (25.5%) |
| 2-Person Households | 77 (23.7%) | 21 (6.5%) |
| 3-Person Households | 70 (21.5%) | 4 (1.2%) |
| 4-Person Households | 54 (16.6%) | 0 (0.0%) |
| 5-Person Households | 2 (0.6%) | 0 (0.0%) |
| 6-Person Households | 14 (4.3%) | 0 (0.0%) |
| 7+ Person Households | 0 (0.0%) | 0 (0.0%) |
| Total | 217 (66.8%) | 108 (33.2%) |
Female Fertility in Plantation
Fertility by Age in Plantation
Average fertility rate in Plantation is 99.0 births per 1,000 women. Women in the age bracket of 35 to 50 years have the highest fertility rate with 202.0 births per 1,000 women. Women in the age bracket of 35 to 50 years acount for 80.9% of all women with births.
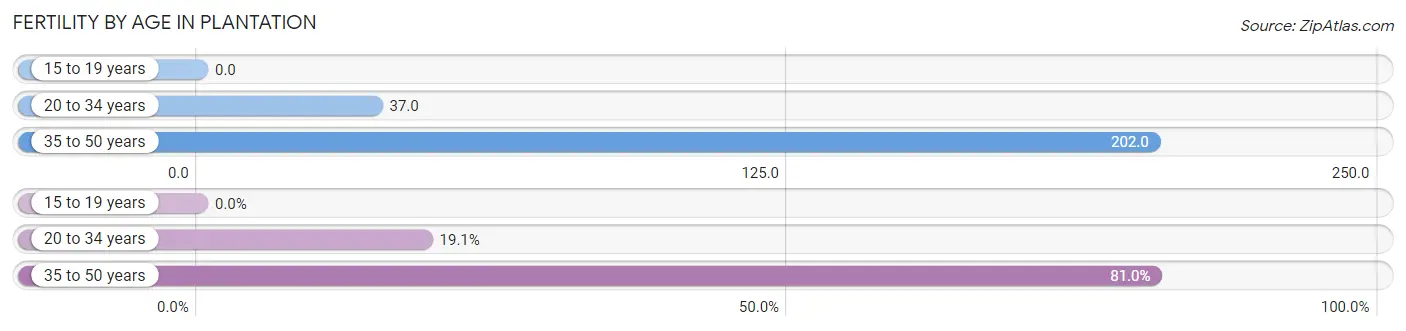
| Age Bracket | Women with Births | Births / 1,000 Women |
| 15 to 19 years | 0 (0.0%) | 0.0 |
| 20 to 34 years | 4 (19.1%) | 37.0 |
| 35 to 50 years | 17 (80.9%) | 202.0 |
| Total | 21 (100.0%) | 99.0 |
Fertility by Age by Marriage Status in Plantation
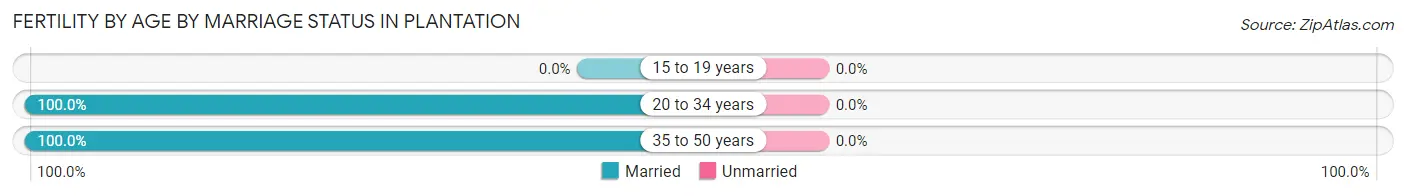
| Age Bracket | Married | Unmarried |
| 15 to 19 years | 0 (0.0%) | 0 (0.0%) |
| 20 to 34 years | 4 (100.0%) | 0 (0.0%) |
| 35 to 50 years | 17 (100.0%) | 0 (0.0%) |
| Total | 21 (100.0%) | 0 (0.0%) |
Fertility by Education in Plantation
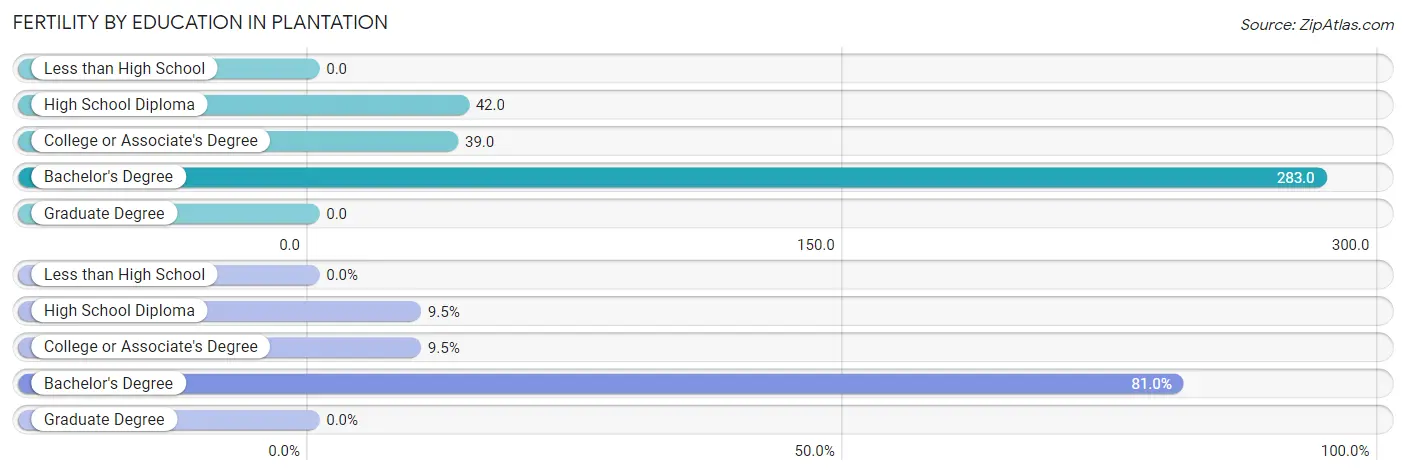
| Educational Attainment | Women with Births | Births / 1,000 Women |
| Less than High School | 0 (0.0%) | 0.0 |
| High School Diploma | 2 (9.5%) | 42.0 |
| College or Associate's Degree | 2 (9.5%) | 39.0 |
| Bachelor's Degree | 17 (80.9%) | 283.0 |
| Graduate Degree | 0 (0.0%) | 0.0 |
| Total | 21 (100.0%) | 99.0 |
Fertility by Education by Marriage Status in Plantation
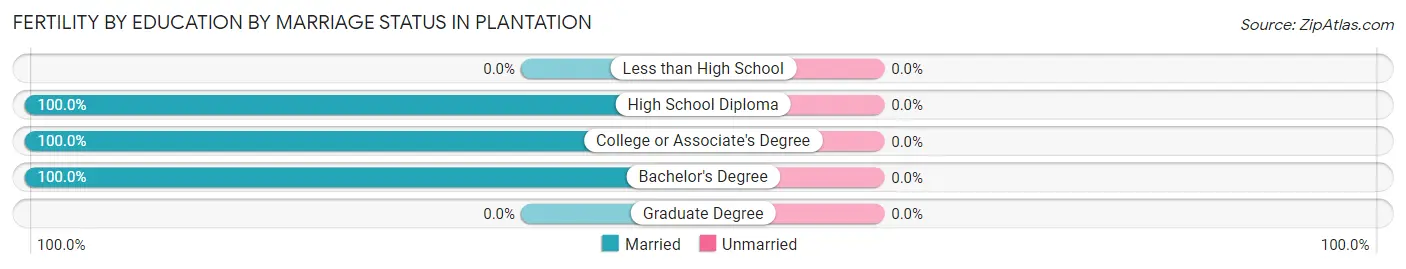
| Educational Attainment | Married | Unmarried |
| Less than High School | 0 (0.0%) | 0 (0.0%) |
| High School Diploma | 2 (100.0%) | 0 (0.0%) |
| College or Associate's Degree | 2 (100.0%) | 0 (0.0%) |
| Bachelor's Degree | 17 (100.0%) | 0 (0.0%) |
| Graduate Degree | 0 (0.0%) | 0 (0.0%) |
| Total | 21 (100.0%) | 0 (0.0%) |
Employment Characteristics in Plantation
Employment by Class of Employer in Plantation
Among the 456 employed individuals in Plantation, private company employees (335 | 73.5%), not-for-profit organizations (53 | 11.6%), and self-employed (not incorporated) (32 | 7.0%) make up the most common classes of employment.
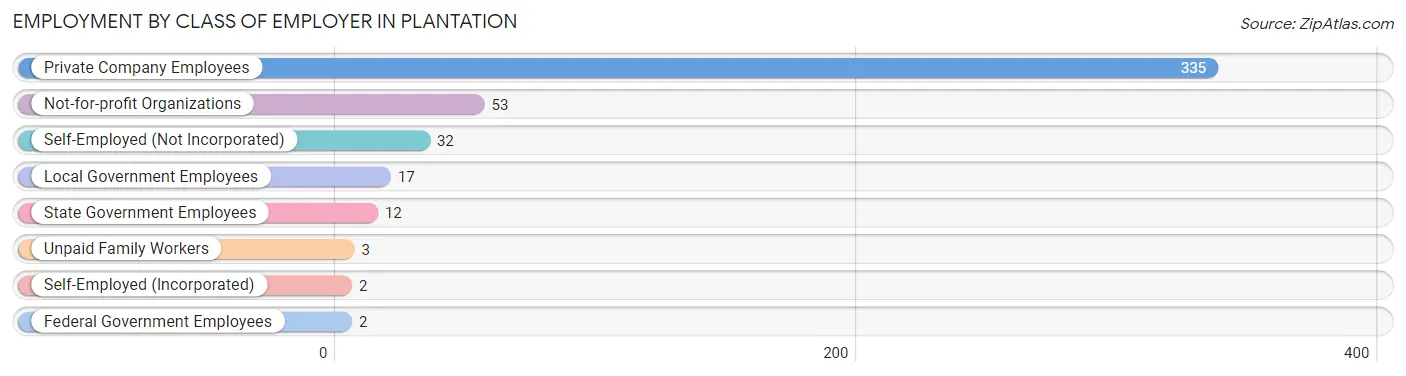
| Employer Class | # Employees | % Employees |
| Private Company Employees | 335 | 73.5% |
| Self-Employed (Incorporated) | 2 | 0.4% |
| Self-Employed (Not Incorporated) | 32 | 7.0% |
| Not-for-profit Organizations | 53 | 11.6% |
| Local Government Employees | 17 | 3.7% |
| State Government Employees | 12 | 2.6% |
| Federal Government Employees | 2 | 0.4% |
| Unpaid Family Workers | 3 | 0.7% |
| Total | 456 | 100.0% |
Employment Status by Age in Plantation
According to the labor force statistics for Plantation, out of the total population over 16 years of age (607), 78.6% or 477 individuals are in the labor force, with 3.6% or 17 of them unemployed. The age group with the highest labor force participation rate is 30 to 34 years, with 97.0% or 65 individuals in the labor force. Within the labor force, the 75 years and over age range has the highest percentage of unemployed individuals, with 33.3% or 2 of them being unemployed.
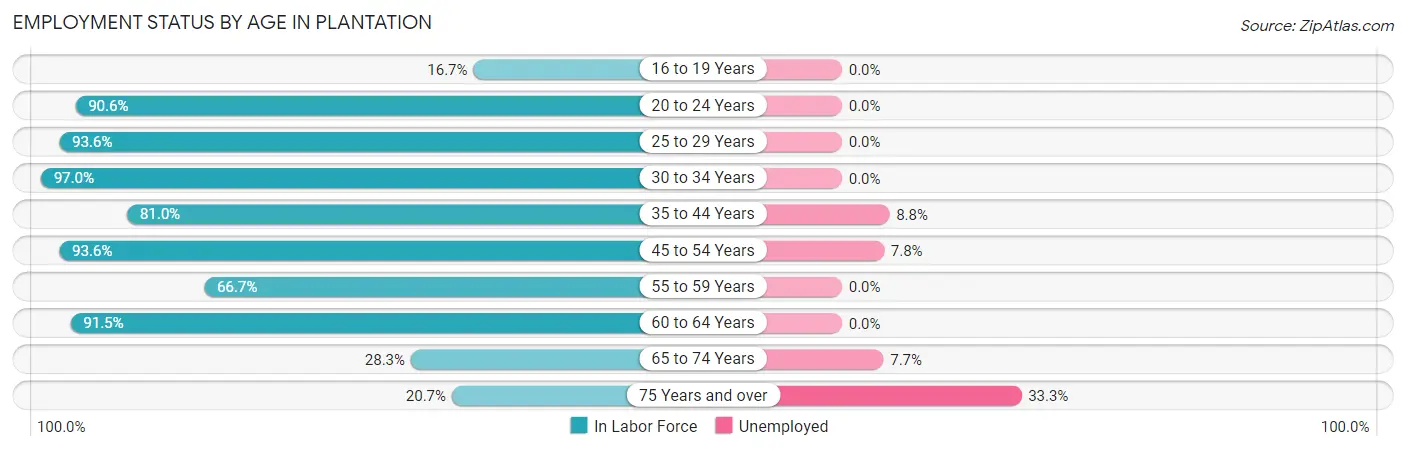
| Age Bracket | In Labor Force | Unemployed |
| 16 to 19 Years | 4 (16.7%) | 0 (0.0%) |
| 20 to 24 Years | 29 (90.6%) | 0 (0.0%) |
| 25 to 29 Years | 88 (93.6%) | 0 (0.0%) |
| 30 to 34 Years | 65 (97.0%) | 0 (0.0%) |
| 35 to 44 Years | 68 (81.0%) | 6 (8.8%) |
| 45 to 54 Years | 103 (93.6%) | 8 (7.8%) |
| 55 to 59 Years | 26 (66.7%) | 0 (0.0%) |
| 60 to 64 Years | 75 (91.5%) | 0 (0.0%) |
| 65 to 74 Years | 13 (28.3%) | 1 (7.7%) |
| 75 Years and over | 6 (20.7%) | 2 (33.3%) |
| Total | 477 (78.6%) | 17 (3.6%) |
Employment Status by Educational Attainment in Plantation
According to labor force statistics for Plantation, 89.3% of individuals (425) out of the total population between 25 and 64 years of age (476) are in the labor force, with 3.3% or 14 of them being unemployed. The group with the highest labor force participation rate are those with the educational attainment of less than high school, with 100.0% or 49 individuals in the labor force. Within the labor force, individuals with less than high school education have the highest percentage of unemployment, with 6.1% or 3 of them being unemployed.
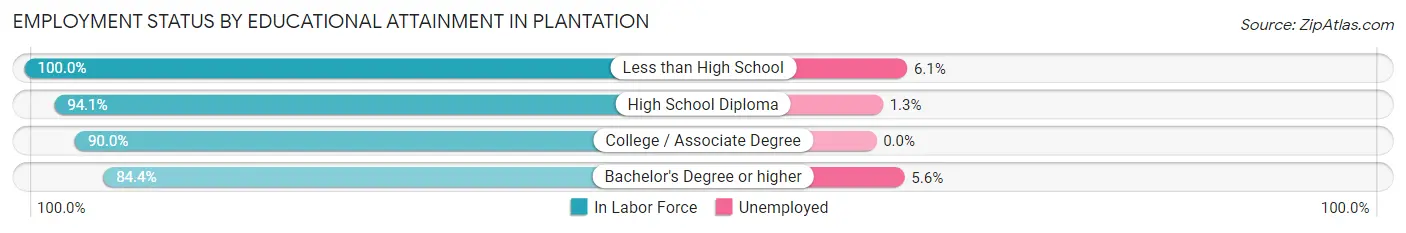
| Educational Attainment | In Labor Force | Unemployed |
| Less than High School | 49 (100.0%) | 3 (6.1%) |
| High School Diploma | 80 (94.1%) | 1 (1.3%) |
| College / Associate Degree | 117 (90.0%) | 0 (0.0%) |
| Bachelor's Degree or higher | 179 (84.4%) | 12 (5.6%) |
| Total | 425 (89.3%) | 16 (3.3%) |
Employment Occupations by Sex in Plantation
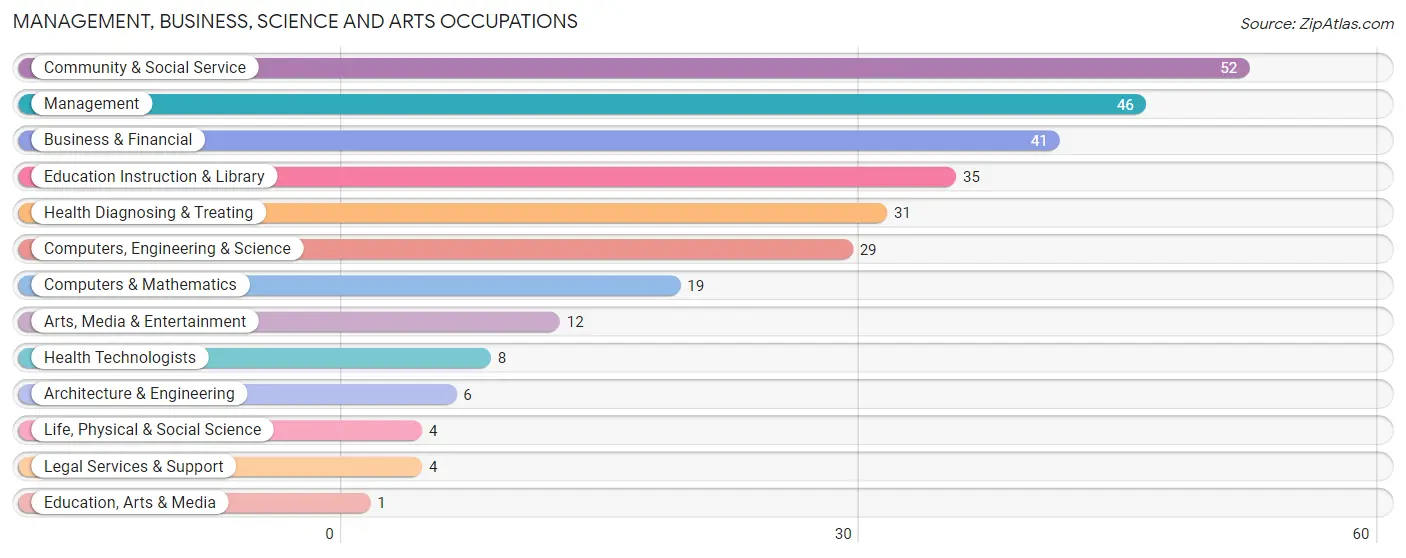
Management, Business, Science and Arts Occupations
The most common Management, Business, Science and Arts occupations in Plantation are Community & Social Service (52 | 11.3%), Management (46 | 10.0%), Business & Financial (41 | 8.9%), Education Instruction & Library (35 | 7.6%), and Health Diagnosing & Treating (31 | 6.7%).
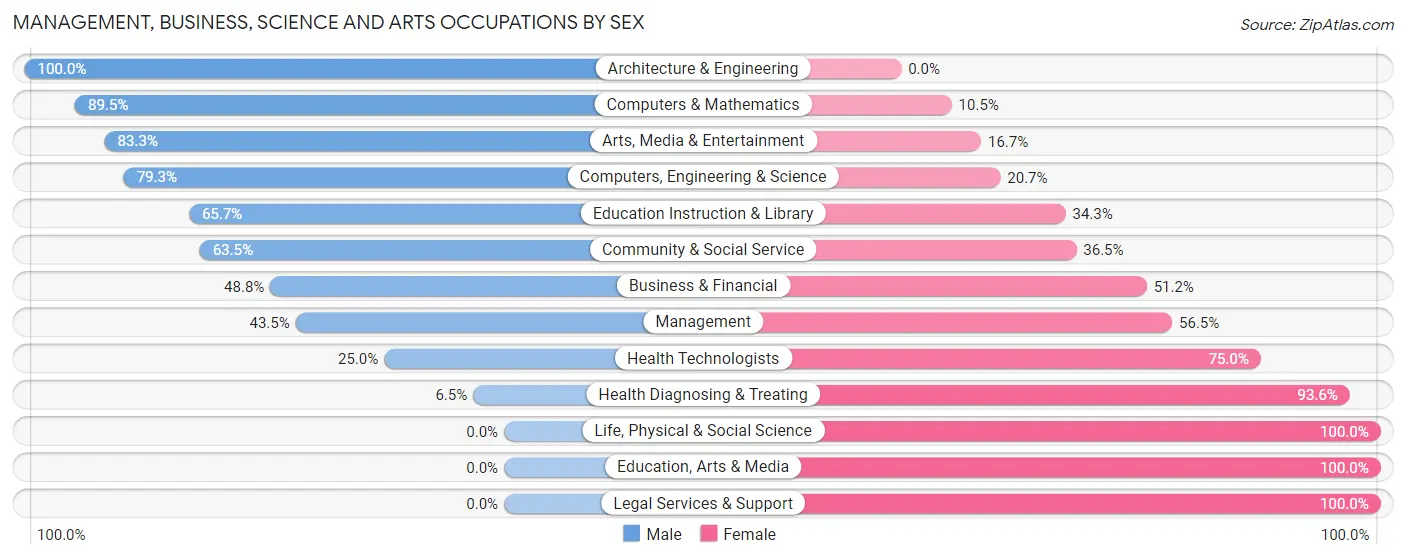
Management, Business, Science and Arts Occupations by Sex
Within the Management, Business, Science and Arts occupations in Plantation, the most male-oriented occupations are Architecture & Engineering (100.0%), Computers & Mathematics (89.5%), and Arts, Media & Entertainment (83.3%), while the most female-oriented occupations are Life, Physical & Social Science (100.0%), Education, Arts & Media (100.0%), and Legal Services & Support (100.0%).
| Occupation | Male | Female |
| Management | 20 (43.5%) | 26 (56.5%) |
| Business & Financial | 20 (48.8%) | 21 (51.2%) |
| Computers, Engineering & Science | 23 (79.3%) | 6 (20.7%) |
| Computers & Mathematics | 17 (89.5%) | 2 (10.5%) |
| Architecture & Engineering | 6 (100.0%) | 0 (0.0%) |
| Life, Physical & Social Science | 0 (0.0%) | 4 (100.0%) |
| Community & Social Service | 33 (63.5%) | 19 (36.5%) |
| Education, Arts & Media | 0 (0.0%) | 1 (100.0%) |
| Legal Services & Support | 0 (0.0%) | 4 (100.0%) |
| Education Instruction & Library | 23 (65.7%) | 12 (34.3%) |
| Arts, Media & Entertainment | 10 (83.3%) | 2 (16.7%) |
| Health Diagnosing & Treating | 2 (6.5%) | 29 (93.5%) |
| Health Technologists | 2 (25.0%) | 6 (75.0%) |
| Total (Category) | 98 (49.2%) | 101 (50.7%) |
| Total (Overall) | 214 (46.5%) | 246 (53.5%) |
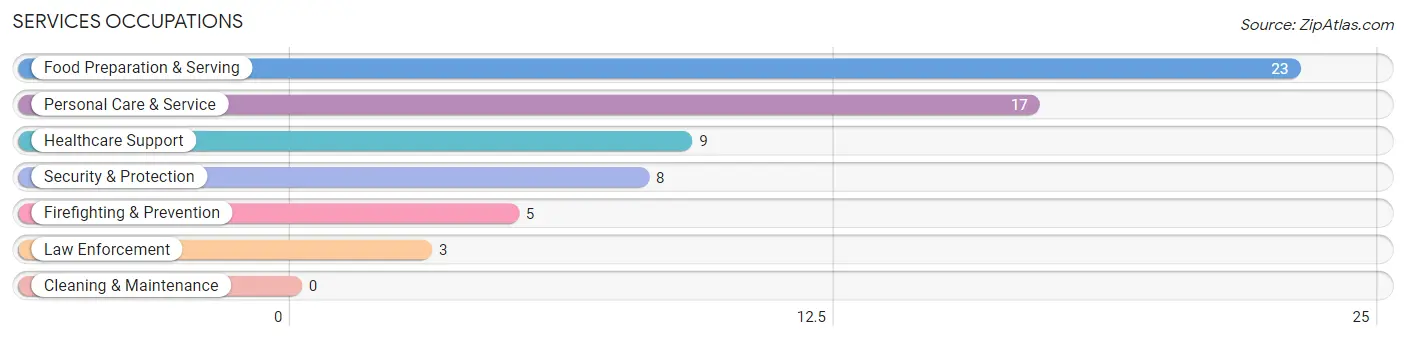
Services Occupations
The most common Services occupations in Plantation are Food Preparation & Serving (23 | 5.0%), Personal Care & Service (17 | 3.7%), Healthcare Support (9 | 2.0%), Security & Protection (8 | 1.7%), and Firefighting & Prevention (5 | 1.1%).
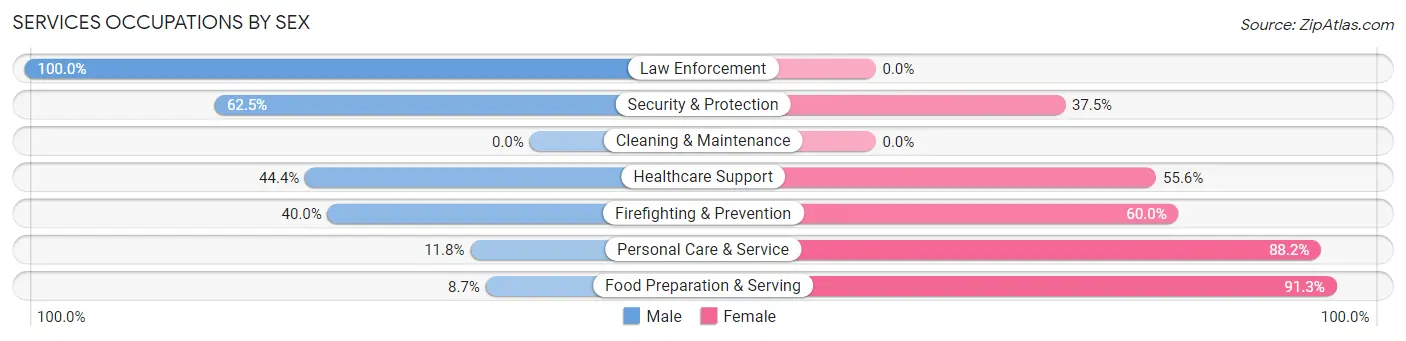
Services Occupations by Sex
Within the Services occupations in Plantation, the most male-oriented occupations are Law Enforcement (100.0%), Security & Protection (62.5%), and Healthcare Support (44.4%), while the most female-oriented occupations are Food Preparation & Serving (91.3%), Personal Care & Service (88.2%), and Firefighting & Prevention (60.0%).
| Occupation | Male | Female |
| Healthcare Support | 4 (44.4%) | 5 (55.6%) |
| Security & Protection | 5 (62.5%) | 3 (37.5%) |
| Firefighting & Prevention | 2 (40.0%) | 3 (60.0%) |
| Law Enforcement | 3 (100.0%) | 0 (0.0%) |
| Food Preparation & Serving | 2 (8.7%) | 21 (91.3%) |
| Cleaning & Maintenance | 0 (0.0%) | 0 (0.0%) |
| Personal Care & Service | 2 (11.8%) | 15 (88.2%) |
| Total (Category) | 13 (22.8%) | 44 (77.2%) |
| Total (Overall) | 214 (46.5%) | 246 (53.5%) |
Sales and Office Occupations
The most common Sales and Office occupations in Plantation are Sales & Related (59 | 12.8%), and Office & Administration (43 | 9.3%).
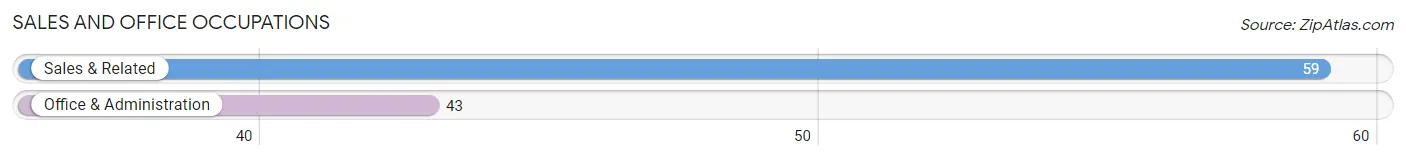
Sales and Office Occupations by Sex
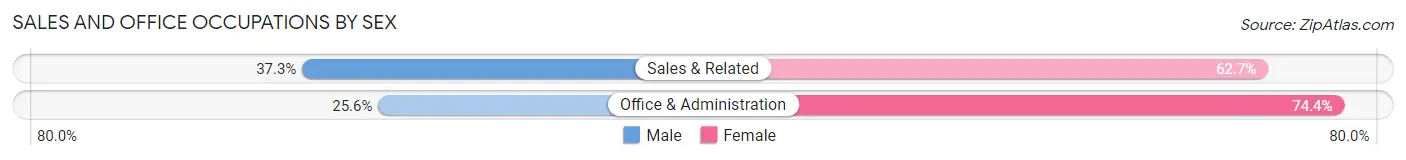
| Occupation | Male | Female |
| Sales & Related | 22 (37.3%) | 37 (62.7%) |
| Office & Administration | 11 (25.6%) | 32 (74.4%) |
| Total (Category) | 33 (32.4%) | 69 (67.6%) |
| Total (Overall) | 214 (46.5%) | 246 (53.5%) |
Natural Resources, Construction and Maintenance Occupations
The most common Natural Resources, Construction and Maintenance occupations in Plantation are Installation, Maintenance & Repair (15 | 3.3%), and Construction & Extraction (3 | 0.6%).
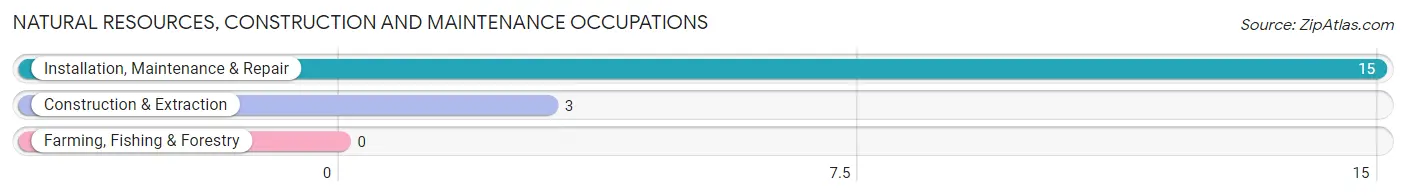
Natural Resources, Construction and Maintenance Occupations by Sex
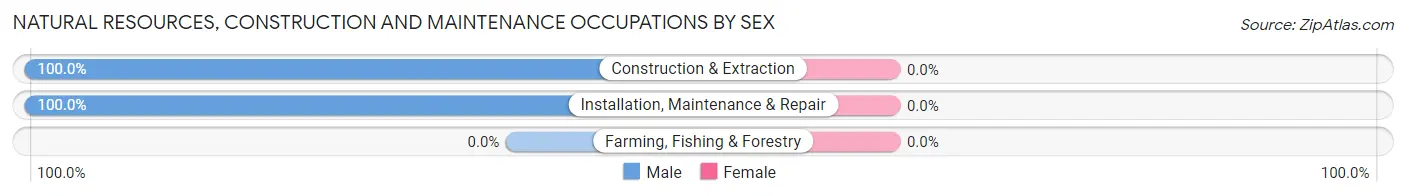
| Occupation | Male | Female |
| Farming, Fishing & Forestry | 0 (0.0%) | 0 (0.0%) |
| Construction & Extraction | 3 (100.0%) | 0 (0.0%) |
| Installation, Maintenance & Repair | 15 (100.0%) | 0 (0.0%) |
| Total (Category) | 18 (100.0%) | 0 (0.0%) |
| Total (Overall) | 214 (46.5%) | 246 (53.5%) |
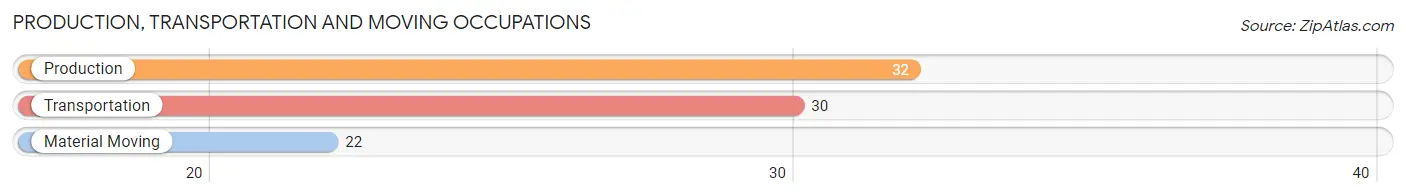
Production, Transportation and Moving Occupations
The most common Production, Transportation and Moving occupations in Plantation are Production (32 | 7.0%), Transportation (30 | 6.5%), and Material Moving (22 | 4.8%).
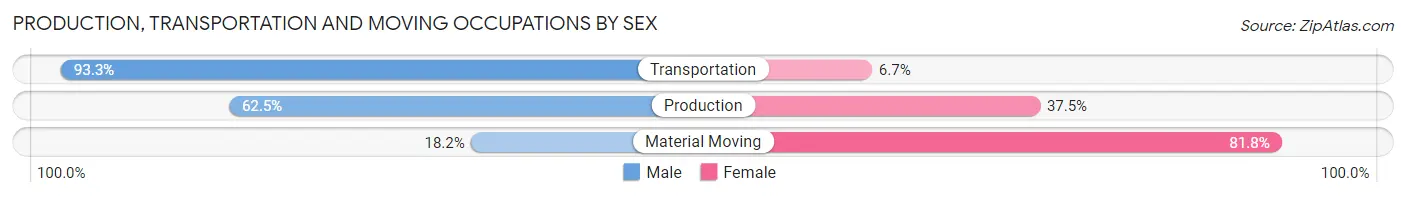
Production, Transportation and Moving Occupations by Sex
| Occupation | Male | Female |
| Production | 20 (62.5%) | 12 (37.5%) |
| Transportation | 28 (93.3%) | 2 (6.7%) |
| Material Moving | 4 (18.2%) | 18 (81.8%) |
| Total (Category) | 52 (61.9%) | 32 (38.1%) |
| Total (Overall) | 214 (46.5%) | 246 (53.5%) |
Employment Industries by Sex in Plantation
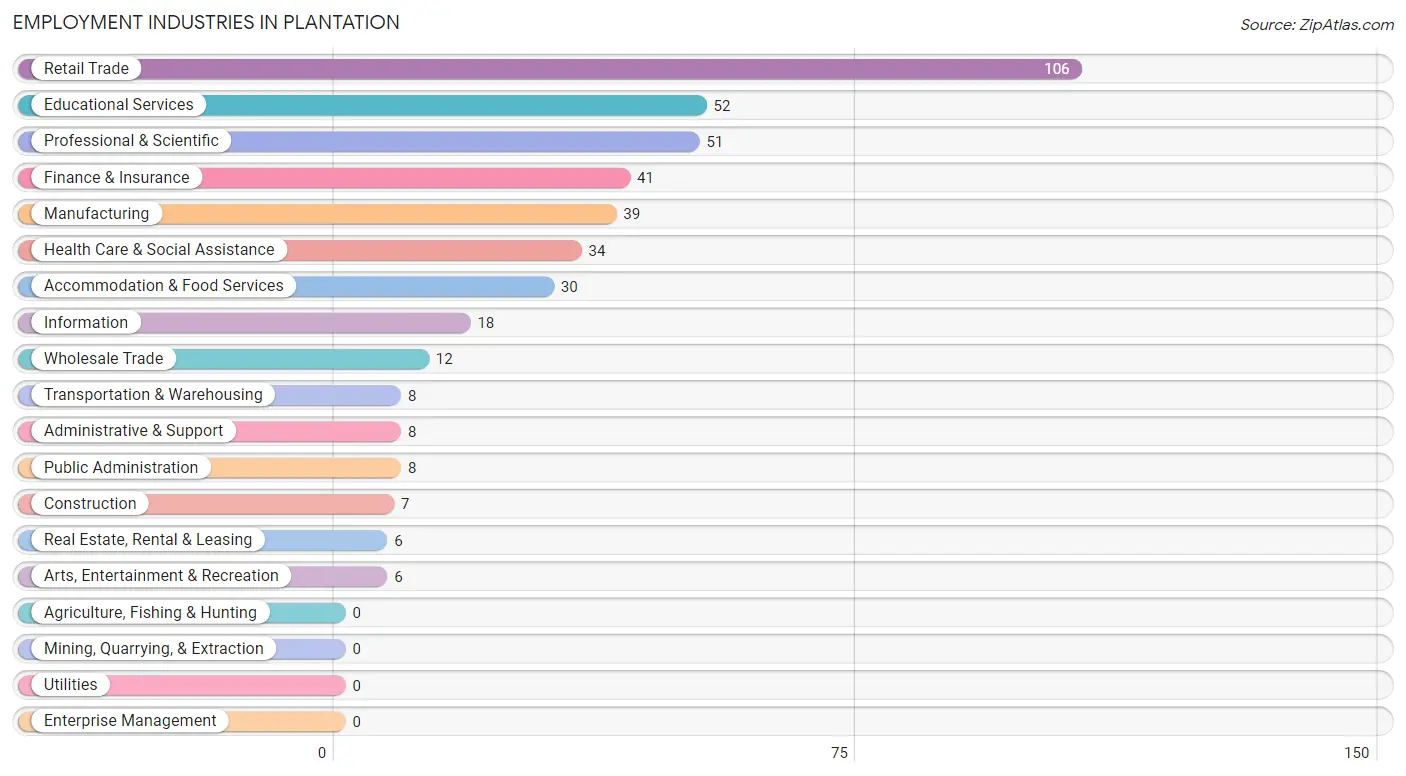
Employment Industries in Plantation
The major employment industries in Plantation include Retail Trade (106 | 23.0%), Educational Services (52 | 11.3%), Professional & Scientific (51 | 11.1%), Finance & Insurance (41 | 8.9%), and Manufacturing (39 | 8.5%).
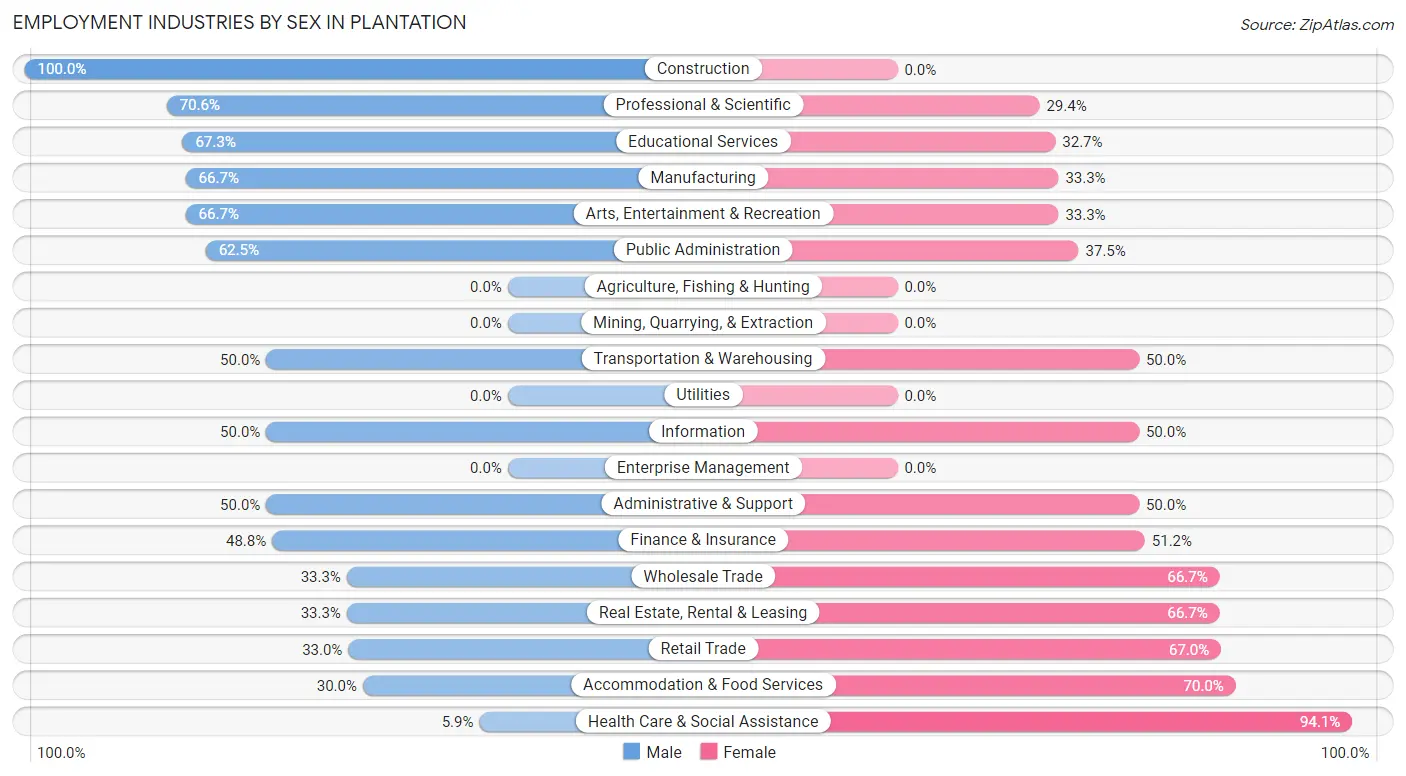
Employment Industries by Sex in Plantation
The Plantation industries that see more men than women are Construction (100.0%), Professional & Scientific (70.6%), and Educational Services (67.3%), whereas the industries that tend to have a higher number of women are Health Care & Social Assistance (94.1%), Accommodation & Food Services (70.0%), and Retail Trade (67.0%).
| Industry | Male | Female |
| Agriculture, Fishing & Hunting | 0 (0.0%) | 0 (0.0%) |
| Mining, Quarrying, & Extraction | 0 (0.0%) | 0 (0.0%) |
| Construction | 7 (100.0%) | 0 (0.0%) |
| Manufacturing | 26 (66.7%) | 13 (33.3%) |
| Wholesale Trade | 4 (33.3%) | 8 (66.7%) |
| Retail Trade | 35 (33.0%) | 71 (67.0%) |
| Transportation & Warehousing | 4 (50.0%) | 4 (50.0%) |
| Utilities | 0 (0.0%) | 0 (0.0%) |
| Information | 9 (50.0%) | 9 (50.0%) |
| Finance & Insurance | 20 (48.8%) | 21 (51.2%) |
| Real Estate, Rental & Leasing | 2 (33.3%) | 4 (66.7%) |
| Professional & Scientific | 36 (70.6%) | 15 (29.4%) |
| Enterprise Management | 0 (0.0%) | 0 (0.0%) |
| Administrative & Support | 4 (50.0%) | 4 (50.0%) |
| Educational Services | 35 (67.3%) | 17 (32.7%) |
| Health Care & Social Assistance | 2 (5.9%) | 32 (94.1%) |
| Arts, Entertainment & Recreation | 4 (66.7%) | 2 (33.3%) |
| Accommodation & Food Services | 9 (30.0%) | 21 (70.0%) |
| Public Administration | 5 (62.5%) | 3 (37.5%) |
| Total | 214 (46.5%) | 246 (53.5%) |
Education in Plantation
School Enrollment in Plantation
The most common levels of schooling among the 207 students in Plantation are nursery / preschool (69 | 33.3%), middle school (57 | 27.5%), and elementary school (34 | 16.4%).
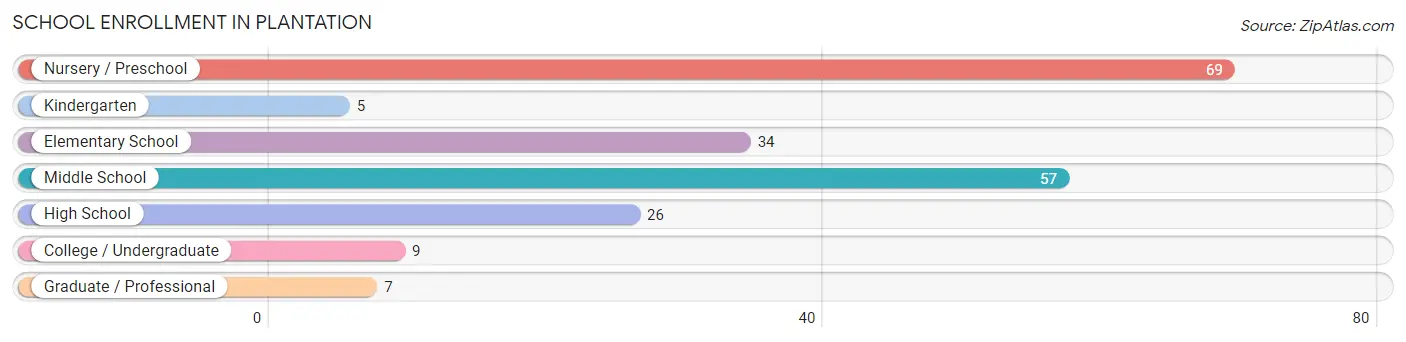
| School Level | # Students | % Students |
| Nursery / Preschool | 69 | 33.3% |
| Kindergarten | 5 | 2.4% |
| Elementary School | 34 | 16.4% |
| Middle School | 57 | 27.5% |
| High School | 26 | 12.6% |
| College / Undergraduate | 9 | 4.3% |
| Graduate / Professional | 7 | 3.4% |
| Total | 207 | 100.0% |
School Enrollment by Age by Funding Source in Plantation
Out of a total of 207 students who are enrolled in schools in Plantation, 32 (15.5%) attend a private institution, while the remaining 175 (84.5%) are enrolled in public schools. The age group of 25 to 34 year olds has the highest likelihood of being enrolled in private schools, with 4 (50.0% in the age bracket) enrolled. Conversely, the age group of 18 to 19 year olds has the lowest likelihood of being enrolled in a private school, with 11 (100.0% in the age bracket) attending a public institution.
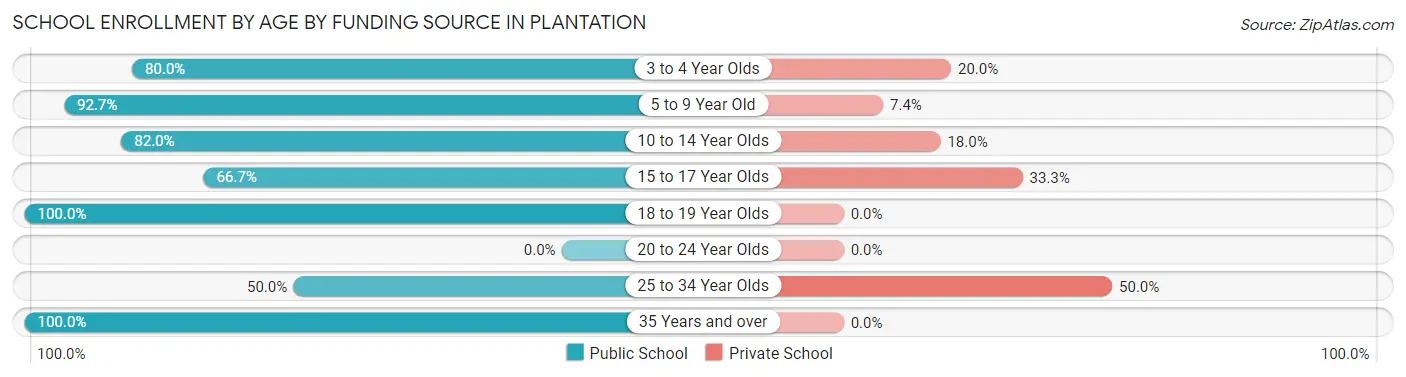
| Age Bracket | Public School | Private School |
| 3 to 4 Year Olds | 28 (80.0%) | 7 (20.0%) |
| 5 to 9 Year Old | 63 (92.6%) | 5 (7.3%) |
| 10 to 14 Year Olds | 50 (82.0%) | 11 (18.0%) |
| 15 to 17 Year Olds | 10 (66.7%) | 5 (33.3%) |
| 18 to 19 Year Olds | 11 (100.0%) | 0 (0.0%) |
| 20 to 24 Year Olds | 0 (0.0%) | 0 (0.0%) |
| 25 to 34 Year Olds | 4 (50.0%) | 4 (50.0%) |
| 35 Years and over | 9 (100.0%) | 0 (0.0%) |
| Total | 175 (84.5%) | 32 (15.5%) |
Educational Attainment by Field of Study in Plantation
Business (60 | 23.7%), literature & languages (26 | 10.3%), psychology (25 | 9.9%), science & technology (23 | 9.1%), and social sciences (21 | 8.3%) are the most common fields of study among 253 individuals in Plantation who have obtained a bachelor's degree or higher.
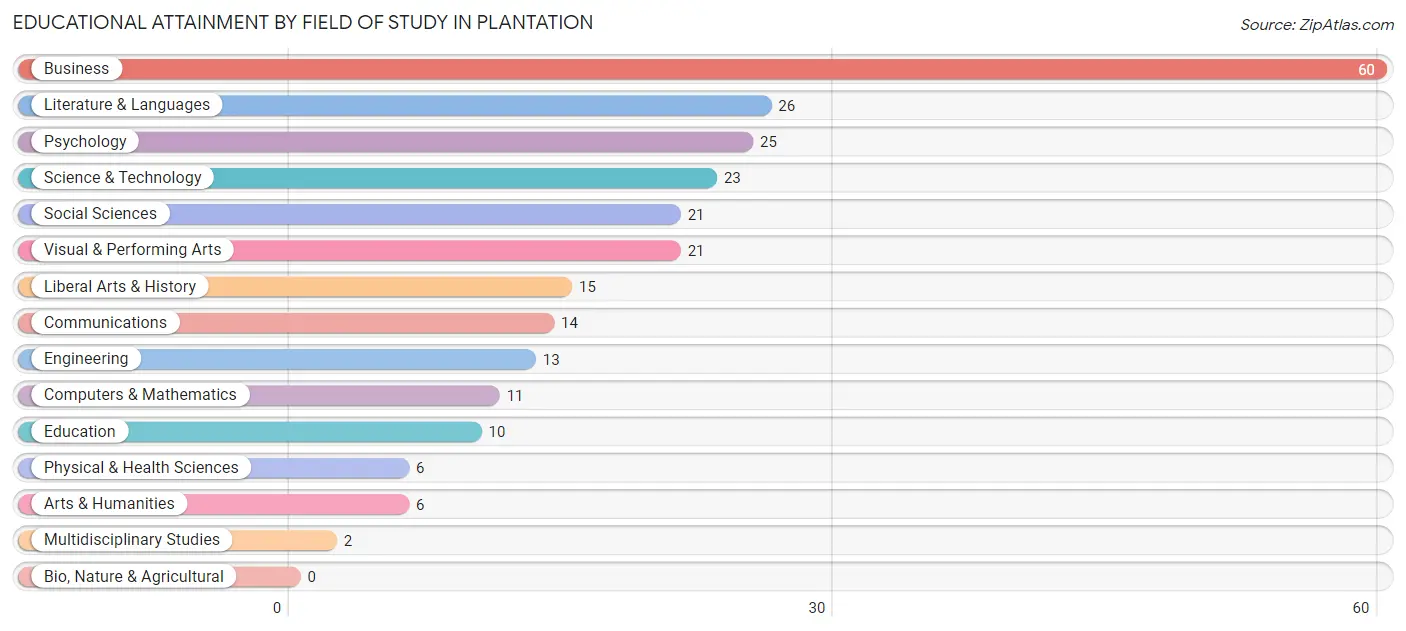
| Field of Study | # Graduates | % Graduates |
| Computers & Mathematics | 11 | 4.3% |
| Bio, Nature & Agricultural | 0 | 0.0% |
| Physical & Health Sciences | 6 | 2.4% |
| Psychology | 25 | 9.9% |
| Social Sciences | 21 | 8.3% |
| Engineering | 13 | 5.1% |
| Multidisciplinary Studies | 2 | 0.8% |
| Science & Technology | 23 | 9.1% |
| Business | 60 | 23.7% |
| Education | 10 | 4.0% |
| Literature & Languages | 26 | 10.3% |
| Liberal Arts & History | 15 | 5.9% |
| Visual & Performing Arts | 21 | 8.3% |
| Communications | 14 | 5.5% |
| Arts & Humanities | 6 | 2.4% |
| Total | 253 | 100.0% |
Transportation & Commute in Plantation
Vehicle Availability by Sex in Plantation
The most prevalent vehicle ownership categories in Plantation are males with 2 vehicles (142, accounting for 66.4%) and females with 2 vehicles (137, making up 58.7%).
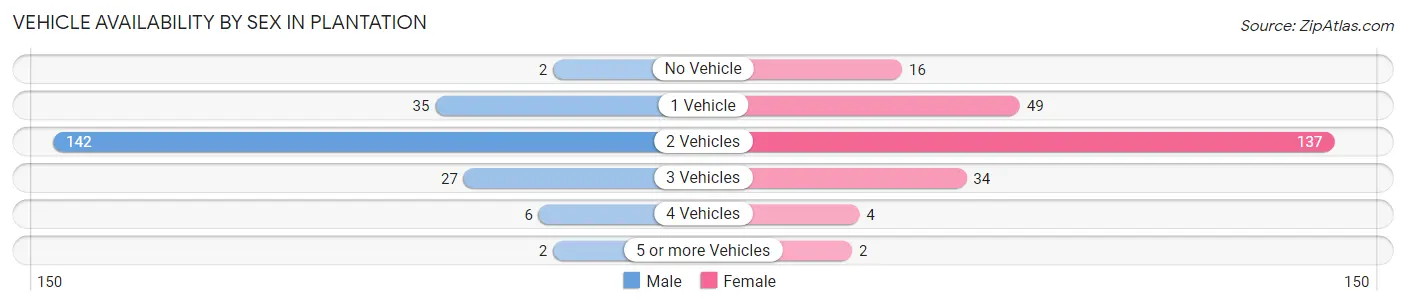
| Vehicles Available | Male | Female |
| No Vehicle | 2 (0.9%) | 16 (6.6%) |
| 1 Vehicle | 35 (16.4%) | 49 (20.3%) |
| 2 Vehicles | 142 (66.4%) | 137 (56.6%) |
| 3 Vehicles | 27 (12.6%) | 34 (14.1%) |
| 4 Vehicles | 6 (2.8%) | 4 (1.7%) |
| 5 or more Vehicles | 2 (0.9%) | 2 (0.8%) |
| Total | 214 (100.0%) | 242 (100.0%) |
Commute Time in Plantation
The most frequently occuring commute durations in Plantation are 15 to 19 minutes (101 commuters, 26.7%), 20 to 24 minutes (73 commuters, 19.3%), and 30 to 34 minutes (68 commuters, 17.9%).
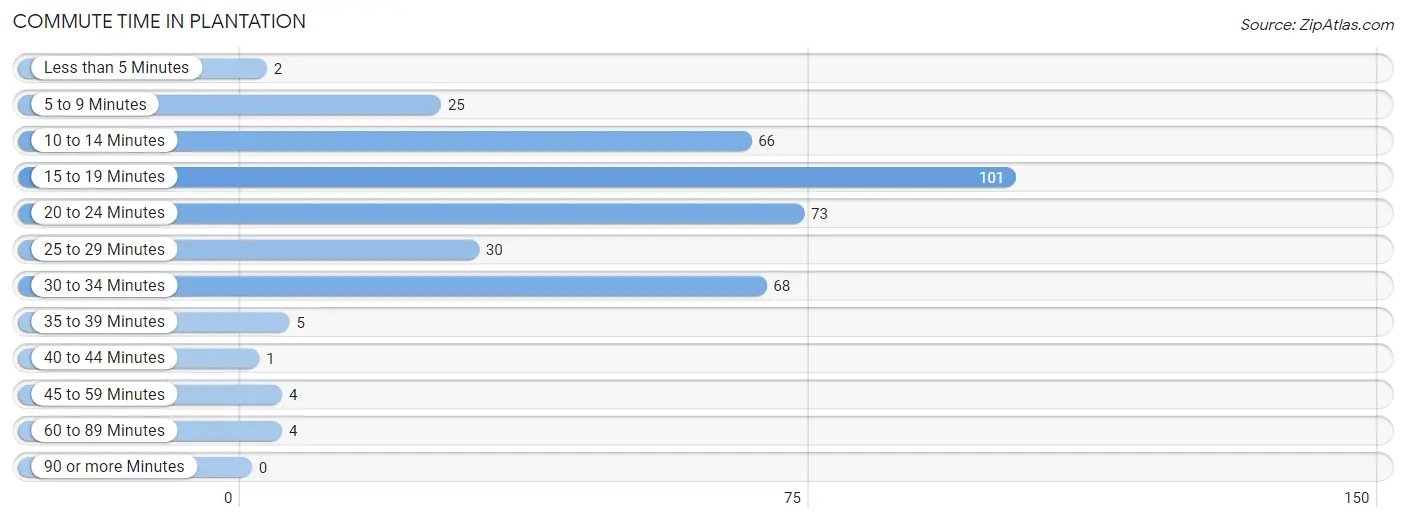
| Commute Time | # Commuters | % Commuters |
| Less than 5 Minutes | 2 | 0.5% |
| 5 to 9 Minutes | 25 | 6.6% |
| 10 to 14 Minutes | 66 | 17.4% |
| 15 to 19 Minutes | 101 | 26.7% |
| 20 to 24 Minutes | 73 | 19.3% |
| 25 to 29 Minutes | 30 | 7.9% |
| 30 to 34 Minutes | 68 | 17.9% |
| 35 to 39 Minutes | 5 | 1.3% |
| 40 to 44 Minutes | 1 | 0.3% |
| 45 to 59 Minutes | 4 | 1.1% |
| 60 to 89 Minutes | 4 | 1.1% |
| 90 or more Minutes | 0 | 0.0% |
Commute Time by Sex in Plantation
The most common commute times in Plantation are 15 to 19 minutes (47 commuters, 25.5%) for males and 15 to 19 minutes (54 commuters, 27.7%) for females.
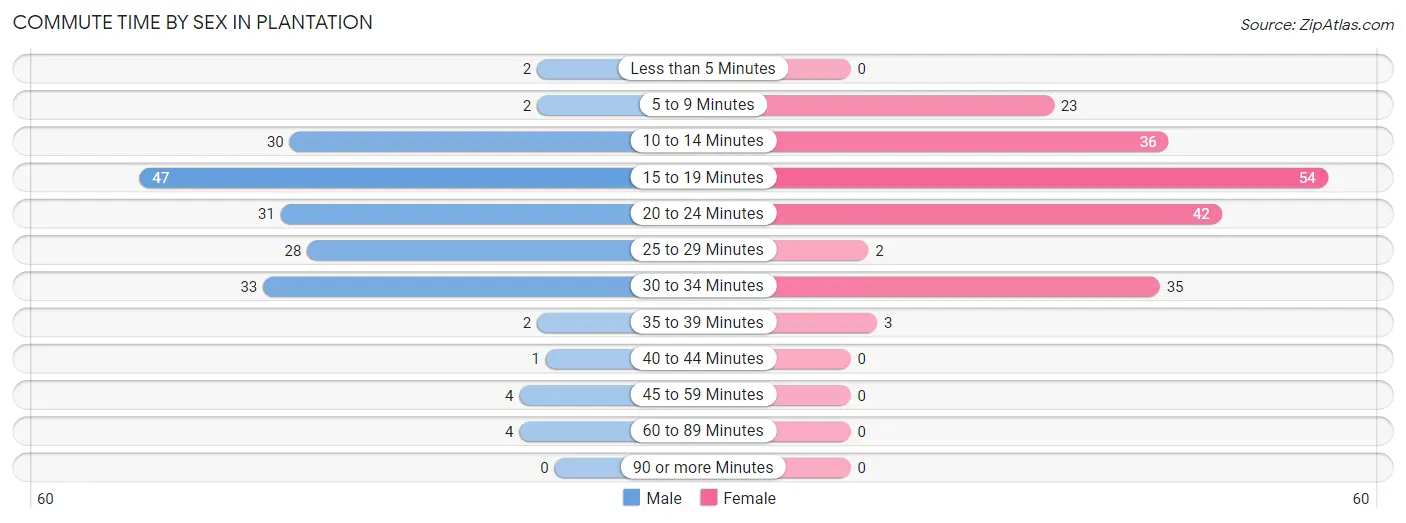
| Commute Time | Male | Female |
| Less than 5 Minutes | 2 (1.1%) | 0 (0.0%) |
| 5 to 9 Minutes | 2 (1.1%) | 23 (11.8%) |
| 10 to 14 Minutes | 30 (16.3%) | 36 (18.5%) |
| 15 to 19 Minutes | 47 (25.5%) | 54 (27.7%) |
| 20 to 24 Minutes | 31 (16.9%) | 42 (21.5%) |
| 25 to 29 Minutes | 28 (15.2%) | 2 (1.0%) |
| 30 to 34 Minutes | 33 (17.9%) | 35 (17.9%) |
| 35 to 39 Minutes | 2 (1.1%) | 3 (1.5%) |
| 40 to 44 Minutes | 1 (0.5%) | 0 (0.0%) |
| 45 to 59 Minutes | 4 (2.2%) | 0 (0.0%) |
| 60 to 89 Minutes | 4 (2.2%) | 0 (0.0%) |
| 90 or more Minutes | 0 (0.0%) | 0 (0.0%) |
Time of Departure to Work by Sex in Plantation
The most frequent times of departure to work in Plantation are 9:00 AM to 9:59 AM (30, 16.3%) for males and 8:30 AM to 8:59 AM (27, 13.9%) for females.
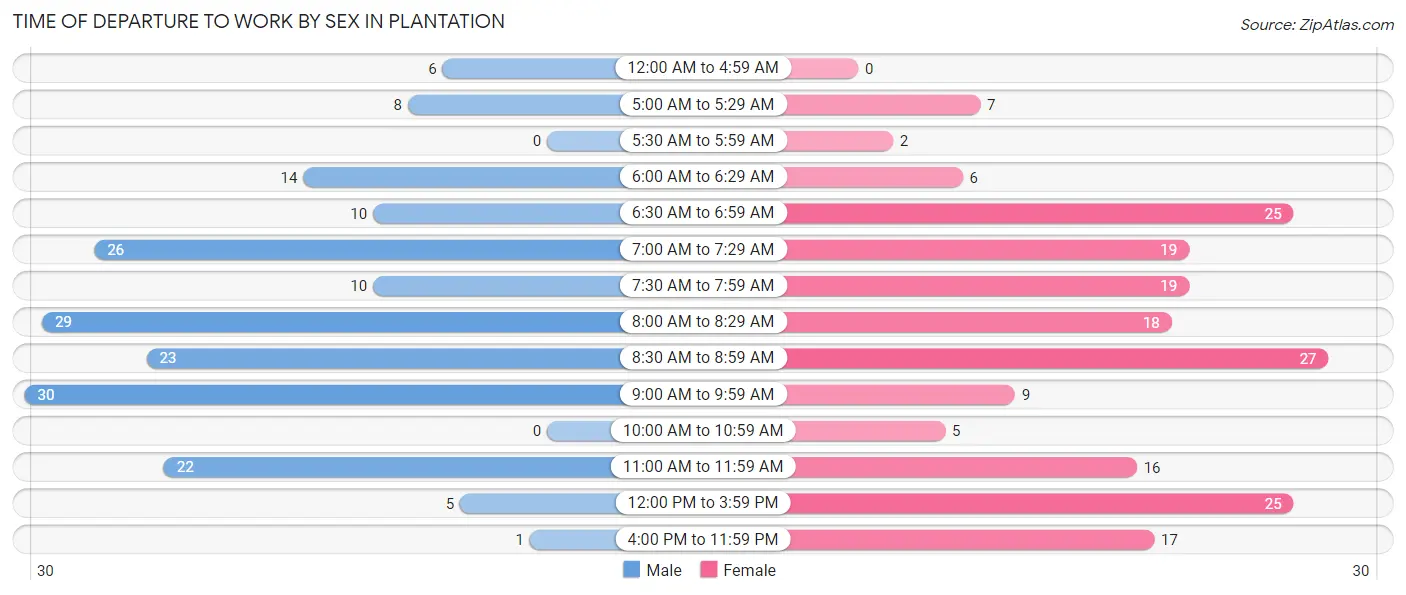
| Time of Departure | Male | Female |
| 12:00 AM to 4:59 AM | 6 (3.3%) | 0 (0.0%) |
| 5:00 AM to 5:29 AM | 8 (4.3%) | 7 (3.6%) |
| 5:30 AM to 5:59 AM | 0 (0.0%) | 2 (1.0%) |
| 6:00 AM to 6:29 AM | 14 (7.6%) | 6 (3.1%) |
| 6:30 AM to 6:59 AM | 10 (5.4%) | 25 (12.8%) |
| 7:00 AM to 7:29 AM | 26 (14.1%) | 19 (9.7%) |
| 7:30 AM to 7:59 AM | 10 (5.4%) | 19 (9.7%) |
| 8:00 AM to 8:29 AM | 29 (15.8%) | 18 (9.2%) |
| 8:30 AM to 8:59 AM | 23 (12.5%) | 27 (13.9%) |
| 9:00 AM to 9:59 AM | 30 (16.3%) | 9 (4.6%) |
| 10:00 AM to 10:59 AM | 0 (0.0%) | 5 (2.6%) |
| 11:00 AM to 11:59 AM | 22 (12.0%) | 16 (8.2%) |
| 12:00 PM to 3:59 PM | 5 (2.7%) | 25 (12.8%) |
| 4:00 PM to 11:59 PM | 1 (0.5%) | 17 (8.7%) |
| Total | 184 (100.0%) | 195 (100.0%) |
Housing Occupancy in Plantation
Occupancy by Ownership in Plantation
Of the total 325 dwellings in Plantation, owner-occupied units account for 256 (78.8%), while renter-occupied units make up 69 (21.2%).
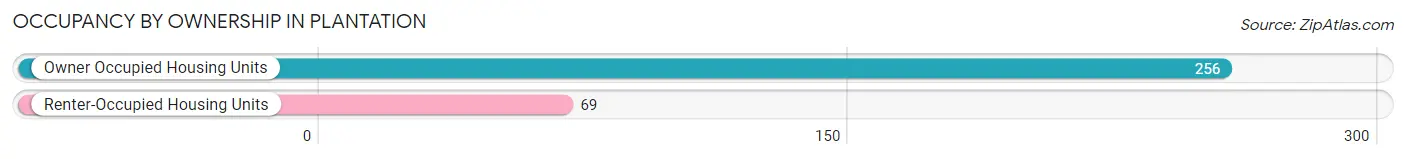
| Occupancy | # Housing Units | % Housing Units |
| Owner Occupied Housing Units | 256 | 78.8% |
| Renter-Occupied Housing Units | 69 | 21.2% |
| Total Occupied Housing Units | 325 | 100.0% |
Occupancy by Household Size in Plantation
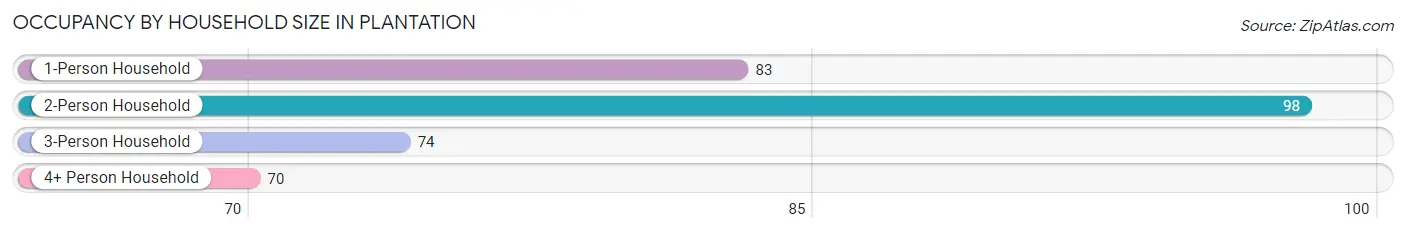
| Household Size | # Housing Units | % Housing Units |
| 1-Person Household | 83 | 25.5% |
| 2-Person Household | 98 | 30.1% |
| 3-Person Household | 74 | 22.8% |
| 4+ Person Household | 70 | 21.5% |
| Total Housing Units | 325 | 100.0% |
Occupancy by Ownership by Household Size in Plantation
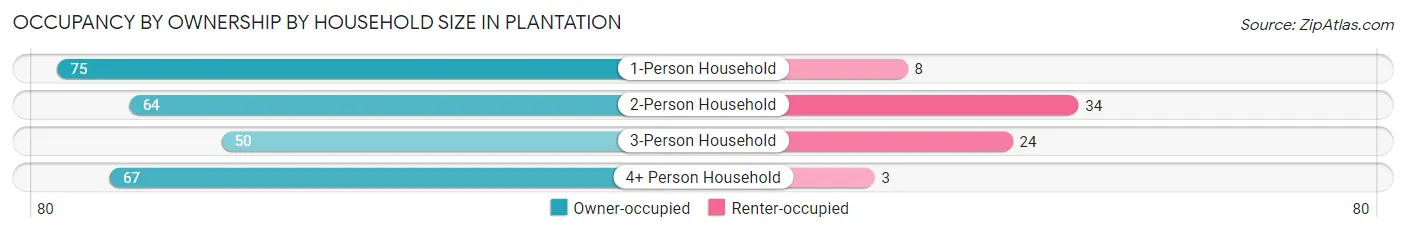
| Household Size | Owner-occupied | Renter-occupied |
| 1-Person Household | 75 (90.4%) | 8 (9.6%) |
| 2-Person Household | 64 (65.3%) | 34 (34.7%) |
| 3-Person Household | 50 (67.6%) | 24 (32.4%) |
| 4+ Person Household | 67 (95.7%) | 3 (4.3%) |
| Total Housing Units | 256 (78.8%) | 69 (21.2%) |
Occupancy by Educational Attainment in Plantation
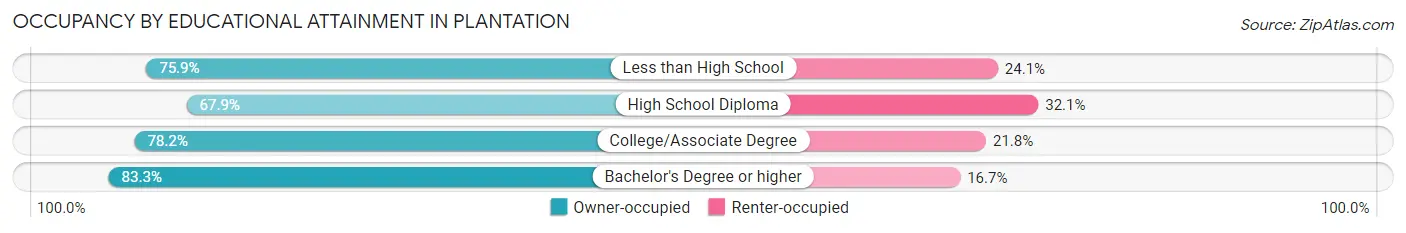
| Household Size | Owner-occupied | Renter-occupied |
| Less than High School | 22 (75.9%) | 7 (24.1%) |
| High School Diploma | 38 (67.9%) | 18 (32.1%) |
| College/Associate Degree | 61 (78.2%) | 17 (21.8%) |
| Bachelor's Degree or higher | 135 (83.3%) | 27 (16.7%) |
Occupancy by Age of Householder in Plantation
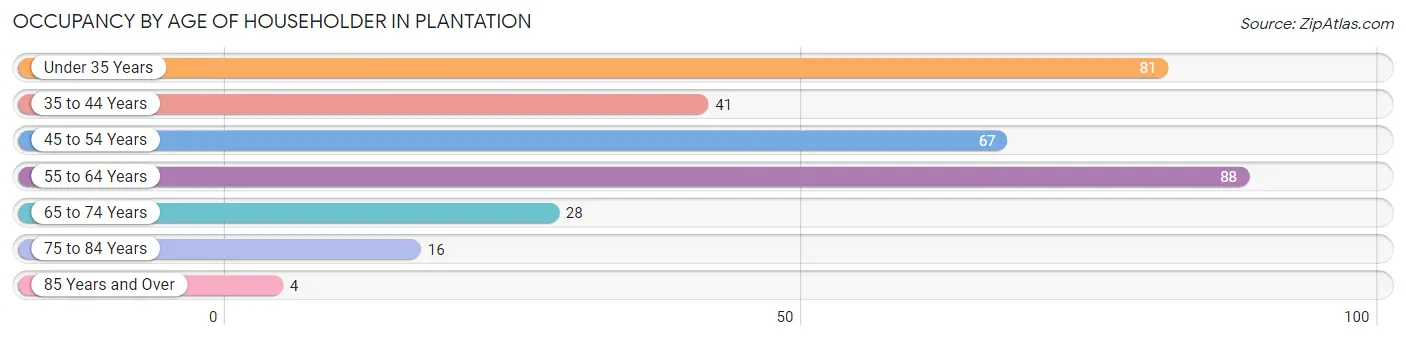
| Age Bracket | # Households | % Households |
| Under 35 Years | 81 | 24.9% |
| 35 to 44 Years | 41 | 12.6% |
| 45 to 54 Years | 67 | 20.6% |
| 55 to 64 Years | 88 | 27.1% |
| 65 to 74 Years | 28 | 8.6% |
| 75 to 84 Years | 16 | 4.9% |
| 85 Years and Over | 4 | 1.2% |
| Total | 325 | 100.0% |
Housing Finances in Plantation
Median Income by Occupancy in Plantation
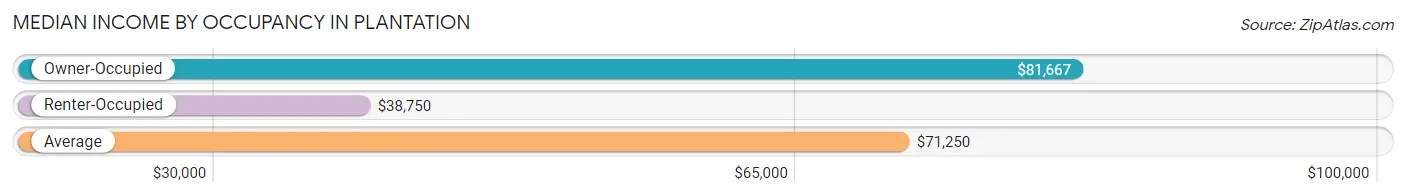
| Occupancy Type | # Households | Median Income |
| Owner-Occupied | 256 (78.8%) | $81,667 |
| Renter-Occupied | 69 (21.2%) | $38,750 |
| Average | 325 (100.0%) | $71,250 |
Occupancy by Householder Income Bracket in Plantation
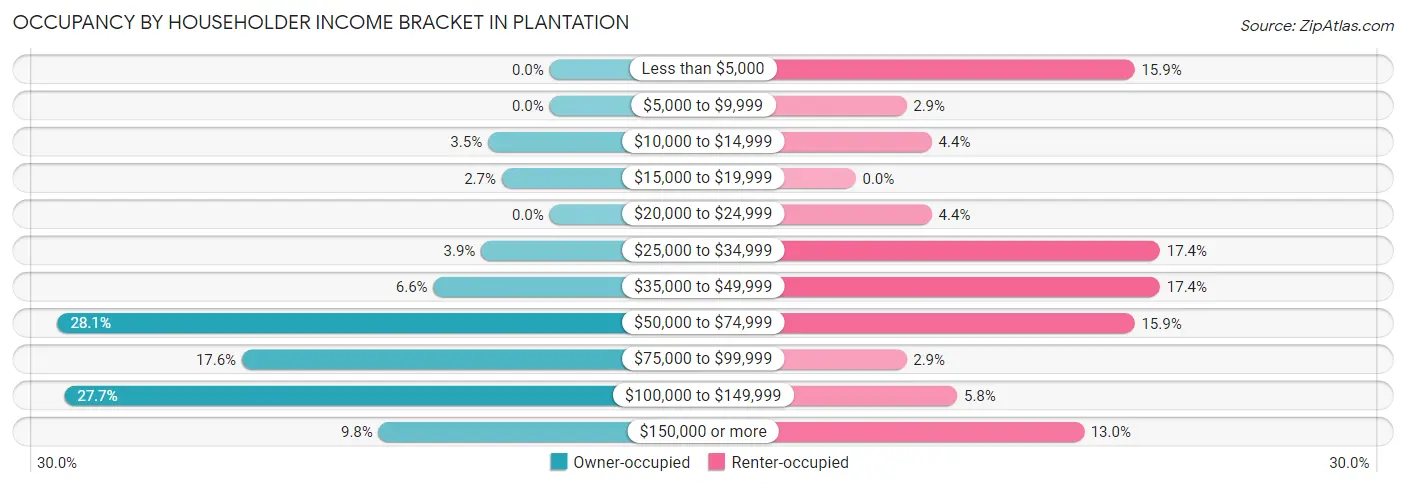
| Income Bracket | Owner-occupied | Renter-occupied |
| Less than $5,000 | 0 (0.0%) | 11 (15.9%) |
| $5,000 to $9,999 | 0 (0.0%) | 2 (2.9%) |
| $10,000 to $14,999 | 9 (3.5%) | 3 (4.3%) |
| $15,000 to $19,999 | 7 (2.7%) | 0 (0.0%) |
| $20,000 to $24,999 | 0 (0.0%) | 3 (4.3%) |
| $25,000 to $34,999 | 10 (3.9%) | 12 (17.4%) |
| $35,000 to $49,999 | 17 (6.6%) | 12 (17.4%) |
| $50,000 to $74,999 | 72 (28.1%) | 11 (15.9%) |
| $75,000 to $99,999 | 45 (17.6%) | 2 (2.9%) |
| $100,000 to $149,999 | 71 (27.7%) | 4 (5.8%) |
| $150,000 or more | 25 (9.8%) | 9 (13.0%) |
| Total | 256 (100.0%) | 69 (100.0%) |
Monthly Housing Cost Tiers in Plantation
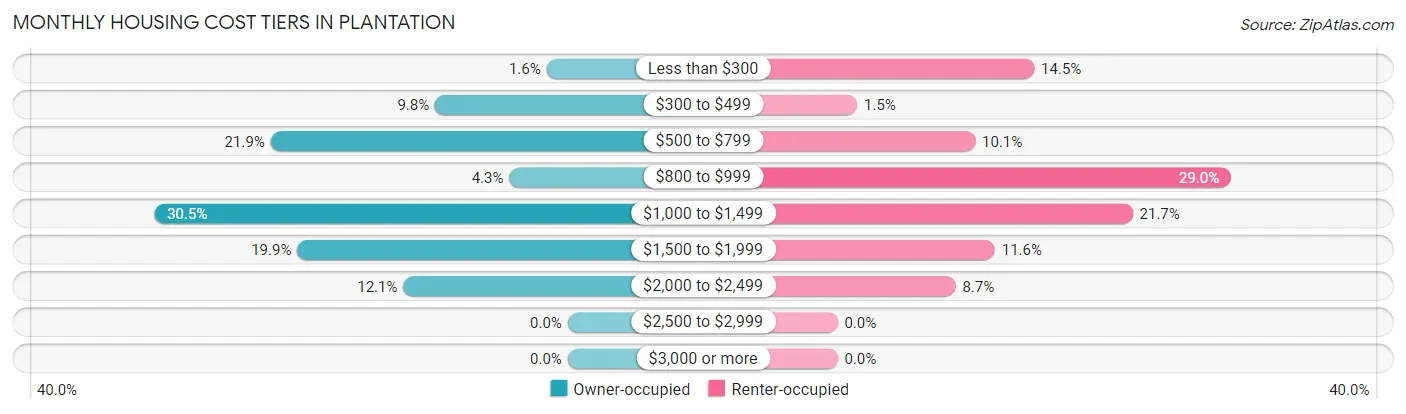
| Monthly Cost | Owner-occupied | Renter-occupied |
| Less than $300 | 4 (1.6%) | 10 (14.5%) |
| $300 to $499 | 25 (9.8%) | 1 (1.5%) |
| $500 to $799 | 56 (21.9%) | 7 (10.1%) |
| $800 to $999 | 11 (4.3%) | 20 (29.0%) |
| $1,000 to $1,499 | 78 (30.5%) | 15 (21.7%) |
| $1,500 to $1,999 | 51 (19.9%) | 8 (11.6%) |
| $2,000 to $2,499 | 31 (12.1%) | 6 (8.7%) |
| $2,500 to $2,999 | 0 (0.0%) | 0 (0.0%) |
| $3,000 or more | 0 (0.0%) | 0 (0.0%) |
| Total | 256 (100.0%) | 69 (100.0%) |
Physical Housing Characteristics in Plantation
Housing Structures in Plantation
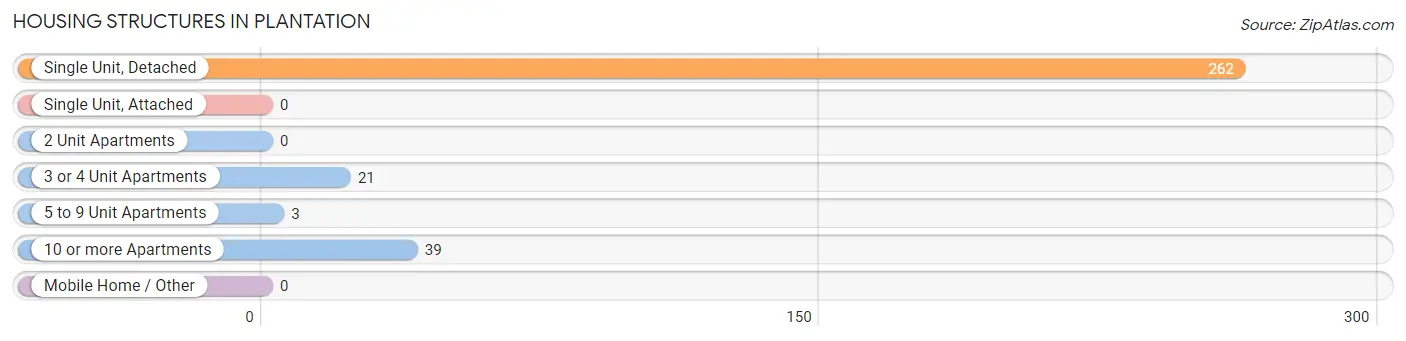
| Structure Type | # Housing Units | % Housing Units |
| Single Unit, Detached | 262 | 80.6% |
| Single Unit, Attached | 0 | 0.0% |
| 2 Unit Apartments | 0 | 0.0% |
| 3 or 4 Unit Apartments | 21 | 6.5% |
| 5 to 9 Unit Apartments | 3 | 0.9% |
| 10 or more Apartments | 39 | 12.0% |
| Mobile Home / Other | 0 | 0.0% |
| Total | 325 | 100.0% |
Housing Structures by Occupancy in Plantation
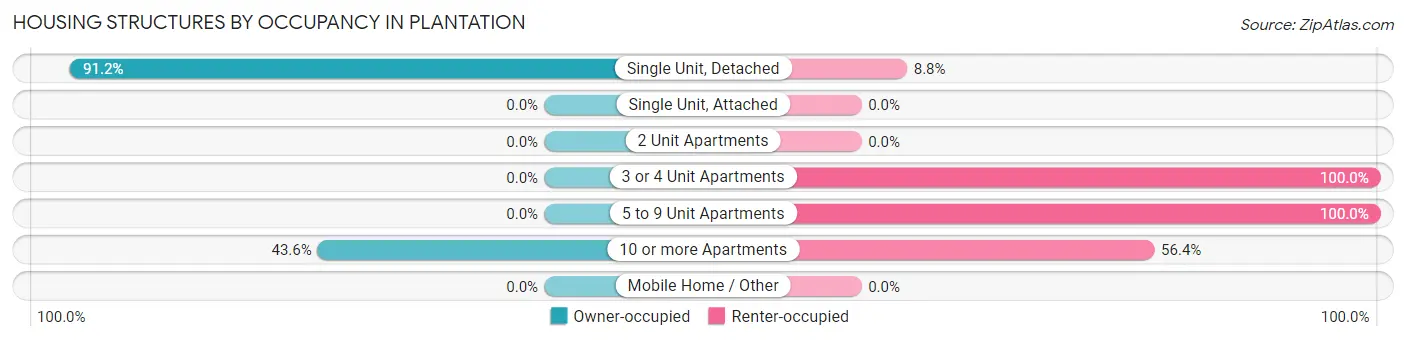
| Structure Type | Owner-occupied | Renter-occupied |
| Single Unit, Detached | 239 (91.2%) | 23 (8.8%) |
| Single Unit, Attached | 0 (0.0%) | 0 (0.0%) |
| 2 Unit Apartments | 0 (0.0%) | 0 (0.0%) |
| 3 or 4 Unit Apartments | 0 (0.0%) | 21 (100.0%) |
| 5 to 9 Unit Apartments | 0 (0.0%) | 3 (100.0%) |
| 10 or more Apartments | 17 (43.6%) | 22 (56.4%) |
| Mobile Home / Other | 0 (0.0%) | 0 (0.0%) |
| Total | 256 (78.8%) | 69 (21.2%) |
Housing Structures by Number of Rooms in Plantation
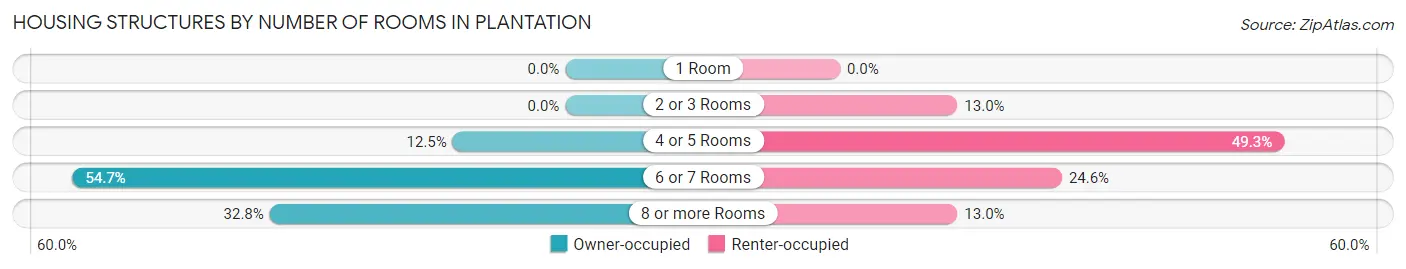
| Number of Rooms | Owner-occupied | Renter-occupied |
| 1 Room | 0 (0.0%) | 0 (0.0%) |
| 2 or 3 Rooms | 0 (0.0%) | 9 (13.0%) |
| 4 or 5 Rooms | 32 (12.5%) | 34 (49.3%) |
| 6 or 7 Rooms | 140 (54.7%) | 17 (24.6%) |
| 8 or more Rooms | 84 (32.8%) | 9 (13.0%) |
| Total | 256 (100.0%) | 69 (100.0%) |
Housing Structure by Heating Type in Plantation
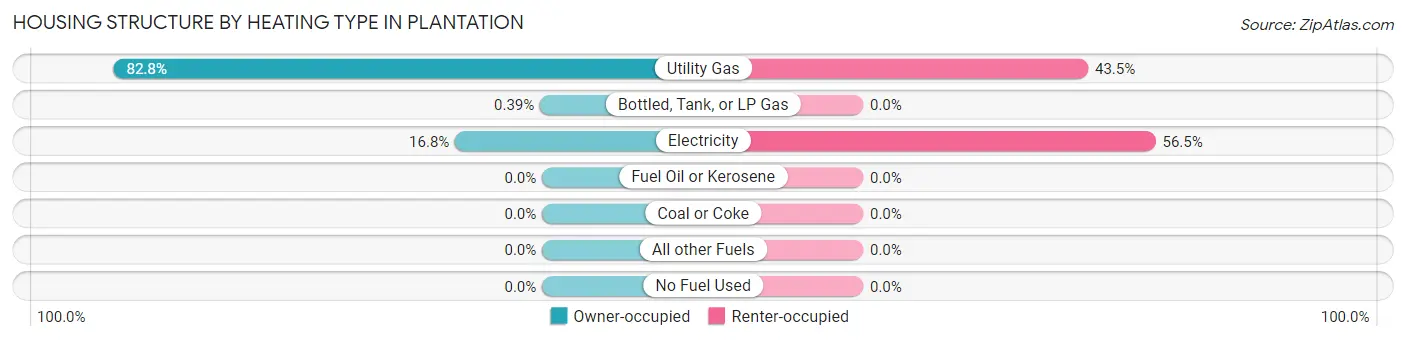
| Heating Type | Owner-occupied | Renter-occupied |
| Utility Gas | 212 (82.8%) | 30 (43.5%) |
| Bottled, Tank, or LP Gas | 1 (0.4%) | 0 (0.0%) |
| Electricity | 43 (16.8%) | 39 (56.5%) |
| Fuel Oil or Kerosene | 0 (0.0%) | 0 (0.0%) |
| Coal or Coke | 0 (0.0%) | 0 (0.0%) |
| All other Fuels | 0 (0.0%) | 0 (0.0%) |
| No Fuel Used | 0 (0.0%) | 0 (0.0%) |
| Total | 256 (100.0%) | 69 (100.0%) |
Household Vehicle Usage in Plantation
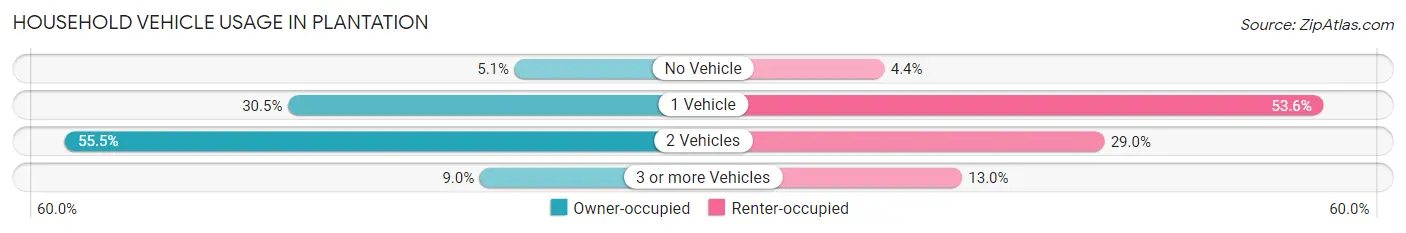
| Vehicles per Household | Owner-occupied | Renter-occupied |
| No Vehicle | 13 (5.1%) | 3 (4.3%) |
| 1 Vehicle | 78 (30.5%) | 37 (53.6%) |
| 2 Vehicles | 142 (55.5%) | 20 (29.0%) |
| 3 or more Vehicles | 23 (9.0%) | 9 (13.0%) |
| Total | 256 (100.0%) | 69 (100.0%) |
Real Estate & Mortgages in Plantation
Real Estate and Mortgage Overview in Plantation
| Characteristic | Without Mortgage | With Mortgage |
| Housing Units | 83 | 173 |
| Median Property Value | $149,500 | $226,400 |
| Median Household Income | $55,625 | $22 |
| Monthly Housing Costs | $539 | $0 |
| Real Estate Taxes | $1,440 | $0 |
Property Value by Mortgage Status in Plantation
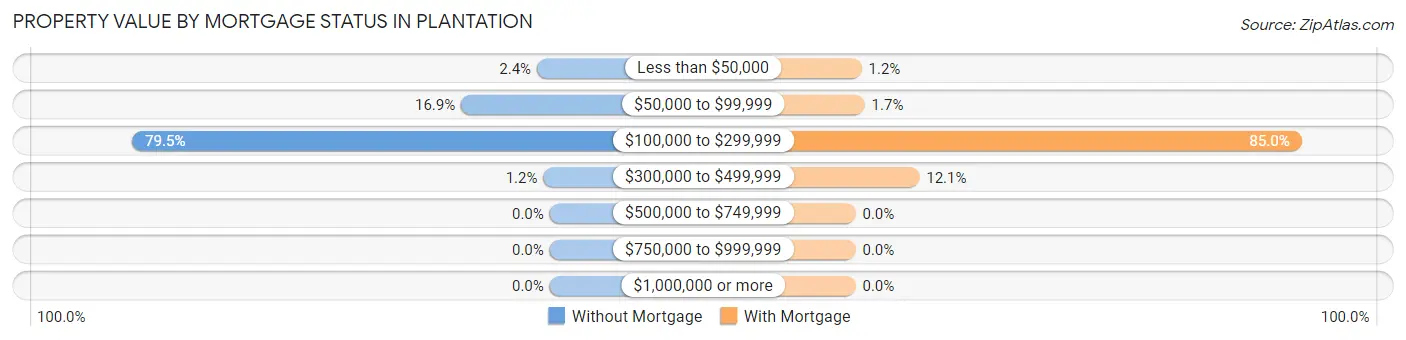
| Property Value | Without Mortgage | With Mortgage |
| Less than $50,000 | 2 (2.4%) | 2 (1.2%) |
| $50,000 to $99,999 | 14 (16.9%) | 3 (1.7%) |
| $100,000 to $299,999 | 66 (79.5%) | 147 (85.0%) |
| $300,000 to $499,999 | 1 (1.2%) | 21 (12.1%) |
| $500,000 to $749,999 | 0 (0.0%) | 0 (0.0%) |
| $750,000 to $999,999 | 0 (0.0%) | 0 (0.0%) |
| $1,000,000 or more | 0 (0.0%) | 0 (0.0%) |
| Total | 83 (100.0%) | 173 (100.0%) |
Household Income by Mortgage Status in Plantation
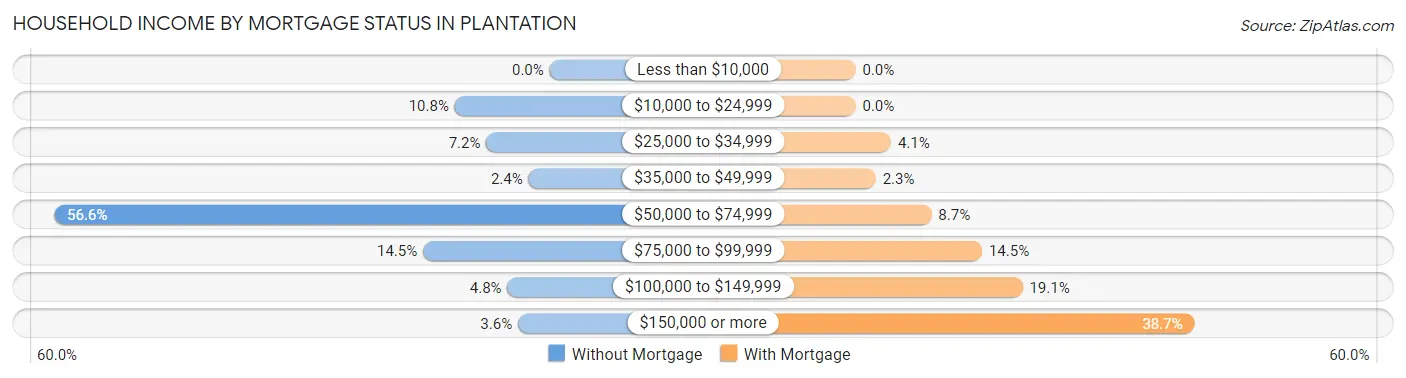
| Household Income | Without Mortgage | With Mortgage |
| Less than $10,000 | 0 (0.0%) | 0 (0.0%) |
| $10,000 to $24,999 | 9 (10.8%) | 0 (0.0%) |
| $25,000 to $34,999 | 6 (7.2%) | 7 (4.1%) |
| $35,000 to $49,999 | 2 (2.4%) | 4 (2.3%) |
| $50,000 to $74,999 | 47 (56.6%) | 15 (8.7%) |
| $75,000 to $99,999 | 12 (14.5%) | 25 (14.4%) |
| $100,000 to $149,999 | 4 (4.8%) | 33 (19.1%) |
| $150,000 or more | 3 (3.6%) | 67 (38.7%) |
| Total | 83 (100.0%) | 173 (100.0%) |
Property Value to Household Income Ratio in Plantation
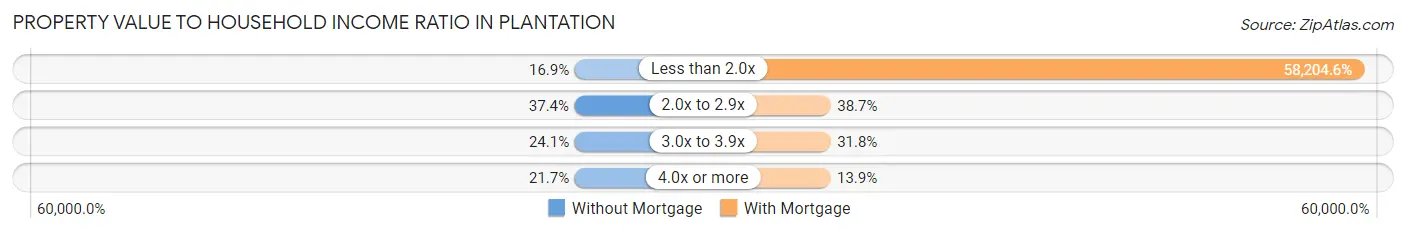
| Value-to-Income Ratio | Without Mortgage | With Mortgage |
| Less than 2.0x | 14 (16.9%) | 100,694 (58,204.6%) |
| 2.0x to 2.9x | 31 (37.3%) | 67 (38.7%) |
| 3.0x to 3.9x | 20 (24.1%) | 55 (31.8%) |
| 4.0x or more | 18 (21.7%) | 24 (13.9%) |
| Total | 83 (100.0%) | 173 (100.0%) |
Real Estate Taxes by Mortgage Status in Plantation
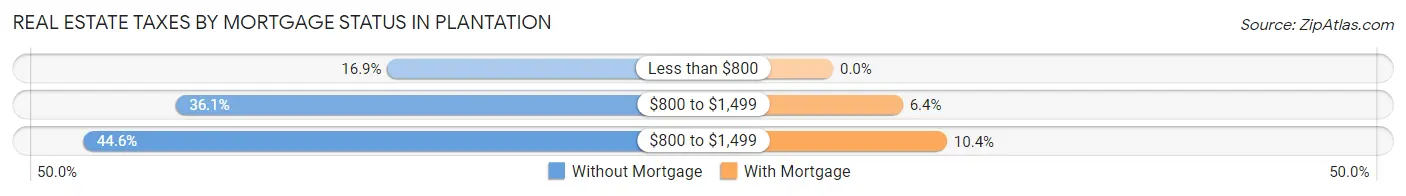
| Property Taxes | Without Mortgage | With Mortgage |
| Less than $800 | 14 (16.9%) | 0 (0.0%) |
| $800 to $1,499 | 30 (36.1%) | 11 (6.4%) |
| $800 to $1,499 | 37 (44.6%) | 18 (10.4%) |
| Total | 83 (100.0%) | 173 (100.0%) |
Health & Disability in Plantation
Health Insurance Coverage by Age in Plantation
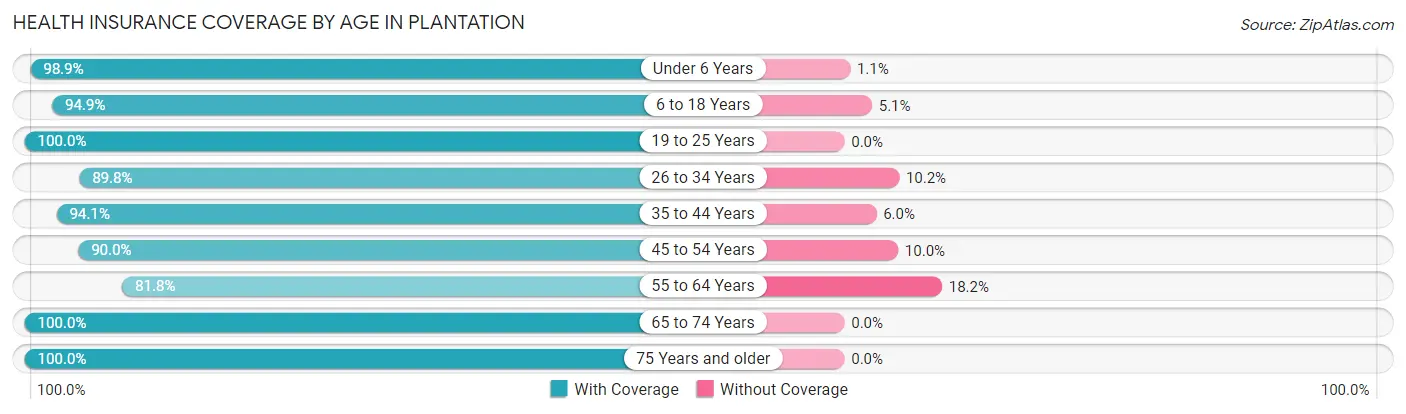
| Age Bracket | With Coverage | Without Coverage |
| Under 6 Years | 186 (98.9%) | 2 (1.1%) |
| 6 to 18 Years | 111 (94.9%) | 6 (5.1%) |
| 19 to 25 Years | 38 (100.0%) | 0 (0.0%) |
| 26 to 34 Years | 141 (89.8%) | 16 (10.2%) |
| 35 to 44 Years | 79 (94.1%) | 5 (5.9%) |
| 45 to 54 Years | 99 (90.0%) | 11 (10.0%) |
| 55 to 64 Years | 99 (81.8%) | 22 (18.2%) |
| 65 to 74 Years | 46 (100.0%) | 0 (0.0%) |
| 75 Years and older | 29 (100.0%) | 0 (0.0%) |
| Total | 828 (93.0%) | 62 (7.0%) |
Health Insurance Coverage by Citizenship Status in Plantation
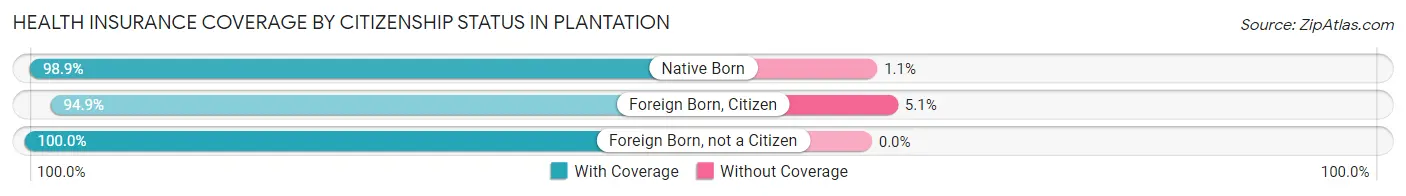
| Citizenship Status | With Coverage | Without Coverage |
| Native Born | 186 (98.9%) | 2 (1.1%) |
| Foreign Born, Citizen | 111 (94.9%) | 6 (5.1%) |
| Foreign Born, not a Citizen | 38 (100.0%) | 0 (0.0%) |
Health Insurance Coverage by Household Income in Plantation
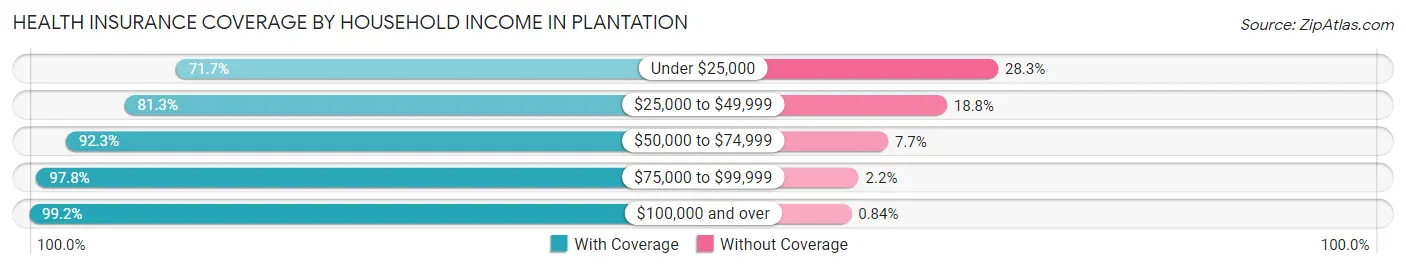
| Household Income | With Coverage | Without Coverage |
| Under $25,000 | 43 (71.7%) | 17 (28.3%) |
| $25,000 to $49,999 | 78 (81.2%) | 18 (18.8%) |
| $50,000 to $74,999 | 263 (92.3%) | 22 (7.7%) |
| $75,000 to $99,999 | 88 (97.8%) | 2 (2.2%) |
| $100,000 and over | 356 (99.2%) | 3 (0.8%) |
Public vs Private Health Insurance Coverage by Age in Plantation
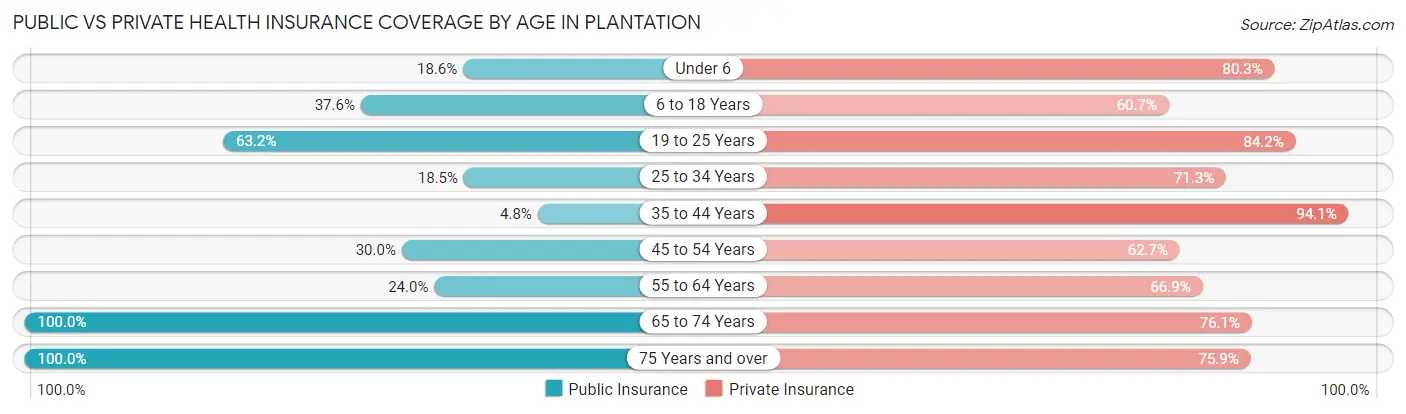
| Age Bracket | Public Insurance | Private Insurance |
| Under 6 | 35 (18.6%) | 151 (80.3%) |
| 6 to 18 Years | 44 (37.6%) | 71 (60.7%) |
| 19 to 25 Years | 24 (63.2%) | 32 (84.2%) |
| 25 to 34 Years | 29 (18.5%) | 112 (71.3%) |
| 35 to 44 Years | 4 (4.8%) | 79 (94.1%) |
| 45 to 54 Years | 33 (30.0%) | 69 (62.7%) |
| 55 to 64 Years | 29 (24.0%) | 81 (66.9%) |
| 65 to 74 Years | 46 (100.0%) | 35 (76.1%) |
| 75 Years and over | 29 (100.0%) | 22 (75.9%) |
| Total | 273 (30.7%) | 652 (73.3%) |
Disability Status by Sex by Age in Plantation
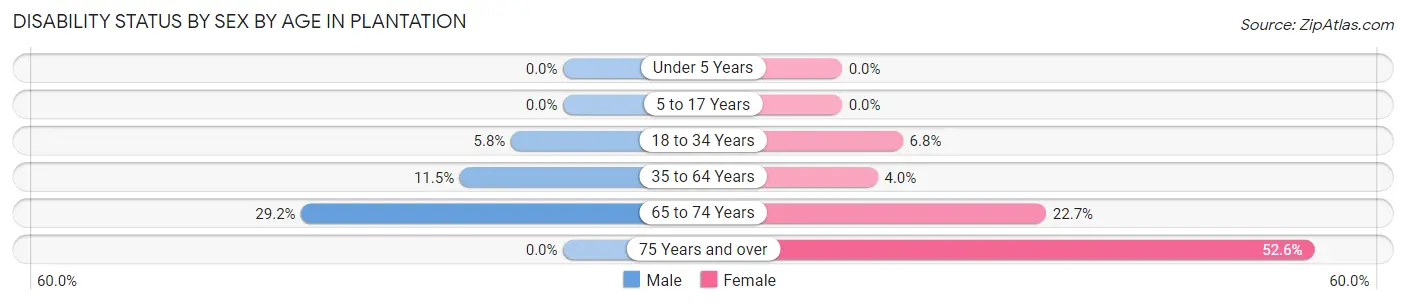
| Age Bracket | Male | Female |
| Under 5 Years | 0 (0.0%) | 0 (0.0%) |
| 5 to 17 Years | 0 (0.0%) | 0 (0.0%) |
| 18 to 34 Years | 5 (5.8%) | 8 (6.8%) |
| 35 to 64 Years | 16 (11.5%) | 7 (4.0%) |
| 65 to 74 Years | 7 (29.2%) | 5 (22.7%) |
| 75 Years and over | 0 (0.0%) | 10 (52.6%) |
Disability Class by Sex by Age in Plantation
Disability Class: Hearing Difficulty
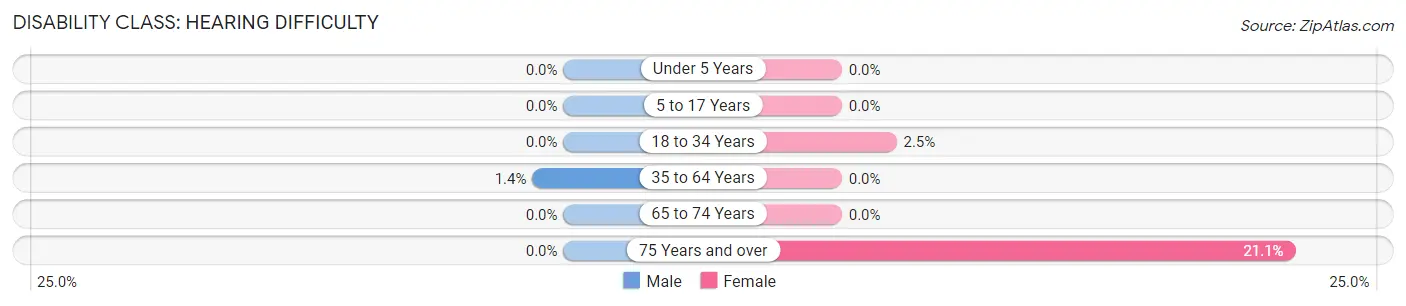
| Age Bracket | Male | Female |
| Under 5 Years | 0 (0.0%) | 0 (0.0%) |
| 5 to 17 Years | 0 (0.0%) | 0 (0.0%) |
| 18 to 34 Years | 0 (0.0%) | 3 (2.5%) |
| 35 to 64 Years | 2 (1.4%) | 0 (0.0%) |
| 65 to 74 Years | 0 (0.0%) | 0 (0.0%) |
| 75 Years and over | 0 (0.0%) | 4 (21.0%) |
Disability Class: Vision Difficulty
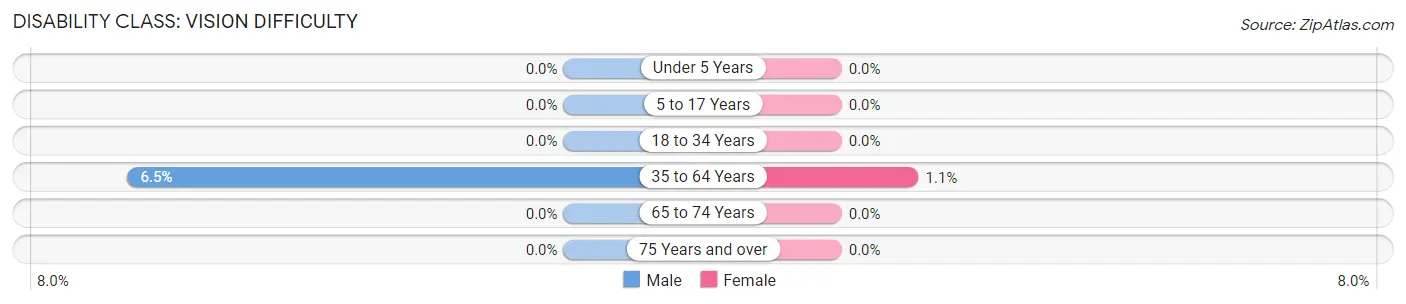
| Age Bracket | Male | Female |
| Under 5 Years | 0 (0.0%) | 0 (0.0%) |
| 5 to 17 Years | 0 (0.0%) | 0 (0.0%) |
| 18 to 34 Years | 0 (0.0%) | 0 (0.0%) |
| 35 to 64 Years | 9 (6.5%) | 2 (1.1%) |
| 65 to 74 Years | 0 (0.0%) | 0 (0.0%) |
| 75 Years and over | 0 (0.0%) | 0 (0.0%) |
Disability Class: Cognitive Difficulty
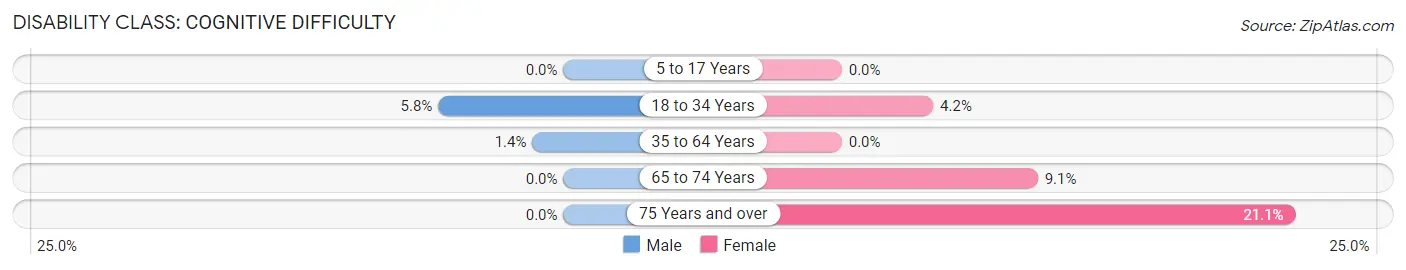
| Age Bracket | Male | Female |
| 5 to 17 Years | 0 (0.0%) | 0 (0.0%) |
| 18 to 34 Years | 5 (5.8%) | 5 (4.2%) |
| 35 to 64 Years | 2 (1.4%) | 0 (0.0%) |
| 65 to 74 Years | 0 (0.0%) | 2 (9.1%) |
| 75 Years and over | 0 (0.0%) | 4 (21.0%) |
Disability Class: Ambulatory Difficulty
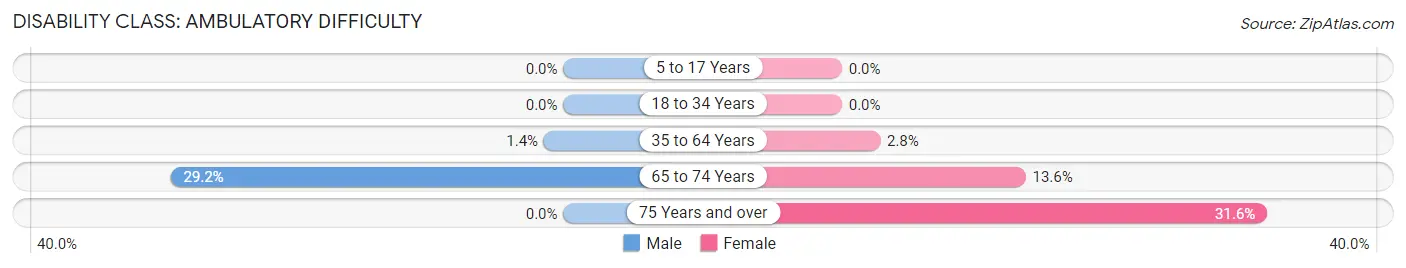
| Age Bracket | Male | Female |
| 5 to 17 Years | 0 (0.0%) | 0 (0.0%) |
| 18 to 34 Years | 0 (0.0%) | 0 (0.0%) |
| 35 to 64 Years | 2 (1.4%) | 5 (2.8%) |
| 65 to 74 Years | 7 (29.2%) | 3 (13.6%) |
| 75 Years and over | 0 (0.0%) | 6 (31.6%) |
Disability Class: Self-Care Difficulty
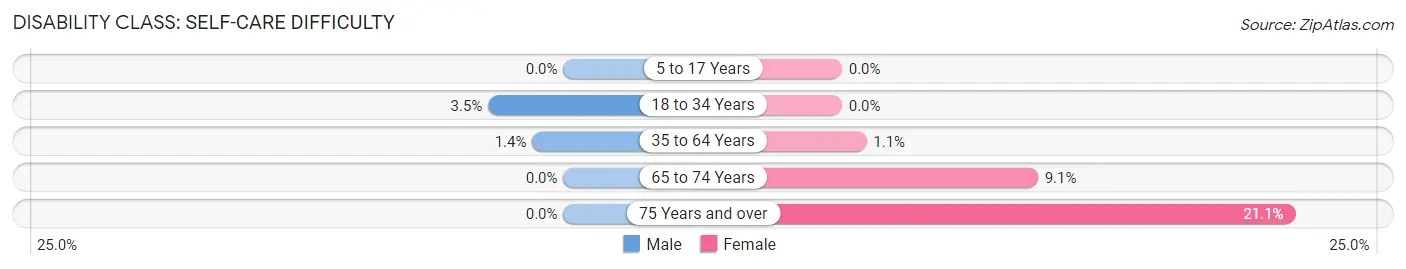
| Age Bracket | Male | Female |
| 5 to 17 Years | 0 (0.0%) | 0 (0.0%) |
| 18 to 34 Years | 3 (3.5%) | 0 (0.0%) |
| 35 to 64 Years | 2 (1.4%) | 2 (1.1%) |
| 65 to 74 Years | 0 (0.0%) | 2 (9.1%) |
| 75 Years and over | 0 (0.0%) | 4 (21.0%) |
Technology Access in Plantation
Computing Device Access in Plantation
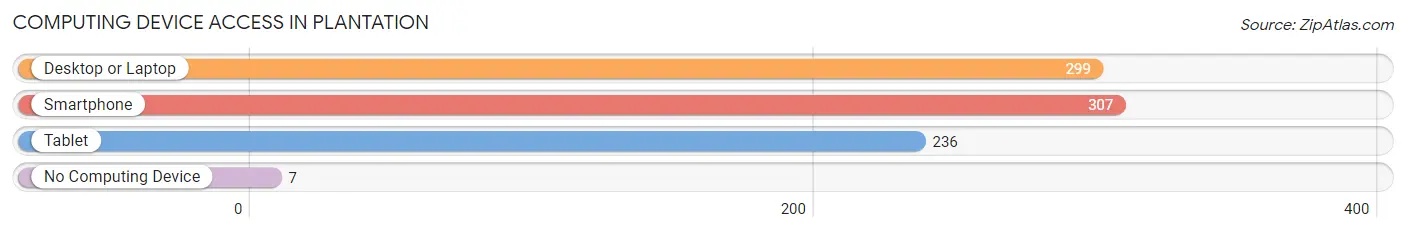
| Device Type | # Households | % Households |
| Desktop or Laptop | 299 | 92.0% |
| Smartphone | 307 | 94.5% |
| Tablet | 236 | 72.6% |
| No Computing Device | 7 | 2.1% |
| Total | 325 | 100.0% |
Internet Access in Plantation
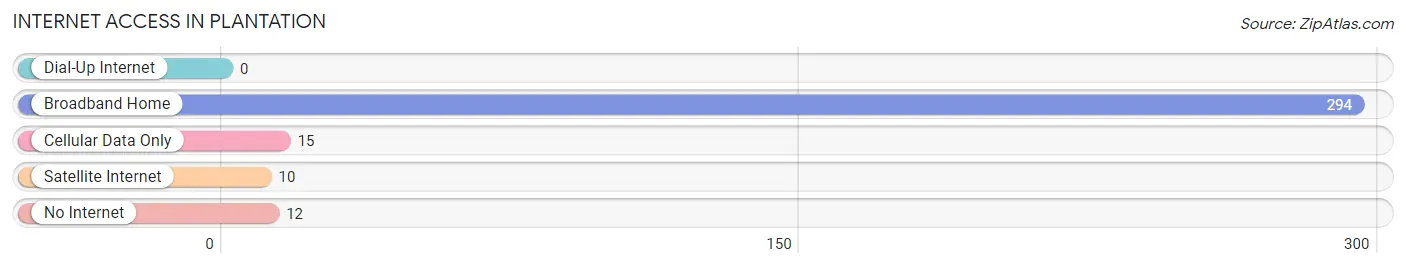
| Internet Type | # Households | % Households |
| Dial-Up Internet | 0 | 0.0% |
| Broadband Home | 294 | 90.5% |
| Cellular Data Only | 15 | 4.6% |
| Satellite Internet | 10 | 3.1% |
| No Internet | 12 | 3.7% |
| Total | 325 | 100.0% |
Plantation Summary
Plantation, Kentucky is a small unincorporated community located in the western part of the state, in the county of Warren. It is situated on the banks of the Green River, and is home to a population of just over 200 people. The town is known for its rural charm and its close proximity to the Mammoth Cave National Park.
History
The area that is now Plantation, Kentucky was first settled in the early 1800s by a group of settlers from Virginia. The town was originally known as “Plantation Station”, and was a stop on the Louisville and Nashville Railroad. The town was officially incorporated in 1883, and the name was changed to Plantation.
The town was a popular destination for tourists in the late 19th and early 20th centuries, due to its proximity to the Mammoth Cave National Park. The town was also home to a number of businesses, including a hotel, a general store, and a post office.
Geography
Plantation, Kentucky is located in the western part of the state, in the county of Warren. It is situated on the banks of the Green River, and is surrounded by rolling hills and forests. The town is located approximately 30 miles south of Bowling Green, and is about an hour’s drive from Nashville, Tennessee.
Economy
The economy of Plantation, Kentucky is largely based on tourism. The town is home to a number of bed and breakfasts, as well as a number of restaurants and shops. The town is also home to a number of small businesses, including a general store, a post office, and a gas station.
Demographics
As of the 2010 census, the population of Plantation, Kentucky was 203. The racial makeup of the town was 97.5% White, 0.5% African American, 0.5% Native American, 0.5% Asian, and 1.0% from other races. The median household income was $31,250, and the median family income was $37,500.
Conclusion
Plantation, Kentucky is a small unincorporated community located in the western part of the state, in the county of Warren. It is situated on the banks of the Green River, and is home to a population of just over 200 people. The town is known for its rural charm and its close proximity to the Mammoth Cave National Park. The economy of Plantation, Kentucky is largely based on tourism, and the town is home to a number of bed and breakfasts, restaurants, and shops. The population of Plantation, Kentucky is largely white, with a small percentage of African American, Native American, and Asian residents.
Common Questions
What is Per Capita Income in Plantation?
Per Capita income in Plantation is $36,214.
What is the Median Family Income in Plantation?
Median Family Income in Plantation is $77,083.
What is the Median Household income in Plantation?
Median Household Income in Plantation is $71,250.
What is Income or Wage Gap in Plantation?
Income or Wage Gap in Plantation is 35.3%.
Women in Plantation earn 64.7 cents for every dollar earned by a man.
What is Family Income Deficit in Plantation?
Family Income Deficit in Plantation is $15,336.
Families that are below poverty line in Plantation earn $15,336 less on average than the poverty threshold level.
What is Inequality or Gini Index in Plantation?
Inequality or Gini Index in Plantation is 0.44.
What is the Total Population of Plantation?
Total Population of Plantation is 890.
What is the Total Male Population of Plantation?
Total Male Population of Plantation is 392.
What is the Total Female Population of Plantation?
Total Female Population of Plantation is 498.
What is the Ratio of Males per 100 Females in Plantation?
There are 78.71 Males per 100 Females in Plantation.
What is the Ratio of Females per 100 Males in Plantation?
There are 127.04 Females per 100 Males in Plantation.
What is the Median Population Age in Plantation?
Median Population Age in Plantation is 32.0 Years.
What is the Average Family Size in Plantation
Average Family Size in Plantation is 3.4 People.
What is the Average Household Size in Plantation
Average Household Size in Plantation is 2.7 People.
How Large is the Labor Force in Plantation?
There are 477 People in the Labor Forcein in Plantation.
What is the Percentage of People in the Labor Force in Plantation?
78.6% of People are in the Labor Force in Plantation.
What is the Unemployment Rate in Plantation?
Unemployment Rate in Plantation is 3.6%.