Fincastle, KY Map & Demographics
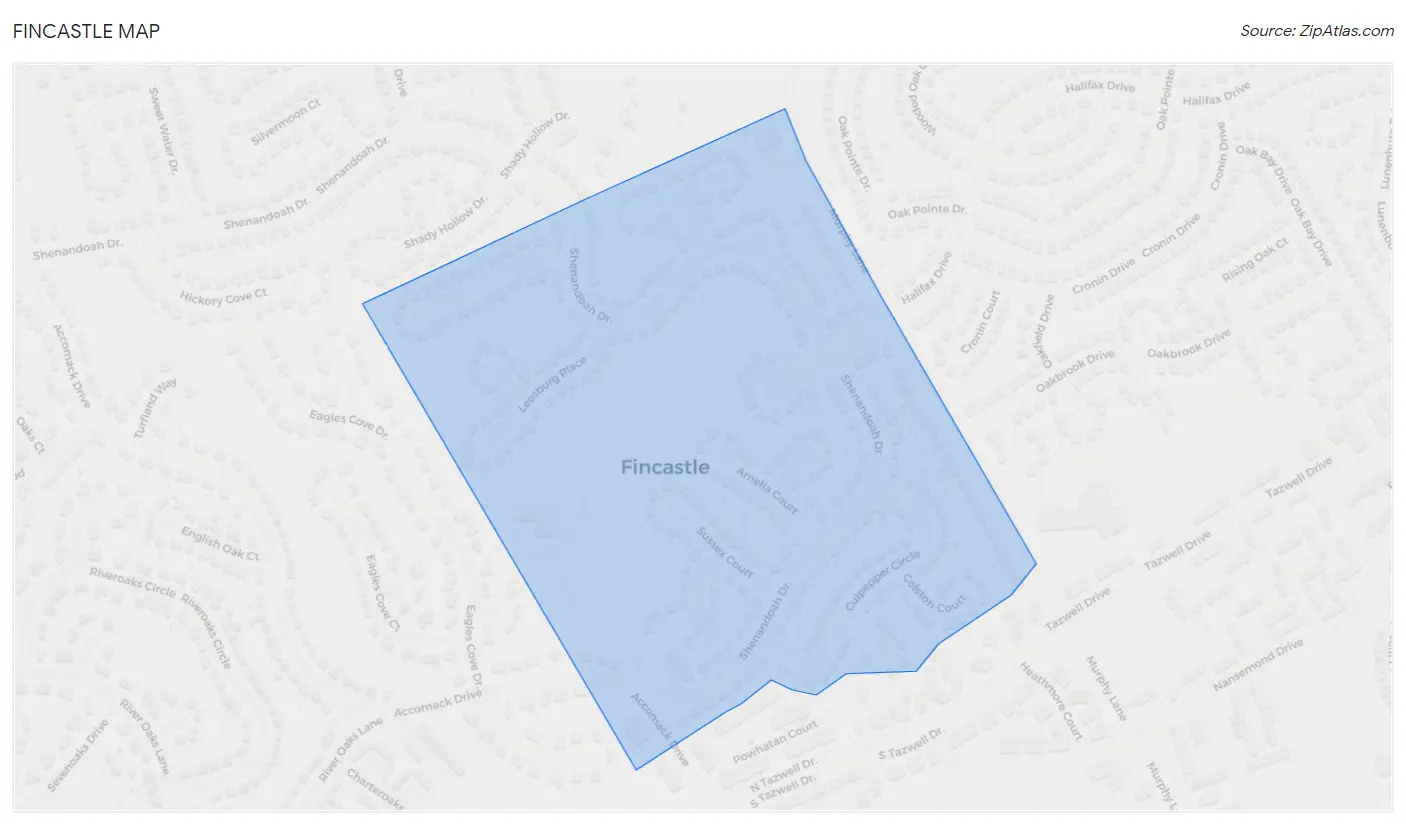
Fincastle Map
Fincastle Overview
$39,959
PER CAPITA INCOME
$104,583
AVG FAMILY INCOME
$84,750
AVG HOUSEHOLD INCOME
5.0%
WAGE / INCOME GAP [ % ]
95.0¢/ $1
WAGE / INCOME GAP [ $ ]
0.37
INEQUALITY / GINI INDEX
588
TOTAL POPULATION
317
MALE POPULATION
271
FEMALE POPULATION
116.97
MALES / 100 FEMALES
85.49
FEMALES / 100 MALES
43.6
MEDIAN AGE
2.9
AVG FAMILY SIZE
2.3
AVG HOUSEHOLD SIZE
327
LABOR FORCE [ PEOPLE ]
65.4%
PERCENT IN LABOR FORCE
3.1%
UNEMPLOYMENT RATE
Fincastle Area Codes
Income in Fincastle
Income Overview in Fincastle
Per Capita Income in Fincastle is $39,959, while median incomes of families and households are $104,583 and $84,750 respectively.
| Characteristic | Number | Measure |
| Per Capita Income | 588 | $39,959 |
| Median Family Income | 157 | $104,583 |
| Mean Family Income | 157 | $109,910 |
| Median Household Income | 251 | $84,750 |
| Mean Household Income | 251 | $90,289 |
| Income Deficit | 157 | $0 |
| Wage / Income Gap (%) | 588 | 5.00% |
| Wage / Income Gap ($) | 588 | 95.00¢ per $1 |
| Gini / Inequality Index | 588 | 0.37 |
Earnings by Sex in Fincastle
Average Earnings in Fincastle are $49,643, $50,000 for men and $47,500 for women, a difference of 5.0%.
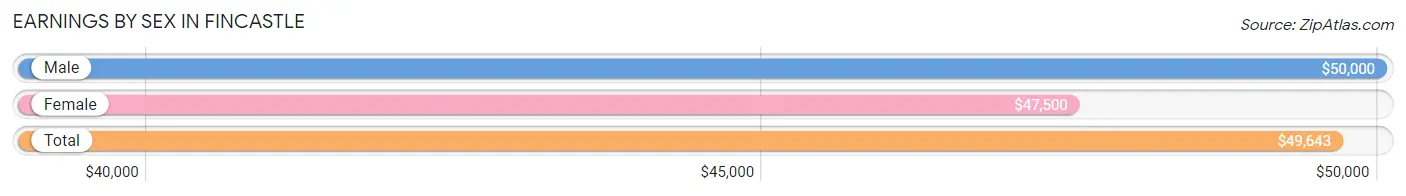
| Sex | Number | Average Earnings |
| Male | 166 (50.9%) | $50,000 |
| Female | 160 (49.1%) | $47,500 |
| Total | 326 (100.0%) | $49,643 |
Earnings by Sex by Income Bracket in Fincastle
The most common earnings brackets in Fincastle are $40,000 to $44,999 for men (25 | 15.1%) and $65,000 to $74,999 for women (40 | 25.0%).
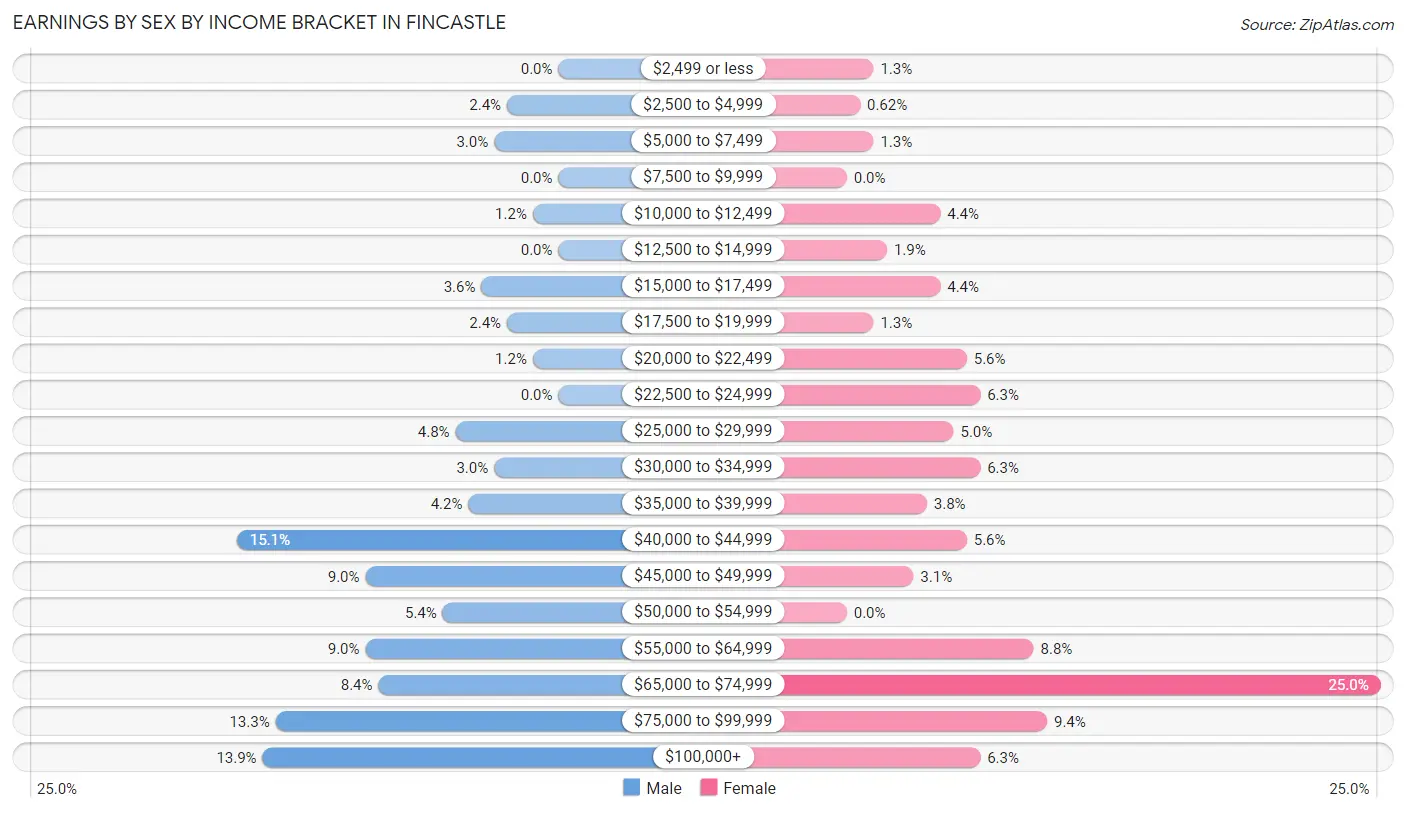
| Income | Male | Female |
| $2,499 or less | 0 (0.0%) | 2 (1.3%) |
| $2,500 to $4,999 | 4 (2.4%) | 1 (0.6%) |
| $5,000 to $7,499 | 5 (3.0%) | 2 (1.3%) |
| $7,500 to $9,999 | 0 (0.0%) | 0 (0.0%) |
| $10,000 to $12,499 | 2 (1.2%) | 7 (4.4%) |
| $12,500 to $14,999 | 0 (0.0%) | 3 (1.9%) |
| $15,000 to $17,499 | 6 (3.6%) | 7 (4.4%) |
| $17,500 to $19,999 | 4 (2.4%) | 2 (1.3%) |
| $20,000 to $22,499 | 2 (1.2%) | 9 (5.6%) |
| $22,500 to $24,999 | 0 (0.0%) | 10 (6.2%) |
| $25,000 to $29,999 | 8 (4.8%) | 8 (5.0%) |
| $30,000 to $34,999 | 5 (3.0%) | 10 (6.2%) |
| $35,000 to $39,999 | 7 (4.2%) | 6 (3.7%) |
| $40,000 to $44,999 | 25 (15.1%) | 9 (5.6%) |
| $45,000 to $49,999 | 15 (9.0%) | 5 (3.1%) |
| $50,000 to $54,999 | 9 (5.4%) | 0 (0.0%) |
| $55,000 to $64,999 | 15 (9.0%) | 14 (8.7%) |
| $65,000 to $74,999 | 14 (8.4%) | 40 (25.0%) |
| $75,000 to $99,999 | 22 (13.3%) | 15 (9.4%) |
| $100,000+ | 23 (13.9%) | 10 (6.2%) |
| Total | 166 (100.0%) | 160 (100.0%) |
Earnings by Sex by Educational Attainment in Fincastle
Average earnings in Fincastle are $50,625 for men and $63,750 for women, a difference of 20.6%. Men with an educational attainment of graduate degree enjoy the highest average annual earnings of $92,500, while those with high school diploma education earn the least with $37,143. Women with an educational attainment of graduate degree earn the most with the average annual earnings of $70,417, while those with college or associate's degree education have the smallest earnings of $45,625.
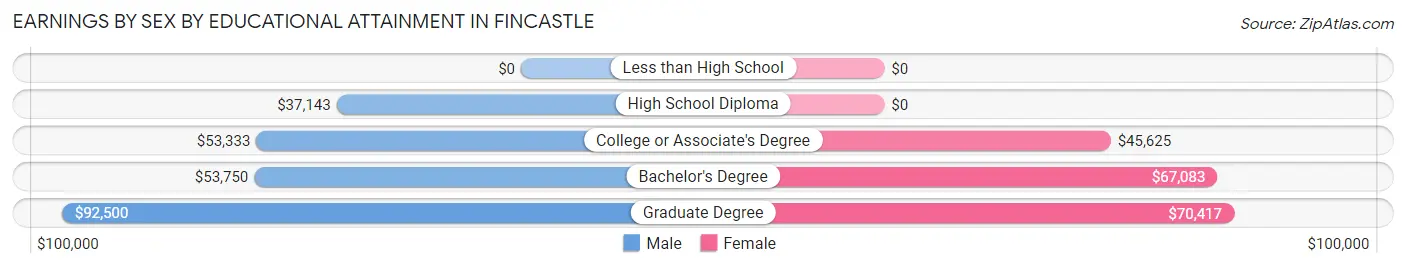
| Educational Attainment | Male Income | Female Income |
| Less than High School | - | - |
| High School Diploma | $37,143 | $0 |
| College or Associate's Degree | $53,333 | $45,625 |
| Bachelor's Degree | $53,750 | $67,083 |
| Graduate Degree | $92,500 | $70,417 |
| Total | $50,625 | $63,750 |
Family Income in Fincastle
Family Income Brackets in Fincastle
According to the Fincastle family income data, there are 42 families falling into the $100,000 to $149,999 income range, which is the most common income bracket and makes up 26.8% of all families.
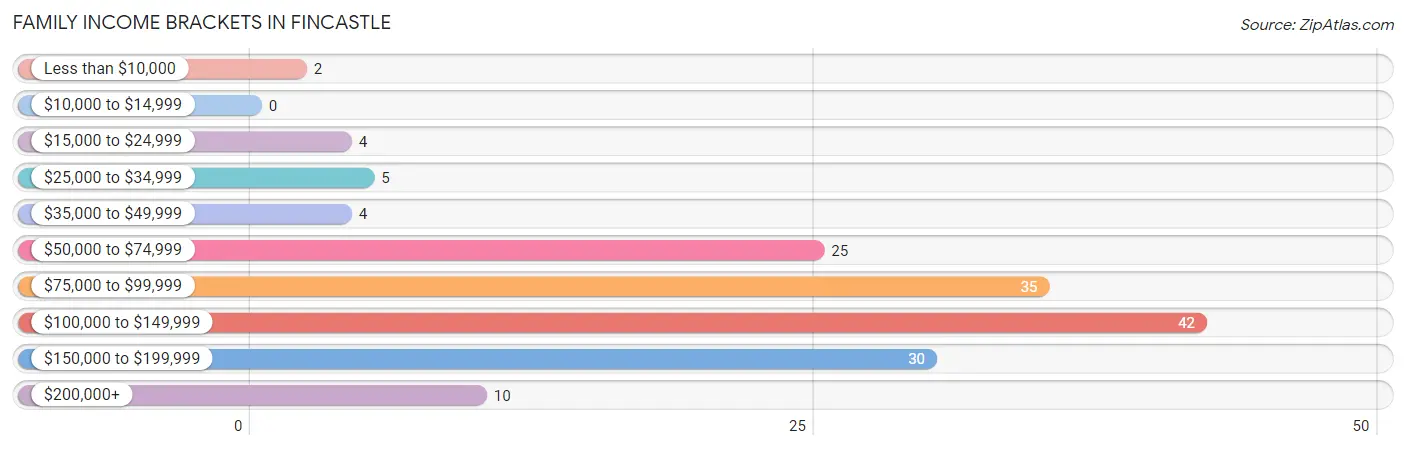
| Income Bracket | # Families | % Families |
| Less than $10,000 | 2 | 1.3% |
| $10,000 to $14,999 | 0 | 0.0% |
| $15,000 to $24,999 | 4 | 2.5% |
| $25,000 to $34,999 | 5 | 3.2% |
| $35,000 to $49,999 | 4 | 2.5% |
| $50,000 to $74,999 | 25 | 15.9% |
| $75,000 to $99,999 | 35 | 22.3% |
| $100,000 to $149,999 | 42 | 26.8% |
| $150,000 to $199,999 | 30 | 19.1% |
| $200,000+ | 10 | 6.4% |
Family Income by Famaliy Size in Fincastle
5-person families (9 | 5.7%) account for the highest median family income in Fincastle with $153,750 per family, while 2-person families (74 | 47.1%) have the highest median income of $40,972 per family member.
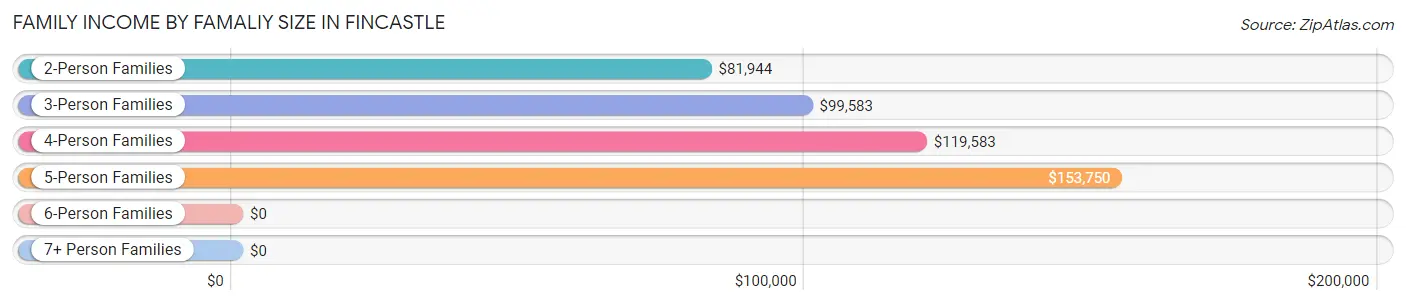
| Income Bracket | # Families | Median Income |
| 2-Person Families | 74 (47.1%) | $81,944 |
| 3-Person Families | 57 (36.3%) | $99,583 |
| 4-Person Families | 13 (8.3%) | $119,583 |
| 5-Person Families | 9 (5.7%) | $153,750 |
| 6-Person Families | 2 (1.3%) | $0 |
| 7+ Person Families | 2 (1.3%) | $0 |
| Total | 157 (100.0%) | $104,583 |
Family Income by Number of Earners in Fincastle
The median family income in Fincastle is $104,583, with families comprising 3+ earners (18) having the highest median family income of $154,643, while families with no earners (20) have the lowest median family income of $58,125, accounting for 11.5% and 12.7% of families, respectively.
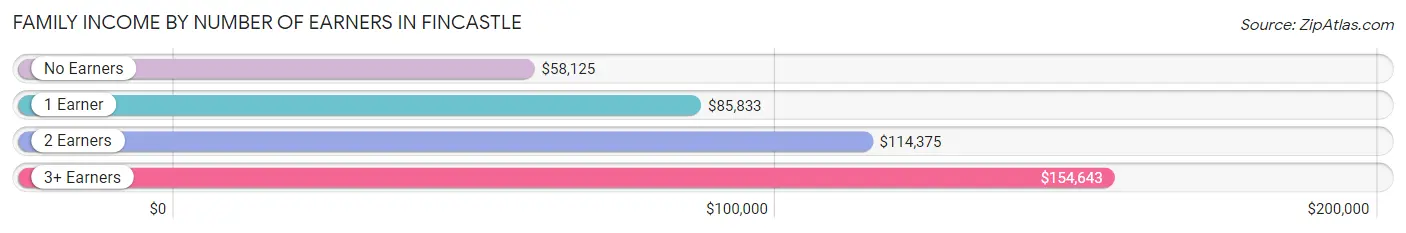
| Number of Earners | # Families | Median Income |
| No Earners | 20 (12.7%) | $58,125 |
| 1 Earner | 62 (39.5%) | $85,833 |
| 2 Earners | 57 (36.3%) | $114,375 |
| 3+ Earners | 18 (11.5%) | $154,643 |
| Total | 157 (100.0%) | $104,583 |
Household Income in Fincastle
Household Income Brackets in Fincastle
With 61 households falling in the category, the $100,000 to $149,999 income range is the most frequent in Fincastle, accounting for 24.3% of all households. In contrast, only 4 households (1.6%) fall into the $10,000 to $14,999 income bracket, making it the least populous group.
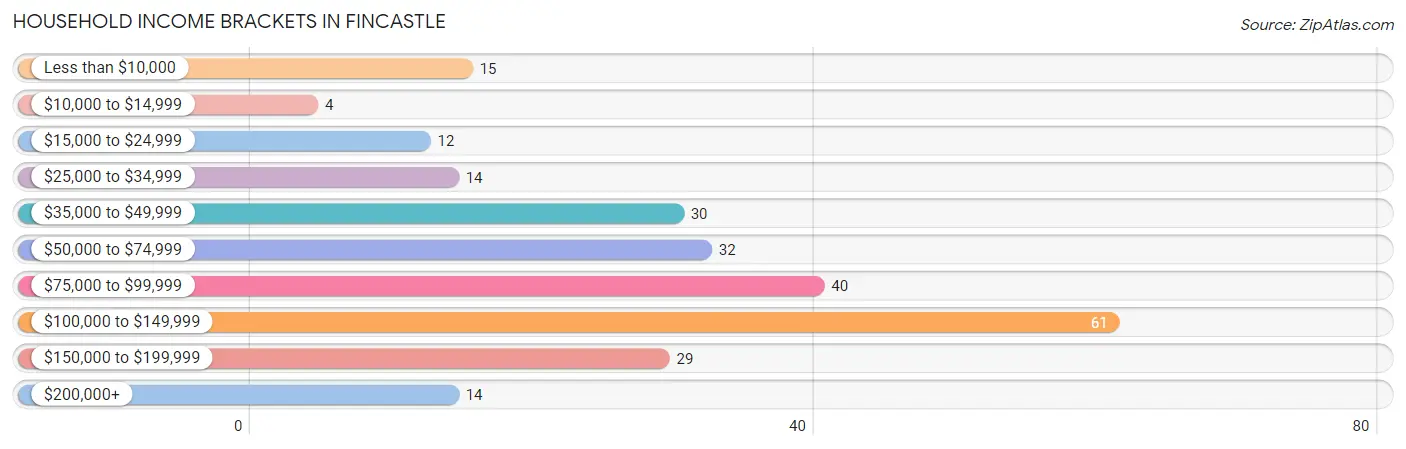
| Income Bracket | # Households | % Households |
| Less than $10,000 | 15 | 6.0% |
| $10,000 to $14,999 | 4 | 1.6% |
| $15,000 to $24,999 | 12 | 4.8% |
| $25,000 to $34,999 | 14 | 5.6% |
| $35,000 to $49,999 | 30 | 12.0% |
| $50,000 to $74,999 | 32 | 12.7% |
| $75,000 to $99,999 | 40 | 15.9% |
| $100,000 to $149,999 | 61 | 24.3% |
| $150,000 to $199,999 | 29 | 11.6% |
| $200,000+ | 14 | 5.6% |
Household Income by Householder Age in Fincastle
The median household income in Fincastle is $84,750, with the highest median household income of $113,304 found in the 25 to 44 years age bracket for the primary householder. A total of 73 households (29.1%) fall into this category. Meanwhile, the 15 to 24 years age bracket for the primary householder has the lowest median household income of $0, with 4 households (1.6%) in this group.
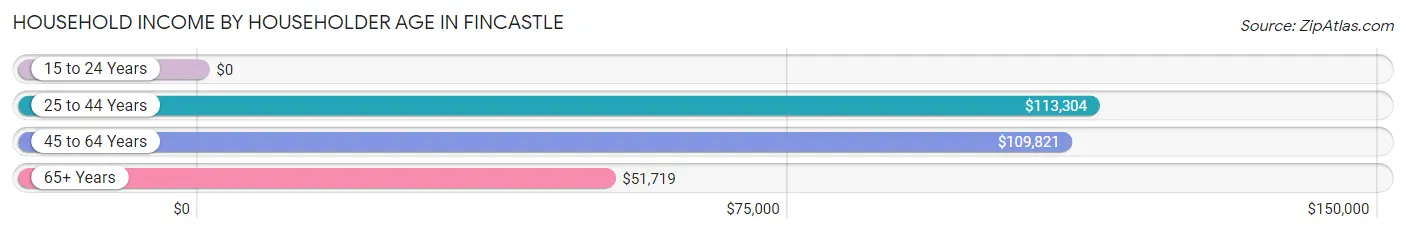
| Income Bracket | # Households | Median Income |
| 15 to 24 Years | 4 (1.6%) | $0 |
| 25 to 44 Years | 73 (29.1%) | $113,304 |
| 45 to 64 Years | 81 (32.3%) | $109,821 |
| 65+ Years | 93 (37.0%) | $51,719 |
| Total | 251 (100.0%) | $84,750 |
Poverty in Fincastle
Income Below Poverty by Sex and Age in Fincastle
With 7.6% poverty level for males and 8.9% for females among the residents of Fincastle, 16 and 17 year old males and 75 year old and over females are the most vulnerable to poverty, with 5 males (33.3%) and 15 females (34.9%) in their respective age groups living below the poverty level.
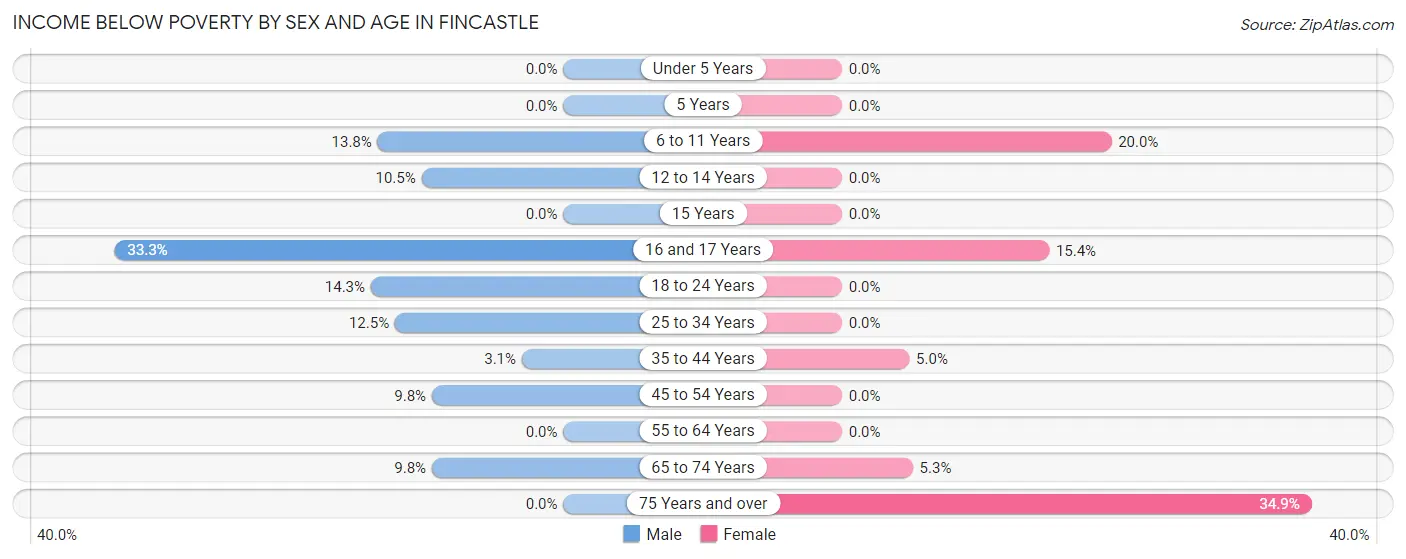
| Age Bracket | Male | Female |
| Under 5 Years | 0 (0.0%) | 0 (0.0%) |
| 5 Years | 0 (0.0%) | 0 (0.0%) |
| 6 to 11 Years | 4 (13.8%) | 2 (20.0%) |
| 12 to 14 Years | 2 (10.5%) | 0 (0.0%) |
| 15 Years | 0 (0.0%) | 0 (0.0%) |
| 16 and 17 Years | 5 (33.3%) | 2 (15.4%) |
| 18 to 24 Years | 1 (14.3%) | 0 (0.0%) |
| 25 to 34 Years | 2 (12.5%) | 0 (0.0%) |
| 35 to 44 Years | 2 (3.1%) | 3 (5.0%) |
| 45 to 54 Years | 4 (9.8%) | 0 (0.0%) |
| 55 to 64 Years | 0 (0.0%) | 0 (0.0%) |
| 65 to 74 Years | 4 (9.8%) | 2 (5.3%) |
| 75 Years and over | 0 (0.0%) | 15 (34.9%) |
| Total | 24 (7.6%) | 24 (8.9%) |
Income Above Poverty by Sex and Age in Fincastle
According to the poverty statistics in Fincastle, males aged under 5 years and females aged under 5 years are the age groups that are most secure financially, with 100.0% of males and 100.0% of females in these age groups living above the poverty line.
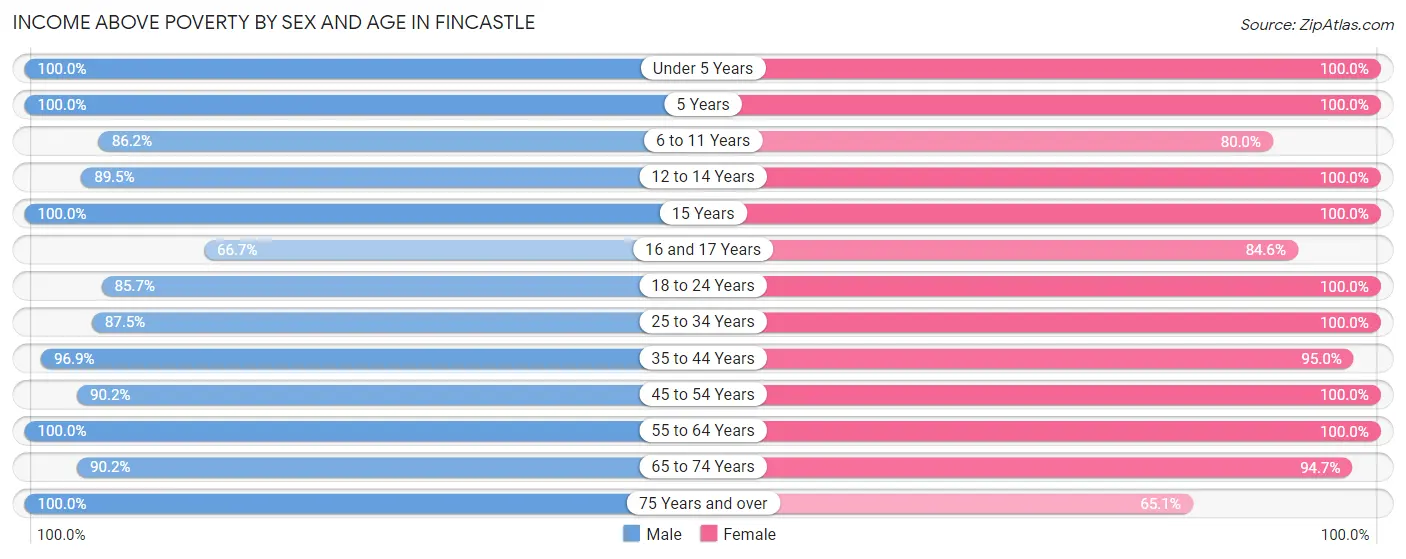
| Age Bracket | Male | Female |
| Under 5 Years | 8 (100.0%) | 4 (100.0%) |
| 5 Years | 9 (100.0%) | 2 (100.0%) |
| 6 to 11 Years | 25 (86.2%) | 8 (80.0%) |
| 12 to 14 Years | 17 (89.5%) | 4 (100.0%) |
| 15 Years | 1 (100.0%) | 2 (100.0%) |
| 16 and 17 Years | 10 (66.7%) | 11 (84.6%) |
| 18 to 24 Years | 6 (85.7%) | 19 (100.0%) |
| 25 to 34 Years | 14 (87.5%) | 18 (100.0%) |
| 35 to 44 Years | 63 (96.9%) | 57 (95.0%) |
| 45 to 54 Years | 37 (90.2%) | 15 (100.0%) |
| 55 to 64 Years | 54 (100.0%) | 43 (100.0%) |
| 65 to 74 Years | 37 (90.2%) | 36 (94.7%) |
| 75 Years and over | 12 (100.0%) | 28 (65.1%) |
| Total | 293 (92.4%) | 247 (91.1%) |
Income Below Poverty Among Married-Couple Families in Fincastle
The poverty statistics for married-couple families in Fincastle show that 3.5% or 4 of the total 113 families live below the poverty line. Families with 3 or 4 children have the highest poverty rate of 22.2%, comprising of 2 families. On the other hand, families with 1 or 2 children have the lowest poverty rate of 0.0%, which includes 0 families.
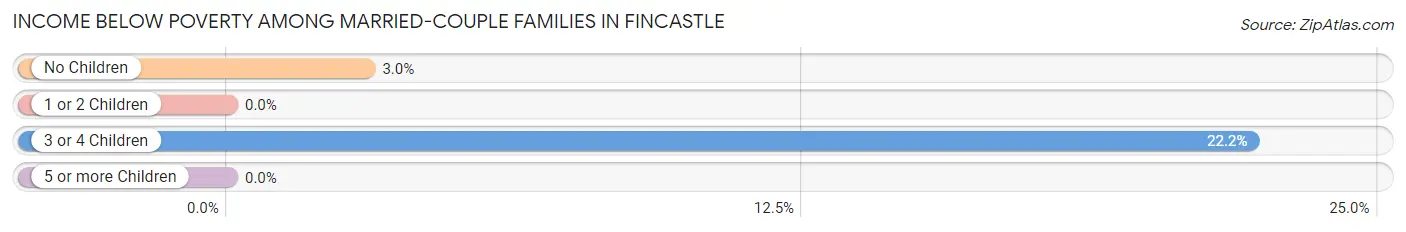
| Children | Above Poverty | Below Poverty |
| No Children | 65 (97.0%) | 2 (3.0%) |
| 1 or 2 Children | 35 (100.0%) | 0 (0.0%) |
| 3 or 4 Children | 7 (77.8%) | 2 (22.2%) |
| 5 or more Children | 2 (100.0%) | 0 (0.0%) |
| Total | 109 (96.5%) | 4 (3.5%) |
Income Below Poverty Among Single-Parent Households in Fincastle
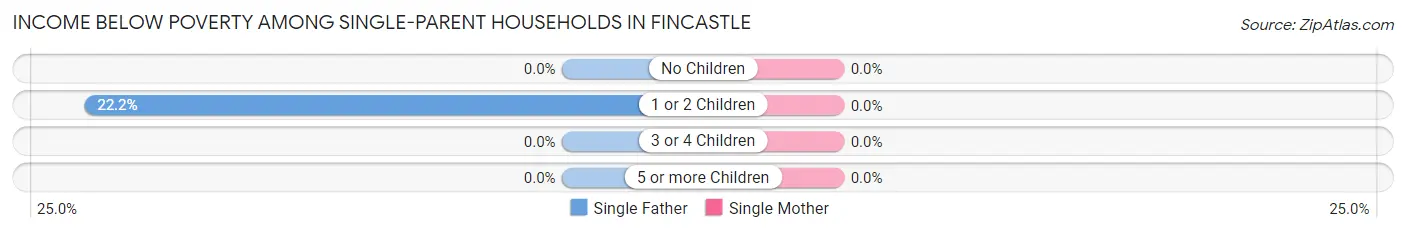
| Children | Single Father | Single Mother |
| No Children | 0 (0.0%) | 0 (0.0%) |
| 1 or 2 Children | 2 (22.2%) | 0 (0.0%) |
| 3 or 4 Children | 0 (0.0%) | 0 (0.0%) |
| 5 or more Children | 0 (0.0%) | 0 (0.0%) |
| Total | 2 (7.1%) | 0 (0.0%) |
Income Below Poverty Among Married-Couple vs Single-Parent Households in Fincastle
The poverty data for Fincastle shows that 4 of the married-couple family households (3.5%) and 2 of the single-parent households (4.5%) are living below the poverty level. Within the married-couple family households, those with 3 or 4 children have the highest poverty rate, with 2 households (22.2%) falling below the poverty line. Among the single-parent households, those with 1 or 2 children have the highest poverty rate, with 2 household (13.3%) living below poverty.
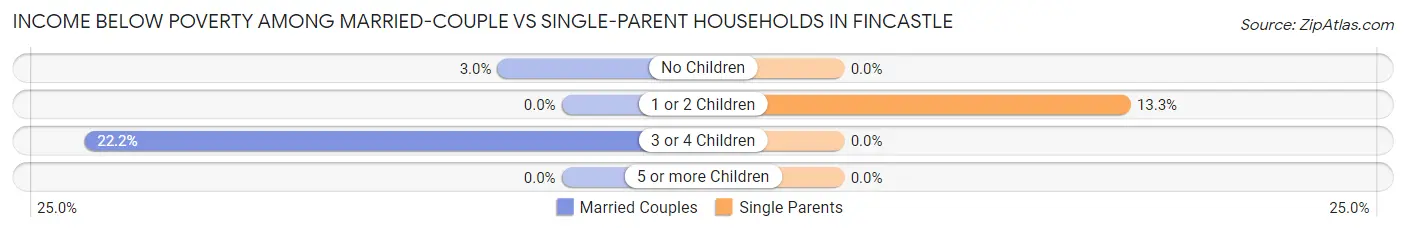
| Children | Married-Couple Families | Single-Parent Households |
| No Children | 2 (3.0%) | 0 (0.0%) |
| 1 or 2 Children | 0 (0.0%) | 2 (13.3%) |
| 3 or 4 Children | 2 (22.2%) | 0 (0.0%) |
| 5 or more Children | 0 (0.0%) | 0 (0.0%) |
| Total | 4 (3.5%) | 2 (4.5%) |
Race in Fincastle
The most populous races in Fincastle are White / Caucasian (271 | 46.1%), Black / African American (210 | 35.7%), and Two or more Races (63 | 10.7%).
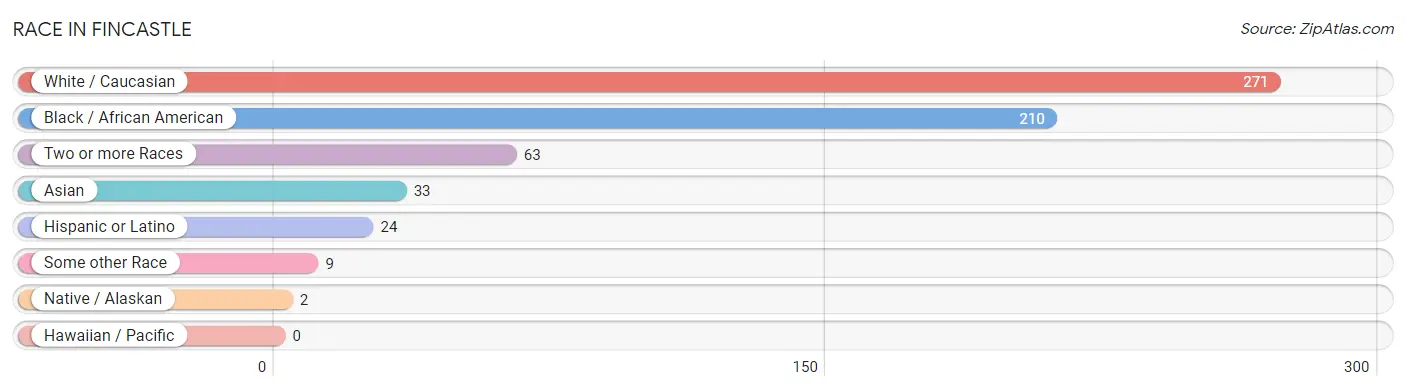
| Race | # Population | % Population |
| Asian | 33 | 5.6% |
| Black / African American | 210 | 35.7% |
| Hawaiian / Pacific | 0 | 0.0% |
| Hispanic or Latino | 24 | 4.1% |
| Native / Alaskan | 2 | 0.3% |
| White / Caucasian | 271 | 46.1% |
| Two or more Races | 63 | 10.7% |
| Some other Race | 9 | 1.5% |
| Total | 588 | 100.0% |
Ancestry in Fincastle
The most populous ancestries reported in Fincastle are English (96 | 16.3%), German (78 | 13.3%), Mexican (24 | 4.1%), Irish (22 | 3.7%), and Korean (21 | 3.6%), together accounting for 41.0% of all Fincastle residents.
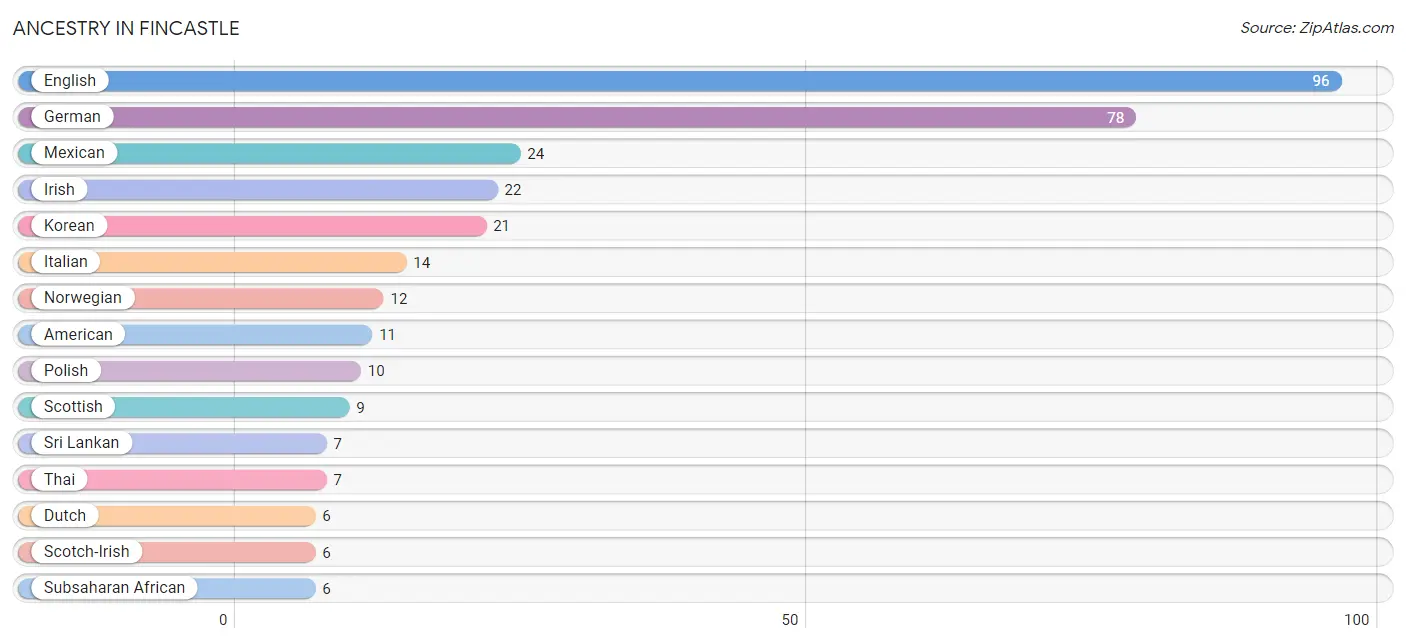
| Ancestry | # Population | % Population |
| African | 3 | 0.5% |
| American | 11 | 1.9% |
| Austrian | 2 | 0.3% |
| Celtic | 2 | 0.3% |
| Central American Indian | 2 | 0.3% |
| Cherokee | 4 | 0.7% |
| Czech | 2 | 0.3% |
| Dutch | 6 | 1.0% |
| English | 96 | 16.3% |
| French | 4 | 0.7% |
| French Canadian | 2 | 0.3% |
| German | 78 | 13.3% |
| Indian (Asian) | 1 | 0.2% |
| Irish | 22 | 3.7% |
| Iroquois | 1 | 0.2% |
| Italian | 14 | 2.4% |
| Korean | 21 | 3.6% |
| Mexican | 24 | 4.1% |
| Norwegian | 12 | 2.0% |
| Polish | 10 | 1.7% |
| Scotch-Irish | 6 | 1.0% |
| Scottish | 9 | 1.5% |
| Sri Lankan | 7 | 1.2% |
| Subsaharan African | 6 | 1.0% |
| Swedish | 2 | 0.3% |
| Thai | 7 | 1.2% |
| Ukrainian | 3 | 0.5% |
| Welsh | 2 | 0.3% | View All 28 Rows |
Immigrants in Fincastle
The most numerous immigrant groups reported in Fincastle came from Asia (23 | 3.9%), South Eastern Asia (20 | 3.4%), Philippines (16 | 2.7%), Latin America (12 | 2.0%), and Central America (10 | 1.7%), together accounting for 13.8% of all Fincastle residents.
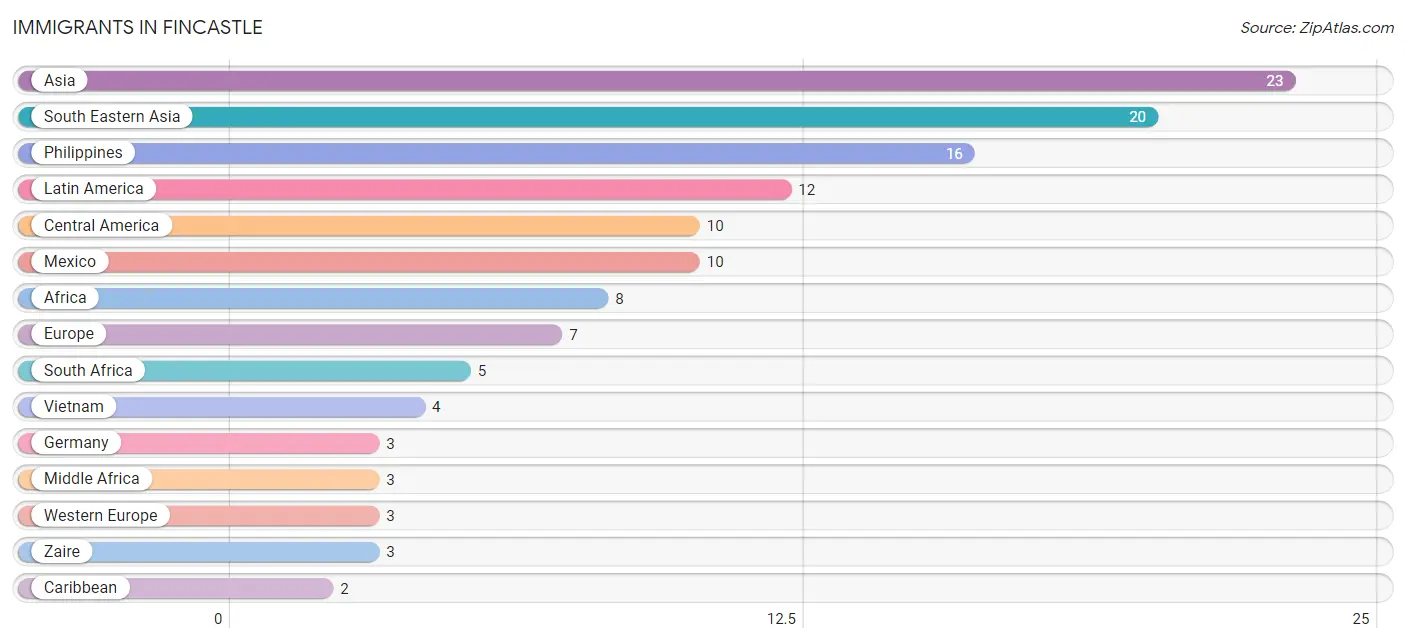
| Immigration Origin | # Population | % Population |
| Africa | 8 | 1.4% |
| Asia | 23 | 3.9% |
| Caribbean | 2 | 0.3% |
| Central America | 10 | 1.7% |
| China | 1 | 0.2% |
| Czechoslovakia | 2 | 0.3% |
| Eastern Asia | 1 | 0.2% |
| Eastern Europe | 2 | 0.3% |
| England | 2 | 0.3% |
| Europe | 7 | 1.2% |
| Germany | 3 | 0.5% |
| India | 2 | 0.3% |
| Latin America | 12 | 2.0% |
| Mexico | 10 | 1.7% |
| Middle Africa | 3 | 0.5% |
| Northern Europe | 2 | 0.3% |
| Philippines | 16 | 2.7% |
| South Africa | 5 | 0.9% |
| South Central Asia | 2 | 0.3% |
| South Eastern Asia | 20 | 3.4% |
| Taiwan | 1 | 0.2% |
| Trinidad and Tobago | 2 | 0.3% |
| Vietnam | 4 | 0.7% |
| Western Europe | 3 | 0.5% |
| Zaire | 3 | 0.5% | View All 25 Rows |
Sex and Age in Fincastle
Sex and Age in Fincastle
The most populous age groups in Fincastle are 40 to 44 Years (46 | 14.5%) for men and 35 to 39 Years (37 | 13.7%) for women.
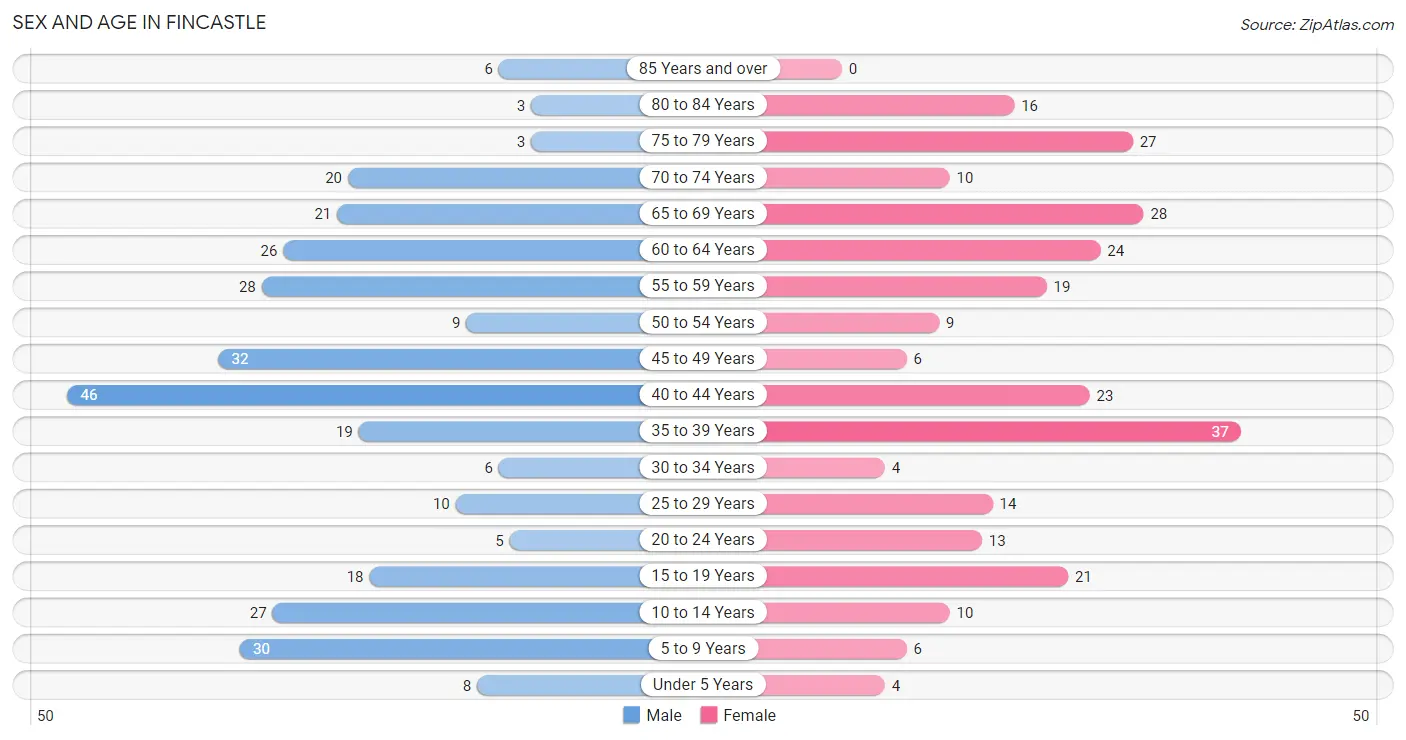
| Age Bracket | Male | Female |
| Under 5 Years | 8 (2.5%) | 4 (1.5%) |
| 5 to 9 Years | 30 (9.5%) | 6 (2.2%) |
| 10 to 14 Years | 27 (8.5%) | 10 (3.7%) |
| 15 to 19 Years | 18 (5.7%) | 21 (7.7%) |
| 20 to 24 Years | 5 (1.6%) | 13 (4.8%) |
| 25 to 29 Years | 10 (3.2%) | 14 (5.2%) |
| 30 to 34 Years | 6 (1.9%) | 4 (1.5%) |
| 35 to 39 Years | 19 (6.0%) | 37 (13.7%) |
| 40 to 44 Years | 46 (14.5%) | 23 (8.5%) |
| 45 to 49 Years | 32 (10.1%) | 6 (2.2%) |
| 50 to 54 Years | 9 (2.8%) | 9 (3.3%) |
| 55 to 59 Years | 28 (8.8%) | 19 (7.0%) |
| 60 to 64 Years | 26 (8.2%) | 24 (8.9%) |
| 65 to 69 Years | 21 (6.6%) | 28 (10.3%) |
| 70 to 74 Years | 20 (6.3%) | 10 (3.7%) |
| 75 to 79 Years | 3 (0.9%) | 27 (10.0%) |
| 80 to 84 Years | 3 (0.9%) | 16 (5.9%) |
| 85 Years and over | 6 (1.9%) | 0 (0.0%) |
| Total | 317 (100.0%) | 271 (100.0%) |
Families and Households in Fincastle
Median Family Size in Fincastle
The median family size in Fincastle is 2.90 persons per family, with married-couple families (113 | 72.0%) accounting for the largest median family size of 3.14 persons per family. On the other hand, single male/father families (28 | 17.8%) represent the smallest median family size with 2.07 persons per family.
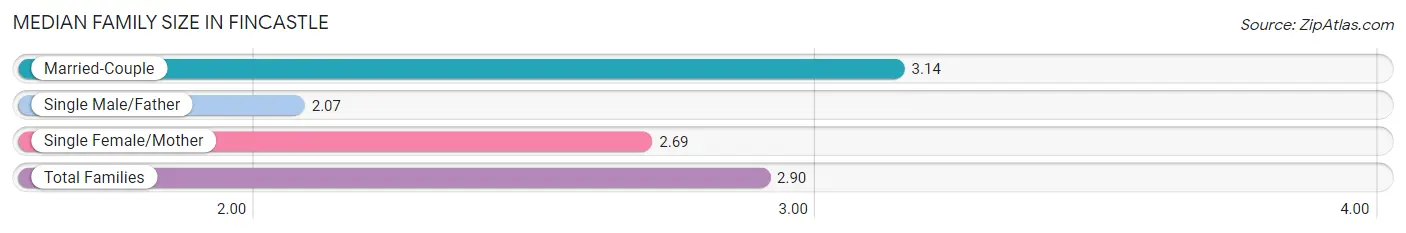
| Family Type | # Families | Family Size |
| Married-Couple | 113 (72.0%) | 3.14 |
| Single Male/Father | 28 (17.8%) | 2.07 |
| Single Female/Mother | 16 (10.2%) | 2.69 |
| Total Families | 157 (100.0%) | 2.90 |
Median Household Size in Fincastle
The median household size in Fincastle is 2.34 persons per household, with married-couple households (113 | 45.0%) accounting for the largest median household size of 3.22 persons per household. non-family households (94 | 37.4%) represent the smallest median household size with 1.19 persons per household.
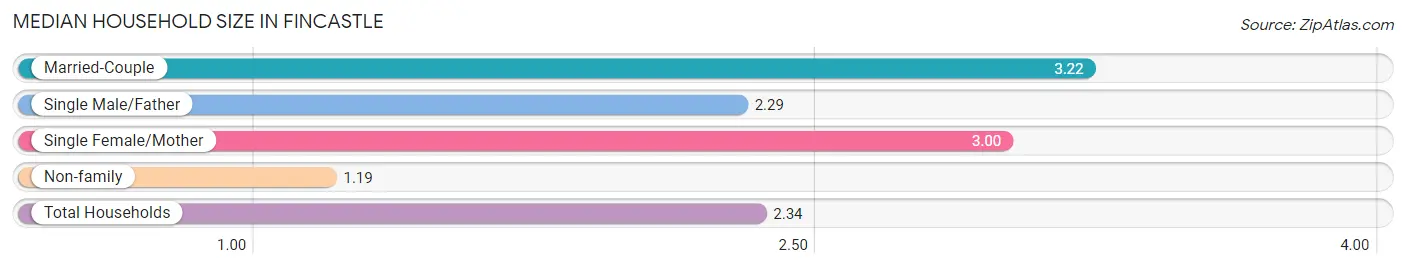
| Household Type | # Households | Household Size |
| Married-Couple | 113 (45.0%) | 3.22 |
| Single Male/Father | 28 (11.2%) | 2.29 |
| Single Female/Mother | 16 (6.4%) | 3.00 |
| Non-family | 94 (37.4%) | 1.19 |
| Total Households | 251 (100.0%) | 2.34 |
Household Size by Marriage Status in Fincastle
Out of a total of 251 households in Fincastle, 157 (62.5%) are family households, while 94 (37.4%) are nonfamily households. The most numerous type of family households are 2-person households, comprising 69, and the most common type of nonfamily households are 1-person households, comprising 78.
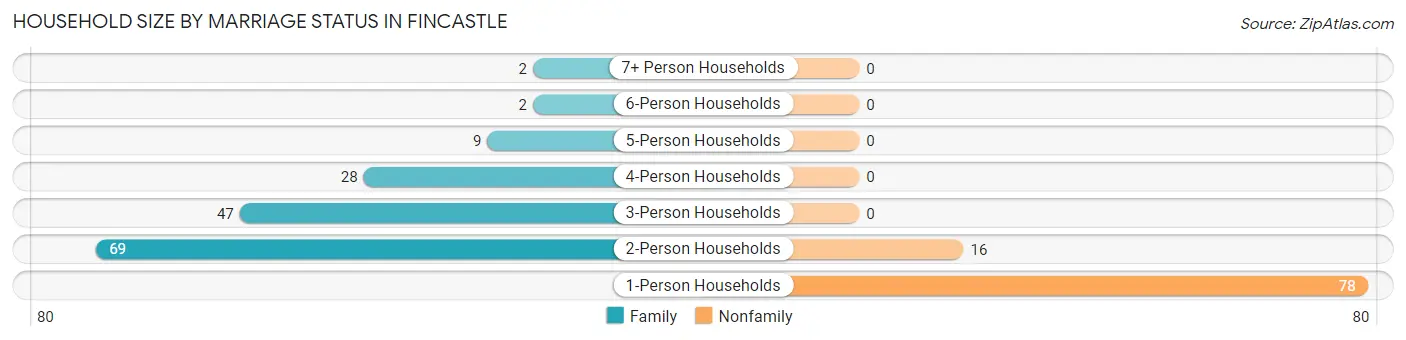
| Household Size | Family Households | Nonfamily Households |
| 1-Person Households | - | 78 (31.1%) |
| 2-Person Households | 69 (27.5%) | 16 (6.4%) |
| 3-Person Households | 47 (18.7%) | 0 (0.0%) |
| 4-Person Households | 28 (11.2%) | 0 (0.0%) |
| 5-Person Households | 9 (3.6%) | 0 (0.0%) |
| 6-Person Households | 2 (0.8%) | 0 (0.0%) |
| 7+ Person Households | 2 (0.8%) | 0 (0.0%) |
| Total | 157 (62.5%) | 94 (37.4%) |
Female Fertility in Fincastle
Fertility by Age in Fincastle
Average fertility rate in Fincastle is 17.0 births per 1,000 women. Women in the age bracket of 20 to 34 years have the highest fertility rate with 65.0 births per 1,000 women. Women in the age bracket of 20 to 34 years acount for 100.0% of all women with births.
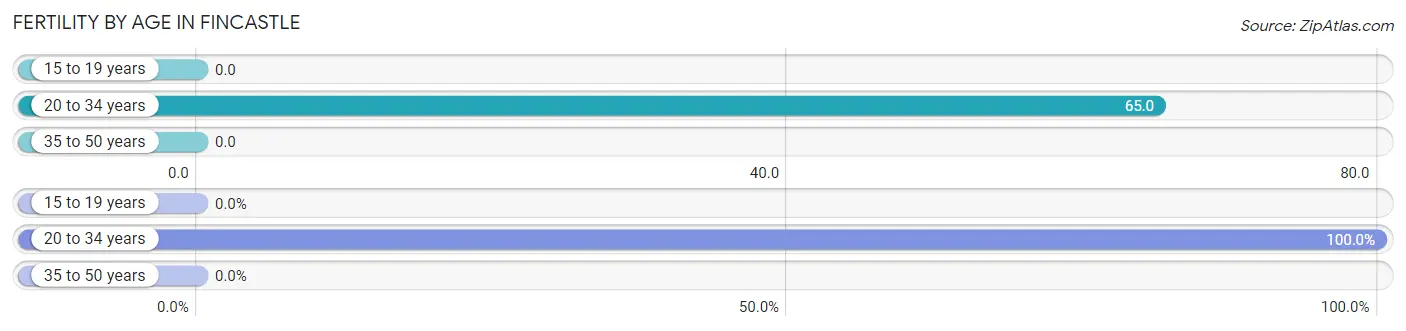
| Age Bracket | Women with Births | Births / 1,000 Women |
| 15 to 19 years | 0 (0.0%) | 0.0 |
| 20 to 34 years | 2 (100.0%) | 65.0 |
| 35 to 50 years | 0 (0.0%) | 0.0 |
| Total | 2 (100.0%) | 17.0 |
Fertility by Age by Marriage Status in Fincastle
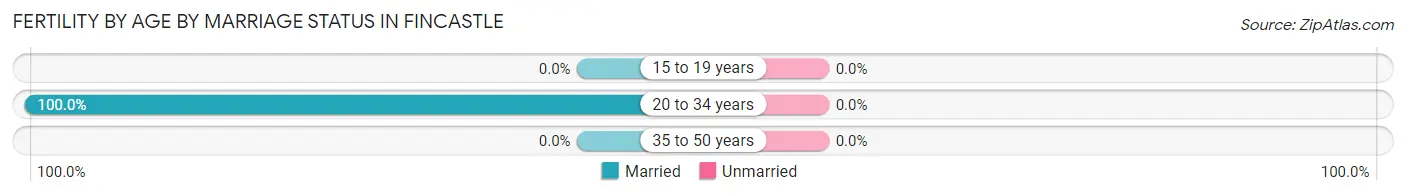
| Age Bracket | Married | Unmarried |
| 15 to 19 years | 0 (0.0%) | 0 (0.0%) |
| 20 to 34 years | 2 (100.0%) | 0 (0.0%) |
| 35 to 50 years | 0 (0.0%) | 0 (0.0%) |
| Total | 2 (100.0%) | 0 (0.0%) |
Fertility by Education in Fincastle
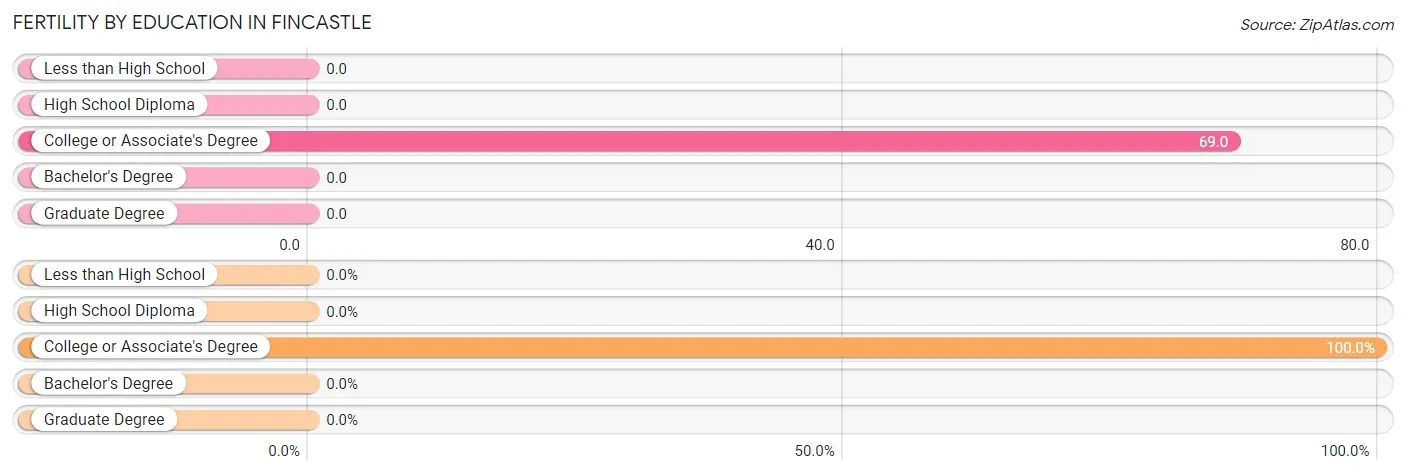
| Educational Attainment | Women with Births | Births / 1,000 Women |
| Less than High School | 0 (0.0%) | 0.0 |
| High School Diploma | 0 (0.0%) | 0.0 |
| College or Associate's Degree | 2 (100.0%) | 69.0 |
| Bachelor's Degree | 0 (0.0%) | 0.0 |
| Graduate Degree | 0 (0.0%) | 0.0 |
| Total | 2 (100.0%) | 17.0 |
Fertility by Education by Marriage Status in Fincastle
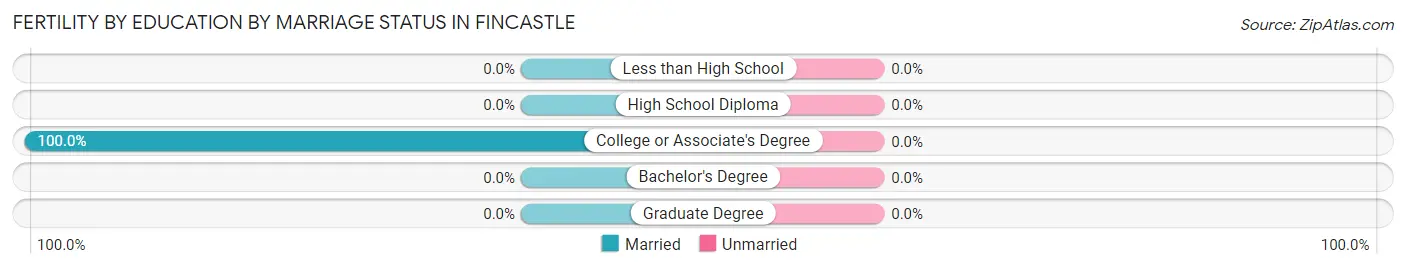
| Educational Attainment | Married | Unmarried |
| Less than High School | 0 (0.0%) | 0 (0.0%) |
| High School Diploma | 0 (0.0%) | 0 (0.0%) |
| College or Associate's Degree | 2 (100.0%) | 0 (0.0%) |
| Bachelor's Degree | 0 (0.0%) | 0 (0.0%) |
| Graduate Degree | 0 (0.0%) | 0 (0.0%) |
| Total | 2 (100.0%) | 0 (0.0%) |
Employment Characteristics in Fincastle
Employment by Class of Employer in Fincastle
Among the 305 employed individuals in Fincastle, private company employees (250 | 82.0%), not-for-profit organizations (29 | 9.5%), and local government employees (14 | 4.6%) make up the most common classes of employment.
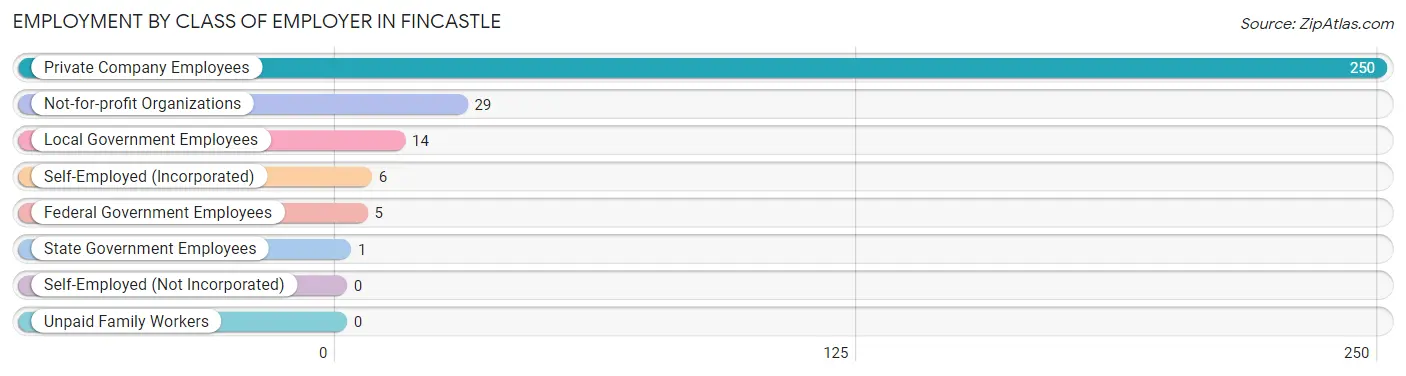
| Employer Class | # Employees | % Employees |
| Private Company Employees | 250 | 82.0% |
| Self-Employed (Incorporated) | 6 | 2.0% |
| Self-Employed (Not Incorporated) | 0 | 0.0% |
| Not-for-profit Organizations | 29 | 9.5% |
| Local Government Employees | 14 | 4.6% |
| State Government Employees | 1 | 0.3% |
| Federal Government Employees | 5 | 1.6% |
| Unpaid Family Workers | 0 | 0.0% |
| Total | 305 | 100.0% |
Employment Status by Age in Fincastle
According to the labor force statistics for Fincastle, out of the total population over 16 years of age (500), 65.4% or 327 individuals are in the labor force, with 3.1% or 10 of them unemployed. The age group with the highest labor force participation rate is 25 to 29 years, with 95.8% or 23 individuals in the labor force. Within the labor force, the 16 to 19 years age range has the highest percentage of unemployed individuals, with 25.0% or 4 of them being unemployed.
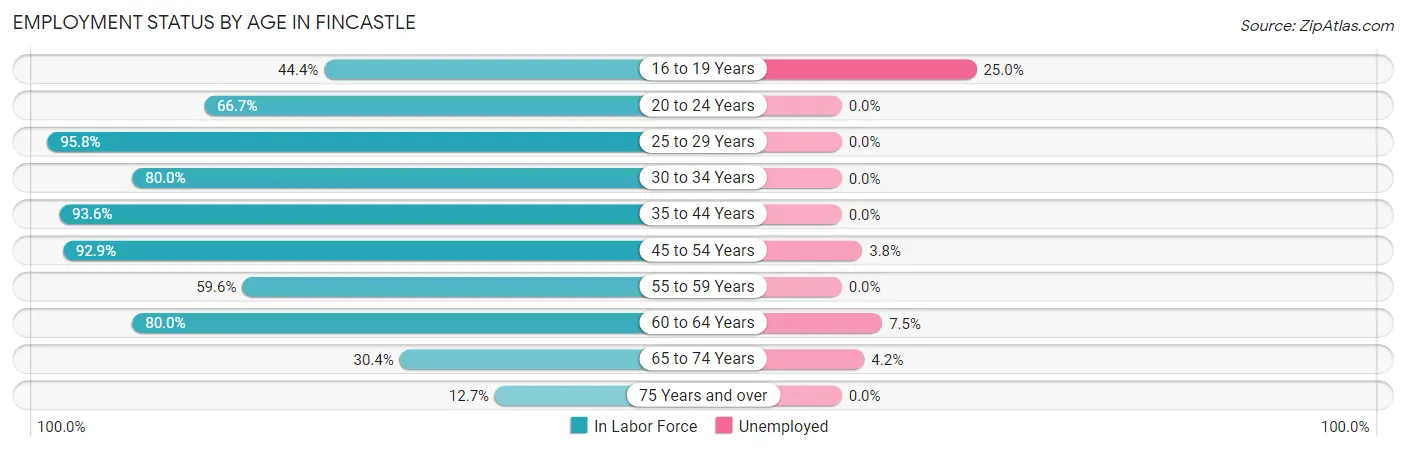
| Age Bracket | In Labor Force | Unemployed |
| 16 to 19 Years | 16 (44.4%) | 4 (25.0%) |
| 20 to 24 Years | 12 (66.7%) | 0 (0.0%) |
| 25 to 29 Years | 23 (95.8%) | 0 (0.0%) |
| 30 to 34 Years | 8 (80.0%) | 0 (0.0%) |
| 35 to 44 Years | 117 (93.6%) | 0 (0.0%) |
| 45 to 54 Years | 52 (92.9%) | 2 (3.8%) |
| 55 to 59 Years | 28 (59.6%) | 0 (0.0%) |
| 60 to 64 Years | 40 (80.0%) | 3 (7.5%) |
| 65 to 74 Years | 24 (30.4%) | 1 (4.2%) |
| 75 Years and over | 7 (12.7%) | 0 (0.0%) |
| Total | 327 (65.4%) | 10 (3.1%) |
Employment Status by Educational Attainment in Fincastle
According to labor force statistics for Fincastle, 85.9% of individuals (268) out of the total population between 25 and 64 years of age (312) are in the labor force, with 1.9% or 5 of them being unemployed. The group with the highest labor force participation rate are those with the educational attainment of bachelor's degree or higher, with 94.1% or 128 individuals in the labor force. Within the labor force, individuals with bachelor's degree or higher education have the highest percentage of unemployment, with 3.9% or 5 of them being unemployed.
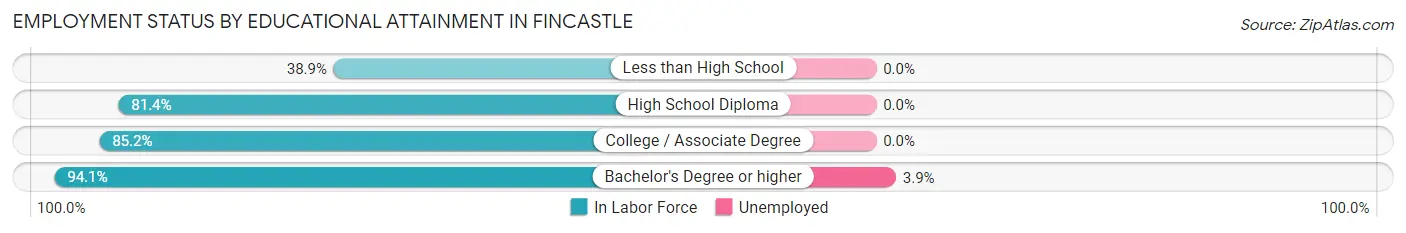
| Educational Attainment | In Labor Force | Unemployed |
| Less than High School | 7 (38.9%) | 0 (0.0%) |
| High School Diploma | 35 (81.4%) | 0 (0.0%) |
| College / Associate Degree | 98 (85.2%) | 0 (0.0%) |
| Bachelor's Degree or higher | 128 (94.1%) | 5 (3.9%) |
| Total | 268 (85.9%) | 6 (1.9%) |
Employment Occupations by Sex in Fincastle
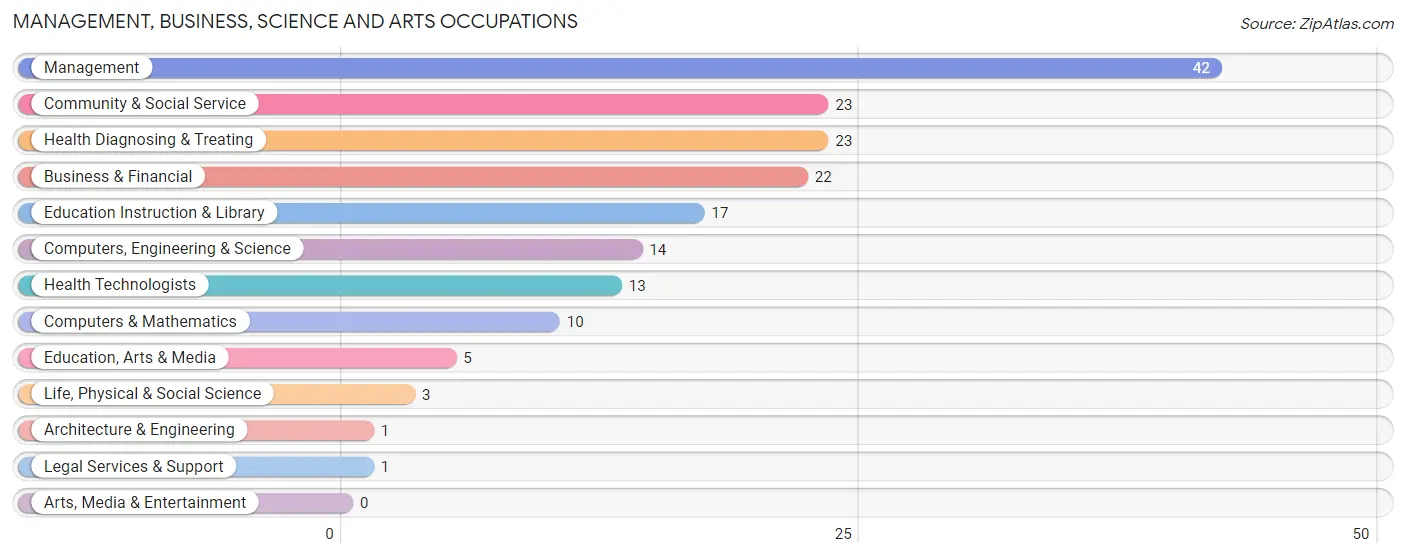
Management, Business, Science and Arts Occupations
The most common Management, Business, Science and Arts occupations in Fincastle are Management (42 | 13.3%), Community & Social Service (23 | 7.3%), Health Diagnosing & Treating (23 | 7.3%), Business & Financial (22 | 6.9%), and Education Instruction & Library (17 | 5.4%).
Management, Business, Science and Arts Occupations by Sex
Within the Management, Business, Science and Arts occupations in Fincastle, the most male-oriented occupations are Computers & Mathematics (100.0%), Architecture & Engineering (100.0%), and Computers, Engineering & Science (78.6%), while the most female-oriented occupations are Life, Physical & Social Science (100.0%), Education, Arts & Media (100.0%), and Legal Services & Support (100.0%).
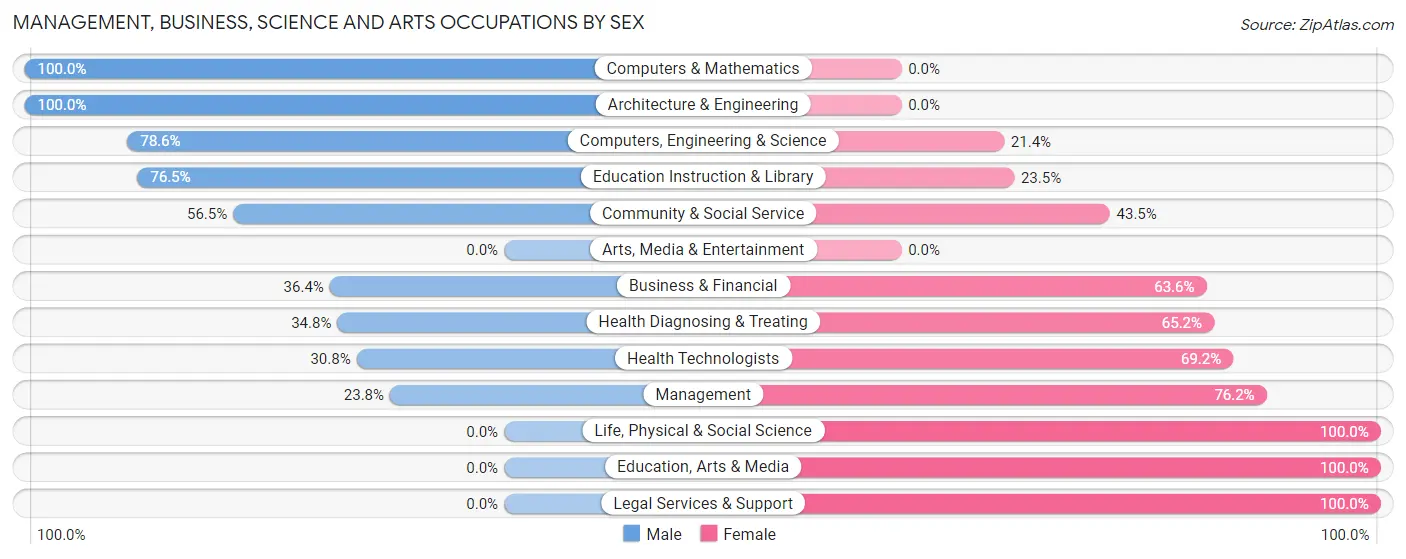
| Occupation | Male | Female |
| Management | 10 (23.8%) | 32 (76.2%) |
| Business & Financial | 8 (36.4%) | 14 (63.6%) |
| Computers, Engineering & Science | 11 (78.6%) | 3 (21.4%) |
| Computers & Mathematics | 10 (100.0%) | 0 (0.0%) |
| Architecture & Engineering | 1 (100.0%) | 0 (0.0%) |
| Life, Physical & Social Science | 0 (0.0%) | 3 (100.0%) |
| Community & Social Service | 13 (56.5%) | 10 (43.5%) |
| Education, Arts & Media | 0 (0.0%) | 5 (100.0%) |
| Legal Services & Support | 0 (0.0%) | 1 (100.0%) |
| Education Instruction & Library | 13 (76.5%) | 4 (23.5%) |
| Arts, Media & Entertainment | 0 (0.0%) | 0 (0.0%) |
| Health Diagnosing & Treating | 8 (34.8%) | 15 (65.2%) |
| Health Technologists | 4 (30.8%) | 9 (69.2%) |
| Total (Category) | 50 (40.3%) | 74 (59.7%) |
| Total (Overall) | 165 (52.0%) | 152 (47.9%) |
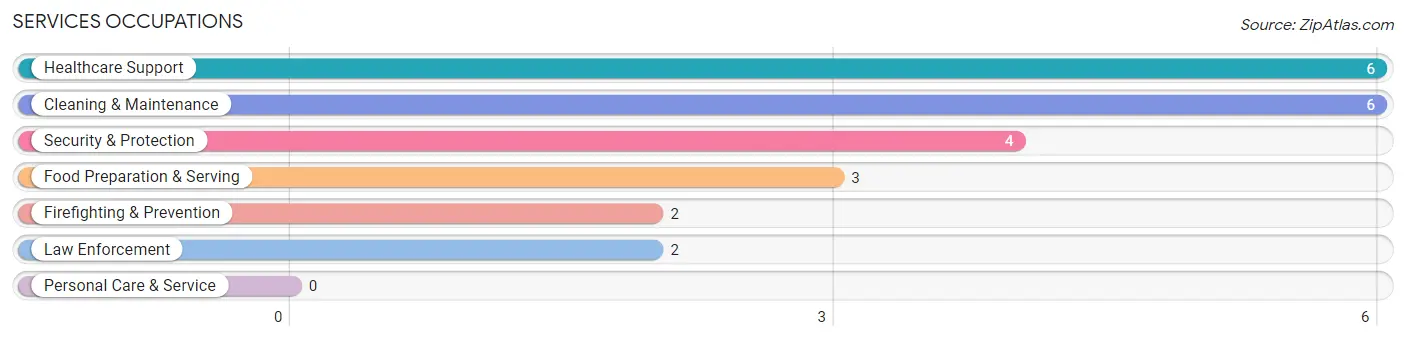
Services Occupations
The most common Services occupations in Fincastle are Healthcare Support (6 | 1.9%), Cleaning & Maintenance (6 | 1.9%), Security & Protection (4 | 1.3%), Food Preparation & Serving (3 | 0.9%), and Firefighting & Prevention (2 | 0.6%).
Services Occupations by Sex
Within the Services occupations in Fincastle, the most male-oriented occupations are Security & Protection (100.0%), Firefighting & Prevention (100.0%), and Law Enforcement (100.0%), while the most female-oriented occupations are Healthcare Support (100.0%), and Food Preparation & Serving (33.3%).
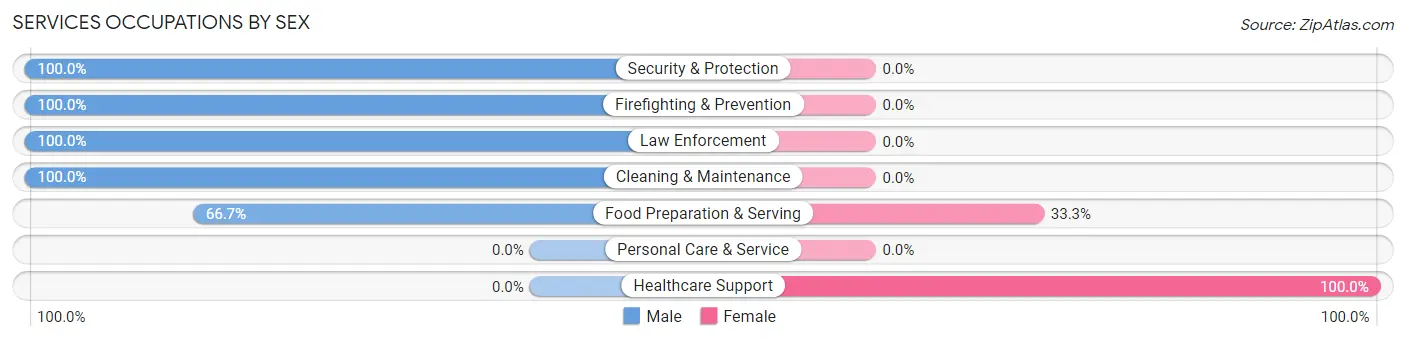
| Occupation | Male | Female |
| Healthcare Support | 0 (0.0%) | 6 (100.0%) |
| Security & Protection | 4 (100.0%) | 0 (0.0%) |
| Firefighting & Prevention | 2 (100.0%) | 0 (0.0%) |
| Law Enforcement | 2 (100.0%) | 0 (0.0%) |
| Food Preparation & Serving | 2 (66.7%) | 1 (33.3%) |
| Cleaning & Maintenance | 6 (100.0%) | 0 (0.0%) |
| Personal Care & Service | 0 (0.0%) | 0 (0.0%) |
| Total (Category) | 12 (63.2%) | 7 (36.8%) |
| Total (Overall) | 165 (52.0%) | 152 (47.9%) |
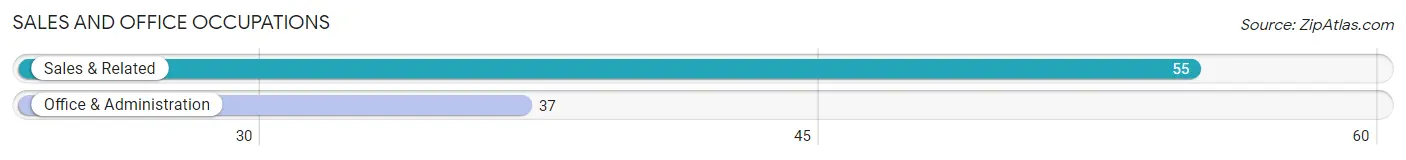
Sales and Office Occupations
The most common Sales and Office occupations in Fincastle are Sales & Related (55 | 17.3%), and Office & Administration (37 | 11.7%).
Sales and Office Occupations by Sex
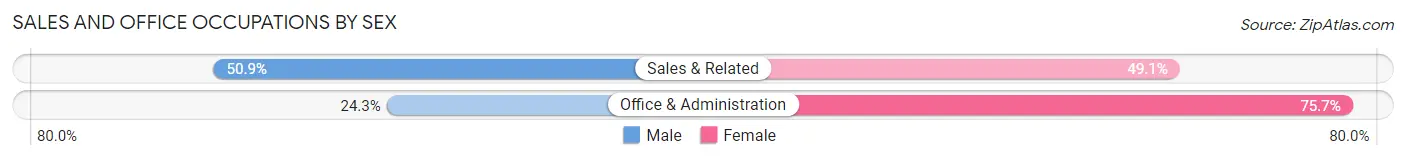
| Occupation | Male | Female |
| Sales & Related | 28 (50.9%) | 27 (49.1%) |
| Office & Administration | 9 (24.3%) | 28 (75.7%) |
| Total (Category) | 37 (40.2%) | 55 (59.8%) |
| Total (Overall) | 165 (52.0%) | 152 (47.9%) |
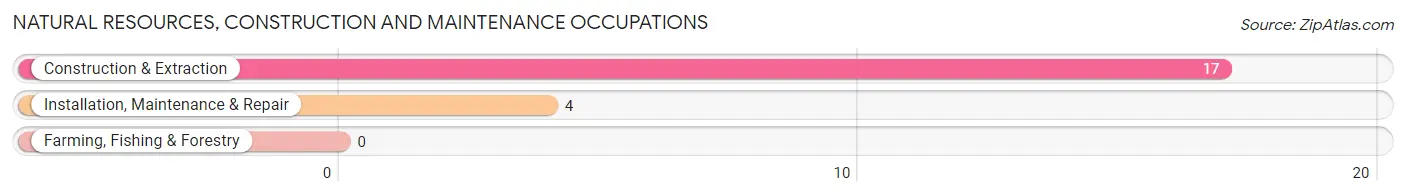
Natural Resources, Construction and Maintenance Occupations
The most common Natural Resources, Construction and Maintenance occupations in Fincastle are Construction & Extraction (17 | 5.4%), and Installation, Maintenance & Repair (4 | 1.3%).
Natural Resources, Construction and Maintenance Occupations by Sex
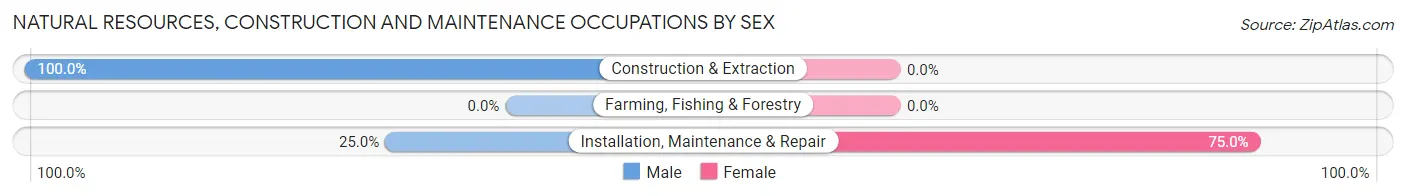
| Occupation | Male | Female |
| Farming, Fishing & Forestry | 0 (0.0%) | 0 (0.0%) |
| Construction & Extraction | 17 (100.0%) | 0 (0.0%) |
| Installation, Maintenance & Repair | 1 (25.0%) | 3 (75.0%) |
| Total (Category) | 18 (85.7%) | 3 (14.3%) |
| Total (Overall) | 165 (52.0%) | 152 (47.9%) |
Production, Transportation and Moving Occupations
The most common Production, Transportation and Moving occupations in Fincastle are Transportation (27 | 8.5%), Production (17 | 5.4%), and Material Moving (17 | 5.4%).
Production, Transportation and Moving Occupations by Sex
| Occupation | Male | Female |
| Production | 12 (70.6%) | 5 (29.4%) |
| Transportation | 23 (85.2%) | 4 (14.8%) |
| Material Moving | 13 (76.5%) | 4 (23.5%) |
| Total (Category) | 48 (78.7%) | 13 (21.3%) |
| Total (Overall) | 165 (52.0%) | 152 (47.9%) |
Employment Industries by Sex in Fincastle
Employment Industries in Fincastle
The major employment industries in Fincastle include Health Care & Social Assistance (54 | 17.0%), Finance & Insurance (53 | 16.7%), Retail Trade (52 | 16.4%), Administrative & Support (22 | 6.9%), and Educational Services (22 | 6.9%).
Employment Industries by Sex in Fincastle
The Fincastle industries that see more men than women are Real Estate, Rental & Leasing (100.0%), Arts, Entertainment & Recreation (100.0%), and Administrative & Support (90.9%), whereas the industries that tend to have a higher number of women are Information (100.0%), Finance & Insurance (79.2%), and Health Care & Social Assistance (61.1%).
| Industry | Male | Female |
| Agriculture, Fishing & Hunting | 0 (0.0%) | 0 (0.0%) |
| Mining, Quarrying, & Extraction | 0 (0.0%) | 0 (0.0%) |
| Construction | 11 (57.9%) | 8 (42.1%) |
| Manufacturing | 17 (89.5%) | 2 (10.5%) |
| Wholesale Trade | 12 (85.7%) | 2 (14.3%) |
| Retail Trade | 21 (40.4%) | 31 (59.6%) |
| Transportation & Warehousing | 15 (88.2%) | 2 (11.8%) |
| Utilities | 2 (40.0%) | 3 (60.0%) |
| Information | 0 (0.0%) | 2 (100.0%) |
| Finance & Insurance | 11 (20.7%) | 42 (79.2%) |
| Real Estate, Rental & Leasing | 1 (100.0%) | 0 (0.0%) |
| Professional & Scientific | 4 (40.0%) | 6 (60.0%) |
| Enterprise Management | 0 (0.0%) | 0 (0.0%) |
| Administrative & Support | 20 (90.9%) | 2 (9.1%) |
| Educational Services | 14 (63.6%) | 8 (36.4%) |
| Health Care & Social Assistance | 21 (38.9%) | 33 (61.1%) |
| Arts, Entertainment & Recreation | 10 (100.0%) | 0 (0.0%) |
| Accommodation & Food Services | 4 (57.1%) | 3 (42.9%) |
| Public Administration | 2 (66.7%) | 1 (33.3%) |
| Total | 165 (52.0%) | 152 (47.9%) |
Education in Fincastle
School Enrollment in Fincastle
The most common levels of schooling among the 130 students in Fincastle are middle school (36 | 27.7%), high school (35 | 26.9%), and elementary school (17 | 13.1%).
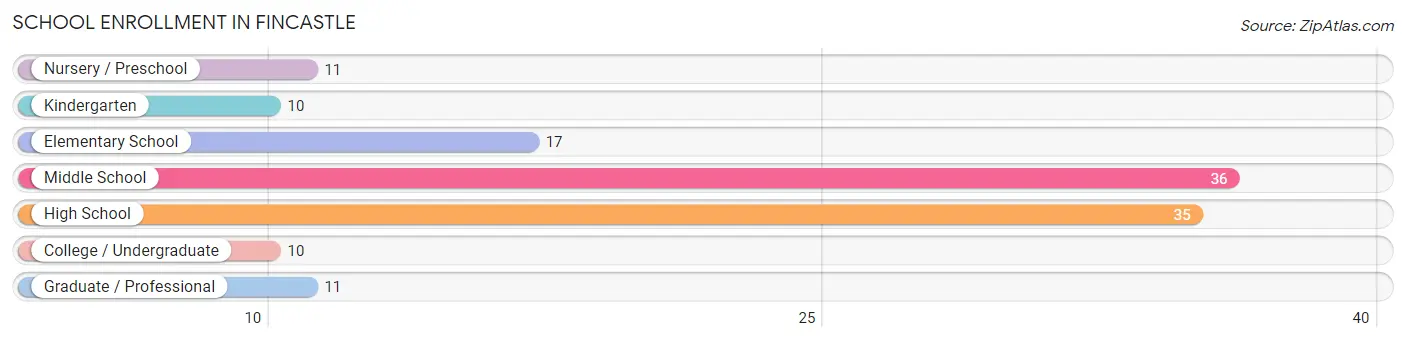
| School Level | # Students | % Students |
| Nursery / Preschool | 11 | 8.5% |
| Kindergarten | 10 | 7.7% |
| Elementary School | 17 | 13.1% |
| Middle School | 36 | 27.7% |
| High School | 35 | 26.9% |
| College / Undergraduate | 10 | 7.7% |
| Graduate / Professional | 11 | 8.5% |
| Total | 130 | 100.0% |
School Enrollment by Age by Funding Source in Fincastle
Out of a total of 130 students who are enrolled in schools in Fincastle, 34 (26.2%) attend a private institution, while the remaining 96 (73.8%) are enrolled in public schools. The age group of 35 years and over has the highest likelihood of being enrolled in private schools, with 6 (85.7% in the age bracket) enrolled. Conversely, the age group of 3 to 4 year olds has the lowest likelihood of being enrolled in a private school, with 2 (100.0% in the age bracket) attending a public institution.
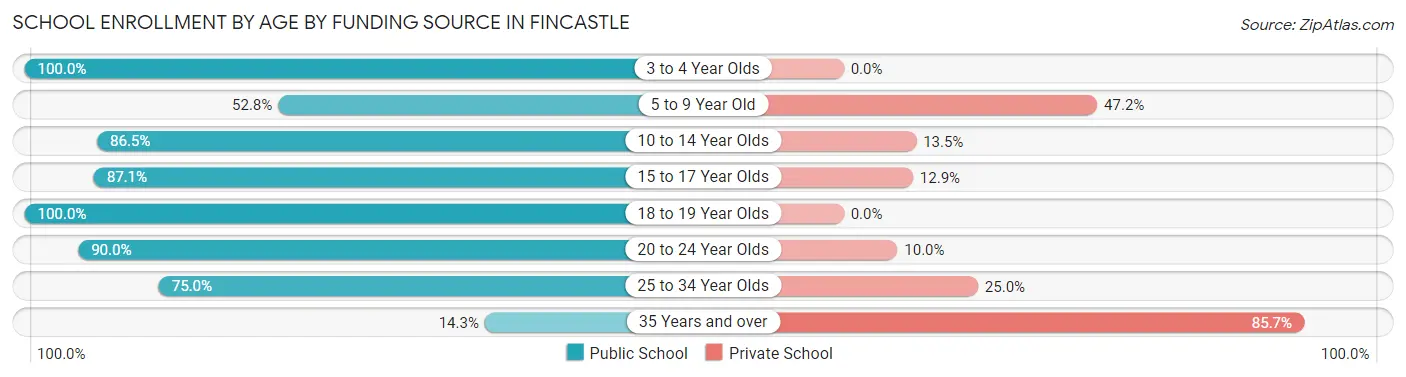
| Age Bracket | Public School | Private School |
| 3 to 4 Year Olds | 2 (100.0%) | 0 (0.0%) |
| 5 to 9 Year Old | 19 (52.8%) | 17 (47.2%) |
| 10 to 14 Year Olds | 32 (86.5%) | 5 (13.5%) |
| 15 to 17 Year Olds | 27 (87.1%) | 4 (12.9%) |
| 18 to 19 Year Olds | 3 (100.0%) | 0 (0.0%) |
| 20 to 24 Year Olds | 9 (90.0%) | 1 (10.0%) |
| 25 to 34 Year Olds | 3 (75.0%) | 1 (25.0%) |
| 35 Years and over | 1 (14.3%) | 6 (85.7%) |
| Total | 96 (73.8%) | 34 (26.2%) |
Educational Attainment by Field of Study in Fincastle
Business (74 | 40.4%), psychology (16 | 8.7%), education (13 | 7.1%), computers & mathematics (11 | 6.0%), and science & technology (11 | 6.0%) are the most common fields of study among 183 individuals in Fincastle who have obtained a bachelor's degree or higher.
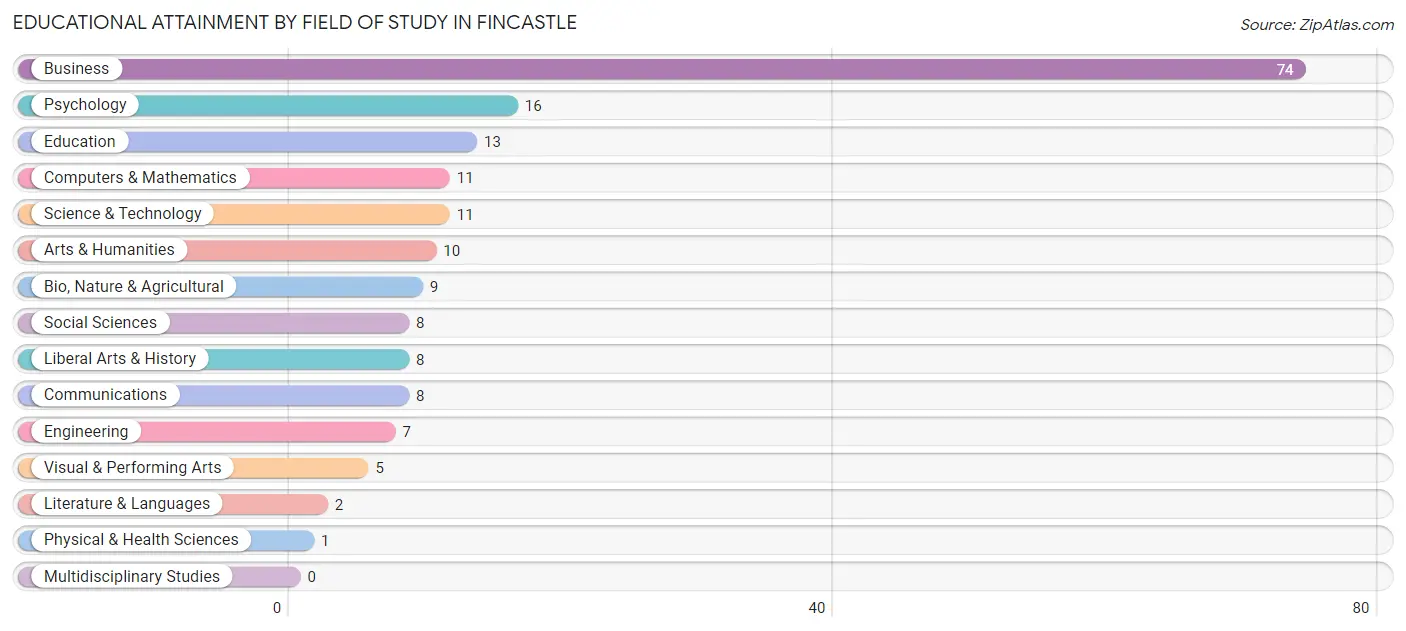
| Field of Study | # Graduates | % Graduates |
| Computers & Mathematics | 11 | 6.0% |
| Bio, Nature & Agricultural | 9 | 4.9% |
| Physical & Health Sciences | 1 | 0.5% |
| Psychology | 16 | 8.7% |
| Social Sciences | 8 | 4.4% |
| Engineering | 7 | 3.8% |
| Multidisciplinary Studies | 0 | 0.0% |
| Science & Technology | 11 | 6.0% |
| Business | 74 | 40.4% |
| Education | 13 | 7.1% |
| Literature & Languages | 2 | 1.1% |
| Liberal Arts & History | 8 | 4.4% |
| Visual & Performing Arts | 5 | 2.7% |
| Communications | 8 | 4.4% |
| Arts & Humanities | 10 | 5.5% |
| Total | 183 | 100.0% |
Transportation & Commute in Fincastle
Vehicle Availability by Sex in Fincastle
The most prevalent vehicle ownership categories in Fincastle are males with 2 vehicles (85, accounting for 52.8%) and females with 2 vehicles (74, making up 59.0%).
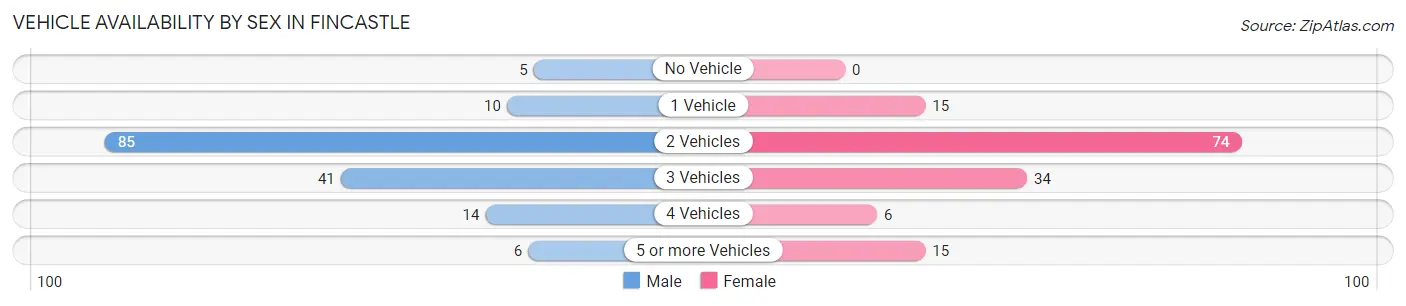
| Vehicles Available | Male | Female |
| No Vehicle | 5 (3.1%) | 0 (0.0%) |
| 1 Vehicle | 10 (6.2%) | 15 (10.4%) |
| 2 Vehicles | 85 (52.8%) | 74 (51.4%) |
| 3 Vehicles | 41 (25.5%) | 34 (23.6%) |
| 4 Vehicles | 14 (8.7%) | 6 (4.2%) |
| 5 or more Vehicles | 6 (3.7%) | 15 (10.4%) |
| Total | 161 (100.0%) | 144 (100.0%) |
Commute Time in Fincastle
The most frequently occuring commute durations in Fincastle are 20 to 24 minutes (56 commuters, 19.7%), 10 to 14 minutes (49 commuters, 17.2%), and 30 to 34 minutes (42 commuters, 14.7%).
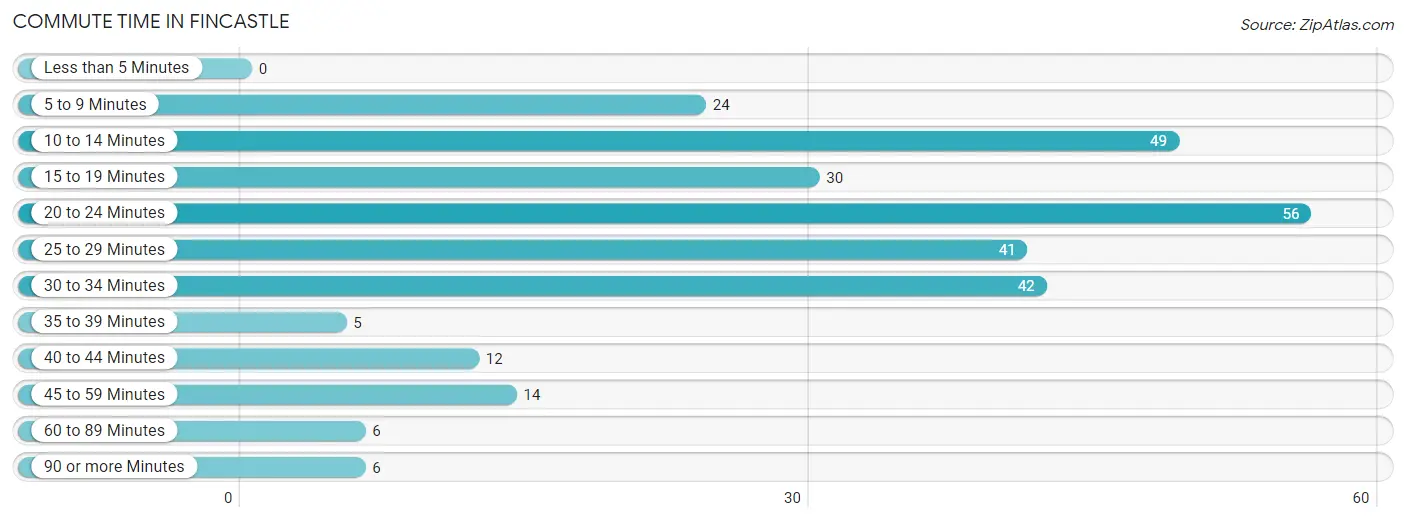
| Commute Time | # Commuters | % Commuters |
| Less than 5 Minutes | 0 | 0.0% |
| 5 to 9 Minutes | 24 | 8.4% |
| 10 to 14 Minutes | 49 | 17.2% |
| 15 to 19 Minutes | 30 | 10.5% |
| 20 to 24 Minutes | 56 | 19.7% |
| 25 to 29 Minutes | 41 | 14.4% |
| 30 to 34 Minutes | 42 | 14.7% |
| 35 to 39 Minutes | 5 | 1.8% |
| 40 to 44 Minutes | 12 | 4.2% |
| 45 to 59 Minutes | 14 | 4.9% |
| 60 to 89 Minutes | 6 | 2.1% |
| 90 or more Minutes | 6 | 2.1% |
Commute Time by Sex in Fincastle
The most common commute times in Fincastle are 20 to 24 minutes (38 commuters, 25.0%) for males and 30 to 34 minutes (28 commuters, 21.0%) for females.
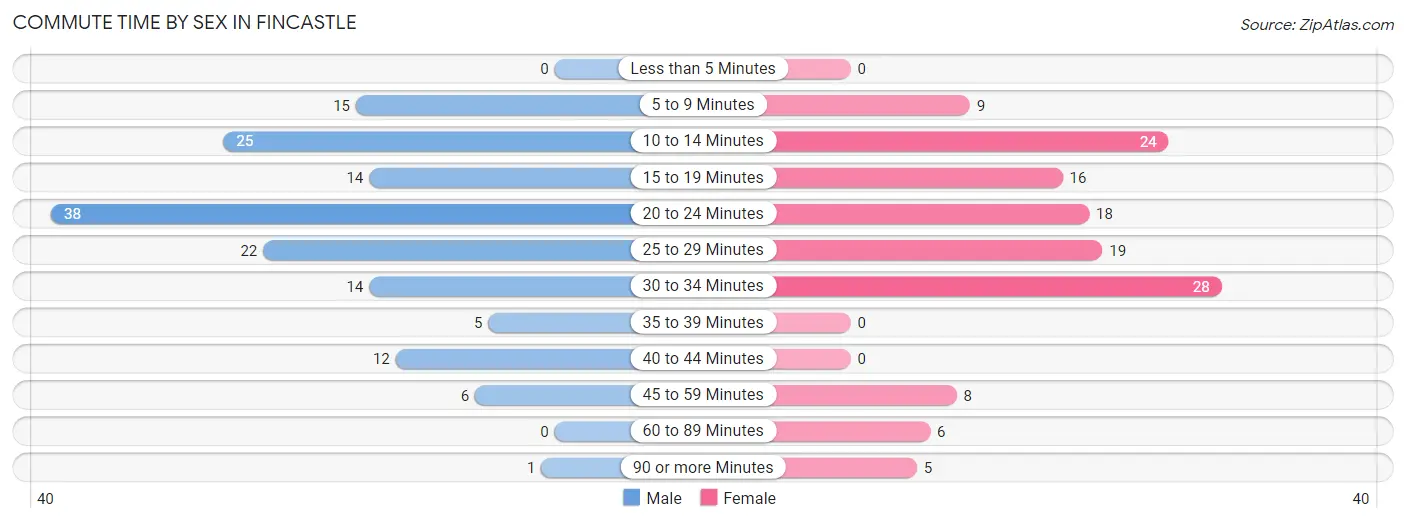
| Commute Time | Male | Female |
| Less than 5 Minutes | 0 (0.0%) | 0 (0.0%) |
| 5 to 9 Minutes | 15 (9.9%) | 9 (6.8%) |
| 10 to 14 Minutes | 25 (16.5%) | 24 (18.0%) |
| 15 to 19 Minutes | 14 (9.2%) | 16 (12.0%) |
| 20 to 24 Minutes | 38 (25.0%) | 18 (13.5%) |
| 25 to 29 Minutes | 22 (14.5%) | 19 (14.3%) |
| 30 to 34 Minutes | 14 (9.2%) | 28 (21.0%) |
| 35 to 39 Minutes | 5 (3.3%) | 0 (0.0%) |
| 40 to 44 Minutes | 12 (7.9%) | 0 (0.0%) |
| 45 to 59 Minutes | 6 (4.0%) | 8 (6.0%) |
| 60 to 89 Minutes | 0 (0.0%) | 6 (4.5%) |
| 90 or more Minutes | 1 (0.7%) | 5 (3.8%) |
Time of Departure to Work by Sex in Fincastle
The most frequent times of departure to work in Fincastle are 7:00 AM to 7:29 AM (27, 17.8%) for males and 7:30 AM to 7:59 AM (27, 20.3%) for females.
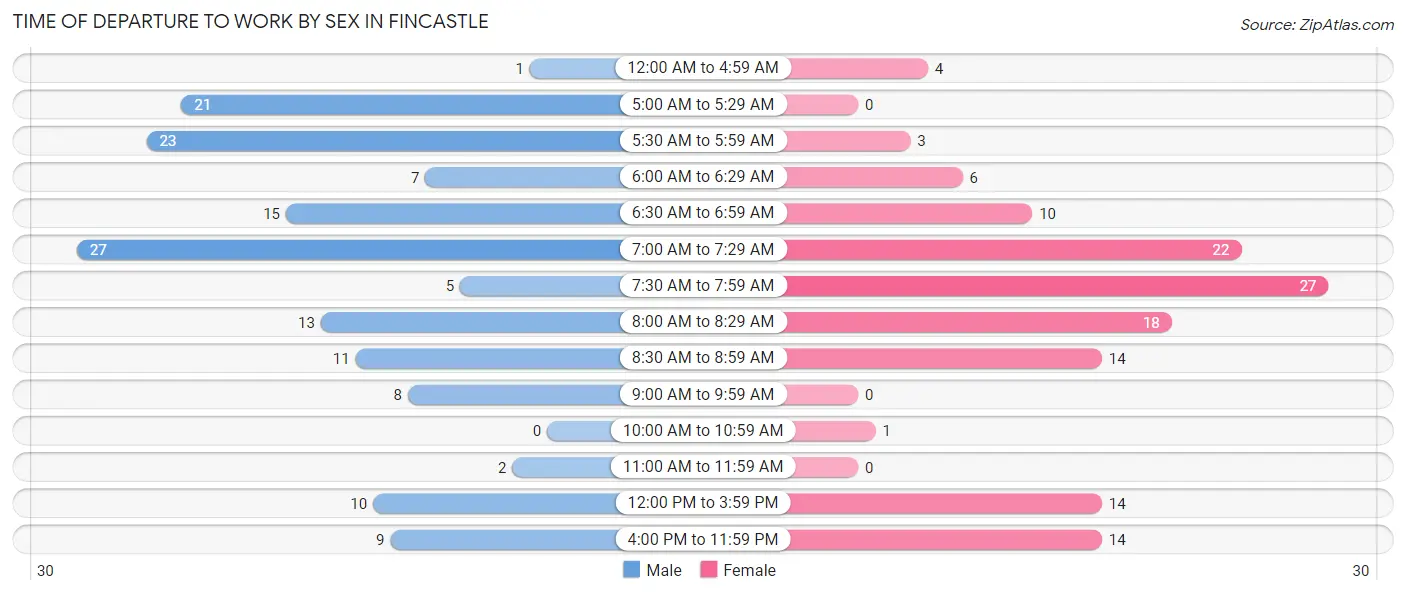
| Time of Departure | Male | Female |
| 12:00 AM to 4:59 AM | 1 (0.7%) | 4 (3.0%) |
| 5:00 AM to 5:29 AM | 21 (13.8%) | 0 (0.0%) |
| 5:30 AM to 5:59 AM | 23 (15.1%) | 3 (2.3%) |
| 6:00 AM to 6:29 AM | 7 (4.6%) | 6 (4.5%) |
| 6:30 AM to 6:59 AM | 15 (9.9%) | 10 (7.5%) |
| 7:00 AM to 7:29 AM | 27 (17.8%) | 22 (16.5%) |
| 7:30 AM to 7:59 AM | 5 (3.3%) | 27 (20.3%) |
| 8:00 AM to 8:29 AM | 13 (8.6%) | 18 (13.5%) |
| 8:30 AM to 8:59 AM | 11 (7.2%) | 14 (10.5%) |
| 9:00 AM to 9:59 AM | 8 (5.3%) | 0 (0.0%) |
| 10:00 AM to 10:59 AM | 0 (0.0%) | 1 (0.7%) |
| 11:00 AM to 11:59 AM | 2 (1.3%) | 0 (0.0%) |
| 12:00 PM to 3:59 PM | 10 (6.6%) | 14 (10.5%) |
| 4:00 PM to 11:59 PM | 9 (5.9%) | 14 (10.5%) |
| Total | 152 (100.0%) | 133 (100.0%) |
Housing Occupancy in Fincastle
Occupancy by Ownership in Fincastle
Of the total 251 dwellings in Fincastle, owner-occupied units account for 220 (87.6%), while renter-occupied units make up 31 (12.3%).
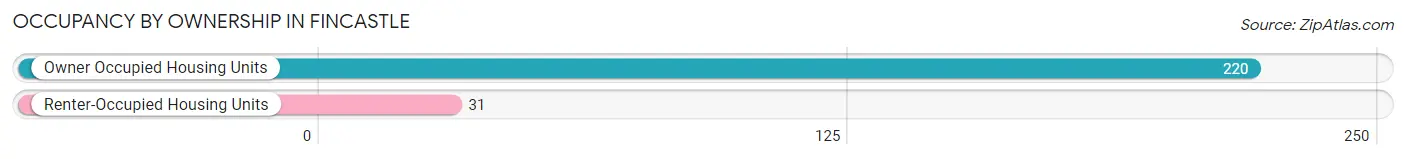
| Occupancy | # Housing Units | % Housing Units |
| Owner Occupied Housing Units | 220 | 87.6% |
| Renter-Occupied Housing Units | 31 | 12.3% |
| Total Occupied Housing Units | 251 | 100.0% |
Occupancy by Household Size in Fincastle
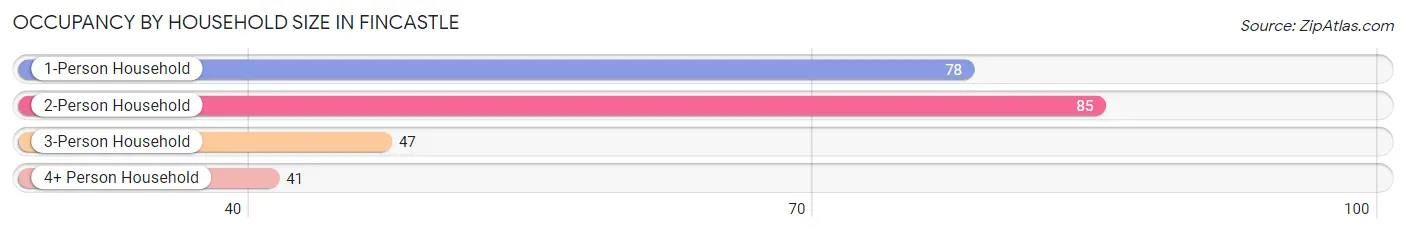
| Household Size | # Housing Units | % Housing Units |
| 1-Person Household | 78 | 31.1% |
| 2-Person Household | 85 | 33.9% |
| 3-Person Household | 47 | 18.7% |
| 4+ Person Household | 41 | 16.3% |
| Total Housing Units | 251 | 100.0% |
Occupancy by Ownership by Household Size in Fincastle
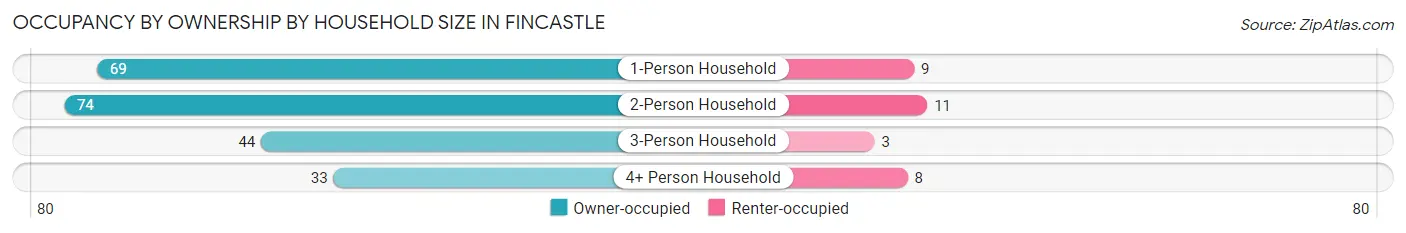
| Household Size | Owner-occupied | Renter-occupied |
| 1-Person Household | 69 (88.5%) | 9 (11.5%) |
| 2-Person Household | 74 (87.1%) | 11 (12.9%) |
| 3-Person Household | 44 (93.6%) | 3 (6.4%) |
| 4+ Person Household | 33 (80.5%) | 8 (19.5%) |
| Total Housing Units | 220 (87.6%) | 31 (12.3%) |
Occupancy by Educational Attainment in Fincastle
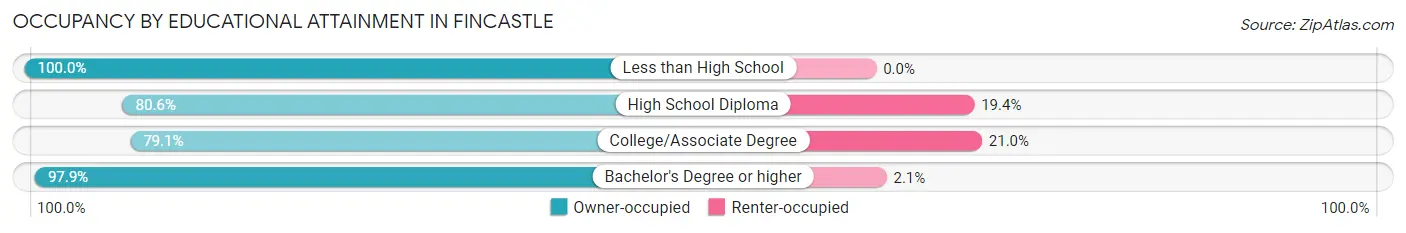
| Household Size | Owner-occupied | Renter-occupied |
| Less than High School | 13 (100.0%) | 0 (0.0%) |
| High School Diploma | 29 (80.6%) | 7 (19.4%) |
| College/Associate Degree | 83 (79.0%) | 22 (20.9%) |
| Bachelor's Degree or higher | 95 (97.9%) | 2 (2.1%) |
Occupancy by Age of Householder in Fincastle
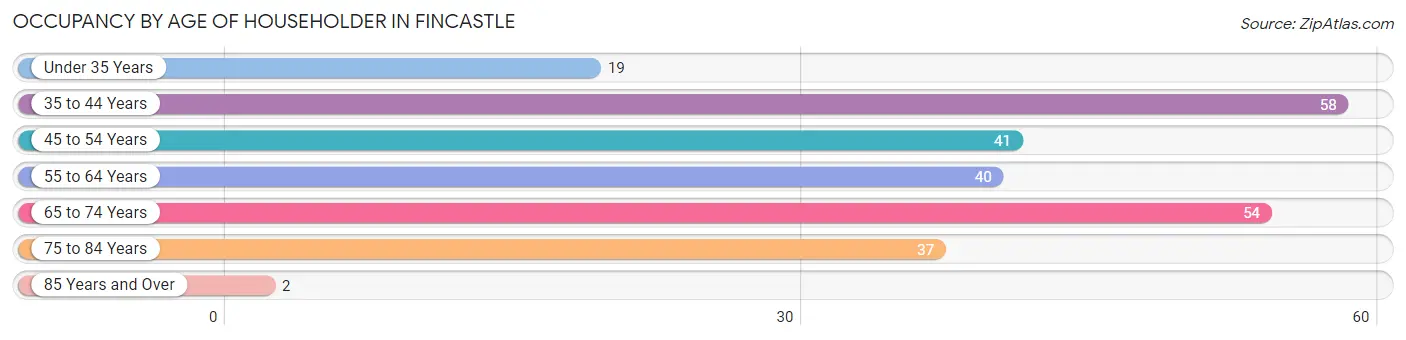
| Age Bracket | # Households | % Households |
| Under 35 Years | 19 | 7.6% |
| 35 to 44 Years | 58 | 23.1% |
| 45 to 54 Years | 41 | 16.3% |
| 55 to 64 Years | 40 | 15.9% |
| 65 to 74 Years | 54 | 21.5% |
| 75 to 84 Years | 37 | 14.7% |
| 85 Years and Over | 2 | 0.8% |
| Total | 251 | 100.0% |
Housing Finances in Fincastle
Median Income by Occupancy in Fincastle
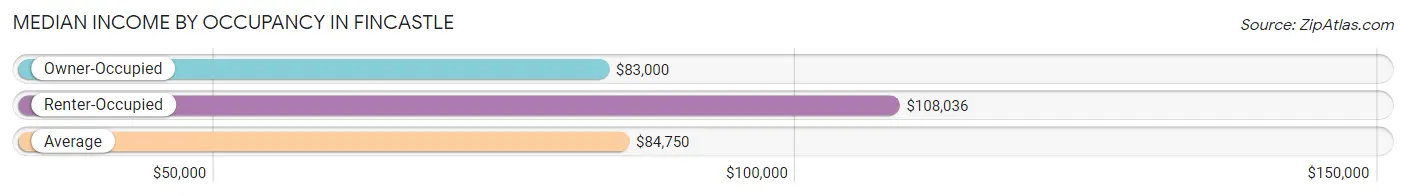
| Occupancy Type | # Households | Median Income |
| Owner-Occupied | 220 (87.6%) | $83,000 |
| Renter-Occupied | 31 (12.3%) | $108,036 |
| Average | 251 (100.0%) | $84,750 |
Occupancy by Householder Income Bracket in Fincastle
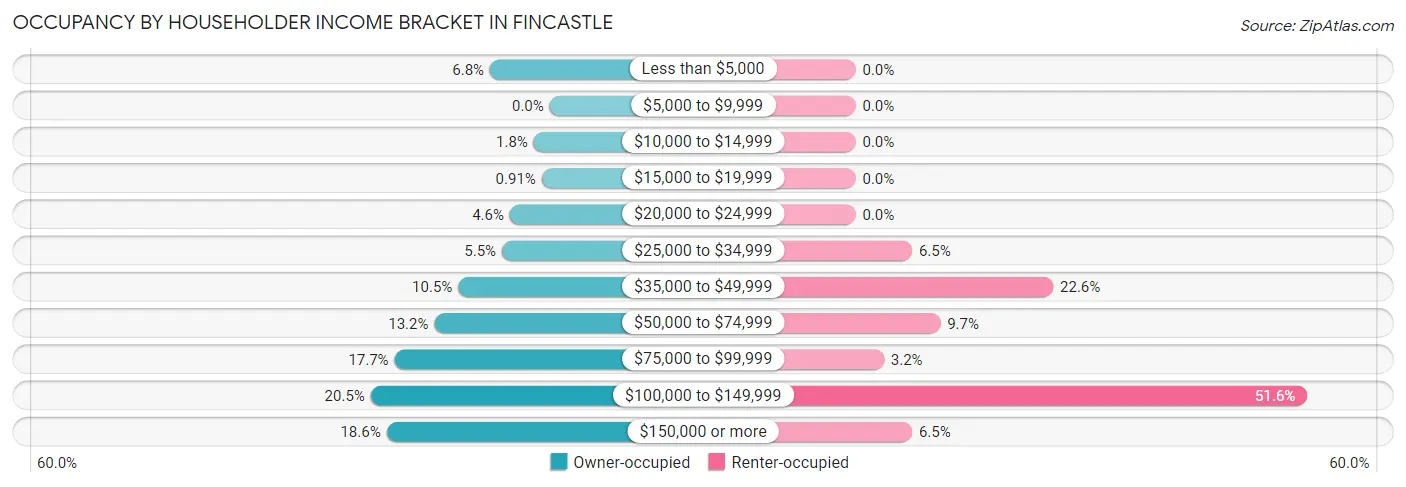
| Income Bracket | Owner-occupied | Renter-occupied |
| Less than $5,000 | 15 (6.8%) | 0 (0.0%) |
| $5,000 to $9,999 | 0 (0.0%) | 0 (0.0%) |
| $10,000 to $14,999 | 4 (1.8%) | 0 (0.0%) |
| $15,000 to $19,999 | 2 (0.9%) | 0 (0.0%) |
| $20,000 to $24,999 | 10 (4.5%) | 0 (0.0%) |
| $25,000 to $34,999 | 12 (5.4%) | 2 (6.5%) |
| $35,000 to $49,999 | 23 (10.4%) | 7 (22.6%) |
| $50,000 to $74,999 | 29 (13.2%) | 3 (9.7%) |
| $75,000 to $99,999 | 39 (17.7%) | 1 (3.2%) |
| $100,000 to $149,999 | 45 (20.4%) | 16 (51.6%) |
| $150,000 or more | 41 (18.6%) | 2 (6.5%) |
| Total | 220 (100.0%) | 31 (100.0%) |
Monthly Housing Cost Tiers in Fincastle
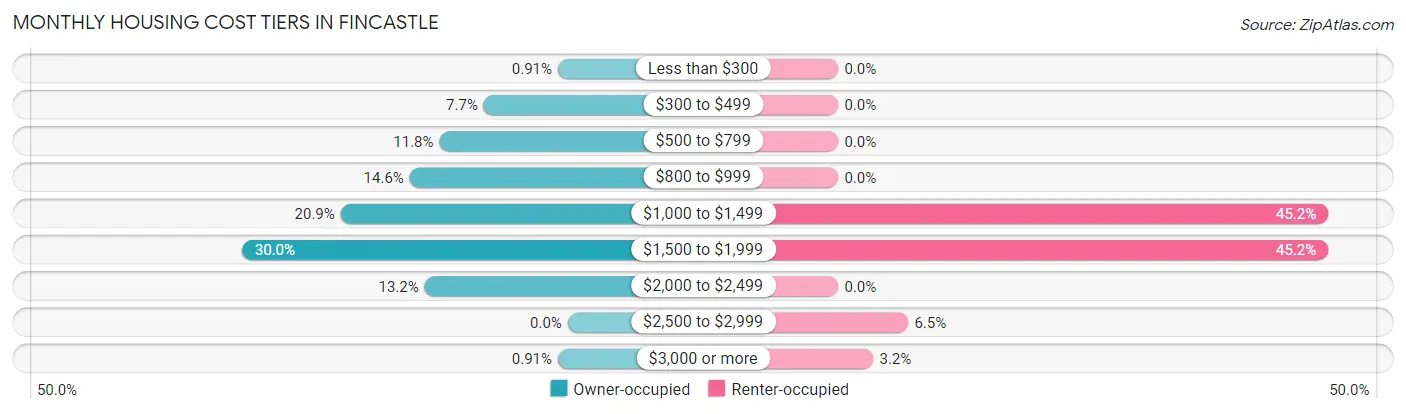
| Monthly Cost | Owner-occupied | Renter-occupied |
| Less than $300 | 2 (0.9%) | 0 (0.0%) |
| $300 to $499 | 17 (7.7%) | 0 (0.0%) |
| $500 to $799 | 26 (11.8%) | 0 (0.0%) |
| $800 to $999 | 32 (14.5%) | 0 (0.0%) |
| $1,000 to $1,499 | 46 (20.9%) | 14 (45.2%) |
| $1,500 to $1,999 | 66 (30.0%) | 14 (45.2%) |
| $2,000 to $2,499 | 29 (13.2%) | 0 (0.0%) |
| $2,500 to $2,999 | 0 (0.0%) | 2 (6.5%) |
| $3,000 or more | 2 (0.9%) | 1 (3.2%) |
| Total | 220 (100.0%) | 31 (100.0%) |
Physical Housing Characteristics in Fincastle
Housing Structures in Fincastle
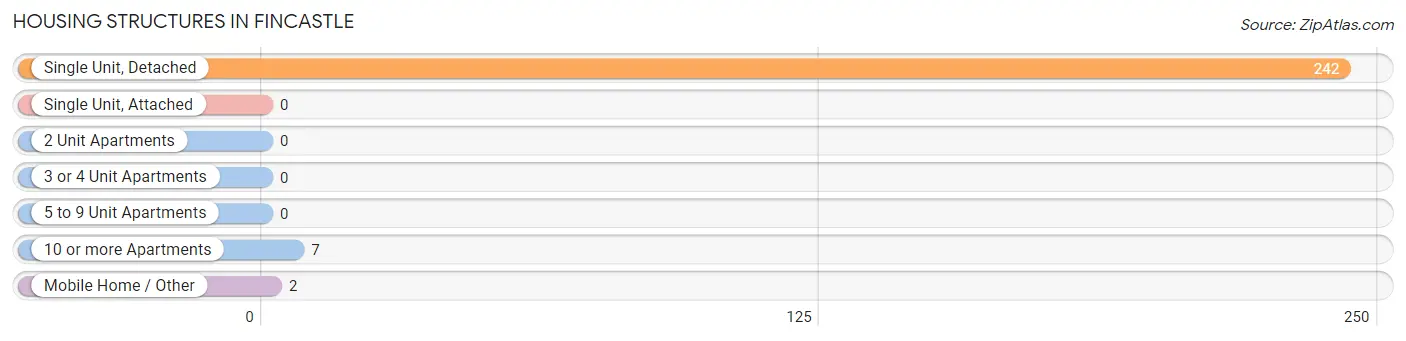
| Structure Type | # Housing Units | % Housing Units |
| Single Unit, Detached | 242 | 96.4% |
| Single Unit, Attached | 0 | 0.0% |
| 2 Unit Apartments | 0 | 0.0% |
| 3 or 4 Unit Apartments | 0 | 0.0% |
| 5 to 9 Unit Apartments | 0 | 0.0% |
| 10 or more Apartments | 7 | 2.8% |
| Mobile Home / Other | 2 | 0.8% |
| Total | 251 | 100.0% |
Housing Structures by Occupancy in Fincastle
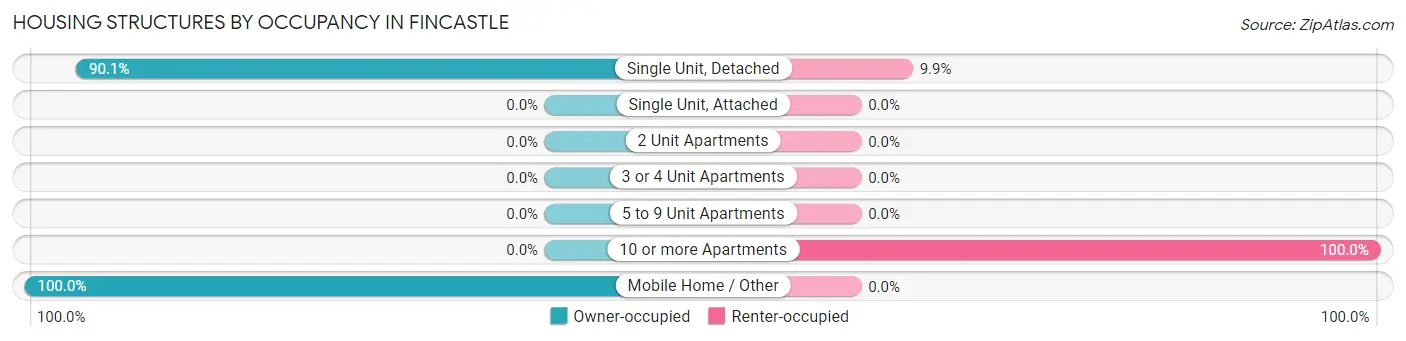
| Structure Type | Owner-occupied | Renter-occupied |
| Single Unit, Detached | 218 (90.1%) | 24 (9.9%) |
| Single Unit, Attached | 0 (0.0%) | 0 (0.0%) |
| 2 Unit Apartments | 0 (0.0%) | 0 (0.0%) |
| 3 or 4 Unit Apartments | 0 (0.0%) | 0 (0.0%) |
| 5 to 9 Unit Apartments | 0 (0.0%) | 0 (0.0%) |
| 10 or more Apartments | 0 (0.0%) | 7 (100.0%) |
| Mobile Home / Other | 2 (100.0%) | 0 (0.0%) |
| Total | 220 (87.6%) | 31 (12.3%) |
Housing Structures by Number of Rooms in Fincastle
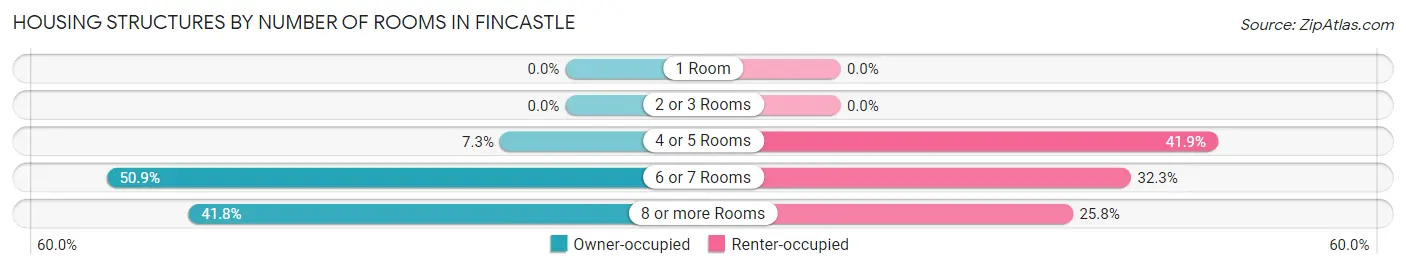
| Number of Rooms | Owner-occupied | Renter-occupied |
| 1 Room | 0 (0.0%) | 0 (0.0%) |
| 2 or 3 Rooms | 0 (0.0%) | 0 (0.0%) |
| 4 or 5 Rooms | 16 (7.3%) | 13 (41.9%) |
| 6 or 7 Rooms | 112 (50.9%) | 10 (32.3%) |
| 8 or more Rooms | 92 (41.8%) | 8 (25.8%) |
| Total | 220 (100.0%) | 31 (100.0%) |
Housing Structure by Heating Type in Fincastle
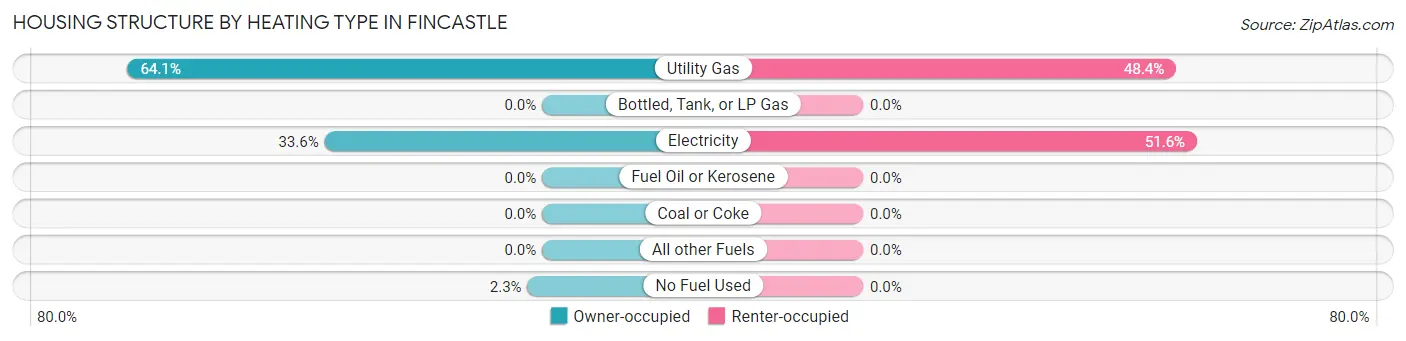
| Heating Type | Owner-occupied | Renter-occupied |
| Utility Gas | 141 (64.1%) | 15 (48.4%) |
| Bottled, Tank, or LP Gas | 0 (0.0%) | 0 (0.0%) |
| Electricity | 74 (33.6%) | 16 (51.6%) |
| Fuel Oil or Kerosene | 0 (0.0%) | 0 (0.0%) |
| Coal or Coke | 0 (0.0%) | 0 (0.0%) |
| All other Fuels | 0 (0.0%) | 0 (0.0%) |
| No Fuel Used | 5 (2.3%) | 0 (0.0%) |
| Total | 220 (100.0%) | 31 (100.0%) |
Household Vehicle Usage in Fincastle
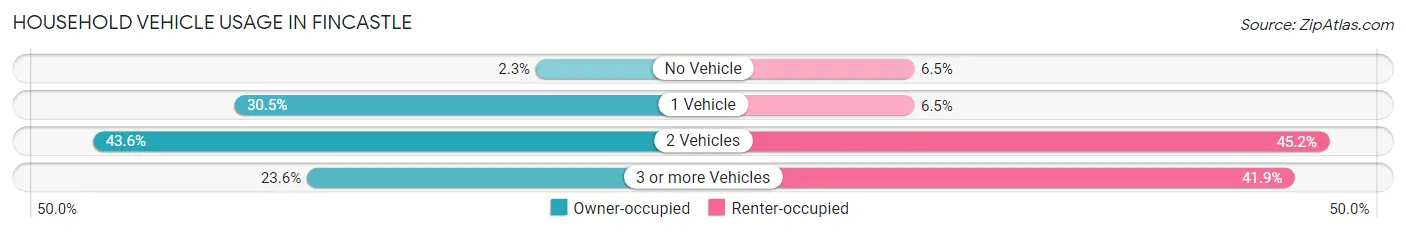
| Vehicles per Household | Owner-occupied | Renter-occupied |
| No Vehicle | 5 (2.3%) | 2 (6.5%) |
| 1 Vehicle | 67 (30.4%) | 2 (6.5%) |
| 2 Vehicles | 96 (43.6%) | 14 (45.2%) |
| 3 or more Vehicles | 52 (23.6%) | 13 (41.9%) |
| Total | 220 (100.0%) | 31 (100.0%) |
Real Estate & Mortgages in Fincastle
Real Estate and Mortgage Overview in Fincastle
| Characteristic | Without Mortgage | With Mortgage |
| Housing Units | 49 | 171 |
| Median Property Value | $198,600 | $238,000 |
| Median Household Income | $64,375 | $30 |
| Monthly Housing Costs | $579 | $2 |
| Real Estate Taxes | $1,932 | $2 |
Property Value by Mortgage Status in Fincastle
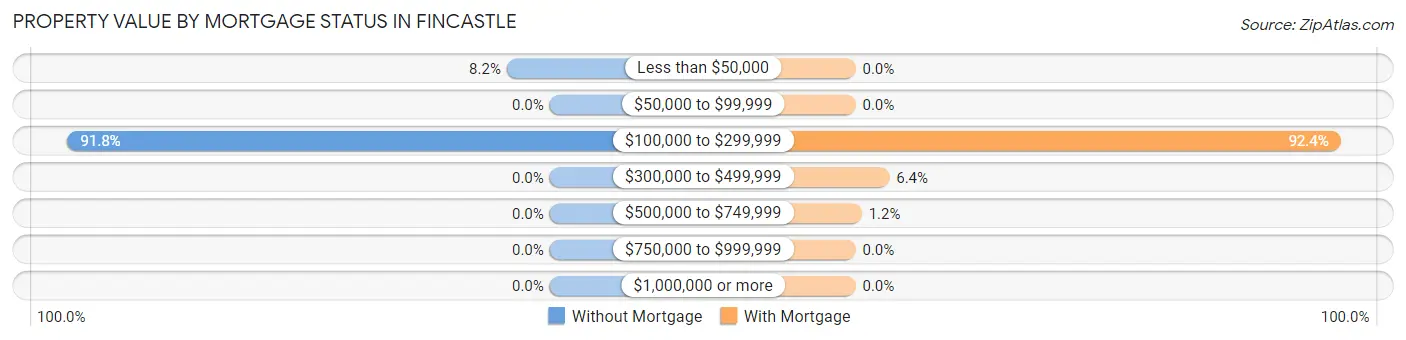
| Property Value | Without Mortgage | With Mortgage |
| Less than $50,000 | 4 (8.2%) | 0 (0.0%) |
| $50,000 to $99,999 | 0 (0.0%) | 0 (0.0%) |
| $100,000 to $299,999 | 45 (91.8%) | 158 (92.4%) |
| $300,000 to $499,999 | 0 (0.0%) | 11 (6.4%) |
| $500,000 to $749,999 | 0 (0.0%) | 2 (1.2%) |
| $750,000 to $999,999 | 0 (0.0%) | 0 (0.0%) |
| $1,000,000 or more | 0 (0.0%) | 0 (0.0%) |
| Total | 49 (100.0%) | 171 (100.0%) |
Household Income by Mortgage Status in Fincastle
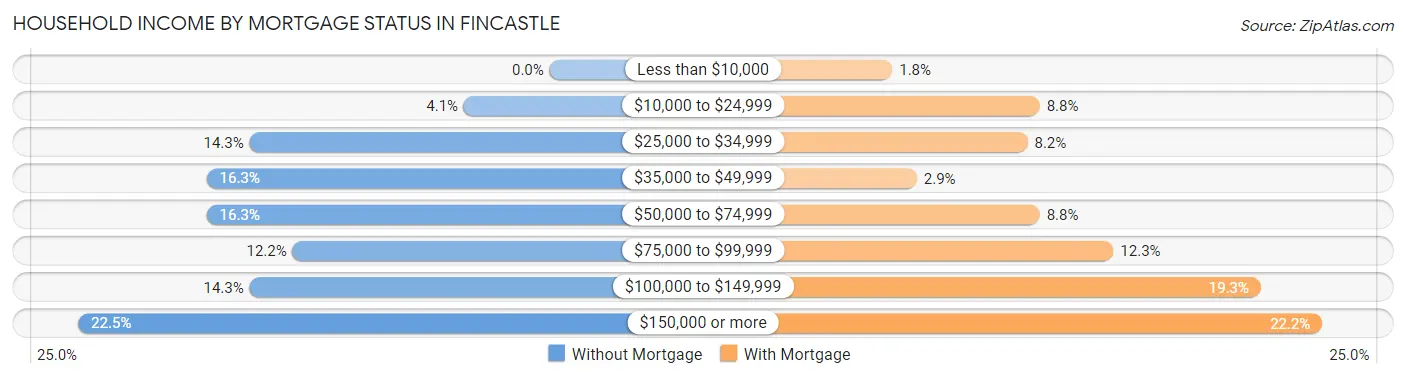
| Household Income | Without Mortgage | With Mortgage |
| Less than $10,000 | 0 (0.0%) | 3 (1.8%) |
| $10,000 to $24,999 | 2 (4.1%) | 15 (8.8%) |
| $25,000 to $34,999 | 7 (14.3%) | 14 (8.2%) |
| $35,000 to $49,999 | 8 (16.3%) | 5 (2.9%) |
| $50,000 to $74,999 | 8 (16.3%) | 15 (8.8%) |
| $75,000 to $99,999 | 6 (12.2%) | 21 (12.3%) |
| $100,000 to $149,999 | 7 (14.3%) | 33 (19.3%) |
| $150,000 or more | 11 (22.5%) | 38 (22.2%) |
| Total | 49 (100.0%) | 171 (100.0%) |
Property Value to Household Income Ratio in Fincastle
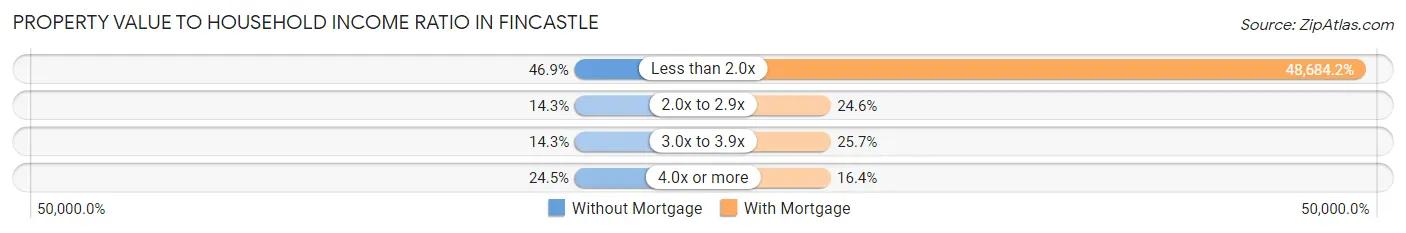
| Value-to-Income Ratio | Without Mortgage | With Mortgage |
| Less than 2.0x | 23 (46.9%) | 83,250 (48,684.2%) |
| 2.0x to 2.9x | 7 (14.3%) | 42 (24.6%) |
| 3.0x to 3.9x | 7 (14.3%) | 44 (25.7%) |
| 4.0x or more | 12 (24.5%) | 28 (16.4%) |
| Total | 49 (100.0%) | 171 (100.0%) |
Real Estate Taxes by Mortgage Status in Fincastle
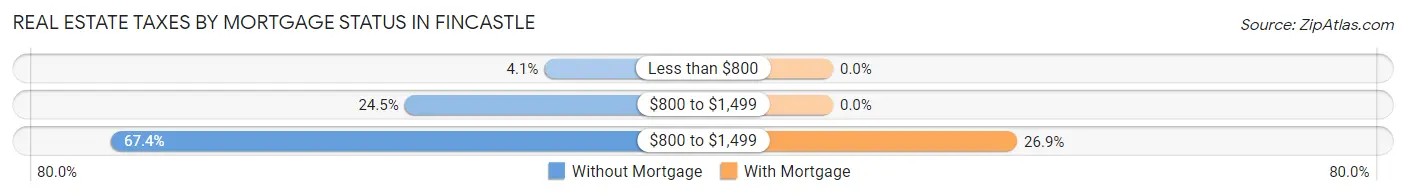
| Property Taxes | Without Mortgage | With Mortgage |
| Less than $800 | 2 (4.1%) | 0 (0.0%) |
| $800 to $1,499 | 12 (24.5%) | 0 (0.0%) |
| $800 to $1,499 | 33 (67.3%) | 46 (26.9%) |
| Total | 49 (100.0%) | 171 (100.0%) |
Health & Disability in Fincastle
Health Insurance Coverage by Age in Fincastle
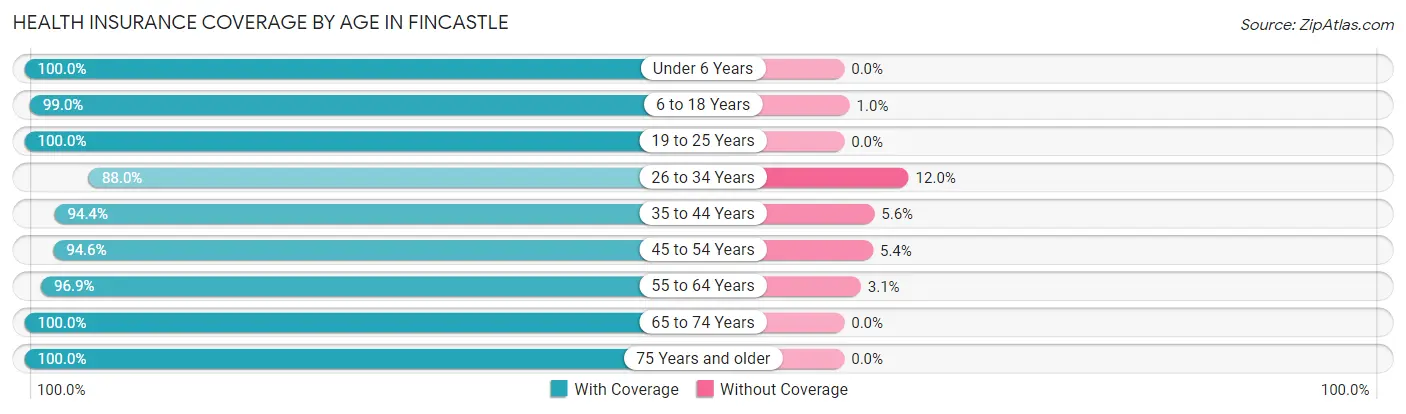
| Age Bracket | With Coverage | Without Coverage |
| Under 6 Years | 23 (100.0%) | 0 (0.0%) |
| 6 to 18 Years | 99 (99.0%) | 1 (1.0%) |
| 19 to 25 Years | 28 (100.0%) | 0 (0.0%) |
| 26 to 34 Years | 22 (88.0%) | 3 (12.0%) |
| 35 to 44 Years | 118 (94.4%) | 7 (5.6%) |
| 45 to 54 Years | 53 (94.6%) | 3 (5.4%) |
| 55 to 64 Years | 94 (96.9%) | 3 (3.1%) |
| 65 to 74 Years | 79 (100.0%) | 0 (0.0%) |
| 75 Years and older | 55 (100.0%) | 0 (0.0%) |
| Total | 571 (97.1%) | 17 (2.9%) |
Health Insurance Coverage by Citizenship Status in Fincastle
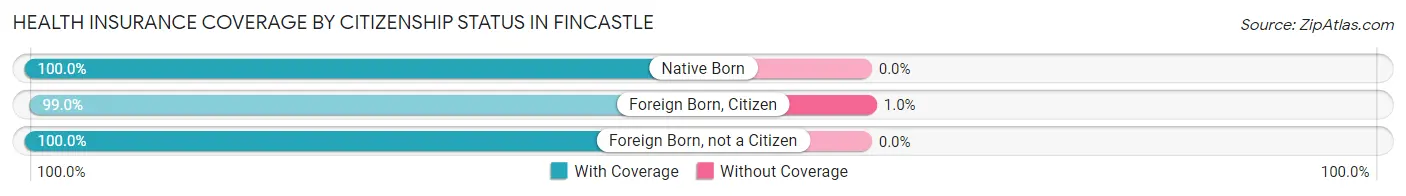
| Citizenship Status | With Coverage | Without Coverage |
| Native Born | 23 (100.0%) | 0 (0.0%) |
| Foreign Born, Citizen | 99 (99.0%) | 1 (1.0%) |
| Foreign Born, not a Citizen | 28 (100.0%) | 0 (0.0%) |
Health Insurance Coverage by Household Income in Fincastle
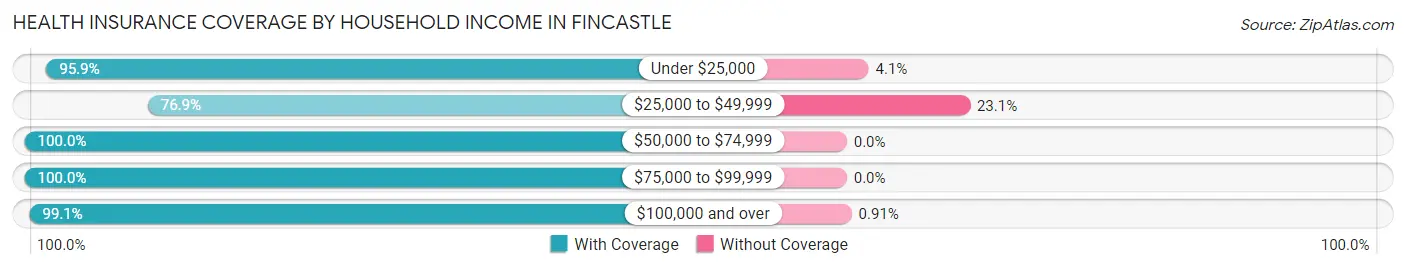
| Household Income | With Coverage | Without Coverage |
| Under $25,000 | 47 (95.9%) | 2 (4.1%) |
| $25,000 to $49,999 | 40 (76.9%) | 12 (23.1%) |
| $50,000 to $74,999 | 60 (100.0%) | 0 (0.0%) |
| $75,000 to $99,999 | 96 (100.0%) | 0 (0.0%) |
| $100,000 and over | 328 (99.1%) | 3 (0.9%) |
Public vs Private Health Insurance Coverage by Age in Fincastle
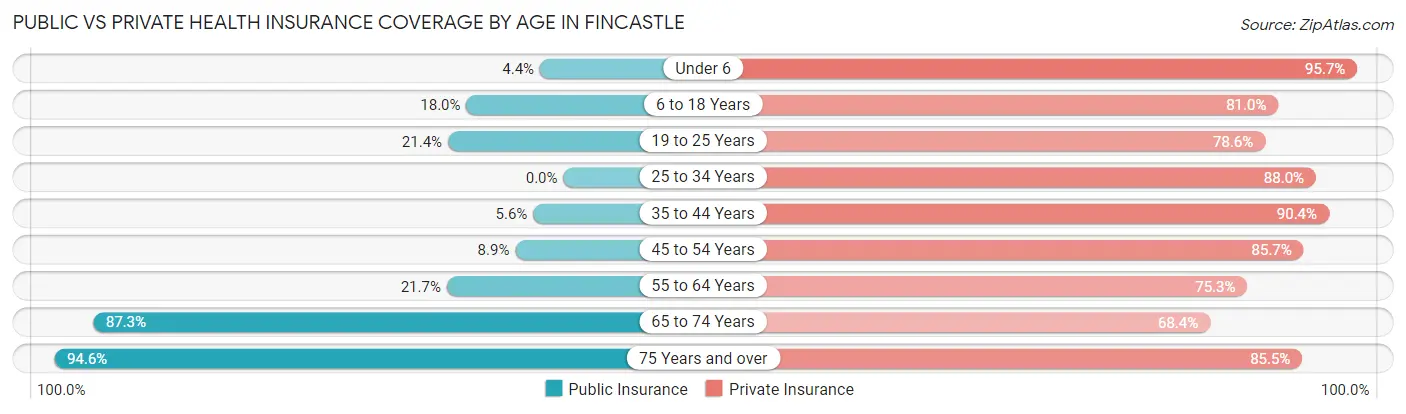
| Age Bracket | Public Insurance | Private Insurance |
| Under 6 | 1 (4.3%) | 22 (95.7%) |
| 6 to 18 Years | 18 (18.0%) | 81 (81.0%) |
| 19 to 25 Years | 6 (21.4%) | 22 (78.6%) |
| 25 to 34 Years | 0 (0.0%) | 22 (88.0%) |
| 35 to 44 Years | 7 (5.6%) | 113 (90.4%) |
| 45 to 54 Years | 5 (8.9%) | 48 (85.7%) |
| 55 to 64 Years | 21 (21.6%) | 73 (75.3%) |
| 65 to 74 Years | 69 (87.3%) | 54 (68.3%) |
| 75 Years and over | 52 (94.6%) | 47 (85.5%) |
| Total | 179 (30.4%) | 482 (82.0%) |
Disability Status by Sex by Age in Fincastle
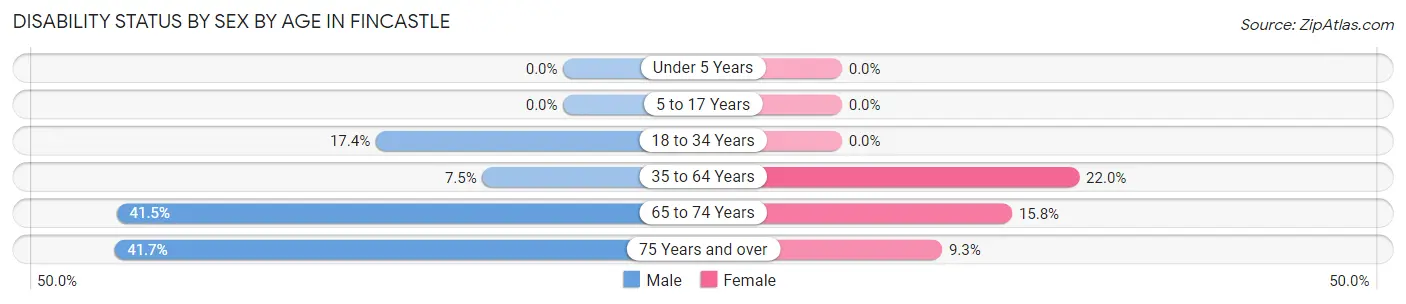
| Age Bracket | Male | Female |
| Under 5 Years | 0 (0.0%) | 0 (0.0%) |
| 5 to 17 Years | 0 (0.0%) | 0 (0.0%) |
| 18 to 34 Years | 4 (17.4%) | 0 (0.0%) |
| 35 to 64 Years | 12 (7.5%) | 26 (22.0%) |
| 65 to 74 Years | 17 (41.5%) | 6 (15.8%) |
| 75 Years and over | 5 (41.7%) | 4 (9.3%) |
Disability Class by Sex by Age in Fincastle
Disability Class: Hearing Difficulty
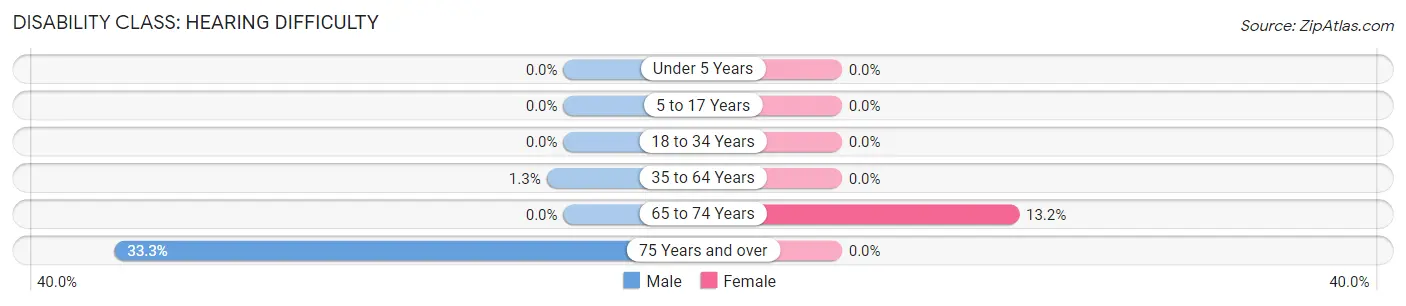
| Age Bracket | Male | Female |
| Under 5 Years | 0 (0.0%) | 0 (0.0%) |
| 5 to 17 Years | 0 (0.0%) | 0 (0.0%) |
| 18 to 34 Years | 0 (0.0%) | 0 (0.0%) |
| 35 to 64 Years | 2 (1.3%) | 0 (0.0%) |
| 65 to 74 Years | 0 (0.0%) | 5 (13.2%) |
| 75 Years and over | 4 (33.3%) | 0 (0.0%) |
Disability Class: Vision Difficulty
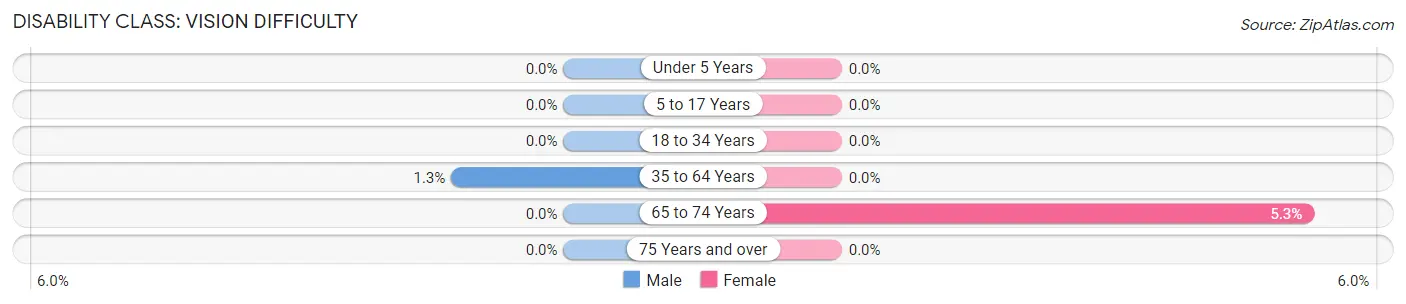
| Age Bracket | Male | Female |
| Under 5 Years | 0 (0.0%) | 0 (0.0%) |
| 5 to 17 Years | 0 (0.0%) | 0 (0.0%) |
| 18 to 34 Years | 0 (0.0%) | 0 (0.0%) |
| 35 to 64 Years | 2 (1.3%) | 0 (0.0%) |
| 65 to 74 Years | 0 (0.0%) | 2 (5.3%) |
| 75 Years and over | 0 (0.0%) | 0 (0.0%) |
Disability Class: Cognitive Difficulty
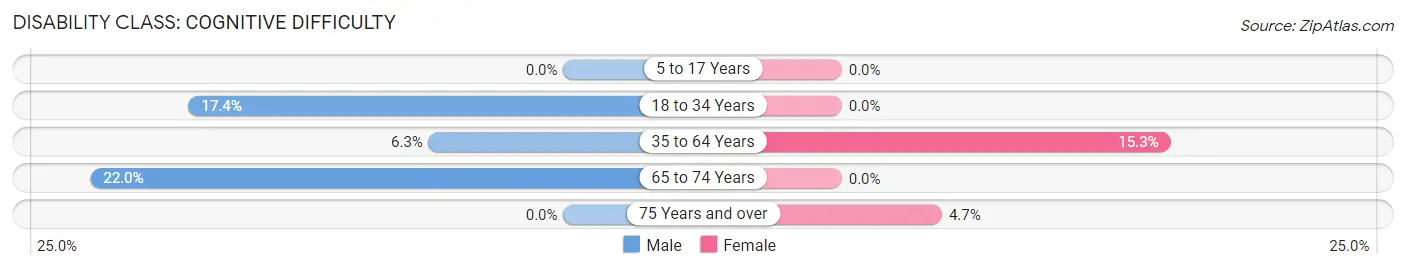
| Age Bracket | Male | Female |
| 5 to 17 Years | 0 (0.0%) | 0 (0.0%) |
| 18 to 34 Years | 4 (17.4%) | 0 (0.0%) |
| 35 to 64 Years | 10 (6.2%) | 18 (15.2%) |
| 65 to 74 Years | 9 (22.0%) | 0 (0.0%) |
| 75 Years and over | 0 (0.0%) | 2 (4.6%) |
Disability Class: Ambulatory Difficulty
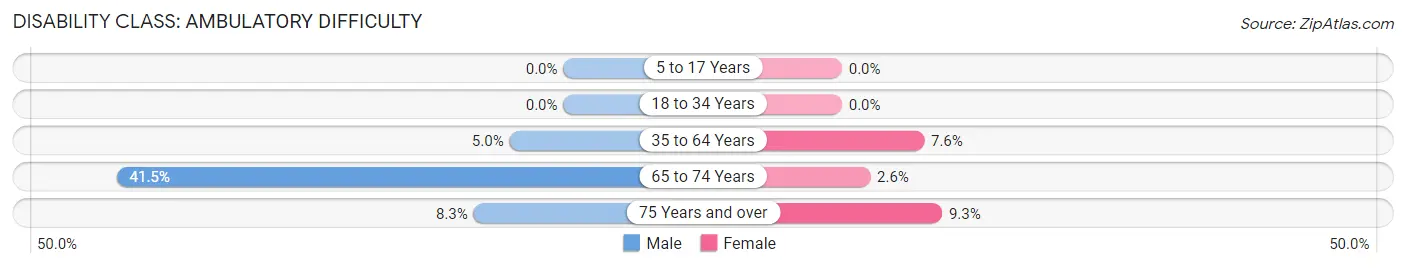
| Age Bracket | Male | Female |
| 5 to 17 Years | 0 (0.0%) | 0 (0.0%) |
| 18 to 34 Years | 0 (0.0%) | 0 (0.0%) |
| 35 to 64 Years | 8 (5.0%) | 9 (7.6%) |
| 65 to 74 Years | 17 (41.5%) | 1 (2.6%) |
| 75 Years and over | 1 (8.3%) | 4 (9.3%) |
Disability Class: Self-Care Difficulty
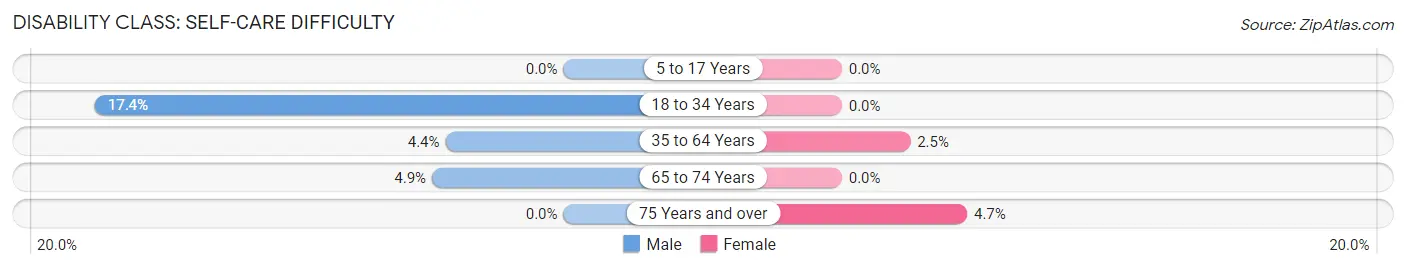
| Age Bracket | Male | Female |
| 5 to 17 Years | 0 (0.0%) | 0 (0.0%) |
| 18 to 34 Years | 4 (17.4%) | 0 (0.0%) |
| 35 to 64 Years | 7 (4.4%) | 3 (2.5%) |
| 65 to 74 Years | 2 (4.9%) | 0 (0.0%) |
| 75 Years and over | 0 (0.0%) | 2 (4.6%) |
Technology Access in Fincastle
Computing Device Access in Fincastle
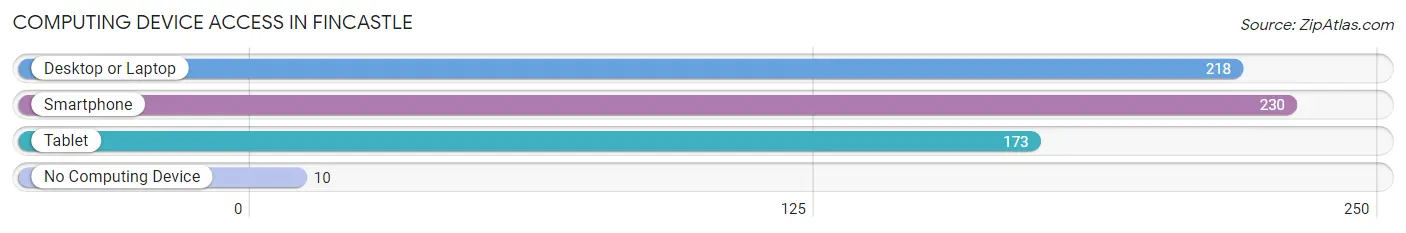
| Device Type | # Households | % Households |
| Desktop or Laptop | 218 | 86.9% |
| Smartphone | 230 | 91.6% |
| Tablet | 173 | 68.9% |
| No Computing Device | 10 | 4.0% |
| Total | 251 | 100.0% |
Internet Access in Fincastle
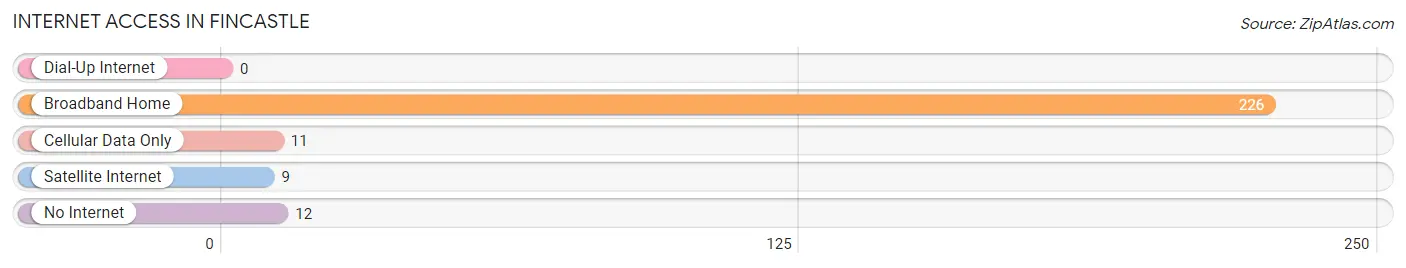
| Internet Type | # Households | % Households |
| Dial-Up Internet | 0 | 0.0% |
| Broadband Home | 226 | 90.0% |
| Cellular Data Only | 11 | 4.4% |
| Satellite Internet | 9 | 3.6% |
| No Internet | 12 | 4.8% |
| Total | 251 | 100.0% |
Fincastle Summary
Fincastle is a small town located in the state of Kentucky, in the United States. It is situated in the northern part of the state, in the foothills of the Appalachian Mountains. The town is located in the county of Botetourt, and is part of the Roanoke Metropolitan Statistical Area. The population of Fincastle was estimated to be 1,845 in the year 2020.
Geography
Fincastle is located in the northern part of the state of Kentucky, in the foothills of the Appalachian Mountains. The town is situated in the county of Botetourt, and is part of the Roanoke Metropolitan Statistical Area. The town is located at an elevation of 1,845 feet above sea level. The town is surrounded by the Blue Ridge Mountains to the east, the Allegheny Mountains to the west, and the Cumberland Plateau to the south. The town is located near the intersection of Interstate 81 and US Route 11.
Climate
Fincastle has a humid subtropical climate, with hot and humid summers and cold winters. The average annual temperature is around 57°F, with an average high of around 79°F in the summer and an average low of around 35°F in the winter. The average annual precipitation is around 43 inches, with the majority of the precipitation occurring in the spring and summer months.
Demographics
As of the 2020 census, the population of Fincastle was estimated to be 1,845. The racial makeup of the town was 94.2% White, 2.2% African American, 0.3% Native American, 0.7% Asian, 0.1% Pacific Islander, 0.7% from other races, and 1.9% from two or more races. Hispanic or Latino of any race were 2.2% of the population.
Economy
Fincastle’s economy is largely based on agriculture and tourism. The town is home to several farms, which produce a variety of crops, including corn, soybeans, wheat, and hay. The town is also home to several wineries, which produce a variety of wines. Tourism is also an important part of the local economy, with visitors coming to the area to enjoy the scenic views of the Appalachian Mountains and the nearby Blue Ridge Parkway.
History
Fincastle was founded in 1772 by a group of settlers from Virginia. The town was named after Lord Fincastle, a British nobleman. The town was originally a trading post, and was an important stop on the Great Wagon Road, which connected the eastern and western parts of the United States. The town was also an important stop on the Underground Railroad, which was used by slaves escaping to freedom.
In the late 19th century, the town began to grow and develop, with the construction of a railroad line and the establishment of several businesses. The town was also home to several schools, churches, and other institutions. In the early 20th century, the town experienced a period of decline, as the railroad line was abandoned and the local economy suffered. However, in recent years, the town has seen a resurgence, with the establishment of several new businesses and the development of tourism in the area.
Common Questions
What is Per Capita Income in Fincastle?
Per Capita income in Fincastle is $39,959.
What is the Median Family Income in Fincastle?
Median Family Income in Fincastle is $104,583.
What is the Median Household income in Fincastle?
Median Household Income in Fincastle is $84,750.
What is Income or Wage Gap in Fincastle?
Income or Wage Gap in Fincastle is 5.0%.
Women in Fincastle earn 95.0 cents for every dollar earned by a man.
What is Inequality or Gini Index in Fincastle?
Inequality or Gini Index in Fincastle is 0.37.
What is the Total Population of Fincastle?
Total Population of Fincastle is 588.
What is the Total Male Population of Fincastle?
Total Male Population of Fincastle is 317.
What is the Total Female Population of Fincastle?
Total Female Population of Fincastle is 271.
What is the Ratio of Males per 100 Females in Fincastle?
There are 116.97 Males per 100 Females in Fincastle.
What is the Ratio of Females per 100 Males in Fincastle?
There are 85.49 Females per 100 Males in Fincastle.
What is the Median Population Age in Fincastle?
Median Population Age in Fincastle is 43.6 Years.
What is the Average Family Size in Fincastle
Average Family Size in Fincastle is 2.9 People.
What is the Average Household Size in Fincastle
Average Household Size in Fincastle is 2.3 People.
How Large is the Labor Force in Fincastle?
There are 327 People in the Labor Forcein in Fincastle.
What is the Percentage of People in the Labor Force in Fincastle?
65.4% of People are in the Labor Force in Fincastle.
What is the Unemployment Rate in Fincastle?
Unemployment Rate in Fincastle is 3.1%.