Livonia, IN Map & Demographics
Livonia Map
Livonia Overview
$30,501
PER CAPITA INCOME
$50,833
AVG FAMILY INCOME
$61,250
AVG HOUSEHOLD INCOME
60.0%
WAGE / INCOME GAP [ % ]
40.0¢/ $1
WAGE / INCOME GAP [ $ ]
0.44
INEQUALITY / GINI INDEX
83
TOTAL POPULATION
35
MALE POPULATION
48
FEMALE POPULATION
72.92
MALES / 100 FEMALES
137.14
FEMALES / 100 MALES
43.1
MEDIAN AGE
3.0
AVG FAMILY SIZE
3.0
AVG HOUSEHOLD SIZE
45
LABOR FORCE [ PEOPLE ]
64.3%
PERCENT IN LABOR FORCE
Livonia Area Codes
Income in Livonia
Income Overview in Livonia
Per Capita Income in Livonia is $30,501, while median incomes of families and households are $50,833 and $61,250 respectively.
| Characteristic | Number | Measure |
| Per Capita Income | 83 | $30,501 |
| Median Family Income | 26 | $50,833 |
| Mean Family Income | 26 | $73,019 |
| Median Household Income | 28 | $61,250 |
| Mean Household Income | 28 | $73,293 |
| Income Deficit | 26 | $0 |
| Wage / Income Gap (%) | 83 | 60.00% |
| Wage / Income Gap ($) | 83 | 40.00¢ per $1 |
| Gini / Inequality Index | 83 | 0.44 |
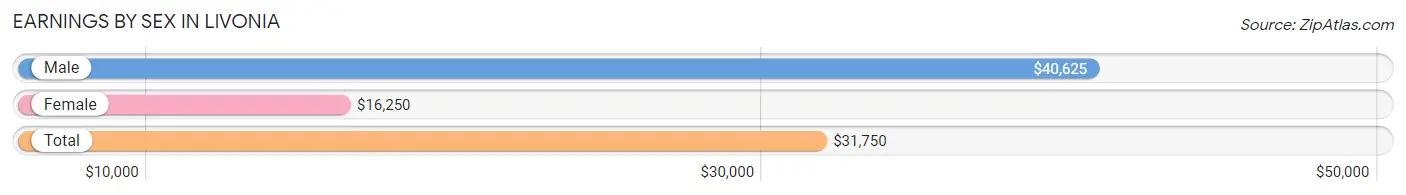
Earnings by Sex in Livonia
Average Earnings in Livonia are $31,750, $40,625 for men and $16,250 for women, a difference of 60.0%.
| Sex | Number | Average Earnings |
| Male | 21 (44.7%) | $40,625 |
| Female | 26 (55.3%) | $16,250 |
| Total | 47 (100.0%) | $31,750 |
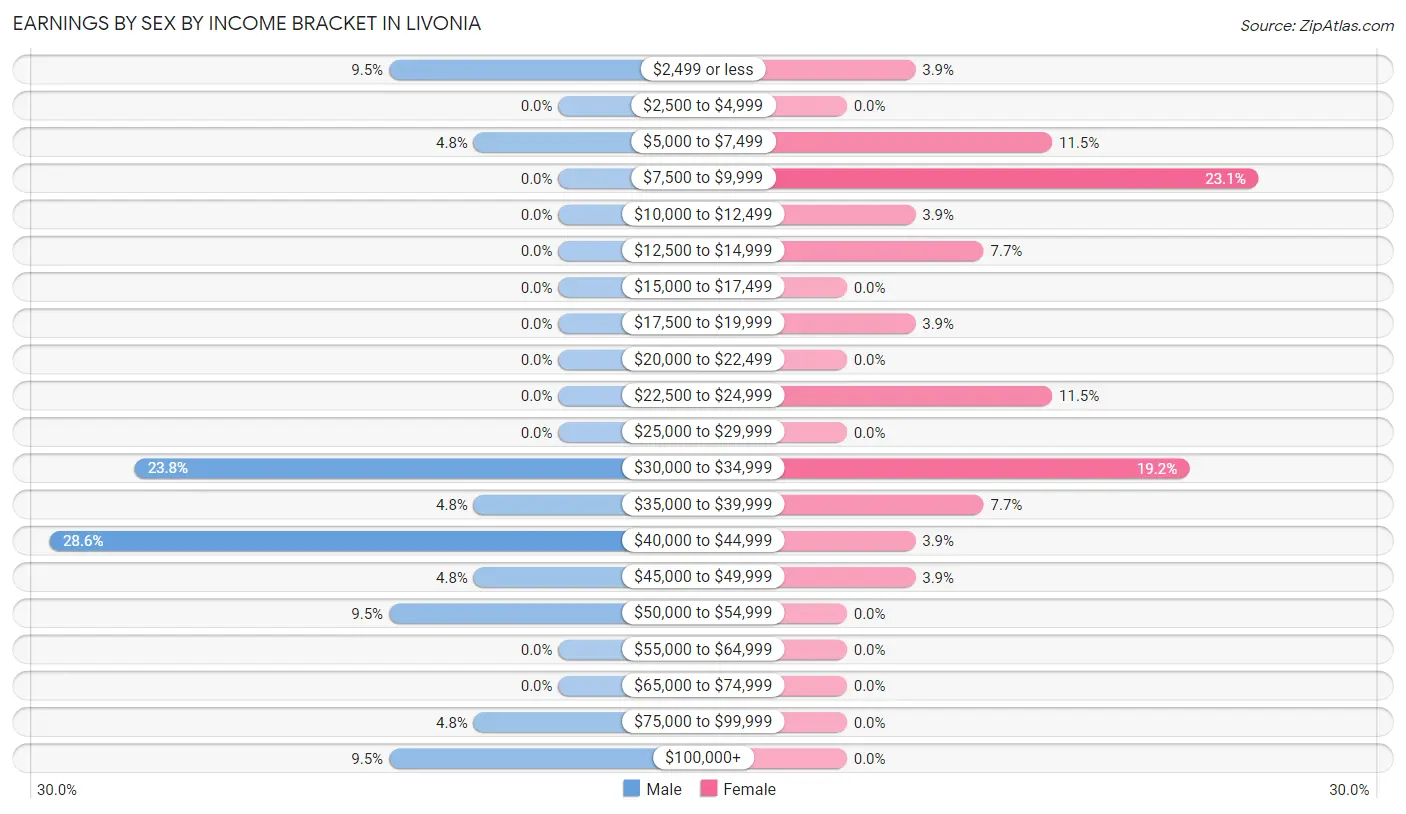
Earnings by Sex by Income Bracket in Livonia
The most common earnings brackets in Livonia are $40,000 to $44,999 for men (6 | 28.6%) and $7,500 to $9,999 for women (6 | 23.1%).
| Income | Male | Female |
| $2,499 or less | 2 (9.5%) | 1 (3.8%) |
| $2,500 to $4,999 | 0 (0.0%) | 0 (0.0%) |
| $5,000 to $7,499 | 1 (4.8%) | 3 (11.5%) |
| $7,500 to $9,999 | 0 (0.0%) | 6 (23.1%) |
| $10,000 to $12,499 | 0 (0.0%) | 1 (3.8%) |
| $12,500 to $14,999 | 0 (0.0%) | 2 (7.7%) |
| $15,000 to $17,499 | 0 (0.0%) | 0 (0.0%) |
| $17,500 to $19,999 | 0 (0.0%) | 1 (3.8%) |
| $20,000 to $22,499 | 0 (0.0%) | 0 (0.0%) |
| $22,500 to $24,999 | 0 (0.0%) | 3 (11.5%) |
| $25,000 to $29,999 | 0 (0.0%) | 0 (0.0%) |
| $30,000 to $34,999 | 5 (23.8%) | 5 (19.2%) |
| $35,000 to $39,999 | 1 (4.8%) | 2 (7.7%) |
| $40,000 to $44,999 | 6 (28.6%) | 1 (3.8%) |
| $45,000 to $49,999 | 1 (4.8%) | 1 (3.8%) |
| $50,000 to $54,999 | 2 (9.5%) | 0 (0.0%) |
| $55,000 to $64,999 | 0 (0.0%) | 0 (0.0%) |
| $65,000 to $74,999 | 0 (0.0%) | 0 (0.0%) |
| $75,000 to $99,999 | 1 (4.8%) | 0 (0.0%) |
| $100,000+ | 2 (9.5%) | 0 (0.0%) |
| Total | 21 (100.0%) | 26 (100.0%) |
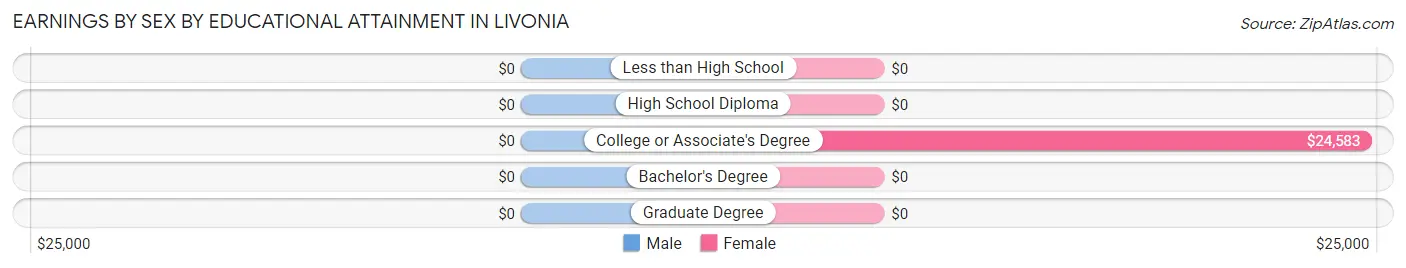
Earnings by Sex by Educational Attainment in Livonia
| Educational Attainment | Male Income | Female Income |
| Less than High School | - | - |
| High School Diploma | - | - |
| College or Associate's Degree | - | - |
| Bachelor's Degree | - | - |
| Graduate Degree | - | - |
| Total | $40,625 | $30,833 |
Family Income in Livonia
Family Income Brackets in Livonia
According to the Livonia family income data, there are 8 families falling into the $50,000 to $74,999 income range, which is the most common income bracket and makes up 30.8% of all families.
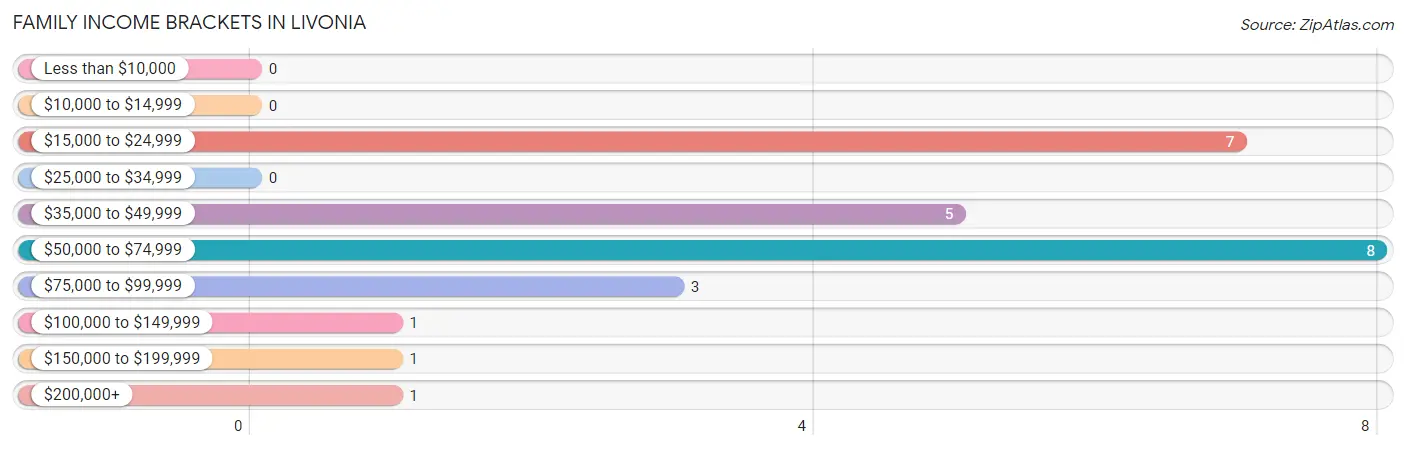
| Income Bracket | # Families | % Families |
| Less than $10,000 | 0 | 0.0% |
| $10,000 to $14,999 | 0 | 0.0% |
| $15,000 to $24,999 | 7 | 26.9% |
| $25,000 to $34,999 | 0 | 0.0% |
| $35,000 to $49,999 | 5 | 19.2% |
| $50,000 to $74,999 | 8 | 30.8% |
| $75,000 to $99,999 | 3 | 11.5% |
| $100,000 to $149,999 | 1 | 3.8% |
| $150,000 to $199,999 | 1 | 3.8% |
| $200,000+ | 1 | 3.8% |
Family Income by Famaliy Size in Livonia
3-person families (9 | 34.6%) account for the highest median family income in Livonia with $49,375 per family, while 2-person families (11 | 42.3%) have the highest median income of $24,062 per family member.
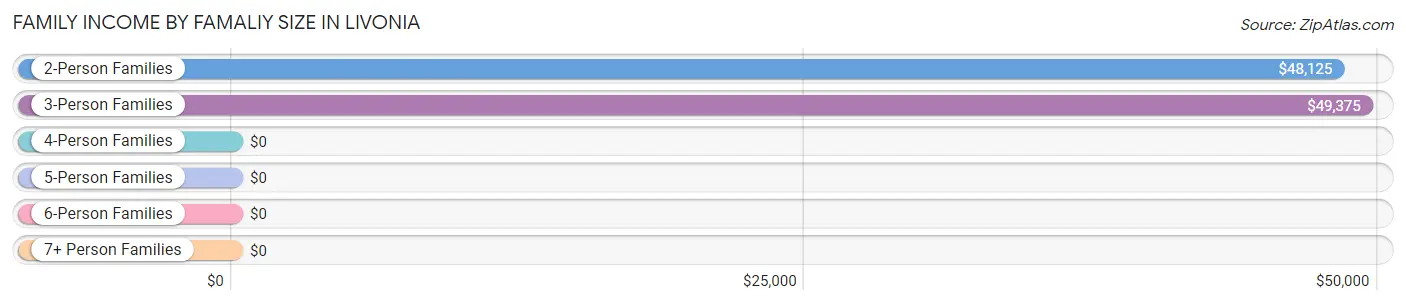
| Income Bracket | # Families | Median Income |
| 2-Person Families | 11 (42.3%) | $48,125 |
| 3-Person Families | 9 (34.6%) | $49,375 |
| 4-Person Families | 3 (11.5%) | $0 |
| 5-Person Families | 0 (0.0%) | $0 |
| 6-Person Families | 3 (11.5%) | $0 |
| 7+ Person Families | 0 (0.0%) | $0 |
| Total | 26 (100.0%) | $50,833 |
Family Income by Number of Earners in Livonia
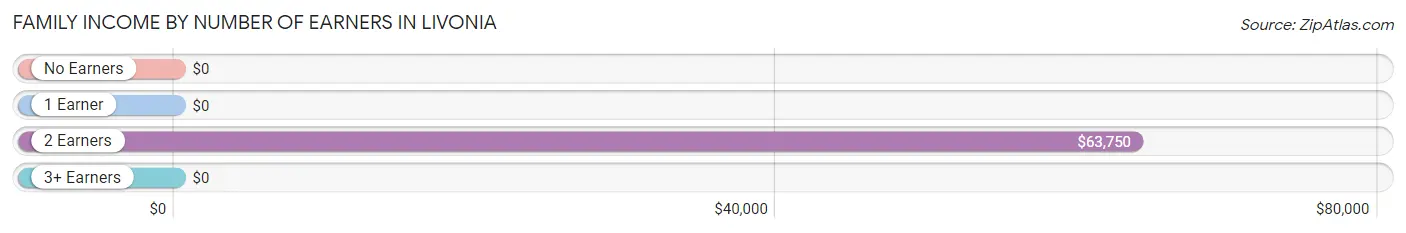
| Number of Earners | # Families | Median Income |
| No Earners | 7 (26.9%) | $0 |
| 1 Earner | 5 (19.2%) | $0 |
| 2 Earners | 11 (42.3%) | $63,750 |
| 3+ Earners | 3 (11.5%) | $0 |
| Total | 26 (100.0%) | $50,833 |
Household Income in Livonia
Household Income Brackets in Livonia
With 8 households falling in the category, the $15,000 to $24,999 income range is the most frequent in Livonia, accounting for 28.6% of all households.
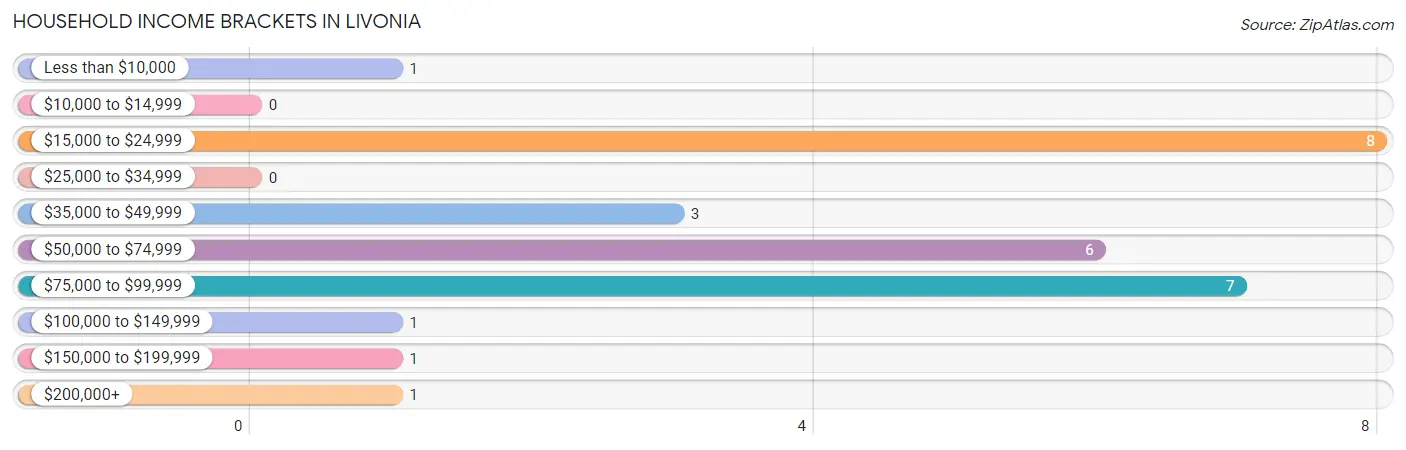
| Income Bracket | # Households | % Households |
| Less than $10,000 | 1 | 3.6% |
| $10,000 to $14,999 | 0 | 0.0% |
| $15,000 to $24,999 | 8 | 28.6% |
| $25,000 to $34,999 | 0 | 0.0% |
| $35,000 to $49,999 | 3 | 10.7% |
| $50,000 to $74,999 | 6 | 21.4% |
| $75,000 to $99,999 | 7 | 25.0% |
| $100,000 to $149,999 | 1 | 3.6% |
| $150,000 to $199,999 | 1 | 3.6% |
| $200,000+ | 1 | 3.6% |
Household Income by Householder Age in Livonia
The median household income in Livonia is $61,250, with the highest median household income of $81,250 found in the 45 to 64 years age bracket for the primary householder. A total of 8 households (28.6%) fall into this category.
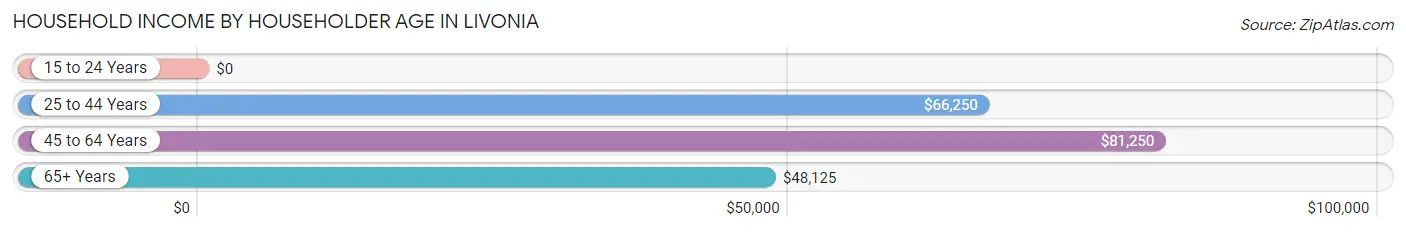
| Income Bracket | # Households | Median Income |
| 15 to 24 Years | 0 (0.0%) | $0 |
| 25 to 44 Years | 9 (32.1%) | $66,250 |
| 45 to 64 Years | 8 (28.6%) | $81,250 |
| 65+ Years | 11 (39.3%) | $48,125 |
| Total | 28 (100.0%) | $61,250 |
Poverty in Livonia
Income Below Poverty by Sex and Age in Livonia
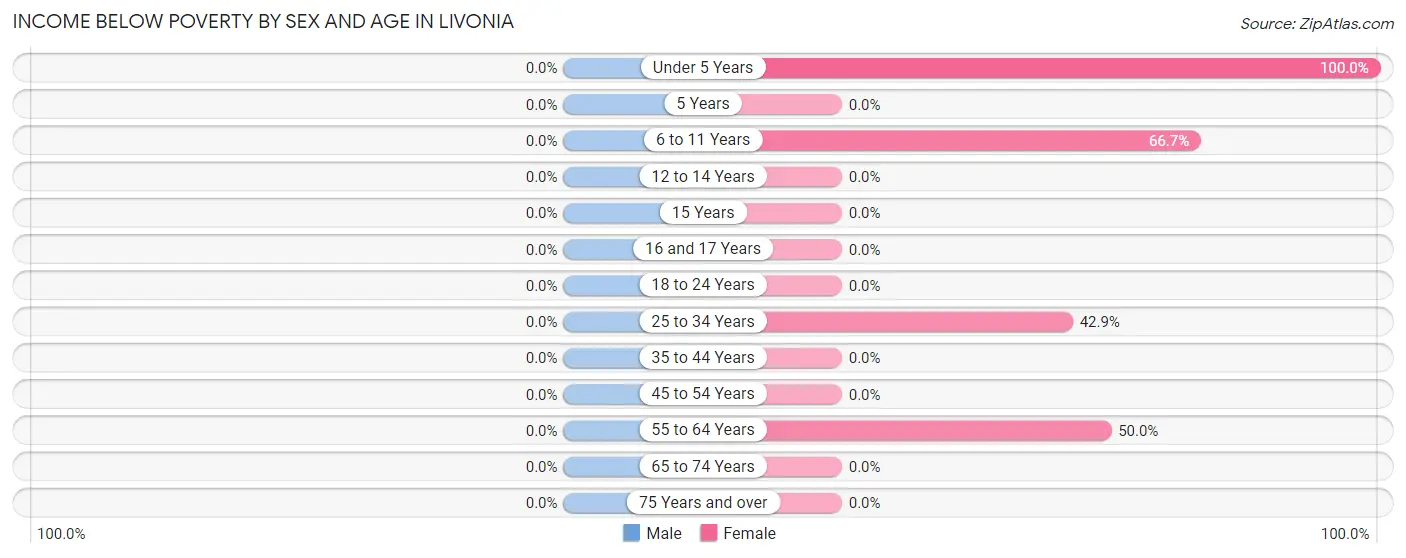
| Age Bracket | Male | Female |
| Under 5 Years | 0 (0.0%) | 1 (100.0%) |
| 5 Years | 0 (0.0%) | 0 (0.0%) |
| 6 to 11 Years | 0 (0.0%) | 2 (66.7%) |
| 12 to 14 Years | 0 (0.0%) | 0 (0.0%) |
| 15 Years | 0 (0.0%) | 0 (0.0%) |
| 16 and 17 Years | 0 (0.0%) | 0 (0.0%) |
| 18 to 24 Years | 0 (0.0%) | 0 (0.0%) |
| 25 to 34 Years | 0 (0.0%) | 3 (42.9%) |
| 35 to 44 Years | 0 (0.0%) | 0 (0.0%) |
| 45 to 54 Years | 0 (0.0%) | 0 (0.0%) |
| 55 to 64 Years | 0 (0.0%) | 1 (50.0%) |
| 65 to 74 Years | 0 (0.0%) | 0 (0.0%) |
| 75 Years and over | 0 (0.0%) | 0 (0.0%) |
| Total | 0 (0.0%) | 7 (14.6%) |
Income Above Poverty by Sex and Age in Livonia
According to the poverty statistics in Livonia, males aged under 5 years and females aged 5 years are the age groups that are most secure financially, with 100.0% of males and 100.0% of females in these age groups living above the poverty line.
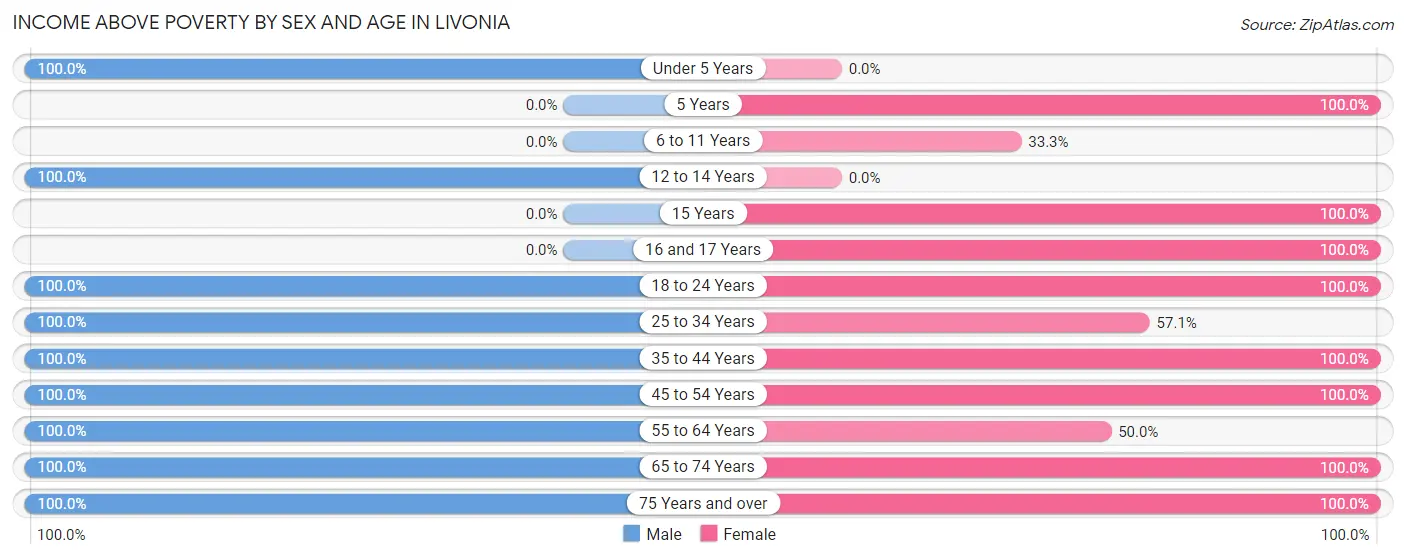
| Age Bracket | Male | Female |
| Under 5 Years | 4 (100.0%) | 0 (0.0%) |
| 5 Years | 0 (0.0%) | 1 (100.0%) |
| 6 to 11 Years | 0 (0.0%) | 1 (33.3%) |
| 12 to 14 Years | 3 (100.0%) | 0 (0.0%) |
| 15 Years | 0 (0.0%) | 1 (100.0%) |
| 16 and 17 Years | 0 (0.0%) | 2 (100.0%) |
| 18 to 24 Years | 6 (100.0%) | 8 (100.0%) |
| 25 to 34 Years | 3 (100.0%) | 4 (57.1%) |
| 35 to 44 Years | 6 (100.0%) | 2 (100.0%) |
| 45 to 54 Years | 3 (100.0%) | 5 (100.0%) |
| 55 to 64 Years | 2 (100.0%) | 1 (50.0%) |
| 65 to 74 Years | 4 (100.0%) | 15 (100.0%) |
| 75 Years and over | 4 (100.0%) | 1 (100.0%) |
| Total | 35 (100.0%) | 41 (85.4%) |
Income Below Poverty Among Married-Couple Families in Livonia
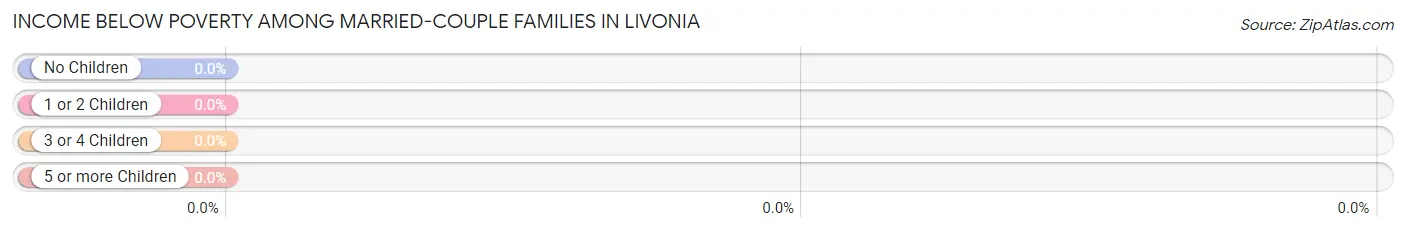
| Children | Above Poverty | Below Poverty |
| No Children | 11 (100.0%) | 0 (0.0%) |
| 1 or 2 Children | 7 (100.0%) | 0 (0.0%) |
| 3 or 4 Children | 0 (0.0%) | 0 (0.0%) |
| 5 or more Children | 0 (0.0%) | 0 (0.0%) |
| Total | 18 (100.0%) | 0 (0.0%) |
Income Below Poverty Among Single-Parent Households in Livonia
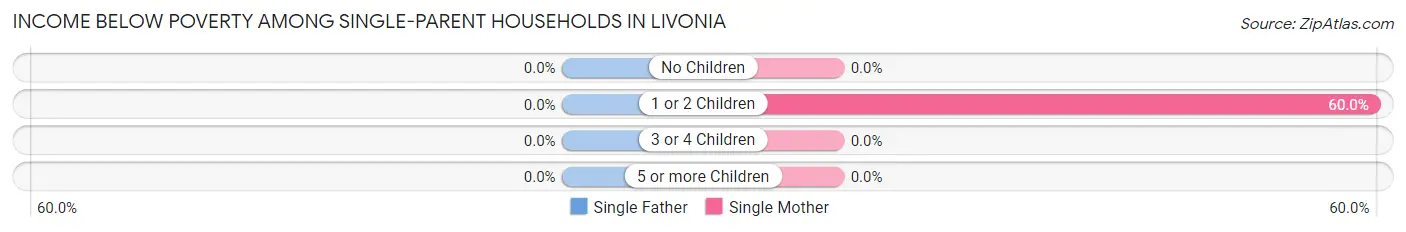
| Children | Single Father | Single Mother |
| No Children | 0 (0.0%) | 0 (0.0%) |
| 1 or 2 Children | 0 (0.0%) | 3 (60.0%) |
| 3 or 4 Children | 0 (0.0%) | 0 (0.0%) |
| 5 or more Children | 0 (0.0%) | 0 (0.0%) |
| Total | 0 (0.0%) | 3 (50.0%) |
Income Below Poverty Among Married-Couple vs Single-Parent Households in Livonia
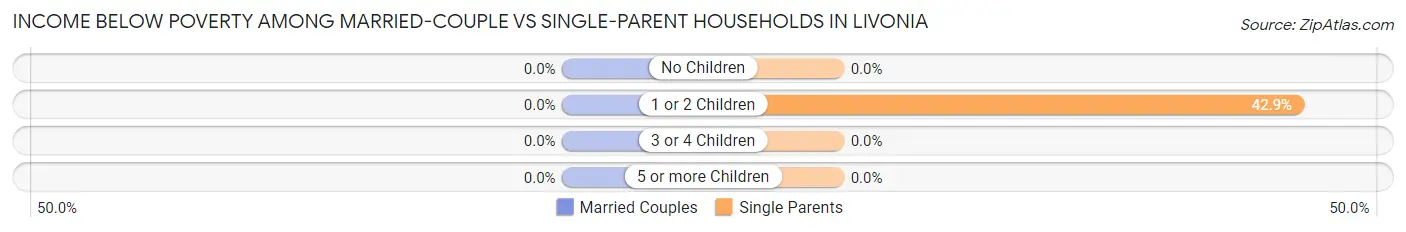
| Children | Married-Couple Families | Single-Parent Households |
| No Children | 0 (0.0%) | 0 (0.0%) |
| 1 or 2 Children | 0 (0.0%) | 3 (42.9%) |
| 3 or 4 Children | 0 (0.0%) | 0 (0.0%) |
| 5 or more Children | 0 (0.0%) | 0 (0.0%) |
| Total | 0 (0.0%) | 3 (37.5%) |
Race in Livonia
The most populous races in Livonia are White / Caucasian (82 | 98.8%), Hispanic or Latino (1 | 1.2%), and Two or more Races (1 | 1.2%).
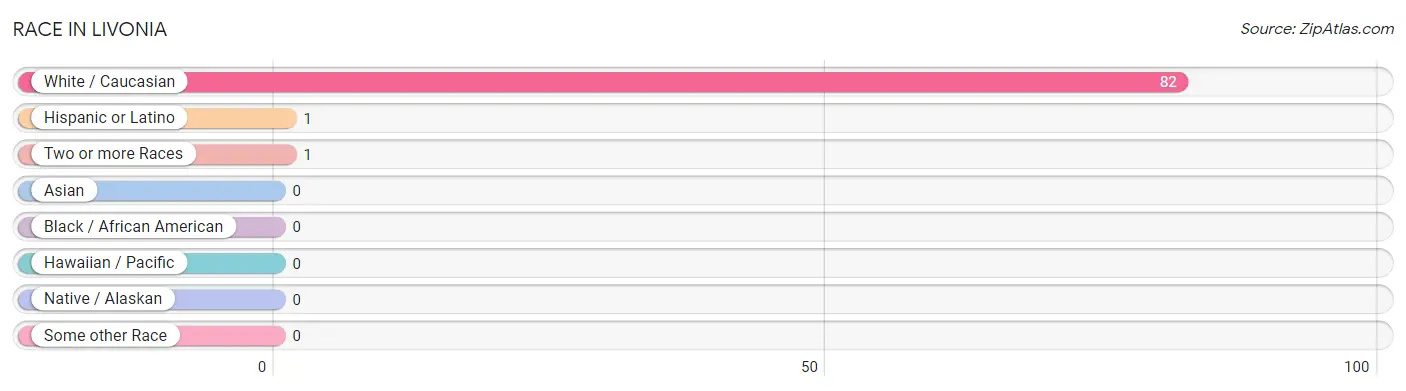
| Race | # Population | % Population |
| Asian | 0 | 0.0% |
| Black / African American | 0 | 0.0% |
| Hawaiian / Pacific | 0 | 0.0% |
| Hispanic or Latino | 1 | 1.2% |
| Native / Alaskan | 0 | 0.0% |
| White / Caucasian | 82 | 98.8% |
| Two or more Races | 1 | 1.2% |
| Some other Race | 0 | 0.0% |
| Total | 83 | 100.0% |
Ancestry in Livonia
The most populous ancestries reported in Livonia are German (15 | 18.1%), American (9 | 10.8%), Russian (5 | 6.0%), English (4 | 4.8%), and Irish (4 | 4.8%), together accounting for 44.6% of all Livonia residents.
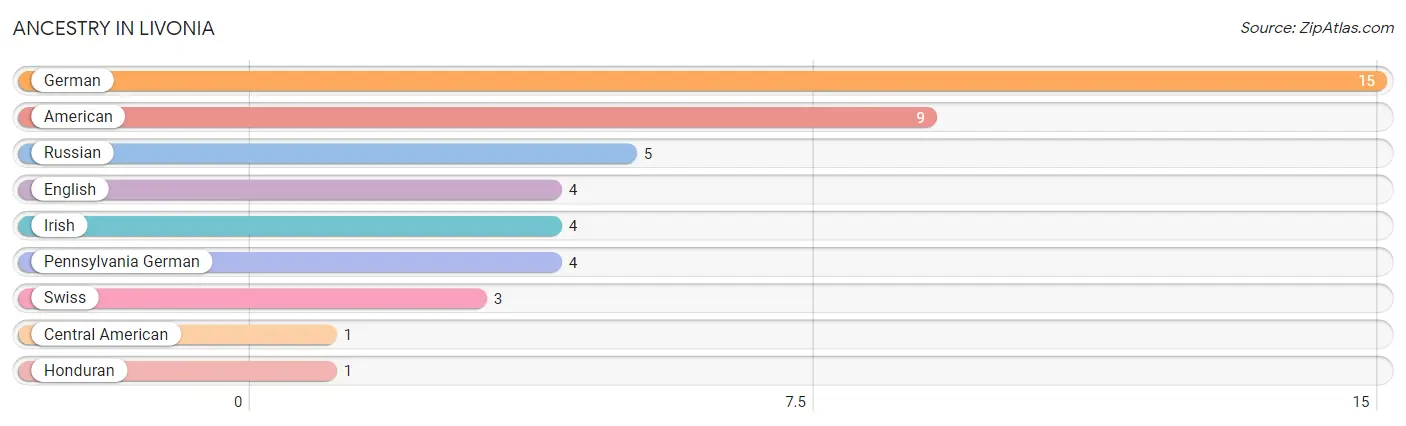
| Ancestry | # Population | % Population |
| American | 9 | 10.8% |
| Central American | 1 | 1.2% |
| English | 4 | 4.8% |
| German | 15 | 18.1% |
| Honduran | 1 | 1.2% |
| Irish | 4 | 4.8% |
| Pennsylvania German | 4 | 4.8% |
| Russian | 5 | 6.0% |
| Swiss | 3 | 3.6% | View All 9 Rows |
Immigrants in Livonia

| Immigration Origin | # Population | % Population | View All 0 Rows |
Sex and Age in Livonia
Sex and Age in Livonia
The most populous age groups in Livonia are 20 to 24 Years (6 | 17.1%) for men and 70 to 74 Years (9 | 18.8%) for women.
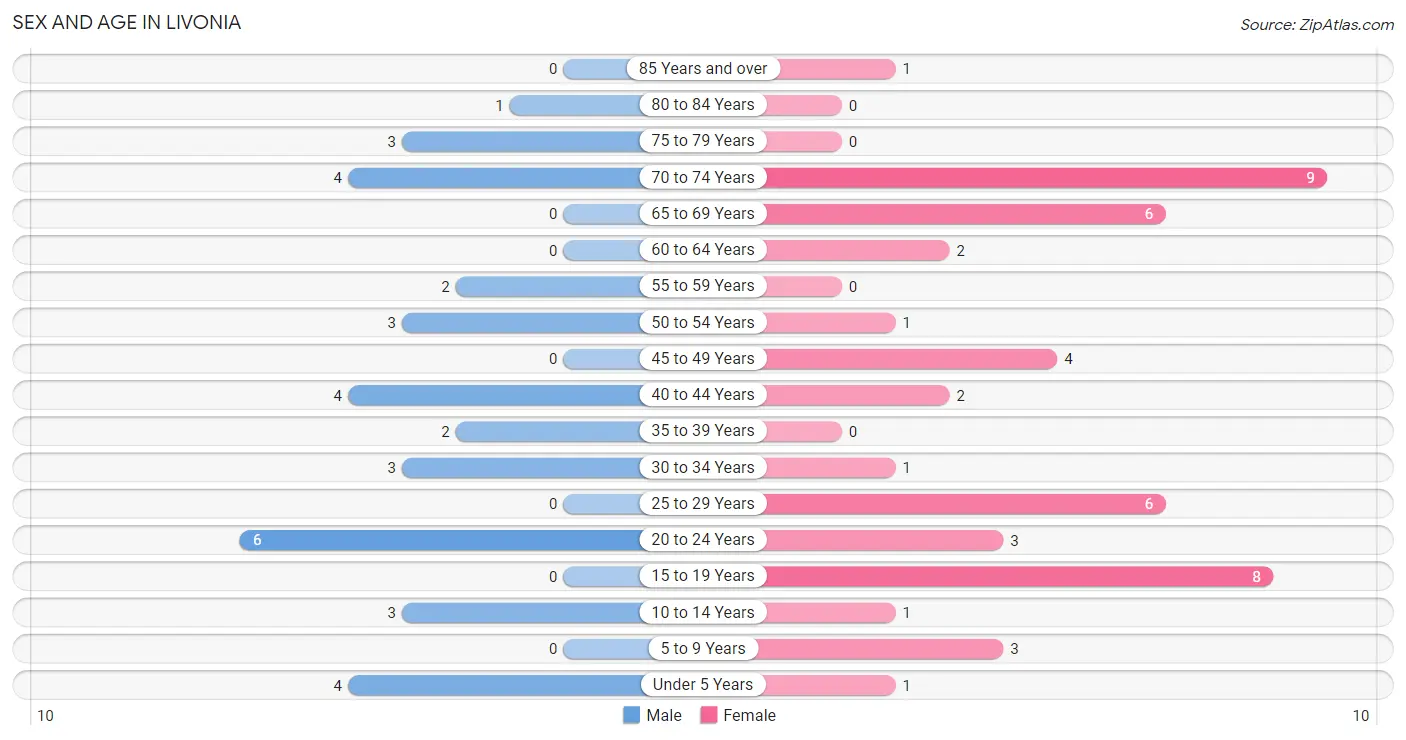
| Age Bracket | Male | Female |
| Under 5 Years | 4 (11.4%) | 1 (2.1%) |
| 5 to 9 Years | 0 (0.0%) | 3 (6.2%) |
| 10 to 14 Years | 3 (8.6%) | 1 (2.1%) |
| 15 to 19 Years | 0 (0.0%) | 8 (16.7%) |
| 20 to 24 Years | 6 (17.1%) | 3 (6.2%) |
| 25 to 29 Years | 0 (0.0%) | 6 (12.5%) |
| 30 to 34 Years | 3 (8.6%) | 1 (2.1%) |
| 35 to 39 Years | 2 (5.7%) | 0 (0.0%) |
| 40 to 44 Years | 4 (11.4%) | 2 (4.2%) |
| 45 to 49 Years | 0 (0.0%) | 4 (8.3%) |
| 50 to 54 Years | 3 (8.6%) | 1 (2.1%) |
| 55 to 59 Years | 2 (5.7%) | 0 (0.0%) |
| 60 to 64 Years | 0 (0.0%) | 2 (4.2%) |
| 65 to 69 Years | 0 (0.0%) | 6 (12.5%) |
| 70 to 74 Years | 4 (11.4%) | 9 (18.8%) |
| 75 to 79 Years | 3 (8.6%) | 0 (0.0%) |
| 80 to 84 Years | 1 (2.9%) | 0 (0.0%) |
| 85 Years and over | 0 (0.0%) | 1 (2.1%) |
| Total | 35 (100.0%) | 48 (100.0%) |
Families and Households in Livonia
Median Family Size in Livonia
The median family size in Livonia is 2.96 persons per family, with married-couple families (18 | 69.2%) accounting for the largest median family size of 3.11 persons per family. On the other hand, single female/mother families (6 | 23.1%) represent the smallest median family size with 2.50 persons per family.
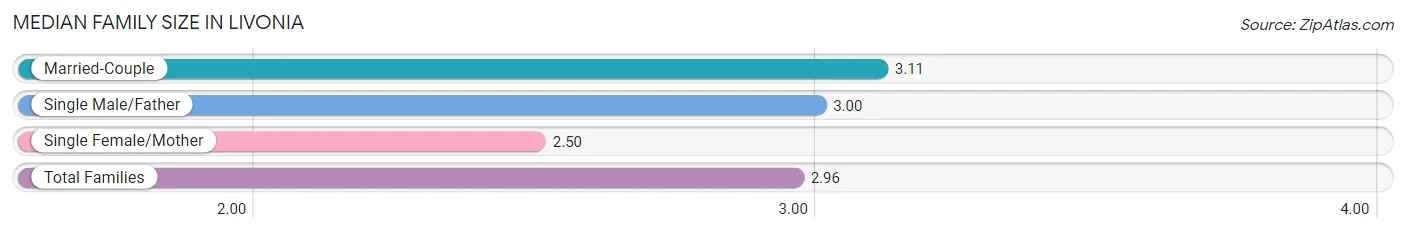
| Family Type | # Families | Family Size |
| Married-Couple | 18 (69.2%) | 3.11 |
| Single Male/Father | 2 (7.7%) | 3.00 |
| Single Female/Mother | 6 (23.1%) | 2.50 |
| Total Families | 26 (100.0%) | 2.96 |
Median Household Size in Livonia
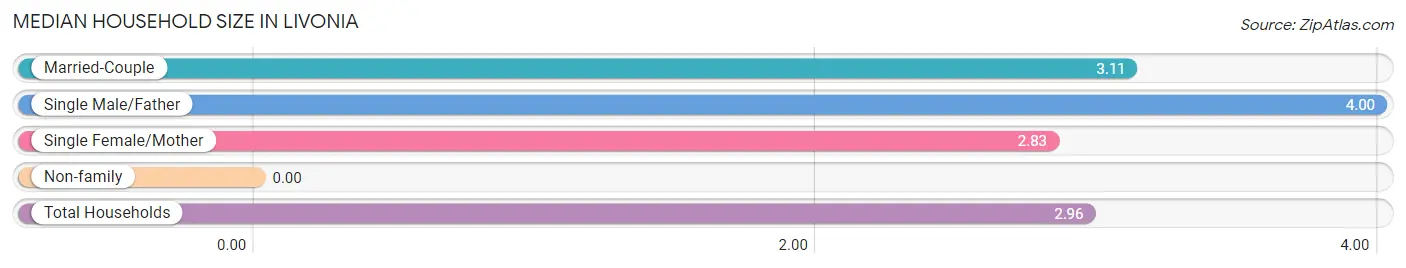
| Household Type | # Households | Household Size |
| Married-Couple | 18 (64.3%) | 3.11 |
| Single Male/Father | 2 (7.1%) | 4.00 |
| Single Female/Mother | 6 (21.4%) | 2.83 |
| Non-family | 2 (7.1%) | - |
| Total Households | 28 (100.0%) | 2.96 |
Household Size by Marriage Status in Livonia
Out of a total of 28 households in Livonia, 26 (92.9%) are family households, while 2 (7.1%) are nonfamily households. The most numerous type of family households are 2-person households, comprising 11, and the most common type of nonfamily households are 1-person households, comprising 2.
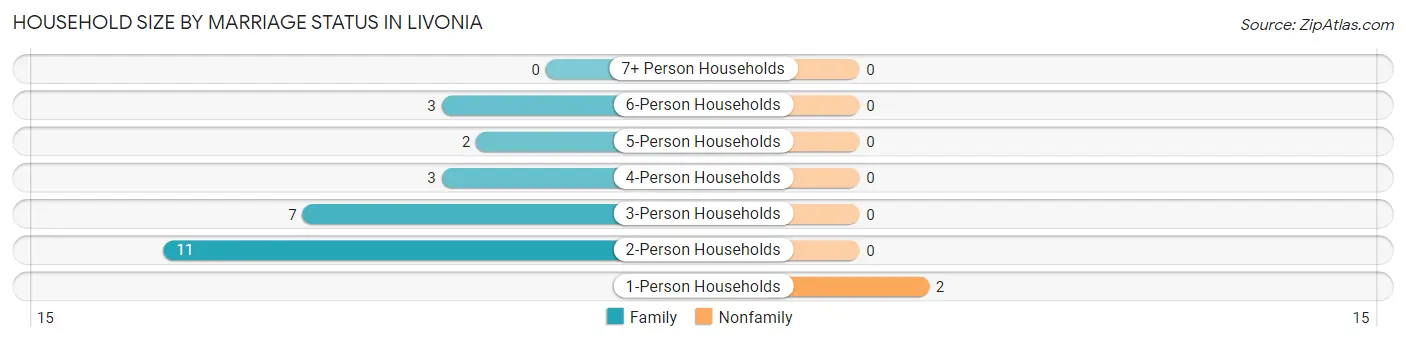
| Household Size | Family Households | Nonfamily Households |
| 1-Person Households | - | 2 (7.1%) |
| 2-Person Households | 11 (39.3%) | 0 (0.0%) |
| 3-Person Households | 7 (25.0%) | 0 (0.0%) |
| 4-Person Households | 3 (10.7%) | 0 (0.0%) |
| 5-Person Households | 2 (7.1%) | 0 (0.0%) |
| 6-Person Households | 3 (10.7%) | 0 (0.0%) |
| 7+ Person Households | 0 (0.0%) | 0 (0.0%) |
| Total | 26 (92.9%) | 2 (7.1%) |
Female Fertility in Livonia
Fertility by Age in Livonia
Average fertility rate in Livonia is 125.0 births per 1,000 women. Women in the age bracket of 20 to 34 years have the highest fertility rate with 300.0 births per 1,000 women. Women in the age bracket of 20 to 34 years acount for 100.0% of all women with births.
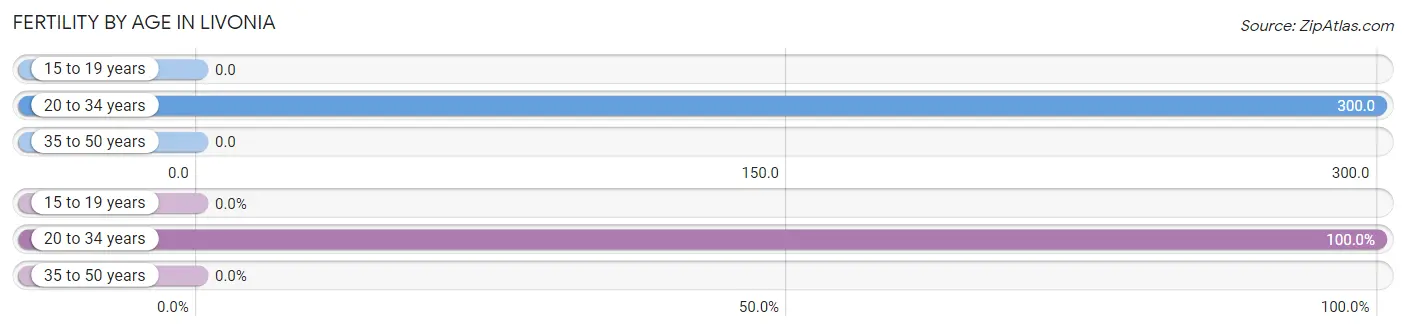
| Age Bracket | Women with Births | Births / 1,000 Women |
| 15 to 19 years | 0 (0.0%) | 0.0 |
| 20 to 34 years | 3 (100.0%) | 300.0 |
| 35 to 50 years | 0 (0.0%) | 0.0 |
| Total | 3 (100.0%) | 125.0 |
Fertility by Age by Marriage Status in Livonia
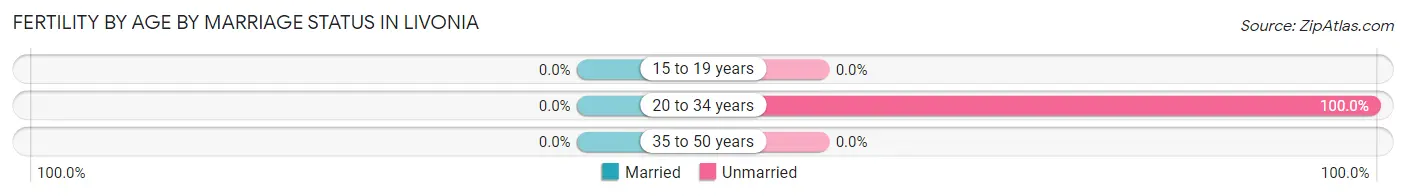
| Age Bracket | Married | Unmarried |
| 15 to 19 years | 0 (0.0%) | 0 (0.0%) |
| 20 to 34 years | 0 (0.0%) | 3 (100.0%) |
| 35 to 50 years | 0 (0.0%) | 0 (0.0%) |
| Total | 0 (0.0%) | 3 (100.0%) |
Fertility by Education in Livonia
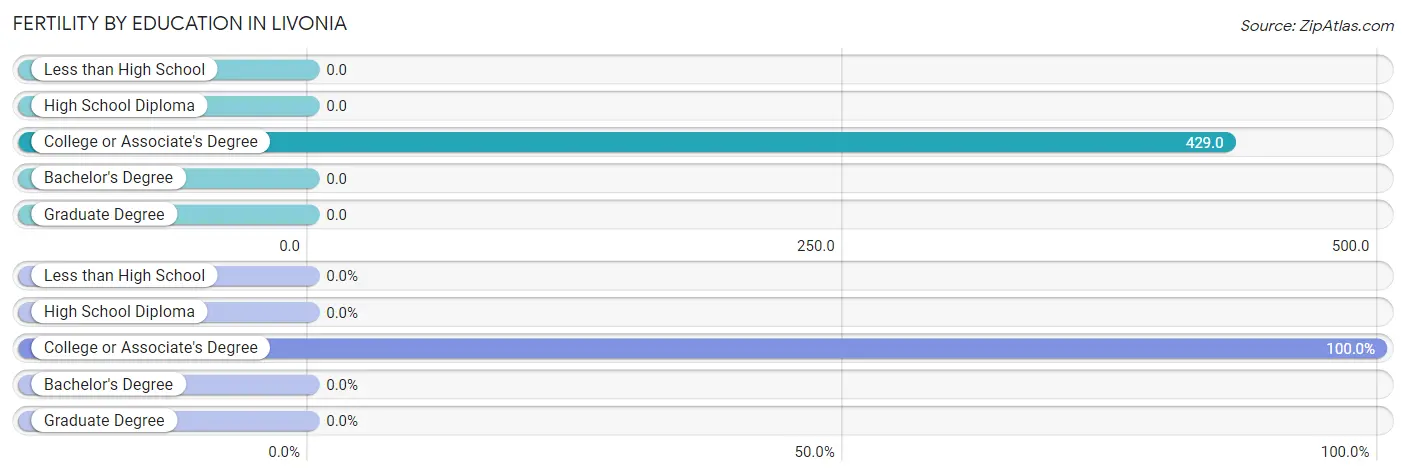
| Educational Attainment | Women with Births | Births / 1,000 Women |
| Less than High School | 0 (0.0%) | 0.0 |
| High School Diploma | 0 (0.0%) | 0.0 |
| College or Associate's Degree | 3 (100.0%) | 429.0 |
| Bachelor's Degree | 0 (0.0%) | 0.0 |
| Graduate Degree | 0 (0.0%) | 0.0 |
| Total | 3 (100.0%) | 125.0 |
Fertility by Education by Marriage Status in Livonia
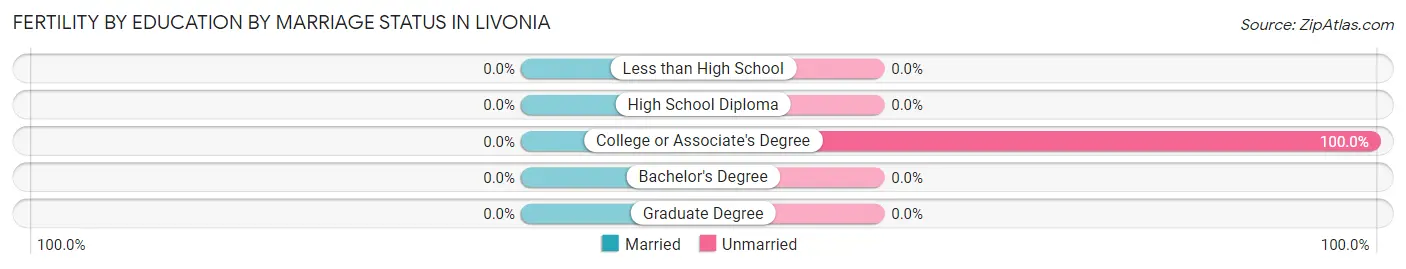
| Educational Attainment | Married | Unmarried |
| Less than High School | 0 (0.0%) | 0 (0.0%) |
| High School Diploma | 0 (0.0%) | 0 (0.0%) |
| College or Associate's Degree | 0 (0.0%) | 3 (100.0%) |
| Bachelor's Degree | 0 (0.0%) | 0 (0.0%) |
| Graduate Degree | 0 (0.0%) | 0 (0.0%) |
| Total | 0 (0.0%) | 3 (100.0%) |
Employment Characteristics in Livonia
Employment by Class of Employer in Livonia
Among the 40 employed individuals in Livonia, private company employees (33 | 82.5%), not-for-profit organizations (4 | 10.0%), and local government employees (2 | 5.0%) make up the most common classes of employment.
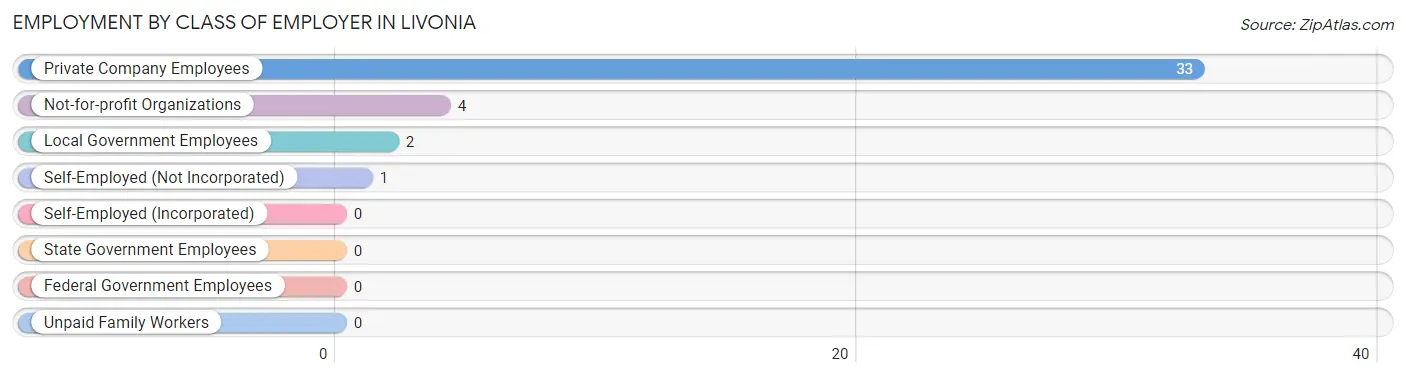
| Employer Class | # Employees | % Employees |
| Private Company Employees | 33 | 82.5% |
| Self-Employed (Incorporated) | 0 | 0.0% |
| Self-Employed (Not Incorporated) | 1 | 2.5% |
| Not-for-profit Organizations | 4 | 10.0% |
| Local Government Employees | 2 | 5.0% |
| State Government Employees | 0 | 0.0% |
| Federal Government Employees | 0 | 0.0% |
| Unpaid Family Workers | 0 | 0.0% |
| Total | 40 | 100.0% |
Employment Status by Age in Livonia
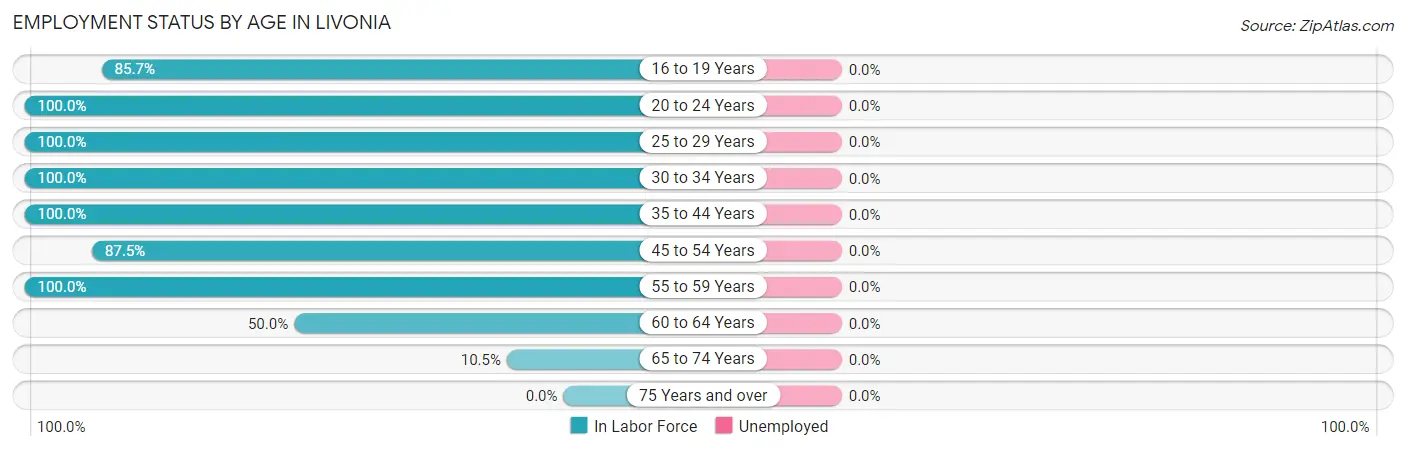
| Age Bracket | In Labor Force | Unemployed |
| 16 to 19 Years | 6 (85.7%) | 0 (0.0%) |
| 20 to 24 Years | 9 (100.0%) | 0 (0.0%) |
| 25 to 29 Years | 6 (100.0%) | 0 (0.0%) |
| 30 to 34 Years | 4 (100.0%) | 0 (0.0%) |
| 35 to 44 Years | 8 (100.0%) | 0 (0.0%) |
| 45 to 54 Years | 7 (87.5%) | 0 (0.0%) |
| 55 to 59 Years | 2 (100.0%) | 0 (0.0%) |
| 60 to 64 Years | 1 (50.0%) | 0 (0.0%) |
| 65 to 74 Years | 2 (10.5%) | 0 (0.0%) |
| 75 Years and over | 0 (0.0%) | 0 (0.0%) |
| Total | 45 (64.3%) | 0 (0.0%) |
Employment Status by Educational Attainment in Livonia
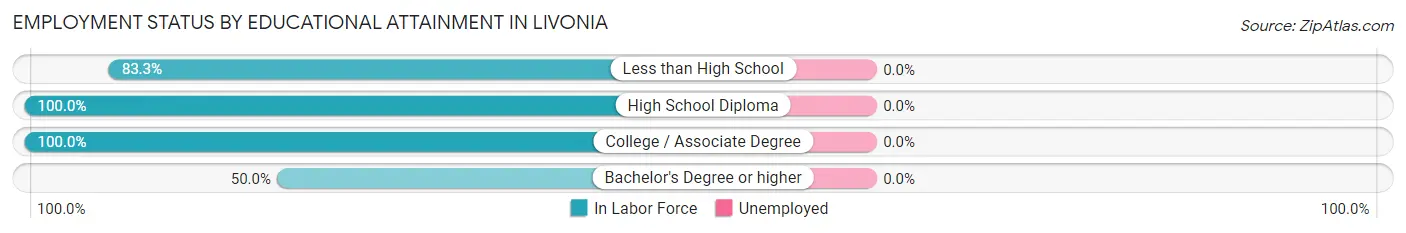
| Educational Attainment | In Labor Force | Unemployed |
| Less than High School | 5 (83.3%) | 0 (0.0%) |
| High School Diploma | 9 (100.0%) | 0 (0.0%) |
| College / Associate Degree | 13 (100.0%) | 0 (0.0%) |
| Bachelor's Degree or higher | 1 (50.0%) | 0 (0.0%) |
| Total | 28 (93.3%) | 0 (0.0%) |
Employment Occupations by Sex in Livonia
Management, Business, Science and Arts Occupations
The most common Management, Business, Science and Arts occupations in Livonia are Community & Social Service (5 | 11.1%), Education Instruction & Library (4 | 8.9%), Management (2 | 4.4%), and Arts, Media & Entertainment (1 | 2.2%).
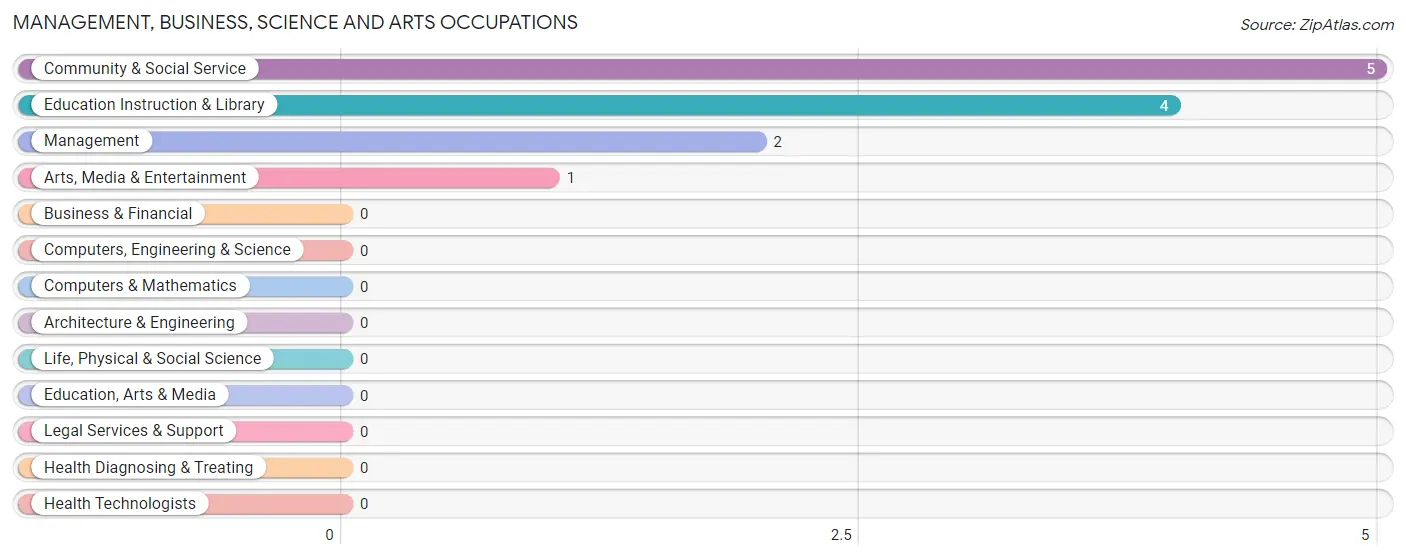
Management, Business, Science and Arts Occupations by Sex
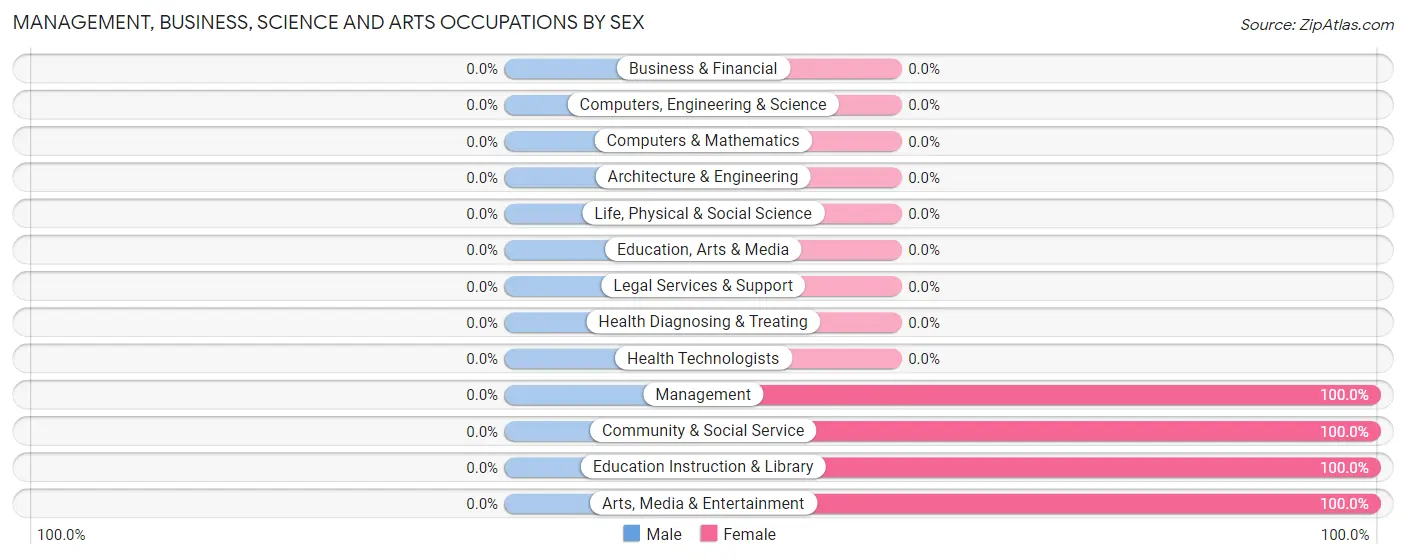
| Occupation | Male | Female |
| Management | 0 (0.0%) | 2 (100.0%) |
| Business & Financial | 0 (0.0%) | 0 (0.0%) |
| Computers, Engineering & Science | 0 (0.0%) | 0 (0.0%) |
| Computers & Mathematics | 0 (0.0%) | 0 (0.0%) |
| Architecture & Engineering | 0 (0.0%) | 0 (0.0%) |
| Life, Physical & Social Science | 0 (0.0%) | 0 (0.0%) |
| Community & Social Service | 0 (0.0%) | 5 (100.0%) |
| Education, Arts & Media | 0 (0.0%) | 0 (0.0%) |
| Legal Services & Support | 0 (0.0%) | 0 (0.0%) |
| Education Instruction & Library | 0 (0.0%) | 4 (100.0%) |
| Arts, Media & Entertainment | 0 (0.0%) | 1 (100.0%) |
| Health Diagnosing & Treating | 0 (0.0%) | 0 (0.0%) |
| Health Technologists | 0 (0.0%) | 0 (0.0%) |
| Total (Category) | 0 (0.0%) | 7 (100.0%) |
| Total (Overall) | 20 (44.4%) | 25 (55.6%) |
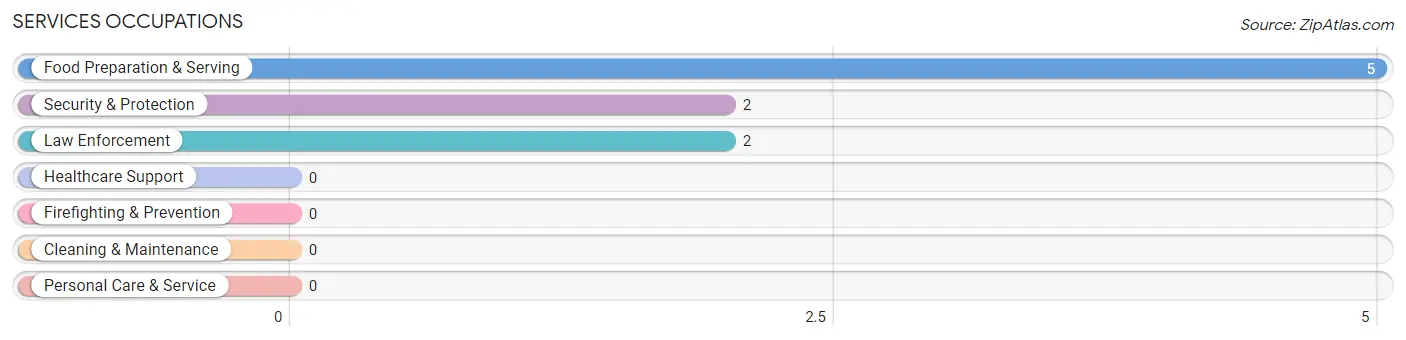
Services Occupations
The most common Services occupations in Livonia are Food Preparation & Serving (5 | 11.1%), Security & Protection (2 | 4.4%), and Law Enforcement (2 | 4.4%).
Services Occupations by Sex
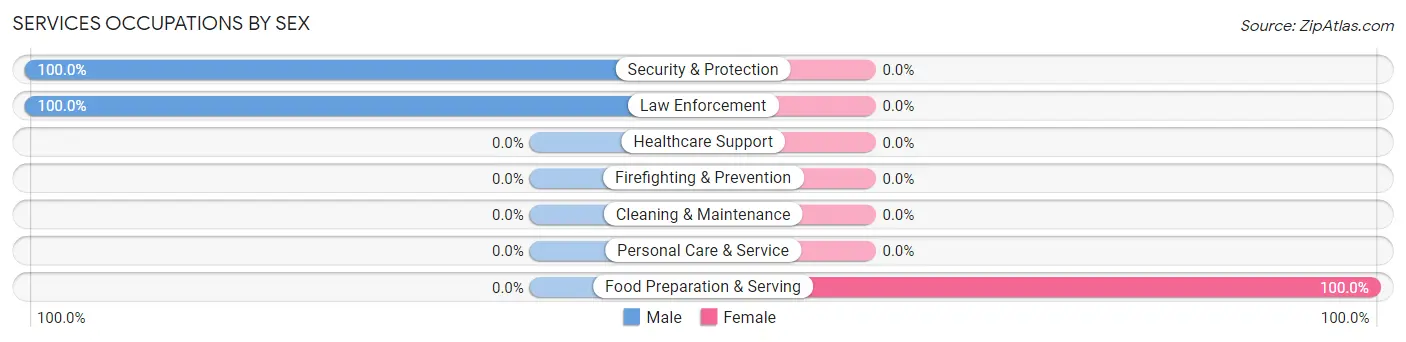
| Occupation | Male | Female |
| Healthcare Support | 0 (0.0%) | 0 (0.0%) |
| Security & Protection | 2 (100.0%) | 0 (0.0%) |
| Firefighting & Prevention | 0 (0.0%) | 0 (0.0%) |
| Law Enforcement | 2 (100.0%) | 0 (0.0%) |
| Food Preparation & Serving | 0 (0.0%) | 5 (100.0%) |
| Cleaning & Maintenance | 0 (0.0%) | 0 (0.0%) |
| Personal Care & Service | 0 (0.0%) | 0 (0.0%) |
| Total (Category) | 2 (28.6%) | 5 (71.4%) |
| Total (Overall) | 20 (44.4%) | 25 (55.6%) |
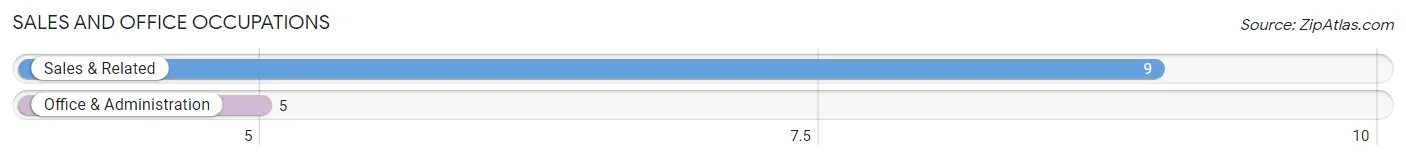
Sales and Office Occupations
The most common Sales and Office occupations in Livonia are Sales & Related (9 | 20.0%), and Office & Administration (5 | 11.1%).
Sales and Office Occupations by Sex
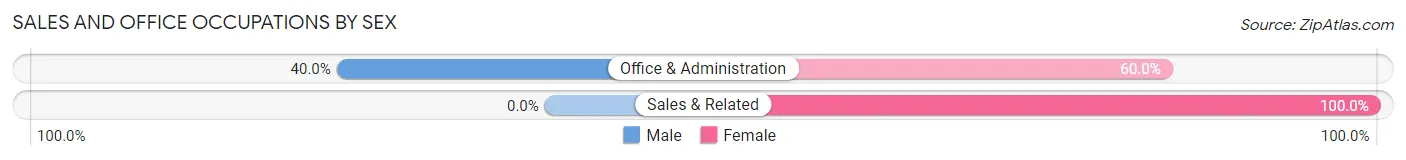
| Occupation | Male | Female |
| Sales & Related | 0 (0.0%) | 9 (100.0%) |
| Office & Administration | 2 (40.0%) | 3 (60.0%) |
| Total (Category) | 2 (14.3%) | 12 (85.7%) |
| Total (Overall) | 20 (44.4%) | 25 (55.6%) |
Natural Resources, Construction and Maintenance Occupations
The most common Natural Resources, Construction and Maintenance occupations in Livonia are Installation, Maintenance & Repair (4 | 8.9%), and Construction & Extraction (2 | 4.4%).
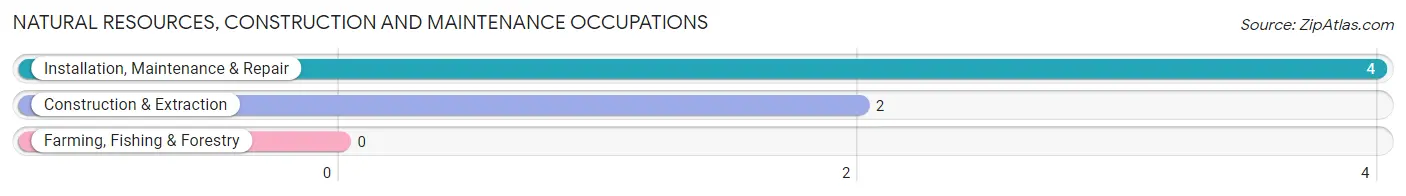
Natural Resources, Construction and Maintenance Occupations by Sex
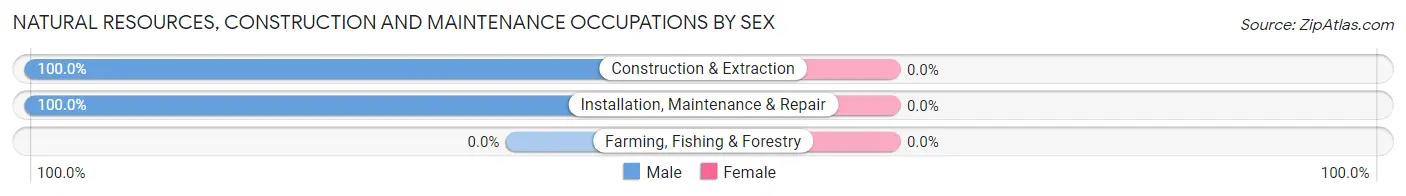
| Occupation | Male | Female |
| Farming, Fishing & Forestry | 0 (0.0%) | 0 (0.0%) |
| Construction & Extraction | 2 (100.0%) | 0 (0.0%) |
| Installation, Maintenance & Repair | 4 (100.0%) | 0 (0.0%) |
| Total (Category) | 6 (100.0%) | 0 (0.0%) |
| Total (Overall) | 20 (44.4%) | 25 (55.6%) |
Production, Transportation and Moving Occupations
The most common Production, Transportation and Moving occupations in Livonia are Production (8 | 17.8%), Transportation (2 | 4.4%), and Material Moving (1 | 2.2%).
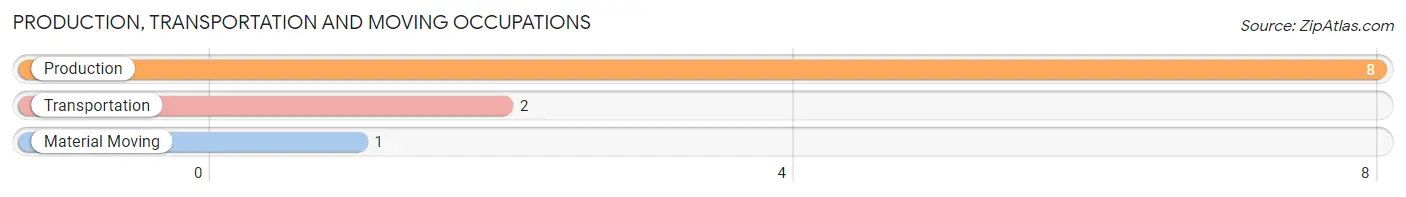
Production, Transportation and Moving Occupations by Sex

| Occupation | Male | Female |
| Production | 7 (87.5%) | 1 (12.5%) |
| Transportation | 2 (100.0%) | 0 (0.0%) |
| Material Moving | 1 (100.0%) | 0 (0.0%) |
| Total (Category) | 10 (90.9%) | 1 (9.1%) |
| Total (Overall) | 20 (44.4%) | 25 (55.6%) |
Employment Industries by Sex in Livonia
Employment Industries in Livonia
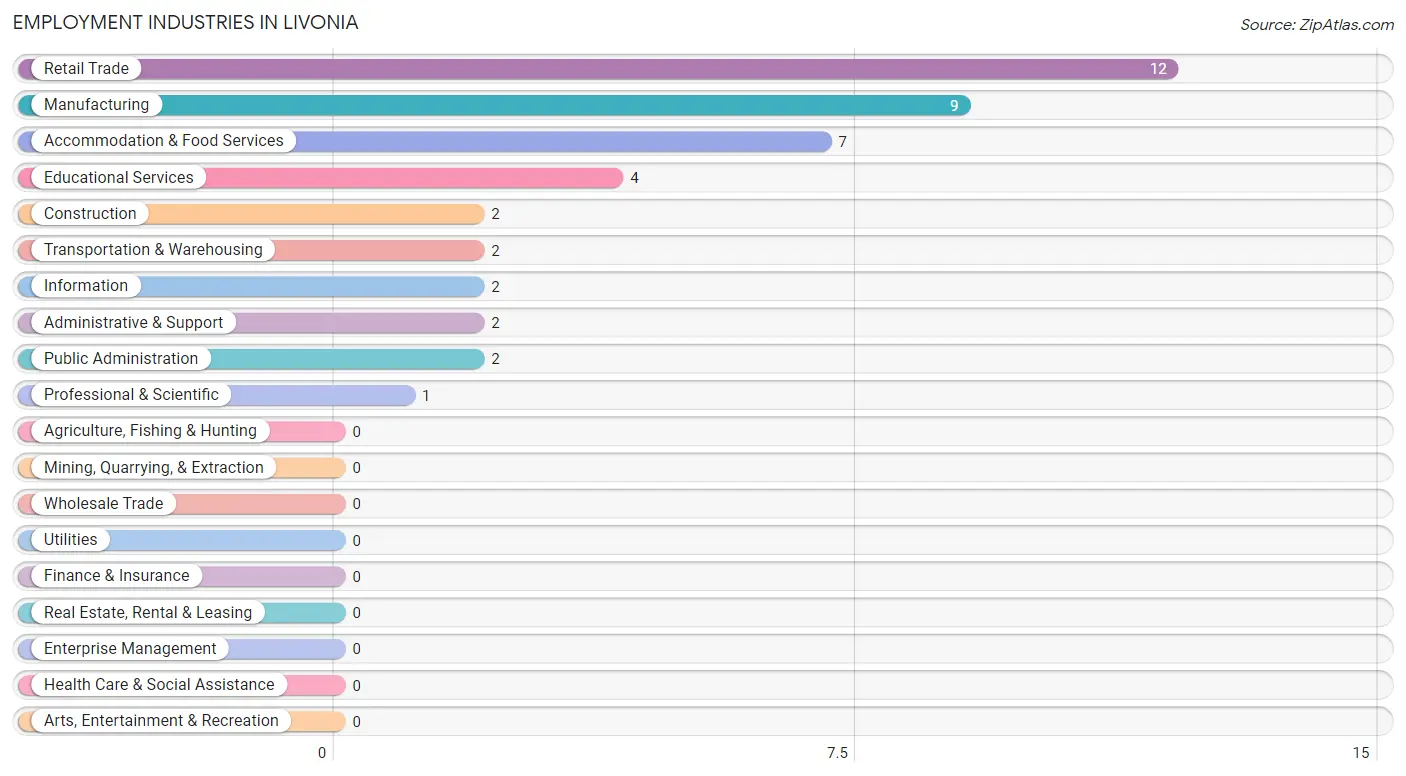
The major employment industries in Livonia include Retail Trade (12 | 26.7%), Manufacturing (9 | 20.0%), Accommodation & Food Services (7 | 15.6%), Educational Services (4 | 8.9%), and Construction (2 | 4.4%).
Employment Industries by Sex in Livonia
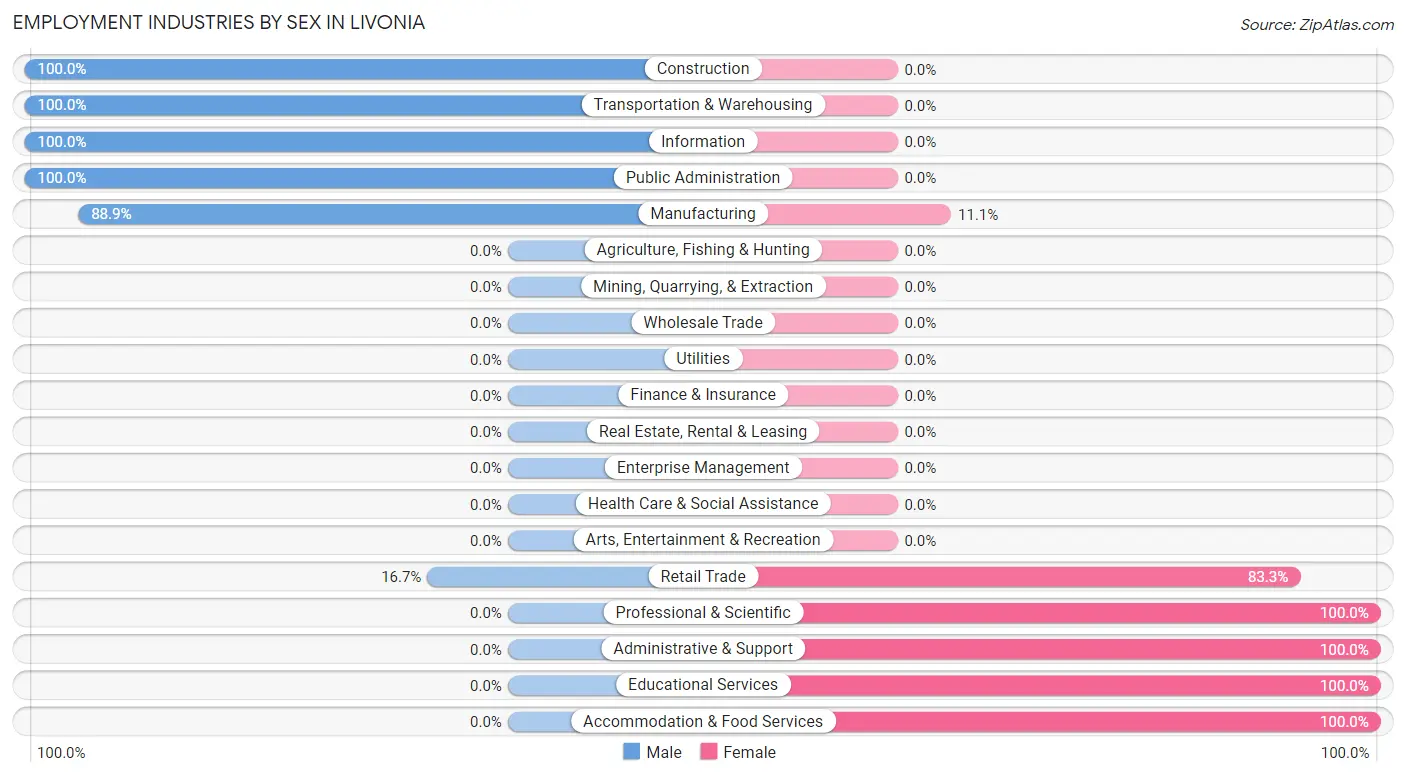
The Livonia industries that see more men than women are Construction (100.0%), Transportation & Warehousing (100.0%), and Information (100.0%), whereas the industries that tend to have a higher number of women are Professional & Scientific (100.0%), Administrative & Support (100.0%), and Educational Services (100.0%).
| Industry | Male | Female |
| Agriculture, Fishing & Hunting | 0 (0.0%) | 0 (0.0%) |
| Mining, Quarrying, & Extraction | 0 (0.0%) | 0 (0.0%) |
| Construction | 2 (100.0%) | 0 (0.0%) |
| Manufacturing | 8 (88.9%) | 1 (11.1%) |
| Wholesale Trade | 0 (0.0%) | 0 (0.0%) |
| Retail Trade | 2 (16.7%) | 10 (83.3%) |
| Transportation & Warehousing | 2 (100.0%) | 0 (0.0%) |
| Utilities | 0 (0.0%) | 0 (0.0%) |
| Information | 2 (100.0%) | 0 (0.0%) |
| Finance & Insurance | 0 (0.0%) | 0 (0.0%) |
| Real Estate, Rental & Leasing | 0 (0.0%) | 0 (0.0%) |
| Professional & Scientific | 0 (0.0%) | 1 (100.0%) |
| Enterprise Management | 0 (0.0%) | 0 (0.0%) |
| Administrative & Support | 0 (0.0%) | 2 (100.0%) |
| Educational Services | 0 (0.0%) | 4 (100.0%) |
| Health Care & Social Assistance | 0 (0.0%) | 0 (0.0%) |
| Arts, Entertainment & Recreation | 0 (0.0%) | 0 (0.0%) |
| Accommodation & Food Services | 0 (0.0%) | 7 (100.0%) |
| Public Administration | 2 (100.0%) | 0 (0.0%) |
| Total | 20 (44.4%) | 25 (55.6%) |
Education in Livonia
School Enrollment in Livonia
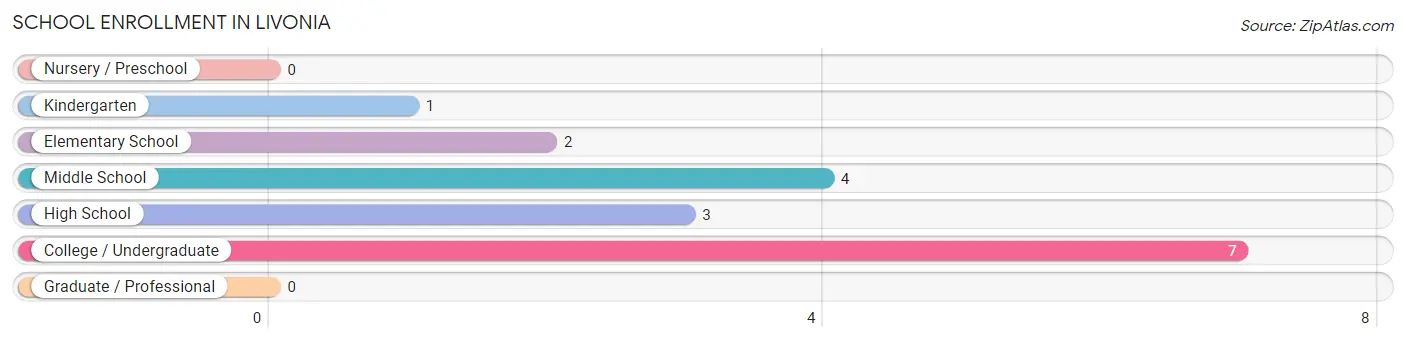
The most common levels of schooling among the 17 students in Livonia are college / undergraduate (7 | 41.2%), middle school (4 | 23.5%), and high school (3 | 17.6%).
| School Level | # Students | % Students |
| Nursery / Preschool | 0 | 0.0% |
| Kindergarten | 1 | 5.9% |
| Elementary School | 2 | 11.8% |
| Middle School | 4 | 23.5% |
| High School | 3 | 17.6% |
| College / Undergraduate | 7 | 41.2% |
| Graduate / Professional | 0 | 0.0% |
| Total | 17 | 100.0% |
School Enrollment by Age by Funding Source in Livonia
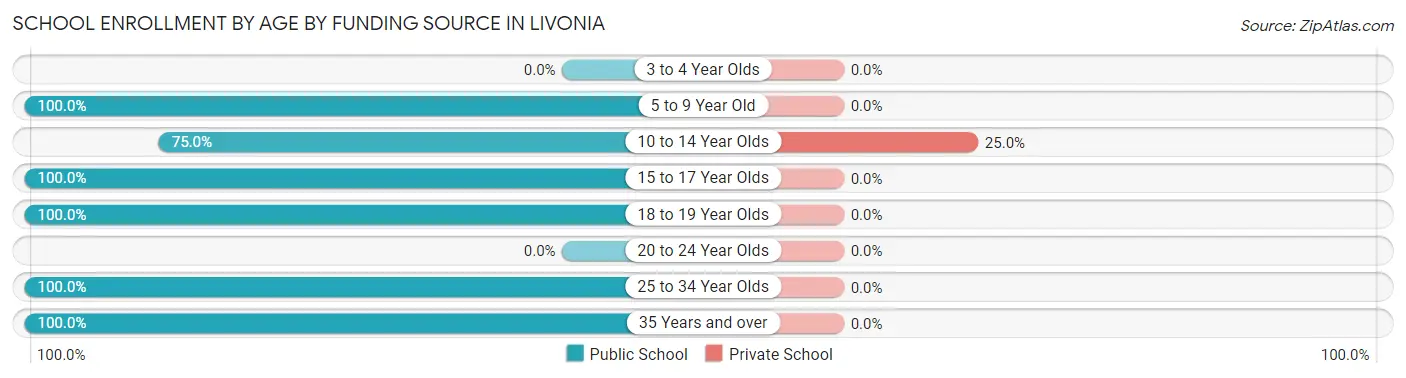
Out of a total of 17 students who are enrolled in schools in Livonia, 1 (5.9%) attend a private institution, while the remaining 16 (94.1%) are enrolled in public schools. The age group of 10 to 14 year olds has the highest likelihood of being enrolled in private schools, with 1 (25.0% in the age bracket) enrolled. Conversely, the age group of 5 to 9 year old has the lowest likelihood of being enrolled in a private school, with 3 (100.0% in the age bracket) attending a public institution.
| Age Bracket | Public School | Private School |
| 3 to 4 Year Olds | 0 (0.0%) | 0 (0.0%) |
| 5 to 9 Year Old | 3 (100.0%) | 0 (0.0%) |
| 10 to 14 Year Olds | 3 (75.0%) | 1 (25.0%) |
| 15 to 17 Year Olds | 1 (100.0%) | 0 (0.0%) |
| 18 to 19 Year Olds | 2 (100.0%) | 0 (0.0%) |
| 20 to 24 Year Olds | 0 (0.0%) | 0 (0.0%) |
| 25 to 34 Year Olds | 3 (100.0%) | 0 (0.0%) |
| 35 Years and over | 4 (100.0%) | 0 (0.0%) |
| Total | 16 (94.1%) | 1 (5.9%) |
Educational Attainment by Field of Study in Livonia
Psychology (2 | 50.0%), physical & health sciences (1 | 25.0%), and education (1 | 25.0%) are the most common fields of study among 4 individuals in Livonia who have obtained a bachelor's degree or higher.
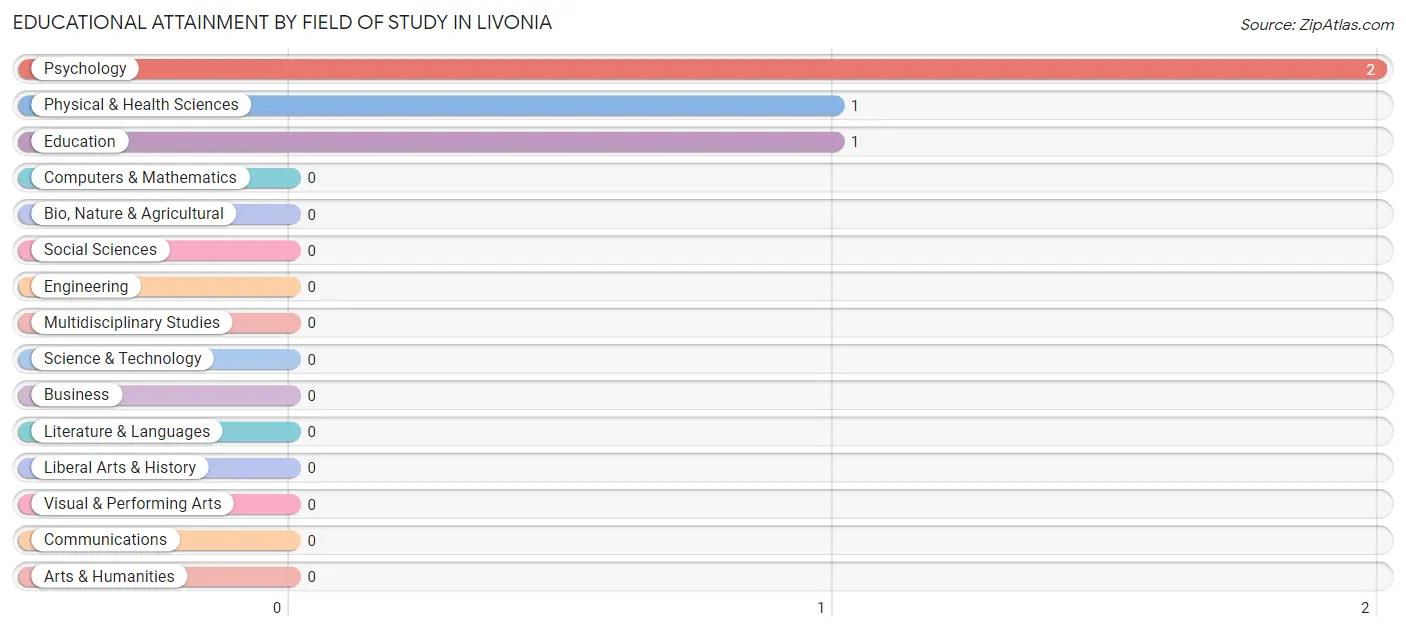
| Field of Study | # Graduates | % Graduates |
| Computers & Mathematics | 0 | 0.0% |
| Bio, Nature & Agricultural | 0 | 0.0% |
| Physical & Health Sciences | 1 | 25.0% |
| Psychology | 2 | 50.0% |
| Social Sciences | 0 | 0.0% |
| Engineering | 0 | 0.0% |
| Multidisciplinary Studies | 0 | 0.0% |
| Science & Technology | 0 | 0.0% |
| Business | 0 | 0.0% |
| Education | 1 | 25.0% |
| Literature & Languages | 0 | 0.0% |
| Liberal Arts & History | 0 | 0.0% |
| Visual & Performing Arts | 0 | 0.0% |
| Communications | 0 | 0.0% |
| Arts & Humanities | 0 | 0.0% |
| Total | 4 | 100.0% |
Transportation & Commute in Livonia
Vehicle Availability by Sex in Livonia
The most prevalent vehicle ownership categories in Livonia are males with 3 vehicles (7, accounting for 38.9%) and females with 3 vehicles (10, making up 31.8%).
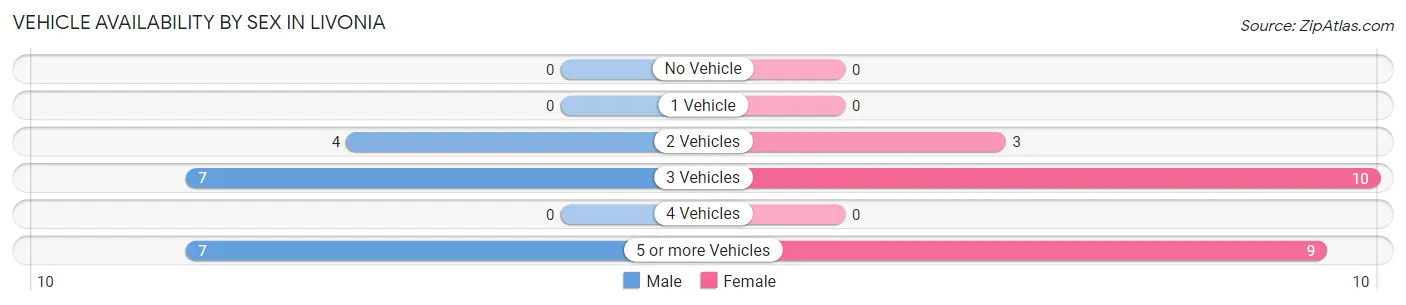
| Vehicles Available | Male | Female |
| No Vehicle | 0 (0.0%) | 0 (0.0%) |
| 1 Vehicle | 0 (0.0%) | 0 (0.0%) |
| 2 Vehicles | 4 (22.2%) | 3 (13.6%) |
| 3 Vehicles | 7 (38.9%) | 10 (45.5%) |
| 4 Vehicles | 0 (0.0%) | 0 (0.0%) |
| 5 or more Vehicles | 7 (38.9%) | 9 (40.9%) |
| Total | 18 (100.0%) | 22 (100.0%) |
Commute Time in Livonia
The most frequently occuring commute durations in Livonia are 15 to 19 minutes (11 commuters, 28.2%), less than 5 minutes (7 commuters, 17.9%), and 20 to 24 minutes (5 commuters, 12.8%).
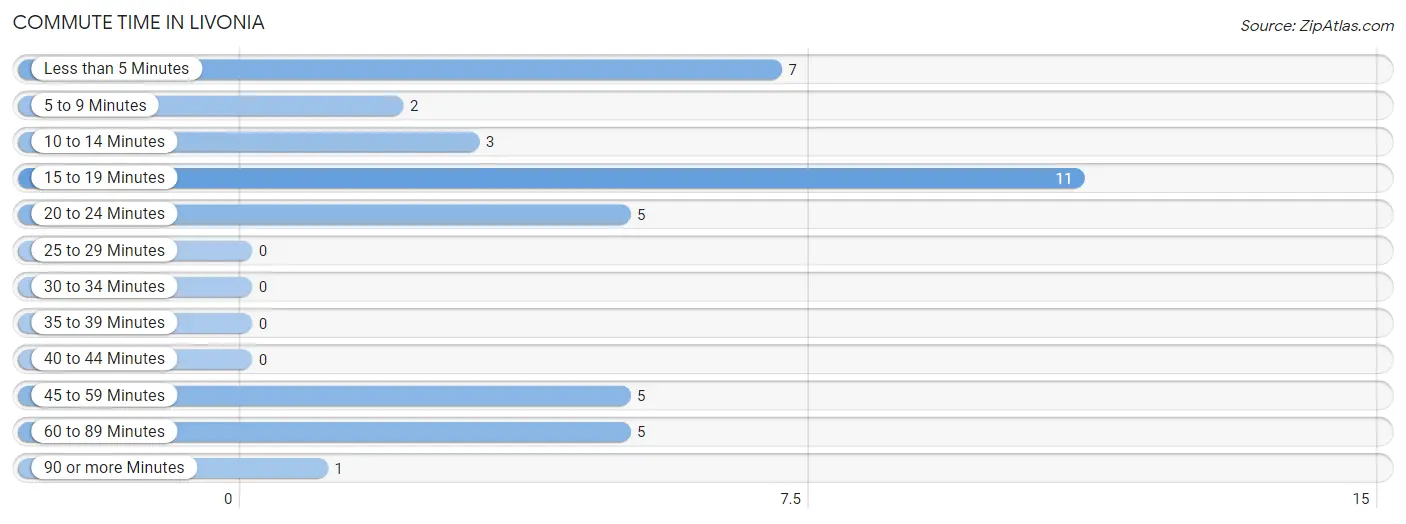
| Commute Time | # Commuters | % Commuters |
| Less than 5 Minutes | 7 | 17.9% |
| 5 to 9 Minutes | 2 | 5.1% |
| 10 to 14 Minutes | 3 | 7.7% |
| 15 to 19 Minutes | 11 | 28.2% |
| 20 to 24 Minutes | 5 | 12.8% |
| 25 to 29 Minutes | 0 | 0.0% |
| 30 to 34 Minutes | 0 | 0.0% |
| 35 to 39 Minutes | 0 | 0.0% |
| 40 to 44 Minutes | 0 | 0.0% |
| 45 to 59 Minutes | 5 | 12.8% |
| 60 to 89 Minutes | 5 | 12.8% |
| 90 or more Minutes | 1 | 2.6% |
Commute Time by Sex in Livonia
The most common commute times in Livonia are 15 to 19 minutes (8 commuters, 44.4%) for males and less than 5 minutes (7 commuters, 33.3%) for females.
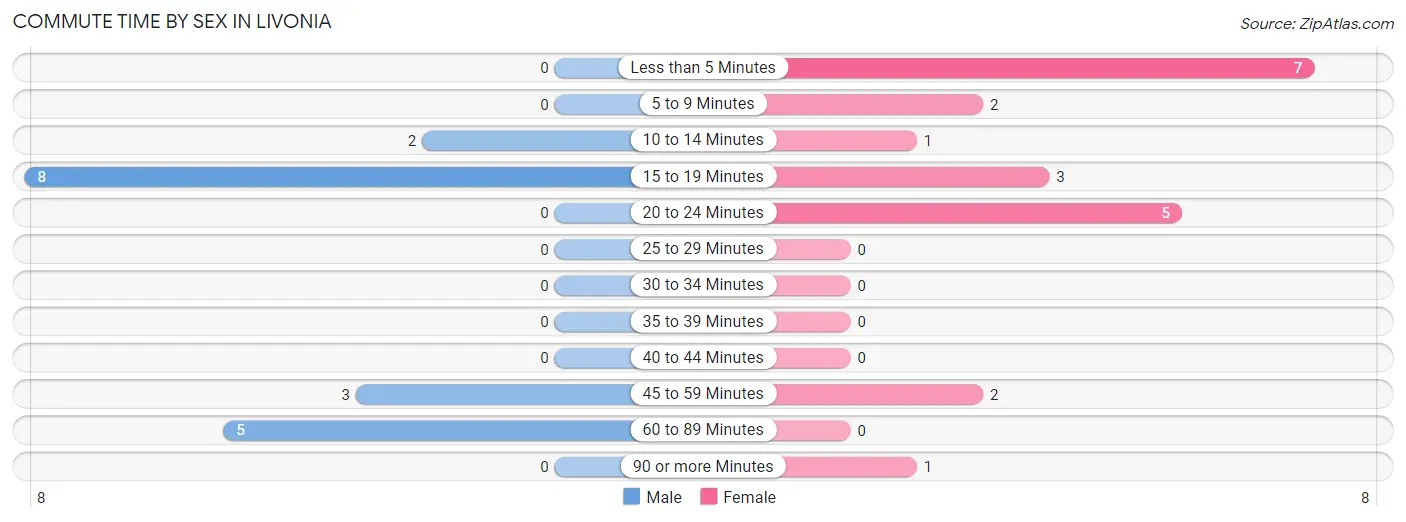
| Commute Time | Male | Female |
| Less than 5 Minutes | 0 (0.0%) | 7 (33.3%) |
| 5 to 9 Minutes | 0 (0.0%) | 2 (9.5%) |
| 10 to 14 Minutes | 2 (11.1%) | 1 (4.8%) |
| 15 to 19 Minutes | 8 (44.4%) | 3 (14.3%) |
| 20 to 24 Minutes | 0 (0.0%) | 5 (23.8%) |
| 25 to 29 Minutes | 0 (0.0%) | 0 (0.0%) |
| 30 to 34 Minutes | 0 (0.0%) | 0 (0.0%) |
| 35 to 39 Minutes | 0 (0.0%) | 0 (0.0%) |
| 40 to 44 Minutes | 0 (0.0%) | 0 (0.0%) |
| 45 to 59 Minutes | 3 (16.7%) | 2 (9.5%) |
| 60 to 89 Minutes | 5 (27.8%) | 0 (0.0%) |
| 90 or more Minutes | 0 (0.0%) | 1 (4.8%) |
Time of Departure to Work by Sex in Livonia
The most frequent times of departure to work in Livonia are 12:00 AM to 4:59 AM (5, 27.8%) for males and 8:00 AM to 8:29 AM (9, 42.9%) for females.
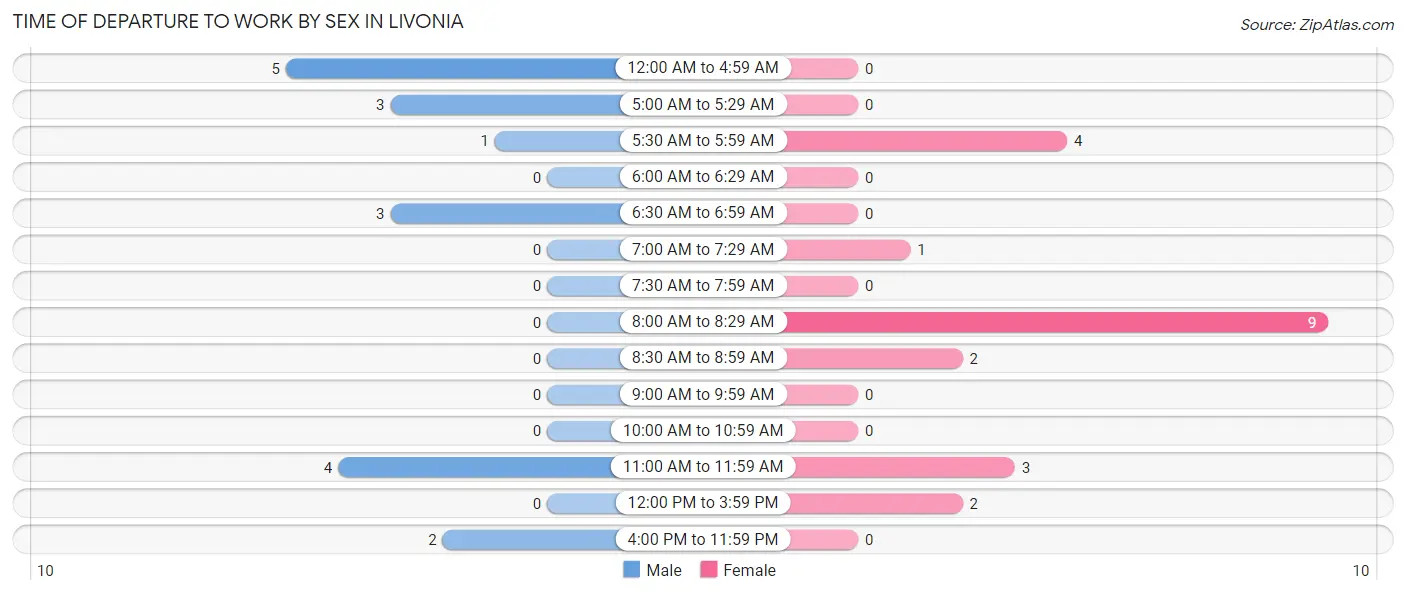
| Time of Departure | Male | Female |
| 12:00 AM to 4:59 AM | 5 (27.8%) | 0 (0.0%) |
| 5:00 AM to 5:29 AM | 3 (16.7%) | 0 (0.0%) |
| 5:30 AM to 5:59 AM | 1 (5.6%) | 4 (19.1%) |
| 6:00 AM to 6:29 AM | 0 (0.0%) | 0 (0.0%) |
| 6:30 AM to 6:59 AM | 3 (16.7%) | 0 (0.0%) |
| 7:00 AM to 7:29 AM | 0 (0.0%) | 1 (4.8%) |
| 7:30 AM to 7:59 AM | 0 (0.0%) | 0 (0.0%) |
| 8:00 AM to 8:29 AM | 0 (0.0%) | 9 (42.9%) |
| 8:30 AM to 8:59 AM | 0 (0.0%) | 2 (9.5%) |
| 9:00 AM to 9:59 AM | 0 (0.0%) | 0 (0.0%) |
| 10:00 AM to 10:59 AM | 0 (0.0%) | 0 (0.0%) |
| 11:00 AM to 11:59 AM | 4 (22.2%) | 3 (14.3%) |
| 12:00 PM to 3:59 PM | 0 (0.0%) | 2 (9.5%) |
| 4:00 PM to 11:59 PM | 2 (11.1%) | 0 (0.0%) |
| Total | 18 (100.0%) | 21 (100.0%) |
Housing Occupancy in Livonia
Occupancy by Ownership in Livonia
Of the total 28 dwellings in Livonia, owner-occupied units account for 26 (92.9%), while renter-occupied units make up 2 (7.1%).
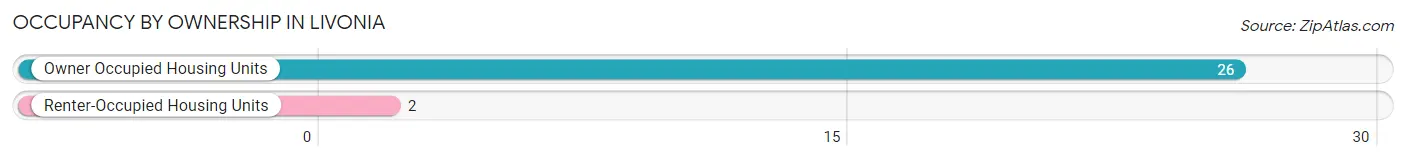
| Occupancy | # Housing Units | % Housing Units |
| Owner Occupied Housing Units | 26 | 92.9% |
| Renter-Occupied Housing Units | 2 | 7.1% |
| Total Occupied Housing Units | 28 | 100.0% |
Occupancy by Household Size in Livonia
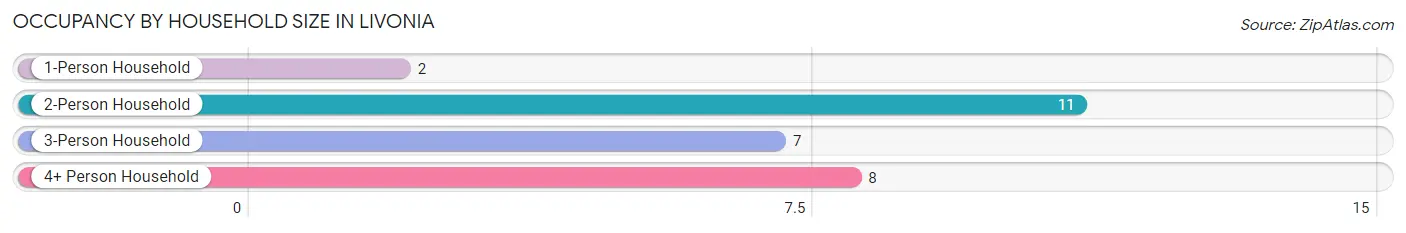
| Household Size | # Housing Units | % Housing Units |
| 1-Person Household | 2 | 7.1% |
| 2-Person Household | 11 | 39.3% |
| 3-Person Household | 7 | 25.0% |
| 4+ Person Household | 8 | 28.6% |
| Total Housing Units | 28 | 100.0% |
Occupancy by Ownership by Household Size in Livonia
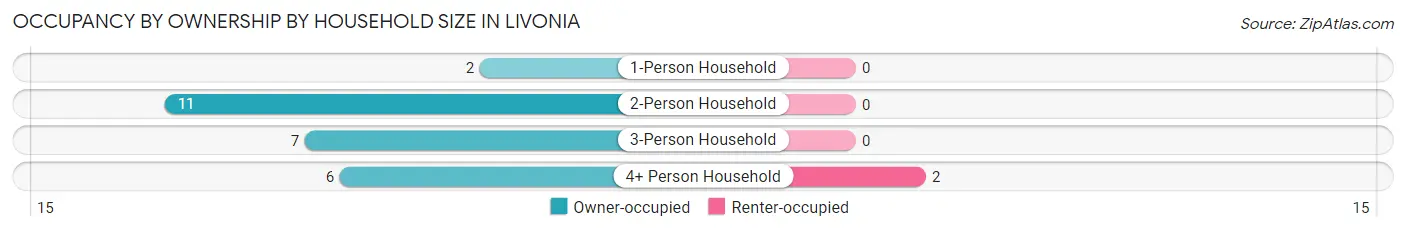
| Household Size | Owner-occupied | Renter-occupied |
| 1-Person Household | 2 (100.0%) | 0 (0.0%) |
| 2-Person Household | 11 (100.0%) | 0 (0.0%) |
| 3-Person Household | 7 (100.0%) | 0 (0.0%) |
| 4+ Person Household | 6 (75.0%) | 2 (25.0%) |
| Total Housing Units | 26 (92.9%) | 2 (7.1%) |
Occupancy by Educational Attainment in Livonia
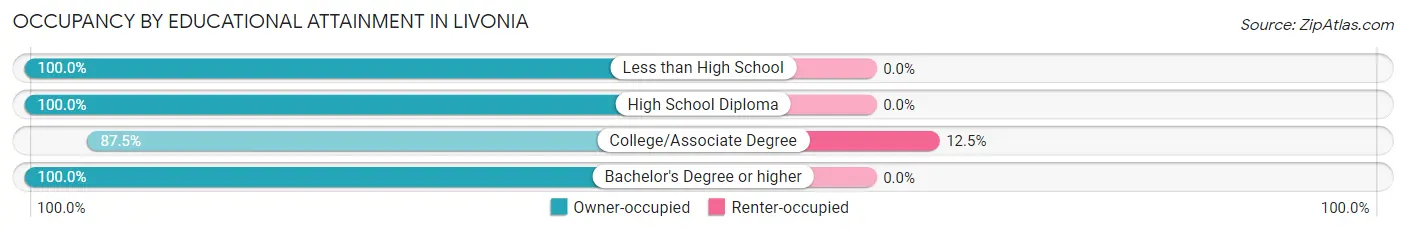
| Household Size | Owner-occupied | Renter-occupied |
| Less than High School | 4 (100.0%) | 0 (0.0%) |
| High School Diploma | 6 (100.0%) | 0 (0.0%) |
| College/Associate Degree | 14 (87.5%) | 2 (12.5%) |
| Bachelor's Degree or higher | 2 (100.0%) | 0 (0.0%) |
Occupancy by Age of Householder in Livonia
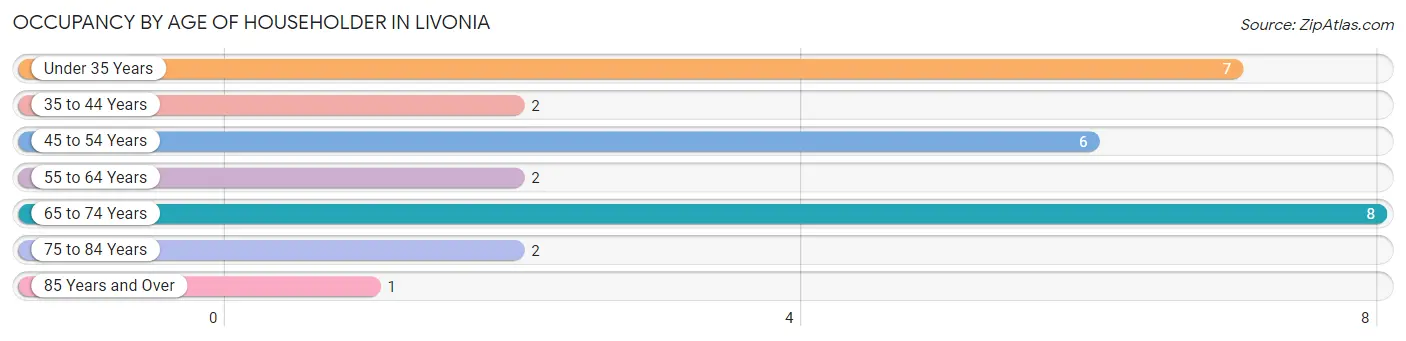
| Age Bracket | # Households | % Households |
| Under 35 Years | 7 | 25.0% |
| 35 to 44 Years | 2 | 7.1% |
| 45 to 54 Years | 6 | 21.4% |
| 55 to 64 Years | 2 | 7.1% |
| 65 to 74 Years | 8 | 28.6% |
| 75 to 84 Years | 2 | 7.1% |
| 85 Years and Over | 1 | 3.6% |
| Total | 28 | 100.0% |
Housing Finances in Livonia
Median Income by Occupancy in Livonia
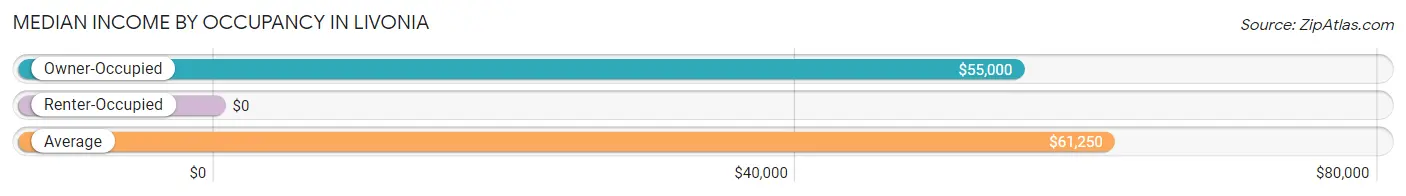
| Occupancy Type | # Households | Median Income |
| Owner-Occupied | 26 (92.9%) | $55,000 |
| Renter-Occupied | 2 (7.1%) | $0 |
| Average | 28 (100.0%) | $61,250 |
Occupancy by Householder Income Bracket in Livonia
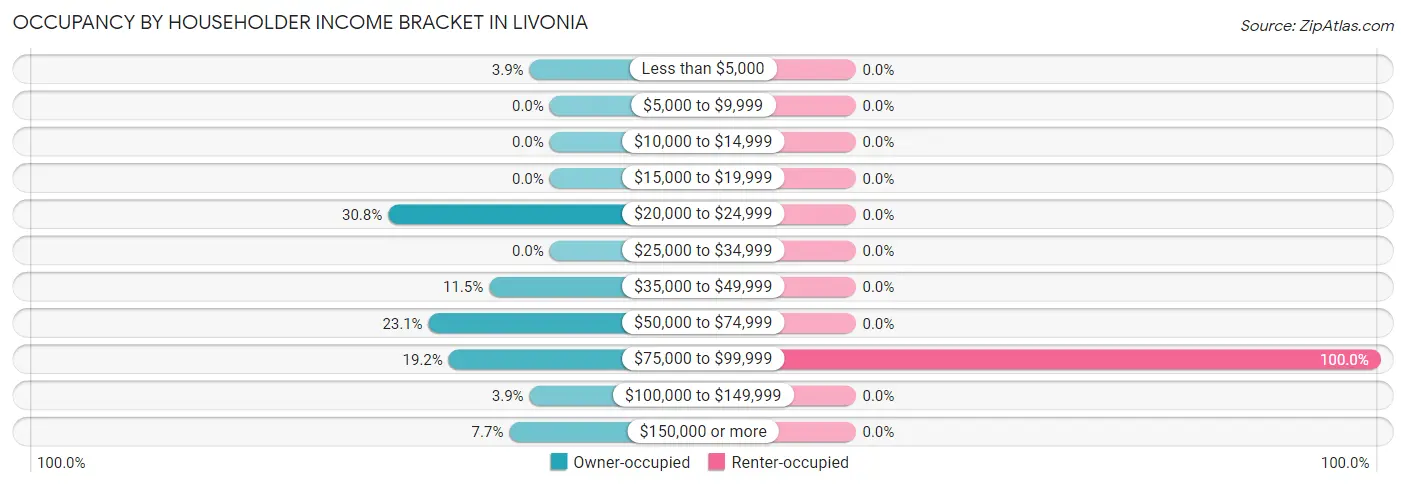
| Income Bracket | Owner-occupied | Renter-occupied |
| Less than $5,000 | 1 (3.8%) | 0 (0.0%) |
| $5,000 to $9,999 | 0 (0.0%) | 0 (0.0%) |
| $10,000 to $14,999 | 0 (0.0%) | 0 (0.0%) |
| $15,000 to $19,999 | 0 (0.0%) | 0 (0.0%) |
| $20,000 to $24,999 | 8 (30.8%) | 0 (0.0%) |
| $25,000 to $34,999 | 0 (0.0%) | 0 (0.0%) |
| $35,000 to $49,999 | 3 (11.5%) | 0 (0.0%) |
| $50,000 to $74,999 | 6 (23.1%) | 0 (0.0%) |
| $75,000 to $99,999 | 5 (19.2%) | 2 (100.0%) |
| $100,000 to $149,999 | 1 (3.8%) | 0 (0.0%) |
| $150,000 or more | 2 (7.7%) | 0 (0.0%) |
| Total | 26 (100.0%) | 2 (100.0%) |
Monthly Housing Cost Tiers in Livonia
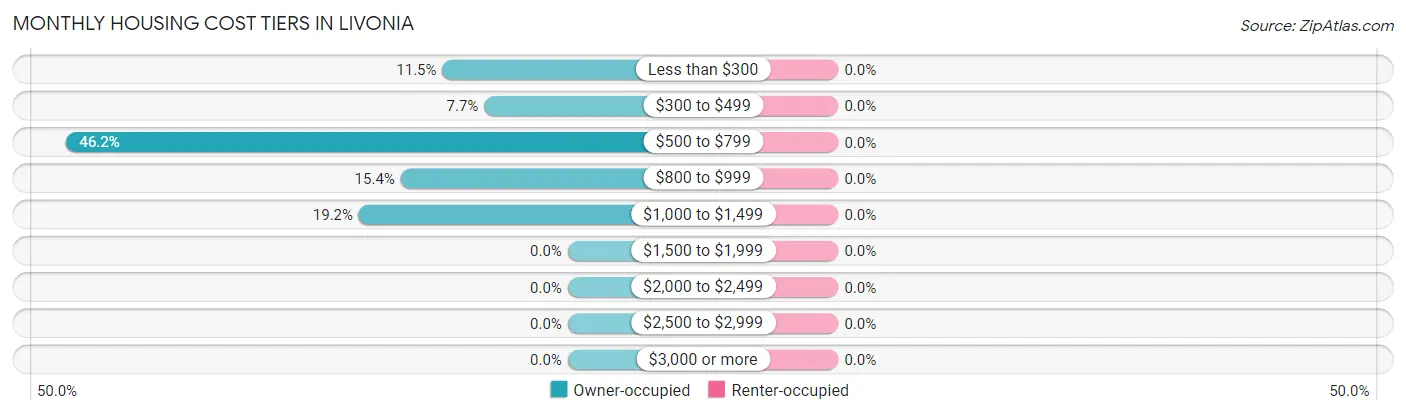
| Monthly Cost | Owner-occupied | Renter-occupied |
| Less than $300 | 3 (11.5%) | 0 (0.0%) |
| $300 to $499 | 2 (7.7%) | 0 (0.0%) |
| $500 to $799 | 12 (46.2%) | 0 (0.0%) |
| $800 to $999 | 4 (15.4%) | 0 (0.0%) |
| $1,000 to $1,499 | 5 (19.2%) | 0 (0.0%) |
| $1,500 to $1,999 | 0 (0.0%) | 0 (0.0%) |
| $2,000 to $2,499 | 0 (0.0%) | 0 (0.0%) |
| $2,500 to $2,999 | 0 (0.0%) | 0 (0.0%) |
| $3,000 or more | 0 (0.0%) | 0 (0.0%) |
| Total | 26 (100.0%) | 2 (100.0%) |
Physical Housing Characteristics in Livonia
Housing Structures in Livonia
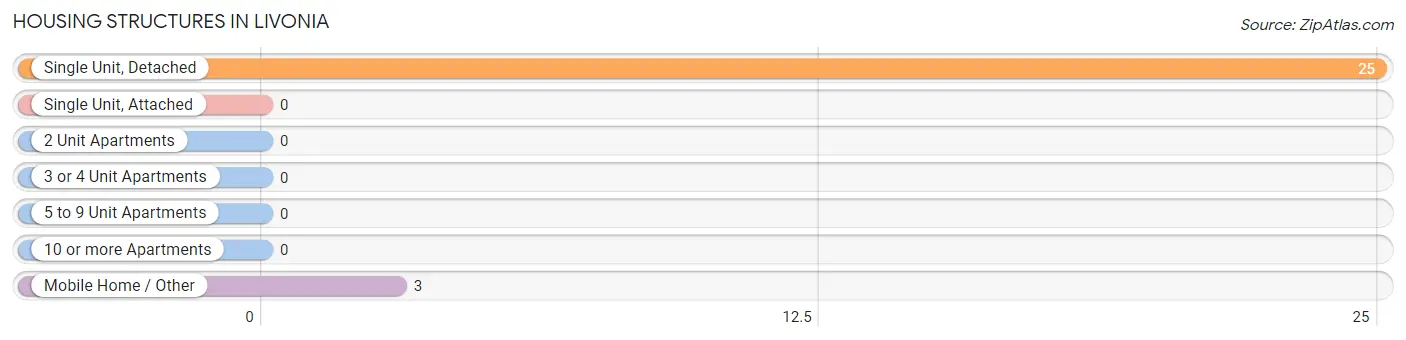
| Structure Type | # Housing Units | % Housing Units |
| Single Unit, Detached | 25 | 89.3% |
| Single Unit, Attached | 0 | 0.0% |
| 2 Unit Apartments | 0 | 0.0% |
| 3 or 4 Unit Apartments | 0 | 0.0% |
| 5 to 9 Unit Apartments | 0 | 0.0% |
| 10 or more Apartments | 0 | 0.0% |
| Mobile Home / Other | 3 | 10.7% |
| Total | 28 | 100.0% |
Housing Structures by Occupancy in Livonia
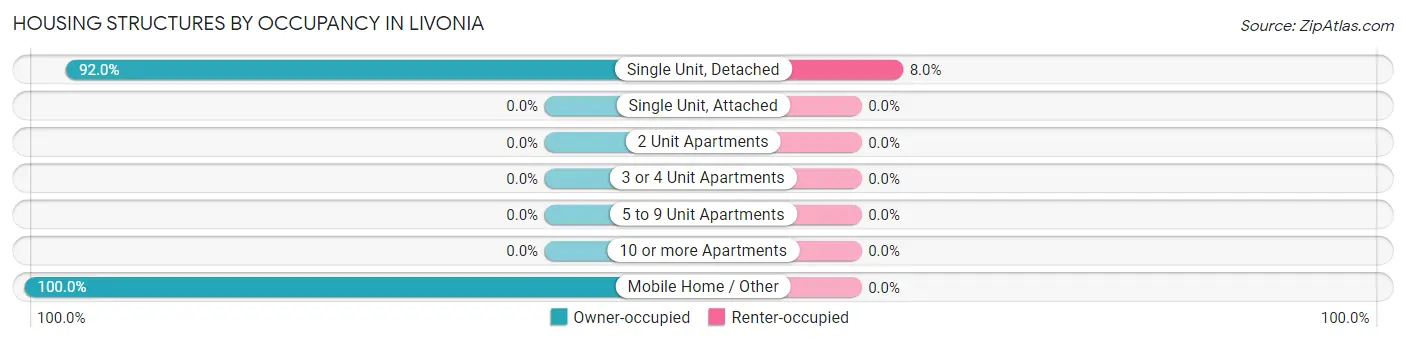
| Structure Type | Owner-occupied | Renter-occupied |
| Single Unit, Detached | 23 (92.0%) | 2 (8.0%) |
| Single Unit, Attached | 0 (0.0%) | 0 (0.0%) |
| 2 Unit Apartments | 0 (0.0%) | 0 (0.0%) |
| 3 or 4 Unit Apartments | 0 (0.0%) | 0 (0.0%) |
| 5 to 9 Unit Apartments | 0 (0.0%) | 0 (0.0%) |
| 10 or more Apartments | 0 (0.0%) | 0 (0.0%) |
| Mobile Home / Other | 3 (100.0%) | 0 (0.0%) |
| Total | 26 (92.9%) | 2 (7.1%) |
Housing Structures by Number of Rooms in Livonia
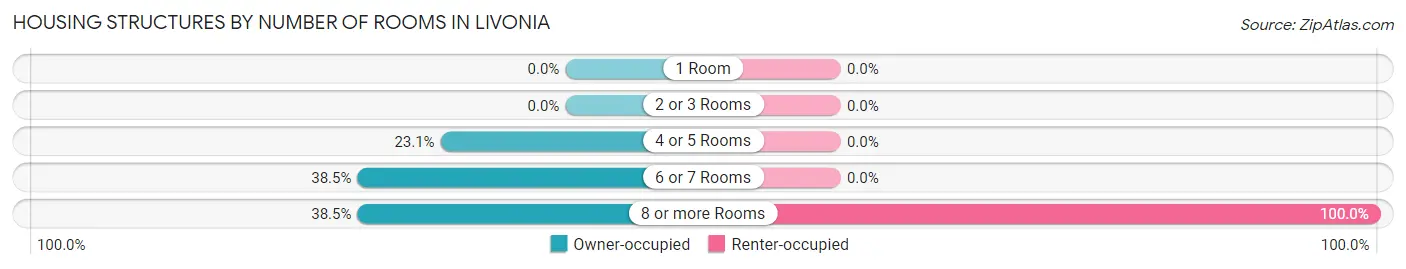
| Number of Rooms | Owner-occupied | Renter-occupied |
| 1 Room | 0 (0.0%) | 0 (0.0%) |
| 2 or 3 Rooms | 0 (0.0%) | 0 (0.0%) |
| 4 or 5 Rooms | 6 (23.1%) | 0 (0.0%) |
| 6 or 7 Rooms | 10 (38.5%) | 0 (0.0%) |
| 8 or more Rooms | 10 (38.5%) | 2 (100.0%) |
| Total | 26 (100.0%) | 2 (100.0%) |
Housing Structure by Heating Type in Livonia
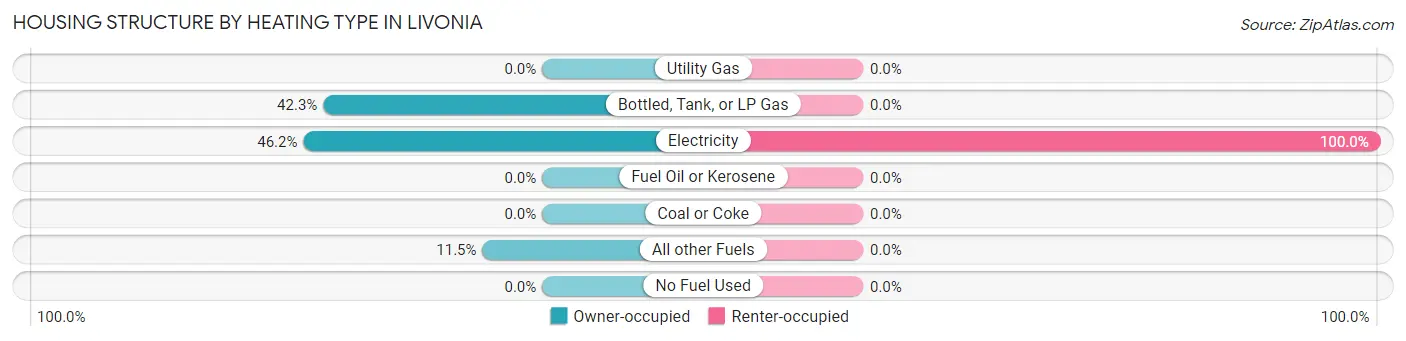
| Heating Type | Owner-occupied | Renter-occupied |
| Utility Gas | 0 (0.0%) | 0 (0.0%) |
| Bottled, Tank, or LP Gas | 11 (42.3%) | 0 (0.0%) |
| Electricity | 12 (46.2%) | 2 (100.0%) |
| Fuel Oil or Kerosene | 0 (0.0%) | 0 (0.0%) |
| Coal or Coke | 0 (0.0%) | 0 (0.0%) |
| All other Fuels | 3 (11.5%) | 0 (0.0%) |
| No Fuel Used | 0 (0.0%) | 0 (0.0%) |
| Total | 26 (100.0%) | 2 (100.0%) |
Household Vehicle Usage in Livonia
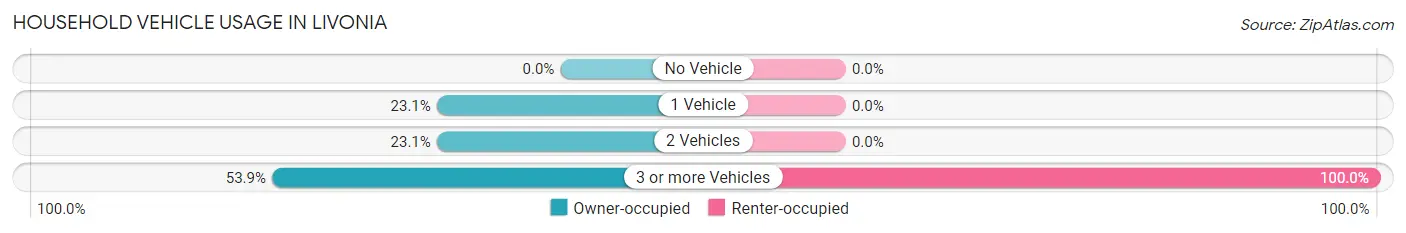
| Vehicles per Household | Owner-occupied | Renter-occupied |
| No Vehicle | 0 (0.0%) | 0 (0.0%) |
| 1 Vehicle | 6 (23.1%) | 0 (0.0%) |
| 2 Vehicles | 6 (23.1%) | 0 (0.0%) |
| 3 or more Vehicles | 14 (53.8%) | 2 (100.0%) |
| Total | 26 (100.0%) | 2 (100.0%) |
Real Estate & Mortgages in Livonia
Real Estate and Mortgage Overview in Livonia
| Characteristic | Without Mortgage | With Mortgage |
| Housing Units | 13 | 13 |
| Median Property Value | $103,100 | $112,500 |
| Median Household Income | - | - |
| Monthly Housing Costs | $650 | $0 |
| Real Estate Taxes | $1,107 | $0 |
Property Value by Mortgage Status in Livonia
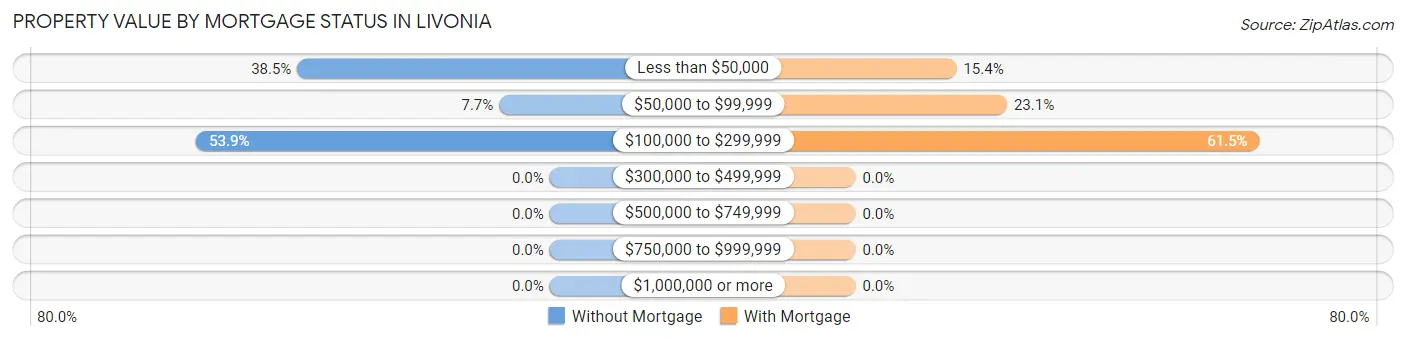
| Property Value | Without Mortgage | With Mortgage |
| Less than $50,000 | 5 (38.5%) | 2 (15.4%) |
| $50,000 to $99,999 | 1 (7.7%) | 3 (23.1%) |
| $100,000 to $299,999 | 7 (53.8%) | 8 (61.5%) |
| $300,000 to $499,999 | 0 (0.0%) | 0 (0.0%) |
| $500,000 to $749,999 | 0 (0.0%) | 0 (0.0%) |
| $750,000 to $999,999 | 0 (0.0%) | 0 (0.0%) |
| $1,000,000 or more | 0 (0.0%) | 0 (0.0%) |
| Total | 13 (100.0%) | 13 (100.0%) |
Household Income by Mortgage Status in Livonia
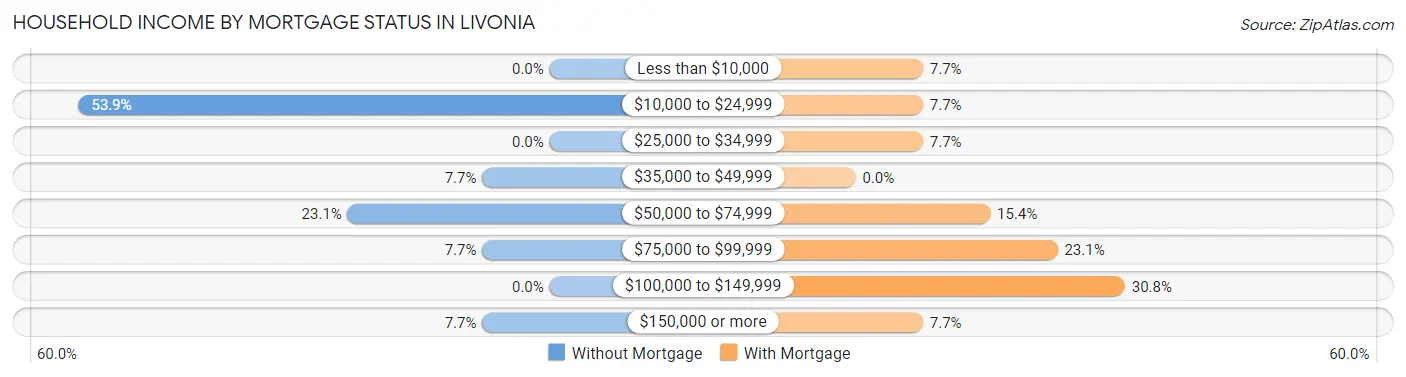
| Household Income | Without Mortgage | With Mortgage |
| Less than $10,000 | 0 (0.0%) | 1 (7.7%) |
| $10,000 to $24,999 | 7 (53.8%) | 1 (7.7%) |
| $25,000 to $34,999 | 0 (0.0%) | 1 (7.7%) |
| $35,000 to $49,999 | 1 (7.7%) | 0 (0.0%) |
| $50,000 to $74,999 | 3 (23.1%) | 2 (15.4%) |
| $75,000 to $99,999 | 1 (7.7%) | 3 (23.1%) |
| $100,000 to $149,999 | 0 (0.0%) | 4 (30.8%) |
| $150,000 or more | 1 (7.7%) | 1 (7.7%) |
| Total | 13 (100.0%) | 13 (100.0%) |
Property Value to Household Income Ratio in Livonia
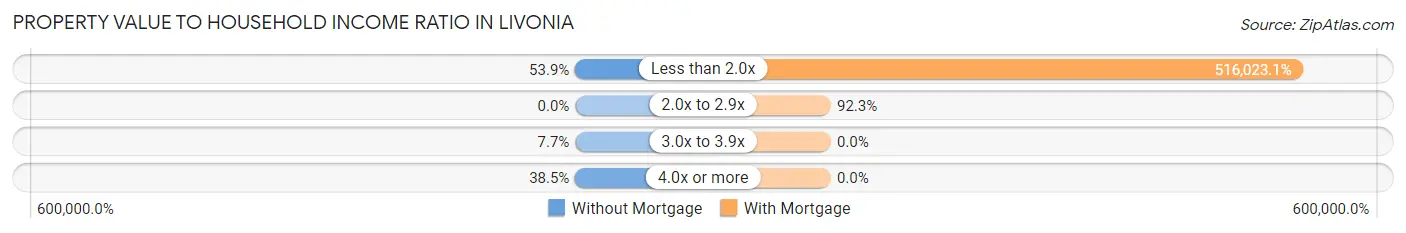
| Value-to-Income Ratio | Without Mortgage | With Mortgage |
| Less than 2.0x | 7 (53.8%) | 67,083 (516,023.1%) |
| 2.0x to 2.9x | 0 (0.0%) | 12 (92.3%) |
| 3.0x to 3.9x | 1 (7.7%) | 0 (0.0%) |
| 4.0x or more | 5 (38.5%) | 0 (0.0%) |
| Total | 13 (100.0%) | 13 (100.0%) |
Real Estate Taxes by Mortgage Status in Livonia
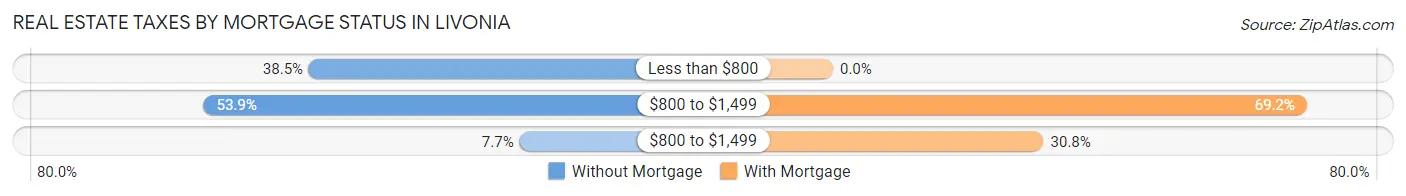
| Property Taxes | Without Mortgage | With Mortgage |
| Less than $800 | 5 (38.5%) | 0 (0.0%) |
| $800 to $1,499 | 7 (53.8%) | 9 (69.2%) |
| $800 to $1,499 | 1 (7.7%) | 4 (30.8%) |
| Total | 13 (100.0%) | 13 (100.0%) |
Health & Disability in Livonia
Health Insurance Coverage by Age in Livonia
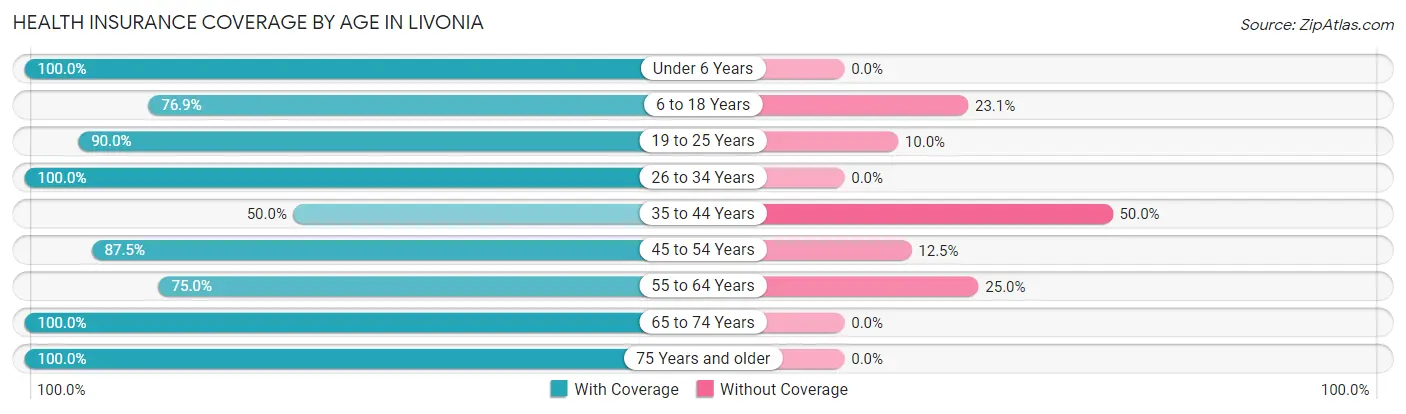
| Age Bracket | With Coverage | Without Coverage |
| Under 6 Years | 6 (100.0%) | 0 (0.0%) |
| 6 to 18 Years | 10 (76.9%) | 3 (23.1%) |
| 19 to 25 Years | 9 (90.0%) | 1 (10.0%) |
| 26 to 34 Years | 10 (100.0%) | 0 (0.0%) |
| 35 to 44 Years | 4 (50.0%) | 4 (50.0%) |
| 45 to 54 Years | 7 (87.5%) | 1 (12.5%) |
| 55 to 64 Years | 3 (75.0%) | 1 (25.0%) |
| 65 to 74 Years | 19 (100.0%) | 0 (0.0%) |
| 75 Years and older | 5 (100.0%) | 0 (0.0%) |
| Total | 73 (87.9%) | 10 (12.0%) |
Health Insurance Coverage by Citizenship Status in Livonia
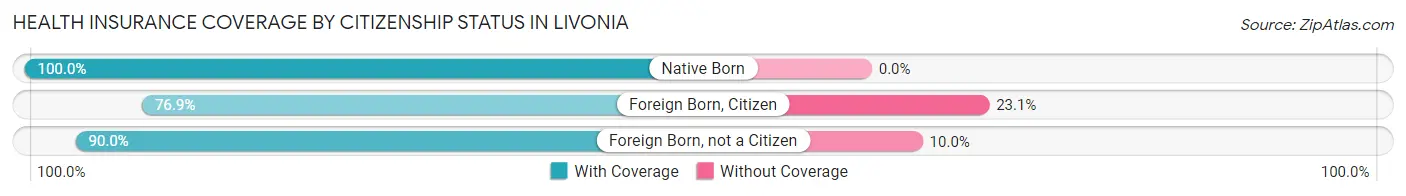
| Citizenship Status | With Coverage | Without Coverage |
| Native Born | 6 (100.0%) | 0 (0.0%) |
| Foreign Born, Citizen | 10 (76.9%) | 3 (23.1%) |
| Foreign Born, not a Citizen | 9 (90.0%) | 1 (10.0%) |
Health Insurance Coverage by Household Income in Livonia
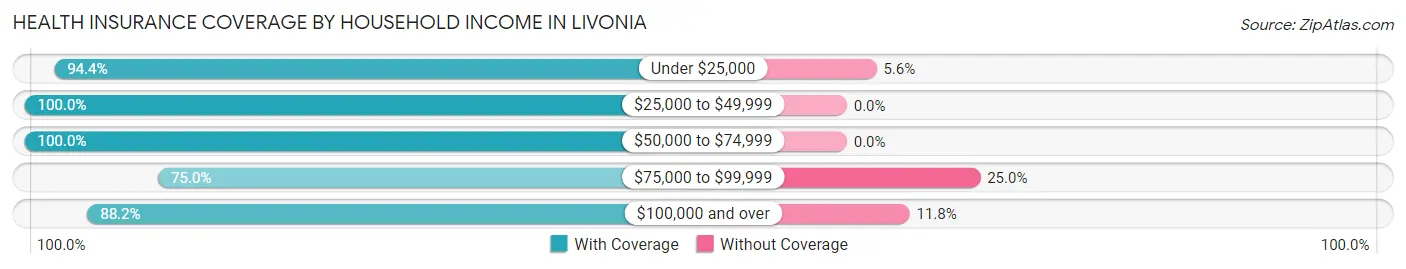
| Household Income | With Coverage | Without Coverage |
| Under $25,000 | 17 (94.4%) | 1 (5.6%) |
| $25,000 to $49,999 | 6 (100.0%) | 0 (0.0%) |
| $50,000 to $74,999 | 14 (100.0%) | 0 (0.0%) |
| $75,000 to $99,999 | 21 (75.0%) | 7 (25.0%) |
| $100,000 and over | 15 (88.2%) | 2 (11.8%) |
Public vs Private Health Insurance Coverage by Age in Livonia
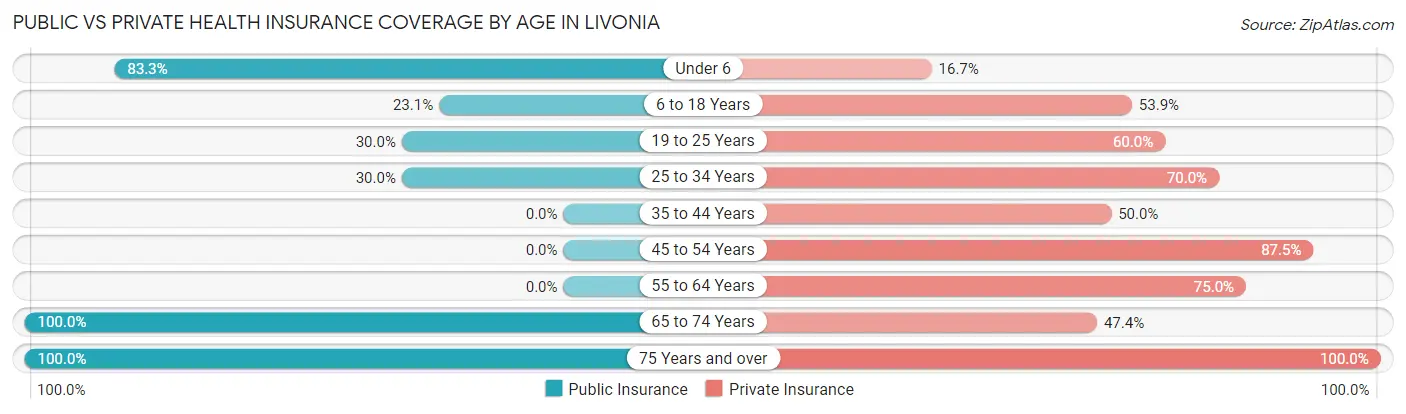
| Age Bracket | Public Insurance | Private Insurance |
| Under 6 | 5 (83.3%) | 1 (16.7%) |
| 6 to 18 Years | 3 (23.1%) | 7 (53.8%) |
| 19 to 25 Years | 3 (30.0%) | 6 (60.0%) |
| 25 to 34 Years | 3 (30.0%) | 7 (70.0%) |
| 35 to 44 Years | 0 (0.0%) | 4 (50.0%) |
| 45 to 54 Years | 0 (0.0%) | 7 (87.5%) |
| 55 to 64 Years | 0 (0.0%) | 3 (75.0%) |
| 65 to 74 Years | 19 (100.0%) | 9 (47.4%) |
| 75 Years and over | 5 (100.0%) | 5 (100.0%) |
| Total | 38 (45.8%) | 49 (59.0%) |
Disability Status by Sex by Age in Livonia
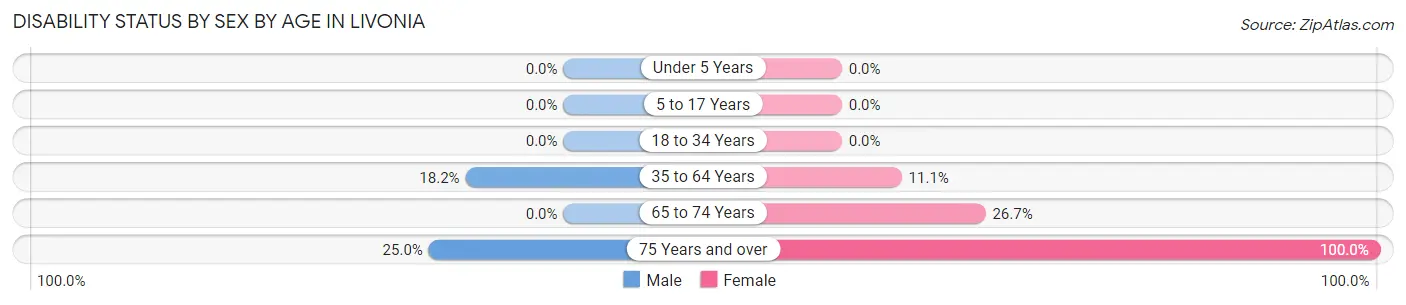
| Age Bracket | Male | Female |
| Under 5 Years | 0 (0.0%) | 0 (0.0%) |
| 5 to 17 Years | 0 (0.0%) | 0 (0.0%) |
| 18 to 34 Years | 0 (0.0%) | 0 (0.0%) |
| 35 to 64 Years | 2 (18.2%) | 1 (11.1%) |
| 65 to 74 Years | 0 (0.0%) | 4 (26.7%) |
| 75 Years and over | 1 (25.0%) | 1 (100.0%) |
Disability Class by Sex by Age in Livonia
Disability Class: Hearing Difficulty
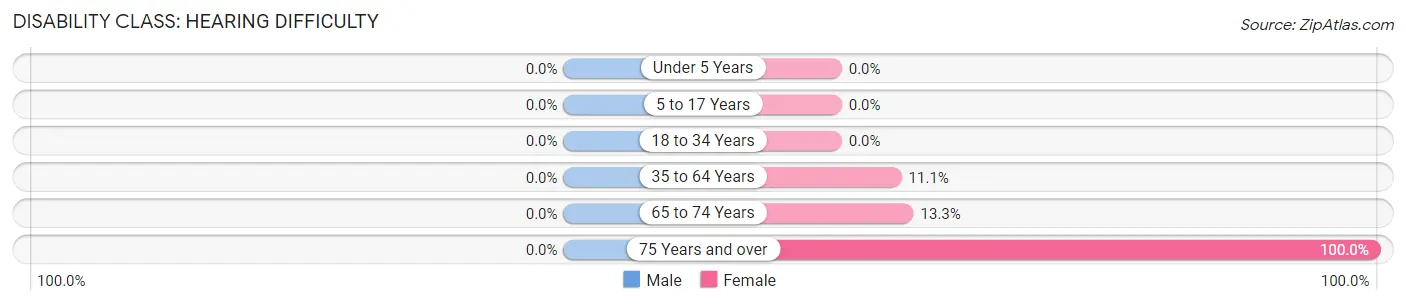
| Age Bracket | Male | Female |
| Under 5 Years | 0 (0.0%) | 0 (0.0%) |
| 5 to 17 Years | 0 (0.0%) | 0 (0.0%) |
| 18 to 34 Years | 0 (0.0%) | 0 (0.0%) |
| 35 to 64 Years | 0 (0.0%) | 1 (11.1%) |
| 65 to 74 Years | 0 (0.0%) | 2 (13.3%) |
| 75 Years and over | 0 (0.0%) | 1 (100.0%) |
Disability Class: Vision Difficulty
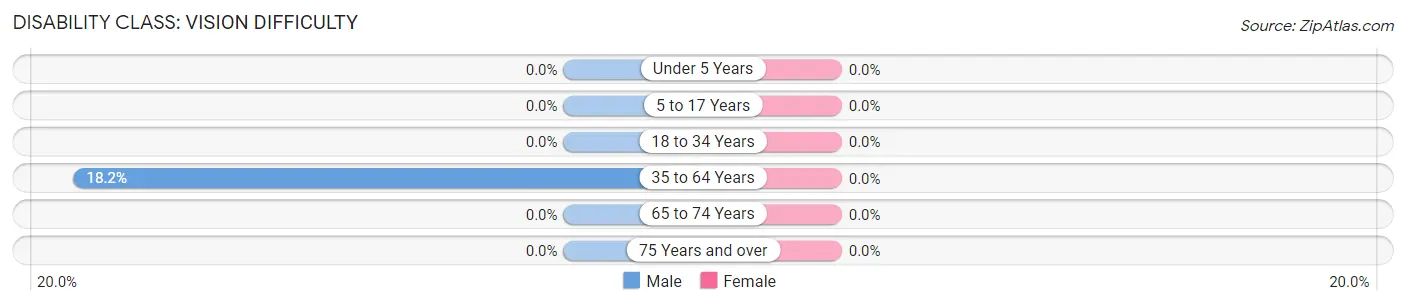
| Age Bracket | Male | Female |
| Under 5 Years | 0 (0.0%) | 0 (0.0%) |
| 5 to 17 Years | 0 (0.0%) | 0 (0.0%) |
| 18 to 34 Years | 0 (0.0%) | 0 (0.0%) |
| 35 to 64 Years | 2 (18.2%) | 0 (0.0%) |
| 65 to 74 Years | 0 (0.0%) | 0 (0.0%) |
| 75 Years and over | 0 (0.0%) | 0 (0.0%) |
Disability Class: Cognitive Difficulty
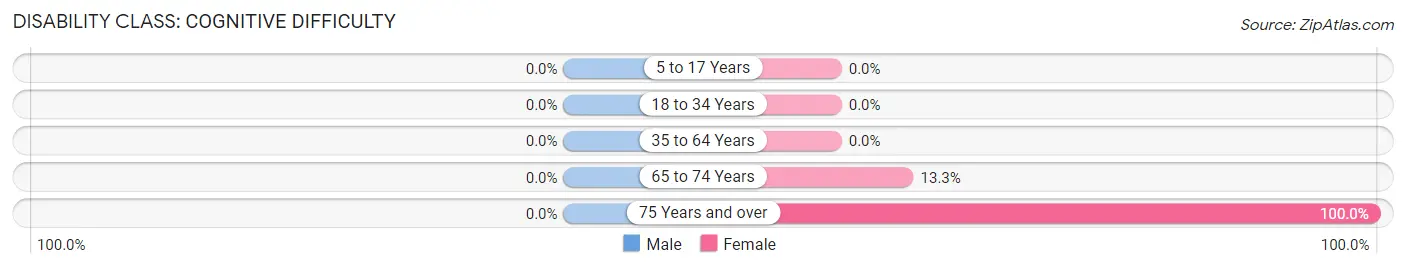
| Age Bracket | Male | Female |
| 5 to 17 Years | 0 (0.0%) | 0 (0.0%) |
| 18 to 34 Years | 0 (0.0%) | 0 (0.0%) |
| 35 to 64 Years | 0 (0.0%) | 0 (0.0%) |
| 65 to 74 Years | 0 (0.0%) | 2 (13.3%) |
| 75 Years and over | 0 (0.0%) | 1 (100.0%) |
Disability Class: Ambulatory Difficulty
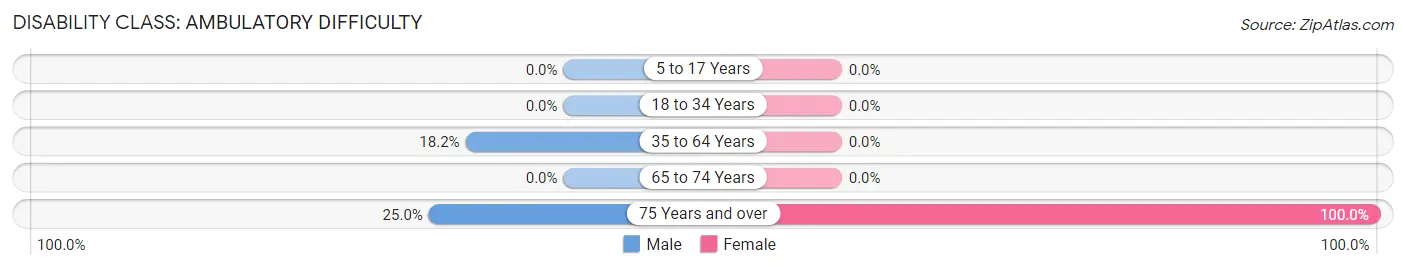
| Age Bracket | Male | Female |
| 5 to 17 Years | 0 (0.0%) | 0 (0.0%) |
| 18 to 34 Years | 0 (0.0%) | 0 (0.0%) |
| 35 to 64 Years | 2 (18.2%) | 0 (0.0%) |
| 65 to 74 Years | 0 (0.0%) | 0 (0.0%) |
| 75 Years and over | 1 (25.0%) | 1 (100.0%) |
Disability Class: Self-Care Difficulty
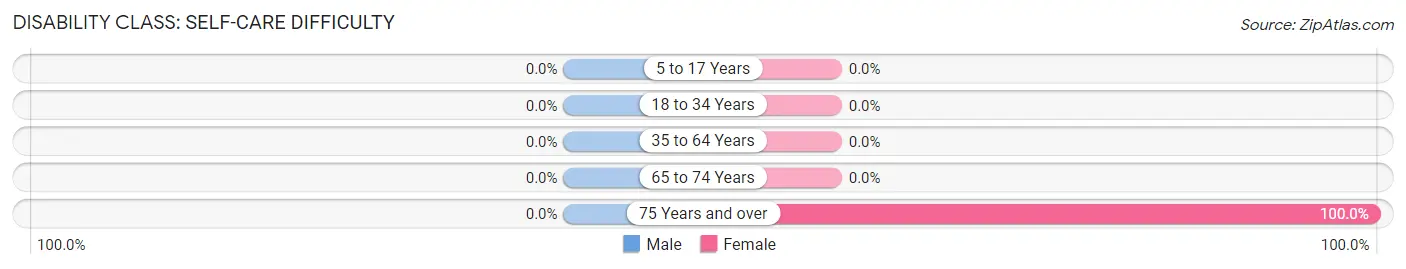
| Age Bracket | Male | Female |
| 5 to 17 Years | 0 (0.0%) | 0 (0.0%) |
| 18 to 34 Years | 0 (0.0%) | 0 (0.0%) |
| 35 to 64 Years | 0 (0.0%) | 0 (0.0%) |
| 65 to 74 Years | 0 (0.0%) | 0 (0.0%) |
| 75 Years and over | 0 (0.0%) | 1 (100.0%) |
Technology Access in Livonia
Computing Device Access in Livonia
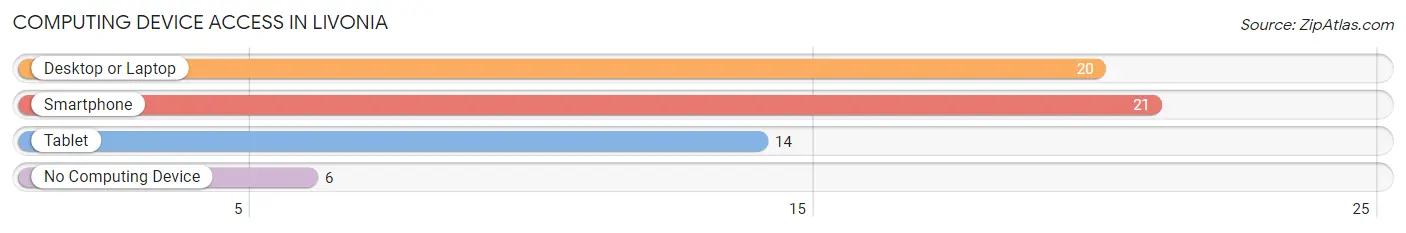
| Device Type | # Households | % Households |
| Desktop or Laptop | 20 | 71.4% |
| Smartphone | 21 | 75.0% |
| Tablet | 14 | 50.0% |
| No Computing Device | 6 | 21.4% |
| Total | 28 | 100.0% |
Internet Access in Livonia
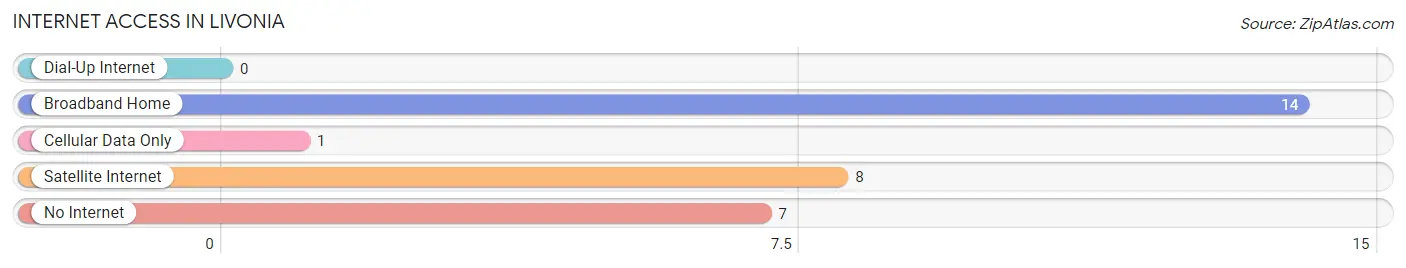
| Internet Type | # Households | % Households |
| Dial-Up Internet | 0 | 0.0% |
| Broadband Home | 14 | 50.0% |
| Cellular Data Only | 1 | 3.6% |
| Satellite Internet | 8 | 28.6% |
| No Internet | 7 | 25.0% |
| Total | 28 | 100.0% |
Livonia Summary
Livonia, Indiana is a small town located in Washington County, Indiana. It is situated in the southwestern part of the state, approximately 30 miles from the state capital of Indianapolis. The town has a population of approximately 1,000 people and is part of the larger metropolitan area of Louisville, Kentucky.
History
Livonia was founded in 1837 by a group of settlers from Kentucky. The town was named after the city of Livonia, Michigan, which was named after the ancient city of Livonia in Latvia. The town was originally a farming community, but it soon developed into a small industrial center. The first industry in Livonia was a sawmill, which was built in 1845. The sawmill was followed by a gristmill, a woolen mill, and a brickyard.
In the late 19th century, Livonia began to experience a period of growth and prosperity. The town was connected to the Louisville and Nashville Railroad in 1883, which allowed for the transportation of goods and people to and from the town. This connection to the railroad also allowed for the development of a number of businesses in the town, including a furniture factory, a canning factory, and a flour mill.
Geography
Livonia is located in the southwestern part of Indiana, approximately 30 miles from the state capital of Indianapolis. The town is situated in the rolling hills of the Ohio River Valley. The town is bordered by the towns of Salem, New Pekin, and Washington. The town is also located near the Wabash River, which provides a scenic backdrop for the town.
The climate in Livonia is generally mild, with temperatures ranging from the mid-30s in the winter to the mid-80s in the summer. The town receives an average of 40 inches of precipitation per year, with most of the precipitation occurring in the spring and summer months.
Economy
The economy of Livonia is largely based on agriculture and manufacturing. The town is home to a number of small businesses, including a furniture factory, a canning factory, and a flour mill. The town also has a number of retail stores, including a grocery store, a hardware store, and a pharmacy.
The town is also home to a number of small farms, which produce a variety of crops, including corn, soybeans, and wheat. Livonia is also home to a number of wineries, which produce a variety of wines.
Demographics
As of the 2010 census, the population of Livonia was 1,000 people. The town is predominantly white, with approximately 95% of the population being white. The town also has a small Hispanic population, with approximately 4% of the population being Hispanic. The median household income in Livonia is approximately $45,000, and the median home value is approximately $100,000.
Conclusion
Livonia, Indiana is a small town located in Washington County, Indiana. It is situated in the southwestern part of the state, approximately 30 miles from the state capital of Indianapolis. The town has a population of approximately 1,000 people and is part of the larger metropolitan area of Louisville, Kentucky. The town was founded in 1837 by a group of settlers from Kentucky and has since developed into a small industrial center. The economy of Livonia is largely based on agriculture and manufacturing, and the town is home to a number of small businesses, farms, and wineries. The population of Livonia is predominantly white, with approximately 95% of the population being white. The median household income in Livonia is approximately $45,000, and the median home value is approximately $100,000.
Common Questions
What is Per Capita Income in Livonia?
Per Capita income in Livonia is $30,501.
What is the Median Family Income in Livonia?
Median Family Income in Livonia is $50,833.
What is the Median Household income in Livonia?
Median Household Income in Livonia is $61,250.
What is Income or Wage Gap in Livonia?
Income or Wage Gap in Livonia is 60.0%.
Women in Livonia earn 40.0 cents for every dollar earned by a man.
What is Inequality or Gini Index in Livonia?
Inequality or Gini Index in Livonia is 0.44.
What is the Total Population of Livonia?
Total Population of Livonia is 83.
What is the Total Male Population of Livonia?
Total Male Population of Livonia is 35.
What is the Total Female Population of Livonia?
Total Female Population of Livonia is 48.
What is the Ratio of Males per 100 Females in Livonia?
There are 72.92 Males per 100 Females in Livonia.
What is the Ratio of Females per 100 Males in Livonia?
There are 137.14 Females per 100 Males in Livonia.
What is the Median Population Age in Livonia?
Median Population Age in Livonia is 43.1 Years.
What is the Average Family Size in Livonia
Average Family Size in Livonia is 3.0 People.
What is the Average Household Size in Livonia
Average Household Size in Livonia is 3.0 People.
How Large is the Labor Force in Livonia?
There are 45 People in the Labor Forcein in Livonia.
What is the Percentage of People in the Labor Force in Livonia?
64.3% of People are in the Labor Force in Livonia.