Linton, IN Map & Demographics
Linton Map
Linton Overview
$24,062
PER CAPITA INCOME
$49,868
AVG FAMILY INCOME
$38,438
AVG HOUSEHOLD INCOME
38.0%
WAGE / INCOME GAP [ % ]
62.0¢/ $1
WAGE / INCOME GAP [ $ ]
0.45
INEQUALITY / GINI INDEX
5,149
TOTAL POPULATION
2,459
MALE POPULATION
2,690
FEMALE POPULATION
91.41
MALES / 100 FEMALES
109.39
FEMALES / 100 MALES
39.5
MEDIAN AGE
2.8
AVG FAMILY SIZE
2.2
AVG HOUSEHOLD SIZE
2,465
LABOR FORCE [ PEOPLE ]
57.6%
PERCENT IN LABOR FORCE
10.0%
UNEMPLOYMENT RATE
Linton Zip Codes
Linton Area Codes
Income in Linton
Income Overview in Linton
Per Capita Income in Linton is $24,062, while median incomes of families and households are $49,868 and $38,438 respectively.
| Characteristic | Number | Measure |
| Per Capita Income | 5,149 | $24,062 |
| Median Family Income | 1,414 | $49,868 |
| Mean Family Income | 1,414 | $60,317 |
| Median Household Income | 2,331 | $38,438 |
| Mean Household Income | 2,331 | $52,677 |
| Income Deficit | 1,414 | $0 |
| Wage / Income Gap (%) | 5,149 | 38.02% |
| Wage / Income Gap ($) | 5,149 | 61.98¢ per $1 |
| Gini / Inequality Index | 5,149 | 0.45 |
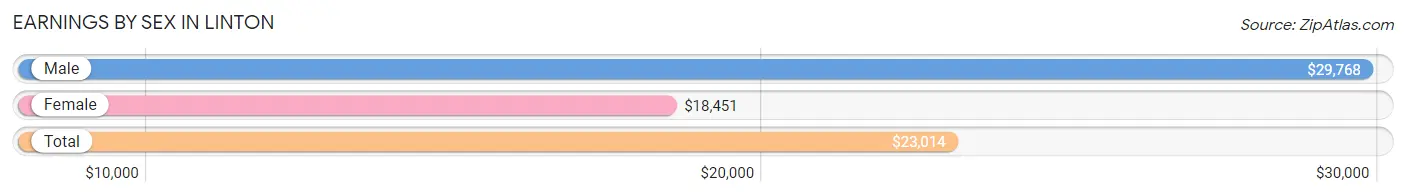
Earnings by Sex in Linton
Average Earnings in Linton are $23,014, $29,768 for men and $18,451 for women, a difference of 38.0%.
| Sex | Number | Average Earnings |
| Male | 1,340 (49.2%) | $29,768 |
| Female | 1,381 (50.7%) | $18,451 |
| Total | 2,721 (100.0%) | $23,014 |
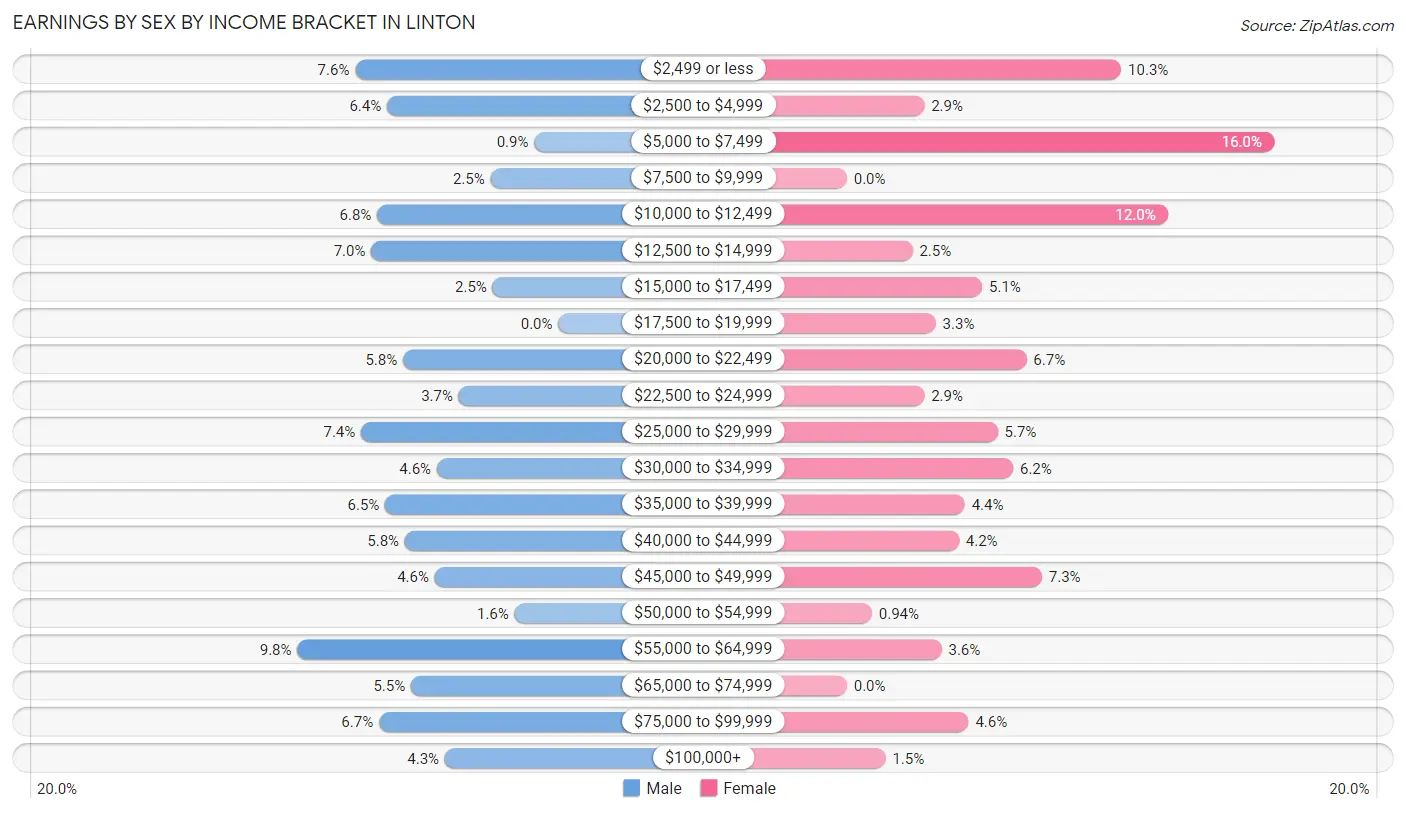
Earnings by Sex by Income Bracket in Linton
The most common earnings brackets in Linton are $55,000 to $64,999 for men (131 | 9.8%) and $5,000 to $7,499 for women (221 | 16.0%).
| Income | Male | Female |
| $2,499 or less | 102 (7.6%) | 142 (10.3%) |
| $2,500 to $4,999 | 86 (6.4%) | 40 (2.9%) |
| $5,000 to $7,499 | 12 (0.9%) | 221 (16.0%) |
| $7,500 to $9,999 | 34 (2.5%) | 0 (0.0%) |
| $10,000 to $12,499 | 91 (6.8%) | 166 (12.0%) |
| $12,500 to $14,999 | 94 (7.0%) | 34 (2.5%) |
| $15,000 to $17,499 | 33 (2.5%) | 70 (5.1%) |
| $17,500 to $19,999 | 0 (0.0%) | 46 (3.3%) |
| $20,000 to $22,499 | 78 (5.8%) | 93 (6.7%) |
| $22,500 to $24,999 | 50 (3.7%) | 40 (2.9%) |
| $25,000 to $29,999 | 99 (7.4%) | 78 (5.7%) |
| $30,000 to $34,999 | 61 (4.5%) | 86 (6.2%) |
| $35,000 to $39,999 | 87 (6.5%) | 61 (4.4%) |
| $40,000 to $44,999 | 77 (5.8%) | 58 (4.2%) |
| $45,000 to $49,999 | 62 (4.6%) | 101 (7.3%) |
| $50,000 to $54,999 | 22 (1.6%) | 13 (0.9%) |
| $55,000 to $64,999 | 131 (9.8%) | 49 (3.5%) |
| $65,000 to $74,999 | 74 (5.5%) | 0 (0.0%) |
| $75,000 to $99,999 | 90 (6.7%) | 63 (4.6%) |
| $100,000+ | 57 (4.3%) | 20 (1.5%) |
| Total | 1,340 (100.0%) | 1,381 (100.0%) |
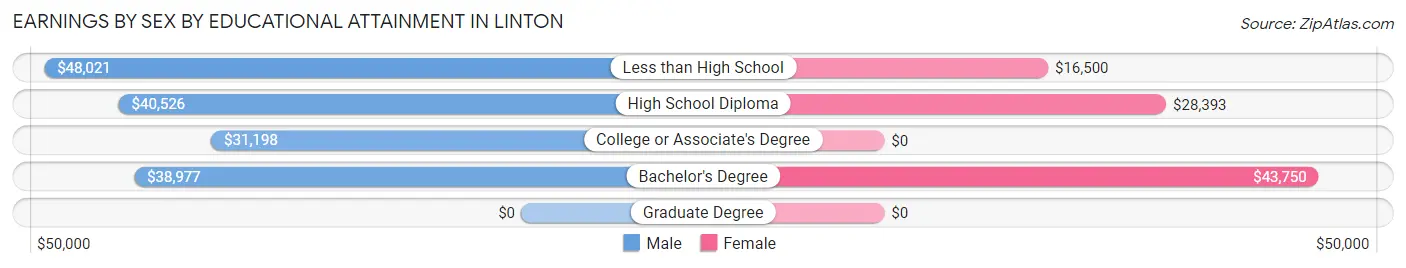
Earnings by Sex by Educational Attainment in Linton
Average earnings in Linton are $39,464 for men and $16,995 for women, a difference of 56.9%. Men with an educational attainment of less than high school enjoy the highest average annual earnings of $48,021, while those with college or associate's degree education earn the least with $31,198. Women with an educational attainment of bachelor's degree earn the most with the average annual earnings of $43,750, while those with less than high school education have the smallest earnings of $16,500.
| Educational Attainment | Male Income | Female Income |
| Less than High School | $48,021 | $16,500 |
| High School Diploma | $40,526 | $28,393 |
| College or Associate's Degree | $31,198 | $0 |
| Bachelor's Degree | $38,977 | $43,750 |
| Graduate Degree | - | - |
| Total | $39,464 | $16,995 |
Family Income in Linton
Family Income Brackets in Linton
According to the Linton family income data, there are 286 families falling into the $50,000 to $74,999 income range, which is the most common income bracket and makes up 20.2% of all families. Conversely, the $10,000 to $14,999 income bracket is the least frequent group with only 7 families (0.5%) belonging to this category.
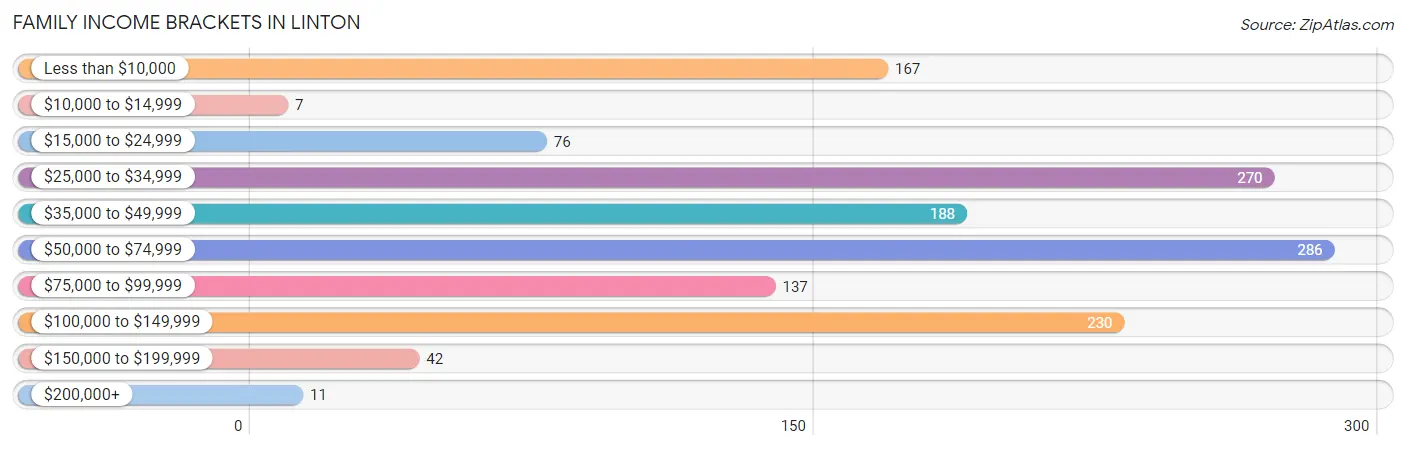
| Income Bracket | # Families | % Families |
| Less than $10,000 | 167 | 11.8% |
| $10,000 to $14,999 | 7 | 0.5% |
| $15,000 to $24,999 | 76 | 5.4% |
| $25,000 to $34,999 | 270 | 19.1% |
| $35,000 to $49,999 | 188 | 13.3% |
| $50,000 to $74,999 | 286 | 20.2% |
| $75,000 to $99,999 | 137 | 9.7% |
| $100,000 to $149,999 | 230 | 16.3% |
| $150,000 to $199,999 | 42 | 3.0% |
| $200,000+ | 11 | 0.8% |
Family Income by Famaliy Size in Linton
4-person families (185 | 13.1%) account for the highest median family income in Linton with $98,482 per family, while 3-person families (144 | 10.2%) have the highest median income of $29,254 per family member.
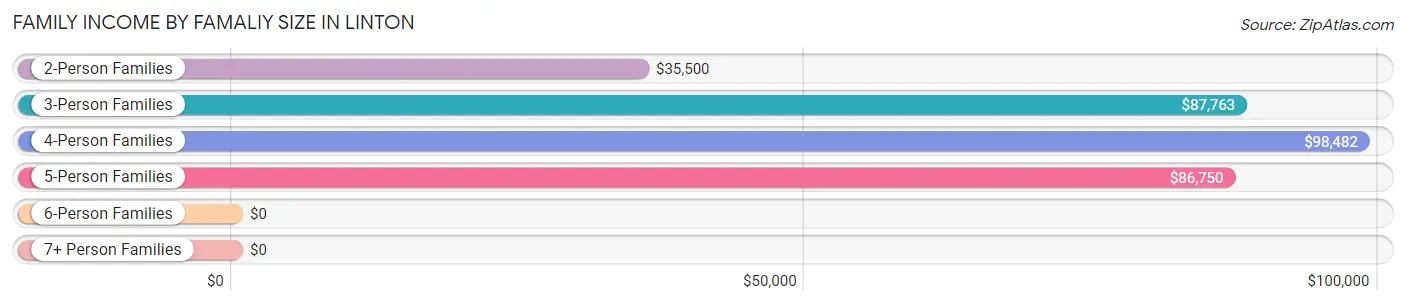
| Income Bracket | # Families | Median Income |
| 2-Person Families | 952 (67.3%) | $35,500 |
| 3-Person Families | 144 (10.2%) | $87,763 |
| 4-Person Families | 185 (13.1%) | $98,482 |
| 5-Person Families | 107 (7.6%) | $86,750 |
| 6-Person Families | 25 (1.8%) | $0 |
| 7+ Person Families | 1 (0.1%) | $0 |
| Total | 1,414 (100.0%) | $49,868 |
Family Income by Number of Earners in Linton
The median family income in Linton is $49,868, with families comprising 3+ earners (107) having the highest median family income of $105,750, while families with 1 earner (482) have the lowest median family income of $31,713, accounting for 7.6% and 34.1% of families, respectively.
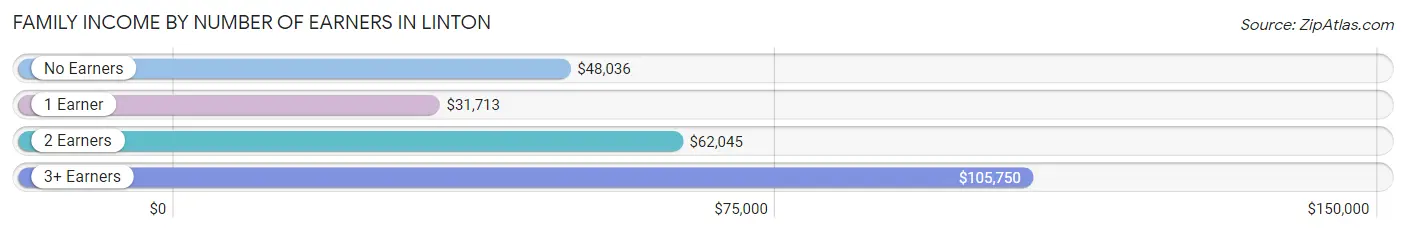
| Number of Earners | # Families | Median Income |
| No Earners | 227 (16.1%) | $48,036 |
| 1 Earner | 482 (34.1%) | $31,713 |
| 2 Earners | 598 (42.3%) | $62,045 |
| 3+ Earners | 107 (7.6%) | $105,750 |
| Total | 1,414 (100.0%) | $49,868 |
Household Income in Linton
Household Income Brackets in Linton
With 434 households falling in the category, the $25,000 to $34,999 income range is the most frequent in Linton, accounting for 18.6% of all households. In contrast, only 28 households (1.2%) fall into the $200,000+ income bracket, making it the least populous group.
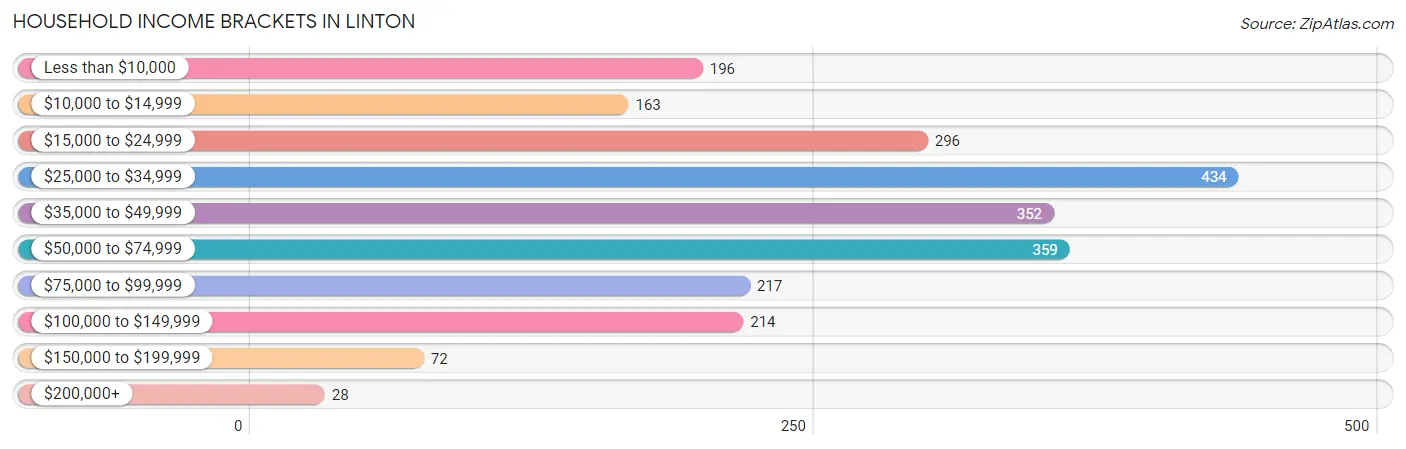
| Income Bracket | # Households | % Households |
| Less than $10,000 | 196 | 8.4% |
| $10,000 to $14,999 | 163 | 7.0% |
| $15,000 to $24,999 | 296 | 12.7% |
| $25,000 to $34,999 | 434 | 18.6% |
| $35,000 to $49,999 | 352 | 15.1% |
| $50,000 to $74,999 | 359 | 15.4% |
| $75,000 to $99,999 | 217 | 9.3% |
| $100,000 to $149,999 | 214 | 9.2% |
| $150,000 to $199,999 | 72 | 3.1% |
| $200,000+ | 28 | 1.2% |
Household Income by Householder Age in Linton
The median household income in Linton is $38,438, with the highest median household income of $43,911 found in the 25 to 44 years age bracket for the primary householder. A total of 651 households (27.9%) fall into this category. Meanwhile, the 15 to 24 years age bracket for the primary householder has the lowest median household income of $0, with 182 households (7.8%) in this group.
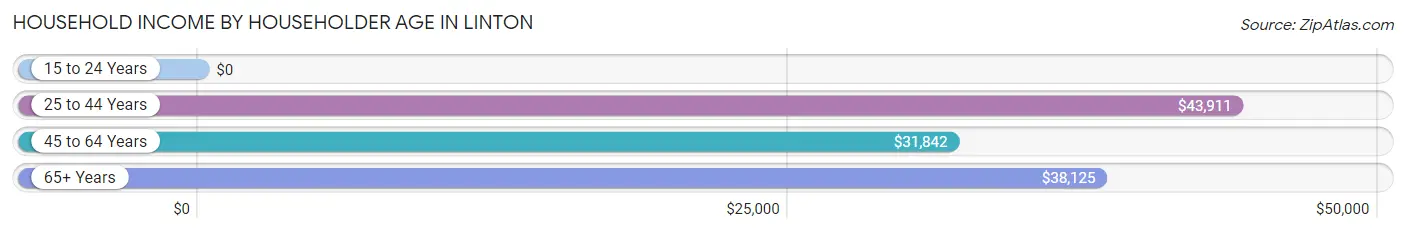
| Income Bracket | # Households | Median Income |
| 15 to 24 Years | 182 (7.8%) | $0 |
| 25 to 44 Years | 651 (27.9%) | $43,911 |
| 45 to 64 Years | 718 (30.8%) | $31,842 |
| 65+ Years | 780 (33.5%) | $38,125 |
| Total | 2,331 (100.0%) | $38,438 |
Poverty in Linton
Income Below Poverty by Sex and Age in Linton
With 19.4% poverty level for males and 17.2% for females among the residents of Linton, 6 to 11 year old males and 45 to 54 year old females are the most vulnerable to poverty, with 86 males (41.9%) and 164 females (50.3%) in their respective age groups living below the poverty level.
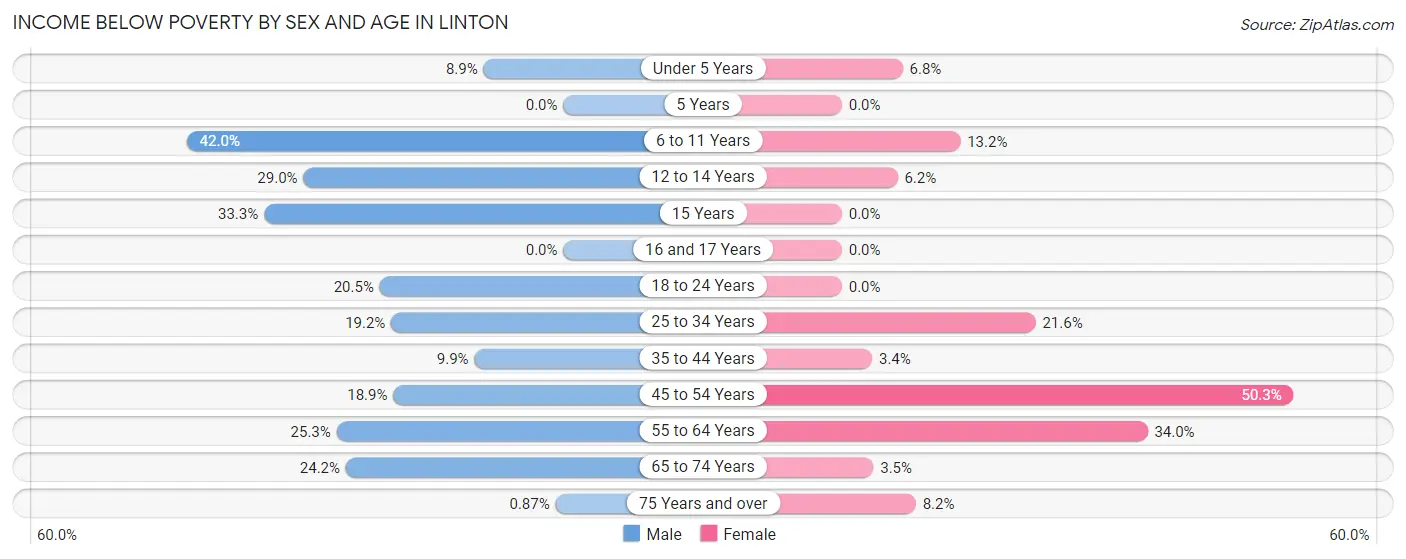
| Age Bracket | Male | Female |
| Under 5 Years | 8 (8.9%) | 9 (6.8%) |
| 5 Years | 0 (0.0%) | 0 (0.0%) |
| 6 to 11 Years | 86 (41.9%) | 19 (13.2%) |
| 12 to 14 Years | 22 (28.9%) | 8 (6.2%) |
| 15 Years | 12 (33.3%) | 0 (0.0%) |
| 16 and 17 Years | 0 (0.0%) | 0 (0.0%) |
| 18 to 24 Years | 73 (20.4%) | 0 (0.0%) |
| 25 to 34 Years | 51 (19.2%) | 121 (21.6%) |
| 35 to 44 Years | 31 (9.9%) | 9 (3.4%) |
| 45 to 54 Years | 43 (18.9%) | 164 (50.3%) |
| 55 to 64 Years | 75 (25.3%) | 96 (34.0%) |
| 65 to 74 Years | 70 (24.2%) | 13 (3.5%) |
| 75 Years and over | 2 (0.9%) | 19 (8.2%) |
| Total | 473 (19.4%) | 458 (17.2%) |
Income Above Poverty by Sex and Age in Linton
According to the poverty statistics in Linton, males aged 5 years and females aged 5 years are the age groups that are most secure financially, with 100.0% of males and 100.0% of females in these age groups living above the poverty line.
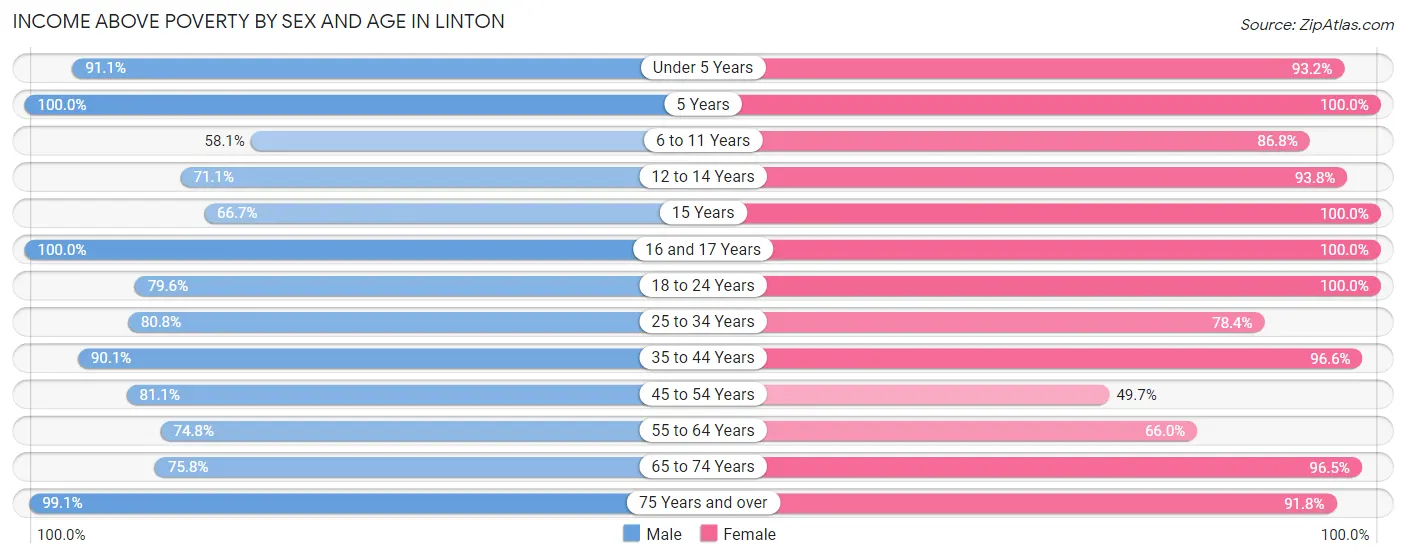
| Age Bracket | Male | Female |
| Under 5 Years | 82 (91.1%) | 124 (93.2%) |
| 5 Years | 11 (100.0%) | 12 (100.0%) |
| 6 to 11 Years | 119 (58.1%) | 125 (86.8%) |
| 12 to 14 Years | 54 (71.1%) | 121 (93.8%) |
| 15 Years | 24 (66.7%) | 25 (100.0%) |
| 16 and 17 Years | 38 (100.0%) | 46 (100.0%) |
| 18 to 24 Years | 284 (79.5%) | 143 (100.0%) |
| 25 to 34 Years | 215 (80.8%) | 440 (78.4%) |
| 35 to 44 Years | 282 (90.1%) | 258 (96.6%) |
| 45 to 54 Years | 184 (81.1%) | 162 (49.7%) |
| 55 to 64 Years | 222 (74.8%) | 186 (66.0%) |
| 65 to 74 Years | 219 (75.8%) | 357 (96.5%) |
| 75 Years and over | 229 (99.1%) | 212 (91.8%) |
| Total | 1,963 (80.6%) | 2,211 (82.8%) |
Income Below Poverty Among Married-Couple Families in Linton
The poverty statistics for married-couple families in Linton show that 4.0% or 36 of the total 898 families live below the poverty line. Families with 3 or 4 children have the highest poverty rate of 17.8%, comprising of 16 families. On the other hand, families with no children have the lowest poverty rate of 1.7%, which includes 11 families.
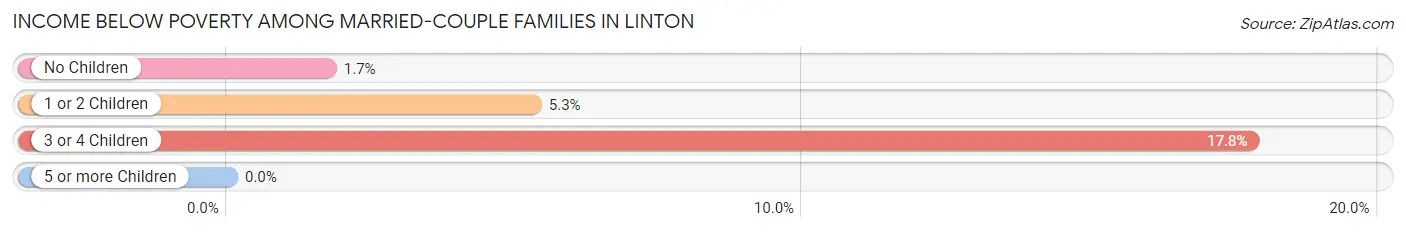
| Children | Above Poverty | Below Poverty |
| No Children | 627 (98.3%) | 11 (1.7%) |
| 1 or 2 Children | 161 (94.7%) | 9 (5.3%) |
| 3 or 4 Children | 74 (82.2%) | 16 (17.8%) |
| 5 or more Children | 0 (0.0%) | 0 (0.0%) |
| Total | 862 (96.0%) | 36 (4.0%) |
Income Below Poverty Among Single-Parent Households in Linton
According to the poverty data in Linton, 30.3% or 54 single-father households and 47.6% or 161 single-mother households are living below the poverty line. Among single-father households, those with no children have the highest poverty rate, with 54 households (42.9%) experiencing poverty. Likewise, among single-mother households, those with 1 or 2 children have the highest poverty rate, with 107 households (53.5%) falling below the poverty line.
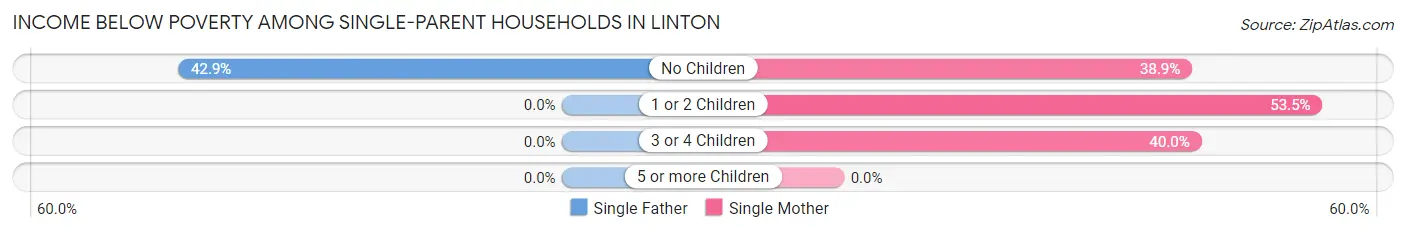
| Children | Single Father | Single Mother |
| No Children | 54 (42.9%) | 44 (38.9%) |
| 1 or 2 Children | 0 (0.0%) | 107 (53.5%) |
| 3 or 4 Children | 0 (0.0%) | 10 (40.0%) |
| 5 or more Children | 0 (0.0%) | 0 (0.0%) |
| Total | 54 (30.3%) | 161 (47.6%) |
Income Below Poverty Among Married-Couple vs Single-Parent Households in Linton
The poverty data for Linton shows that 36 of the married-couple family households (4.0%) and 215 of the single-parent households (41.7%) are living below the poverty level. Within the married-couple family households, those with 3 or 4 children have the highest poverty rate, with 16 households (17.8%) falling below the poverty line. Among the single-parent households, those with 1 or 2 children have the highest poverty rate, with 107 household (42.5%) living below poverty.
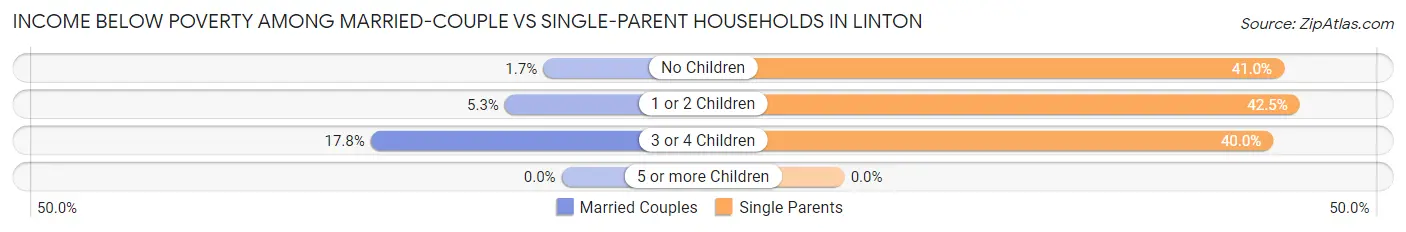
| Children | Married-Couple Families | Single-Parent Households |
| No Children | 11 (1.7%) | 98 (41.0%) |
| 1 or 2 Children | 9 (5.3%) | 107 (42.5%) |
| 3 or 4 Children | 16 (17.8%) | 10 (40.0%) |
| 5 or more Children | 0 (0.0%) | 0 (0.0%) |
| Total | 36 (4.0%) | 215 (41.7%) |
Race in Linton
The most populous races in Linton are White / Caucasian (4,903 | 95.2%), Hispanic or Latino (320 | 6.2%), and Two or more Races (123 | 2.4%).
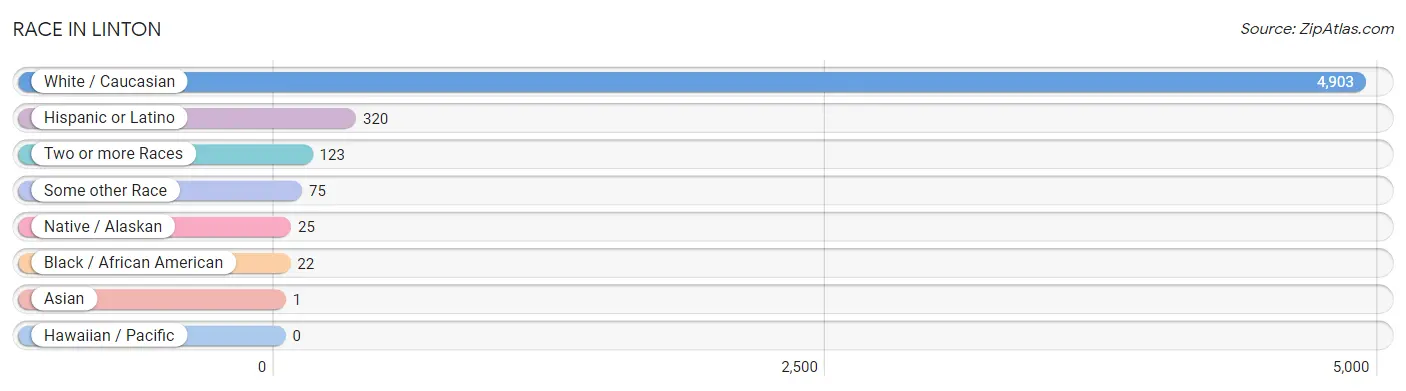
| Race | # Population | % Population |
| Asian | 1 | 0.0% |
| Black / African American | 22 | 0.4% |
| Hawaiian / Pacific | 0 | 0.0% |
| Hispanic or Latino | 320 | 6.2% |
| Native / Alaskan | 25 | 0.5% |
| White / Caucasian | 4,903 | 95.2% |
| Two or more Races | 123 | 2.4% |
| Some other Race | 75 | 1.5% |
| Total | 5,149 | 100.0% |
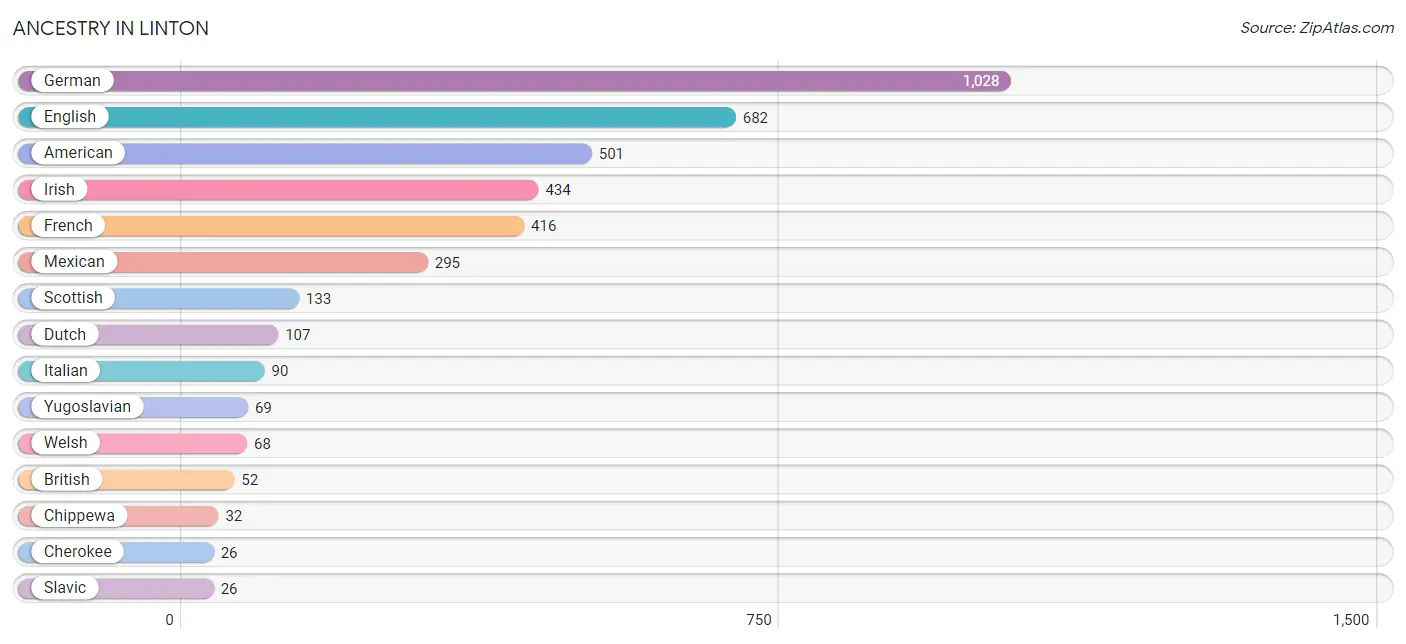
Ancestry in Linton
The most populous ancestries reported in Linton are German (1,028 | 20.0%), English (682 | 13.3%), American (501 | 9.7%), Irish (434 | 8.4%), and French (416 | 8.1%), together accounting for 59.5% of all Linton residents.
| Ancestry | # Population | % Population |
| American | 501 | 9.7% |
| British | 52 | 1.0% |
| Central American | 25 | 0.5% |
| Central American Indian | 25 | 0.5% |
| Cherokee | 26 | 0.5% |
| Chippewa | 32 | 0.6% |
| Danish | 8 | 0.2% |
| Dutch | 107 | 2.1% |
| English | 682 | 13.3% |
| European | 25 | 0.5% |
| French | 416 | 8.1% |
| German | 1,028 | 20.0% |
| Guatemalan | 25 | 0.5% |
| Hungarian | 7 | 0.1% |
| Indian (Asian) | 1 | 0.0% |
| Irish | 434 | 8.4% |
| Italian | 90 | 1.8% |
| Korean | 15 | 0.3% |
| Mexican | 295 | 5.7% |
| Polish | 15 | 0.3% |
| Scotch-Irish | 13 | 0.3% |
| Scottish | 133 | 2.6% |
| Slavic | 26 | 0.5% |
| Welsh | 68 | 1.3% |
| Yugoslavian | 69 | 1.3% | View All 25 Rows |
Immigrants in Linton
The most numerous immigrant groups reported in Linton came from Latin America (168 | 3.3%), Central America (167 | 3.2%), Mexico (139 | 2.7%), Guatemala (28 | 0.5%), and Caribbean (1 | 0.0%), together accounting for 9.8% of all Linton residents.
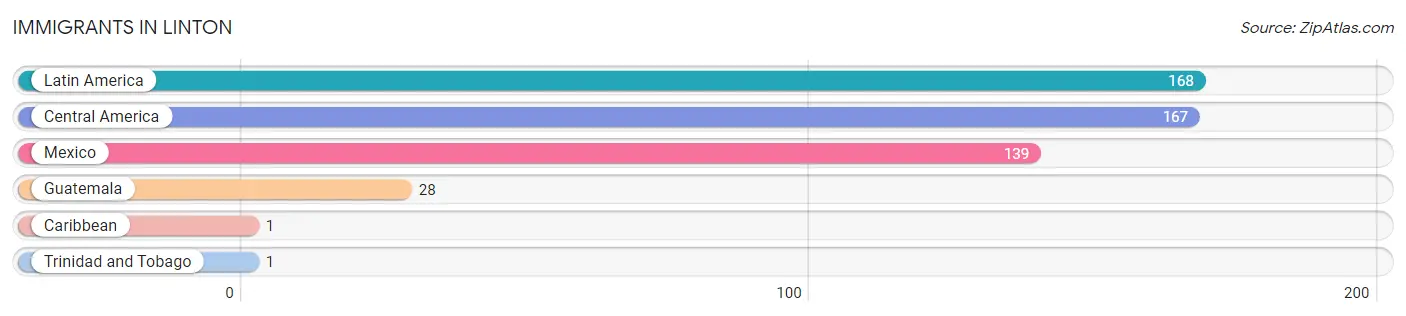
| Immigration Origin | # Population | % Population |
| Caribbean | 1 | 0.0% |
| Central America | 167 | 3.2% |
| Guatemala | 28 | 0.5% |
| Latin America | 168 | 3.3% |
| Mexico | 139 | 2.7% |
| Trinidad and Tobago | 1 | 0.0% | View All 6 Rows |
Sex and Age in Linton
Sex and Age in Linton
The most populous age groups in Linton are 20 to 24 Years (267 | 10.9%) for men and 25 to 29 Years (337 | 12.5%) for women.
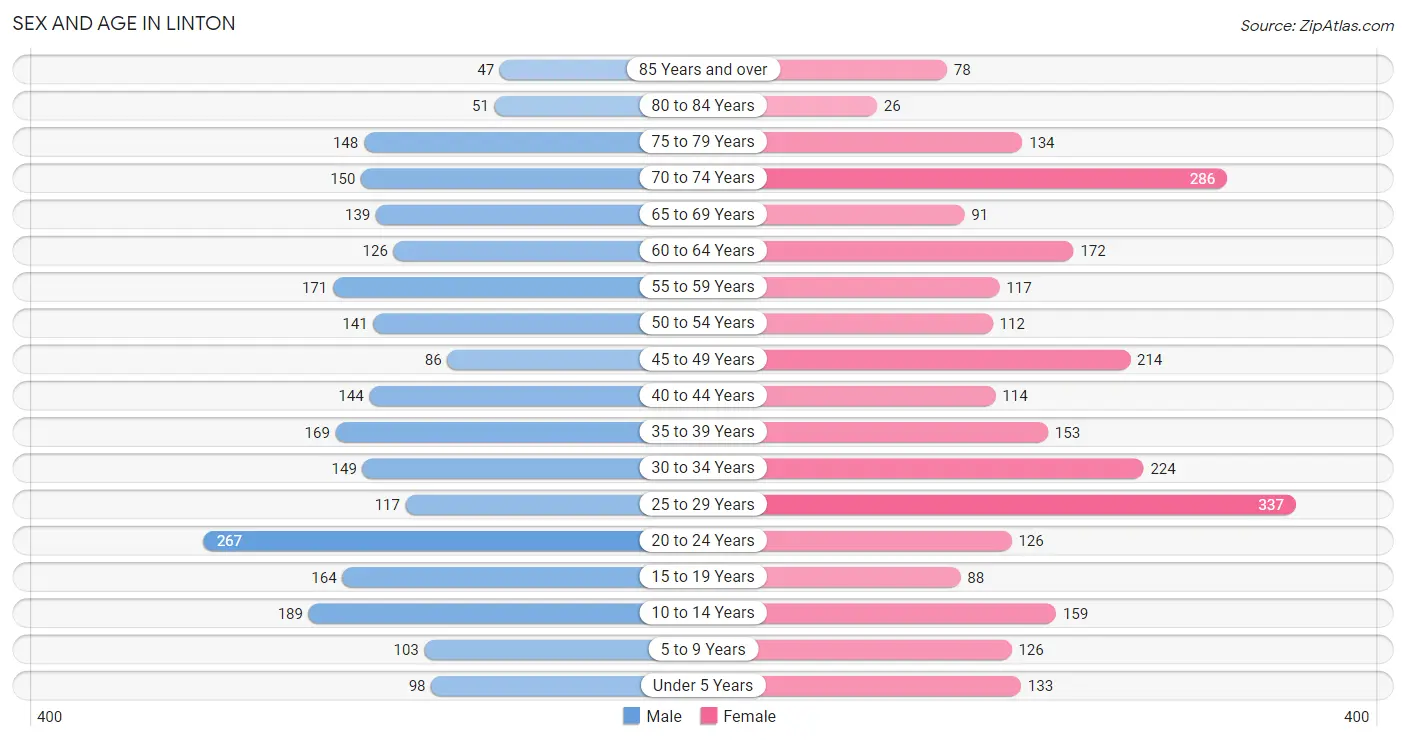
| Age Bracket | Male | Female |
| Under 5 Years | 98 (4.0%) | 133 (4.9%) |
| 5 to 9 Years | 103 (4.2%) | 126 (4.7%) |
| 10 to 14 Years | 189 (7.7%) | 159 (5.9%) |
| 15 to 19 Years | 164 (6.7%) | 88 (3.3%) |
| 20 to 24 Years | 267 (10.9%) | 126 (4.7%) |
| 25 to 29 Years | 117 (4.8%) | 337 (12.5%) |
| 30 to 34 Years | 149 (6.1%) | 224 (8.3%) |
| 35 to 39 Years | 169 (6.9%) | 153 (5.7%) |
| 40 to 44 Years | 144 (5.9%) | 114 (4.2%) |
| 45 to 49 Years | 86 (3.5%) | 214 (8.0%) |
| 50 to 54 Years | 141 (5.7%) | 112 (4.2%) |
| 55 to 59 Years | 171 (7.0%) | 117 (4.3%) |
| 60 to 64 Years | 126 (5.1%) | 172 (6.4%) |
| 65 to 69 Years | 139 (5.7%) | 91 (3.4%) |
| 70 to 74 Years | 150 (6.1%) | 286 (10.6%) |
| 75 to 79 Years | 148 (6.0%) | 134 (5.0%) |
| 80 to 84 Years | 51 (2.1%) | 26 (1.0%) |
| 85 Years and over | 47 (1.9%) | 78 (2.9%) |
| Total | 2,459 (100.0%) | 2,690 (100.0%) |
Families and Households in Linton
Median Family Size in Linton
The median family size in Linton is 2.77 persons per family, with married-couple families (898 | 63.5%) accounting for the largest median family size of 2.92 persons per family. On the other hand, single female/mother families (338 | 23.9%) represent the smallest median family size with 2.49 persons per family.
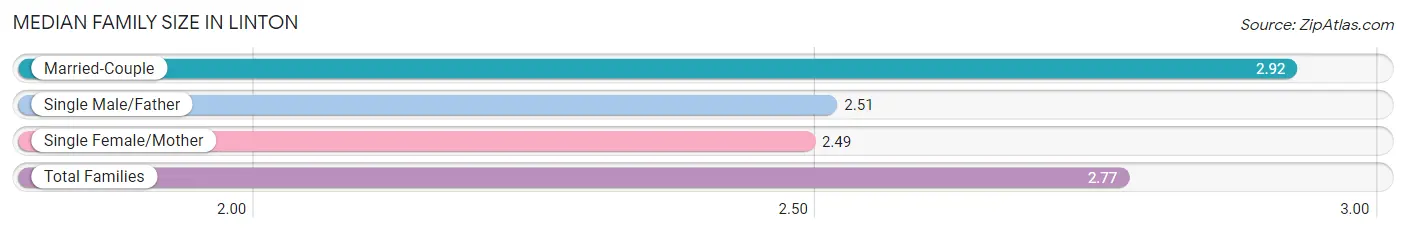
| Family Type | # Families | Family Size |
| Married-Couple | 898 (63.5%) | 2.92 |
| Single Male/Father | 178 (12.6%) | 2.51 |
| Single Female/Mother | 338 (23.9%) | 2.49 |
| Total Families | 1,414 (100.0%) | 2.77 |
Median Household Size in Linton
The median household size in Linton is 2.19 persons per household, with married-couple households (898 | 38.5%) accounting for the largest median household size of 2.99 persons per household. non-family households (917 | 39.3%) represent the smallest median household size with 1.13 persons per household.
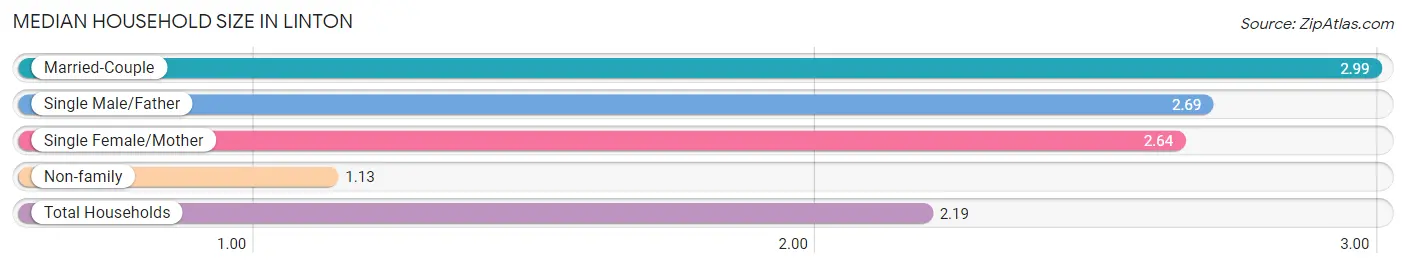
| Household Type | # Households | Household Size |
| Married-Couple | 898 (38.5%) | 2.99 |
| Single Male/Father | 178 (7.6%) | 2.69 |
| Single Female/Mother | 338 (14.5%) | 2.64 |
| Non-family | 917 (39.3%) | 1.13 |
| Total Households | 2,331 (100.0%) | 2.19 |
Household Size by Marriage Status in Linton
Out of a total of 2,331 households in Linton, 1,414 (60.7%) are family households, while 917 (39.3%) are nonfamily households. The most numerous type of family households are 2-person households, comprising 921, and the most common type of nonfamily households are 1-person households, comprising 786.
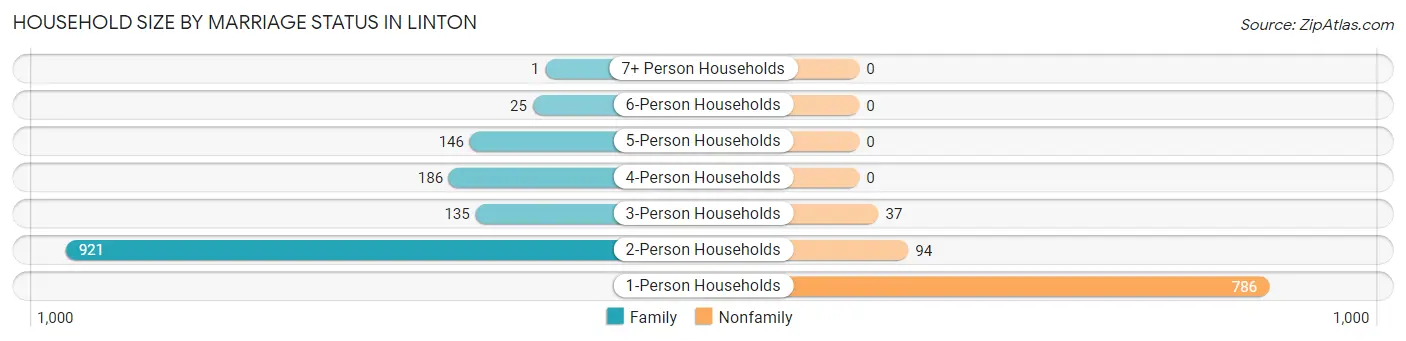
| Household Size | Family Households | Nonfamily Households |
| 1-Person Households | - | 786 (33.7%) |
| 2-Person Households | 921 (39.5%) | 94 (4.0%) |
| 3-Person Households | 135 (5.8%) | 37 (1.6%) |
| 4-Person Households | 186 (8.0%) | 0 (0.0%) |
| 5-Person Households | 146 (6.3%) | 0 (0.0%) |
| 6-Person Households | 25 (1.1%) | 0 (0.0%) |
| 7+ Person Households | 1 (0.0%) | 0 (0.0%) |
| Total | 1,414 (60.7%) | 917 (39.3%) |
Female Fertility in Linton
Fertility by Age in Linton
Average fertility rate in Linton is 25.0 births per 1,000 women. Women in the age bracket of 15 to 19 years have the highest fertility rate with 68.0 births per 1,000 women. Women in the age bracket of 35 to 50 years acount for 51.5% of all women with births.
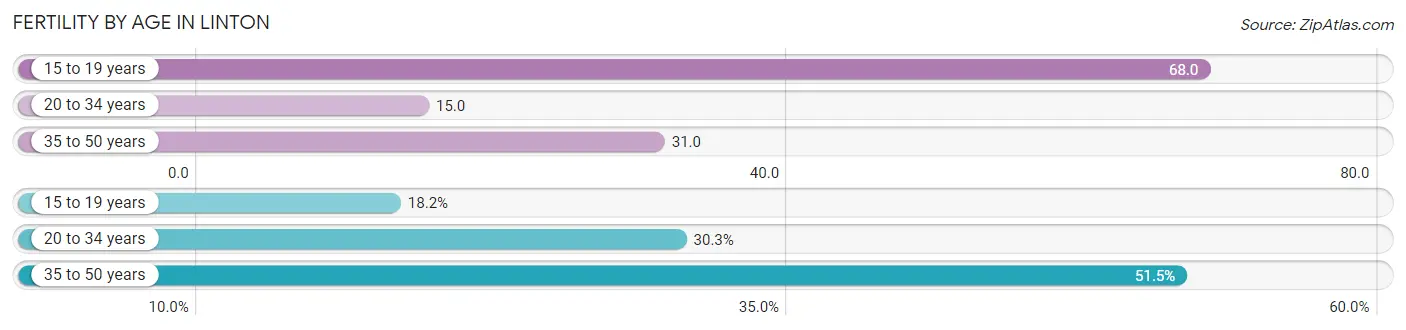
| Age Bracket | Women with Births | Births / 1,000 Women |
| 15 to 19 years | 6 (18.2%) | 68.0 |
| 20 to 34 years | 10 (30.3%) | 15.0 |
| 35 to 50 years | 17 (51.5%) | 31.0 |
| Total | 33 (100.0%) | 25.0 |
Fertility by Age by Marriage Status in Linton
51.5% of women with births (33) in Linton are married. The highest percentage of unmarried women with births falls into 15 to 19 years age bracket with 100.0% of them unmarried at the time of birth, while the lowest percentage of unmarried women with births belong to 35 to 50 years age bracket with 0.0% of them unmarried.
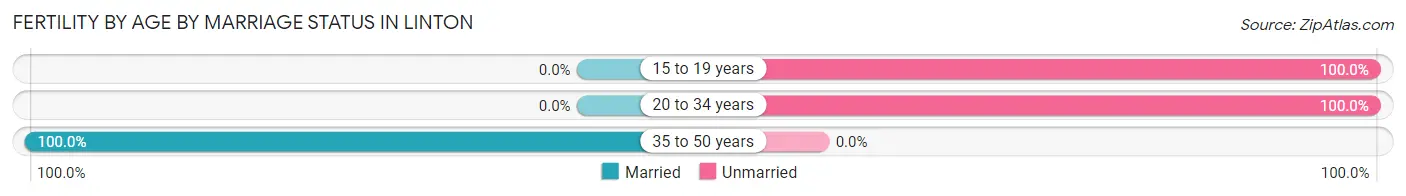
| Age Bracket | Married | Unmarried |
| 15 to 19 years | 0 (0.0%) | 6 (100.0%) |
| 20 to 34 years | 0 (0.0%) | 10 (100.0%) |
| 35 to 50 years | 17 (100.0%) | 0 (0.0%) |
| Total | 17 (51.5%) | 16 (48.5%) |
Fertility by Education in Linton
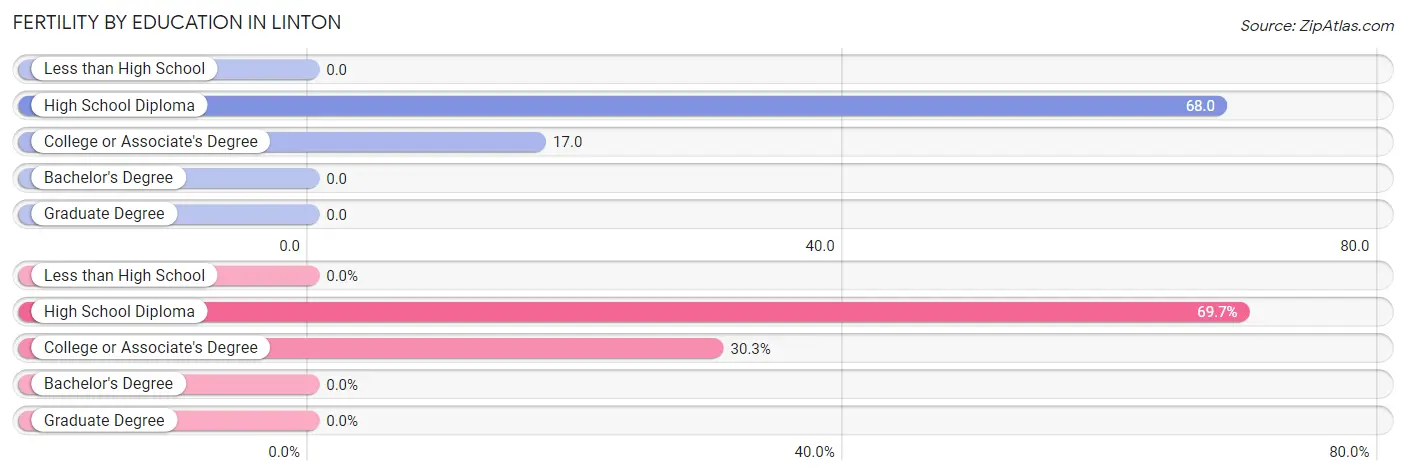
| Educational Attainment | Women with Births | Births / 1,000 Women |
| Less than High School | 0 (0.0%) | 0.0 |
| High School Diploma | 23 (69.7%) | 68.0 |
| College or Associate's Degree | 10 (30.3%) | 17.0 |
| Bachelor's Degree | 0 (0.0%) | 0.0 |
| Graduate Degree | 0 (0.0%) | 0.0 |
| Total | 33 (100.0%) | 25.0 |
Fertility by Education by Marriage Status in Linton
48.5% of women with births in Linton are unmarried. Women with the educational attainment of high school diploma are most likely to be married with 73.9% of them married at childbirth, while women with the educational attainment of college or associate's degree are least likely to be married with 100.0% of them unmarried at childbirth.
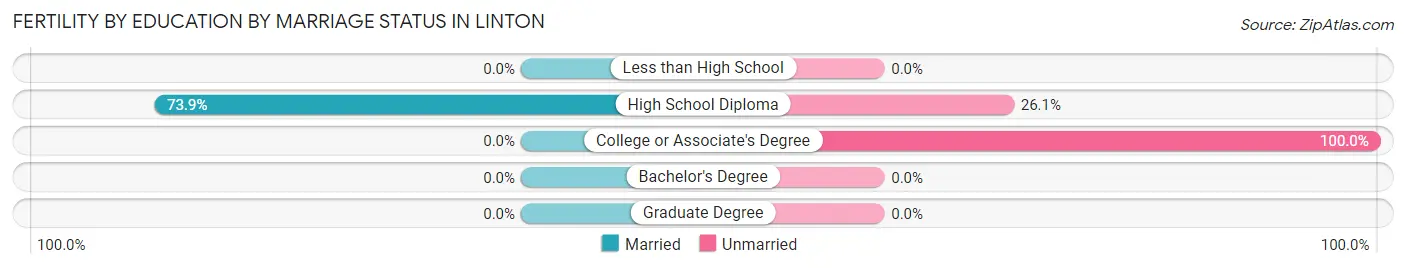
| Educational Attainment | Married | Unmarried |
| Less than High School | 0 (0.0%) | 0 (0.0%) |
| High School Diploma | 17 (73.9%) | 6 (26.1%) |
| College or Associate's Degree | 0 (0.0%) | 10 (100.0%) |
| Bachelor's Degree | 0 (0.0%) | 0 (0.0%) |
| Graduate Degree | 0 (0.0%) | 0 (0.0%) |
| Total | 17 (51.5%) | 16 (48.5%) |
Employment Characteristics in Linton
Employment by Class of Employer in Linton
Among the 2,097 employed individuals in Linton, private company employees (1,641 | 78.2%), not-for-profit organizations (157 | 7.5%), and self-employed (incorporated) (88 | 4.2%) make up the most common classes of employment.
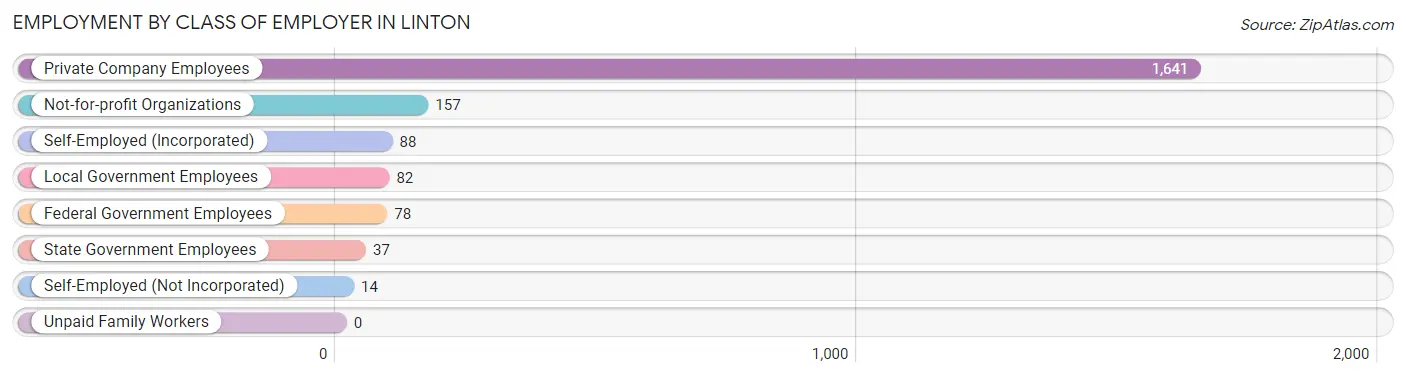
| Employer Class | # Employees | % Employees |
| Private Company Employees | 1,641 | 78.2% |
| Self-Employed (Incorporated) | 88 | 4.2% |
| Self-Employed (Not Incorporated) | 14 | 0.7% |
| Not-for-profit Organizations | 157 | 7.5% |
| Local Government Employees | 82 | 3.9% |
| State Government Employees | 37 | 1.8% |
| Federal Government Employees | 78 | 3.7% |
| Unpaid Family Workers | 0 | 0.0% |
| Total | 2,097 | 100.0% |
Employment Status by Age in Linton
According to the labor force statistics for Linton, out of the total population over 16 years of age (4,280), 57.6% or 2,465 individuals are in the labor force, with 10.0% or 246 of them unemployed. The age group with the highest labor force participation rate is 30 to 34 years, with 96.2% or 359 individuals in the labor force. Within the labor force, the 20 to 24 years age range has the highest percentage of unemployed individuals, with 35.3% or 116 of them being unemployed.
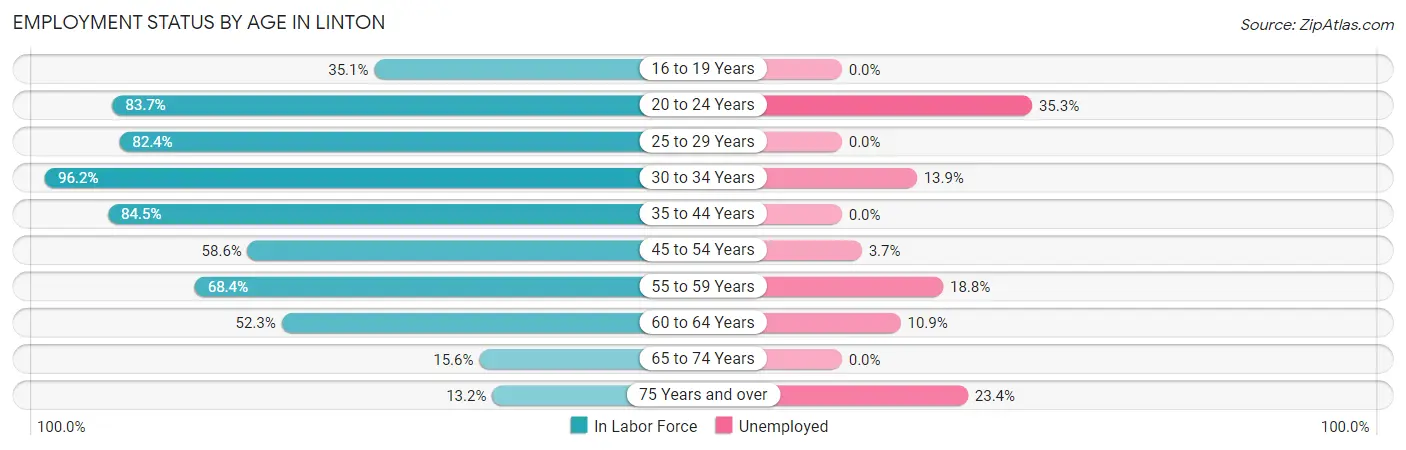
| Age Bracket | In Labor Force | Unemployed |
| 16 to 19 Years | 67 (35.1%) | 0 (0.0%) |
| 20 to 24 Years | 329 (83.7%) | 116 (35.3%) |
| 25 to 29 Years | 374 (82.4%) | 0 (0.0%) |
| 30 to 34 Years | 359 (96.2%) | 50 (13.9%) |
| 35 to 44 Years | 490 (84.5%) | 0 (0.0%) |
| 45 to 54 Years | 324 (58.6%) | 12 (3.7%) |
| 55 to 59 Years | 197 (68.4%) | 37 (18.8%) |
| 60 to 64 Years | 156 (52.3%) | 17 (10.9%) |
| 65 to 74 Years | 104 (15.6%) | 0 (0.0%) |
| 75 Years and over | 64 (13.2%) | 15 (23.4%) |
| Total | 2,465 (57.6%) | 246 (10.0%) |
Employment Status by Educational Attainment in Linton
According to labor force statistics for Linton, 74.6% of individuals (1,899) out of the total population between 25 and 64 years of age (2,546) are in the labor force, with 6.1% or 116 of them being unemployed. The group with the highest labor force participation rate are those with the educational attainment of bachelor's degree or higher, with 91.5% or 421 individuals in the labor force. Within the labor force, individuals with less than high school education have the highest percentage of unemployment, with 9.8% or 25 of them being unemployed.
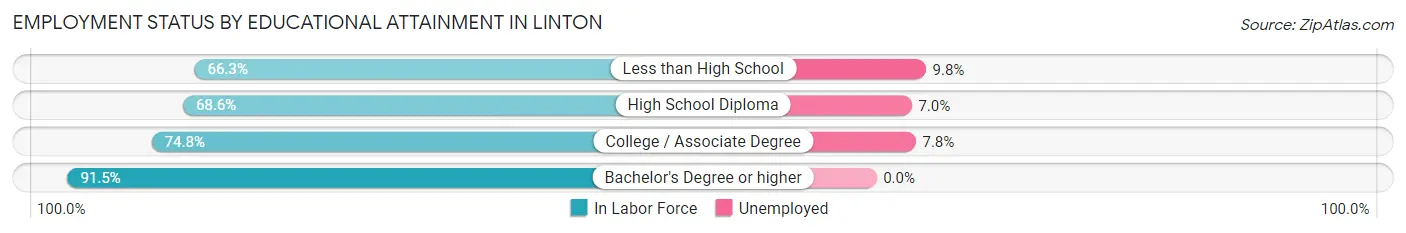
| Educational Attainment | In Labor Force | Unemployed |
| Less than High School | 256 (66.3%) | 38 (9.8%) |
| High School Diploma | 532 (68.6%) | 54 (7.0%) |
| College / Associate Degree | 691 (74.8%) | 72 (7.8%) |
| Bachelor's Degree or higher | 421 (91.5%) | 0 (0.0%) |
| Total | 1,899 (74.6%) | 155 (6.1%) |
Employment Occupations by Sex in Linton
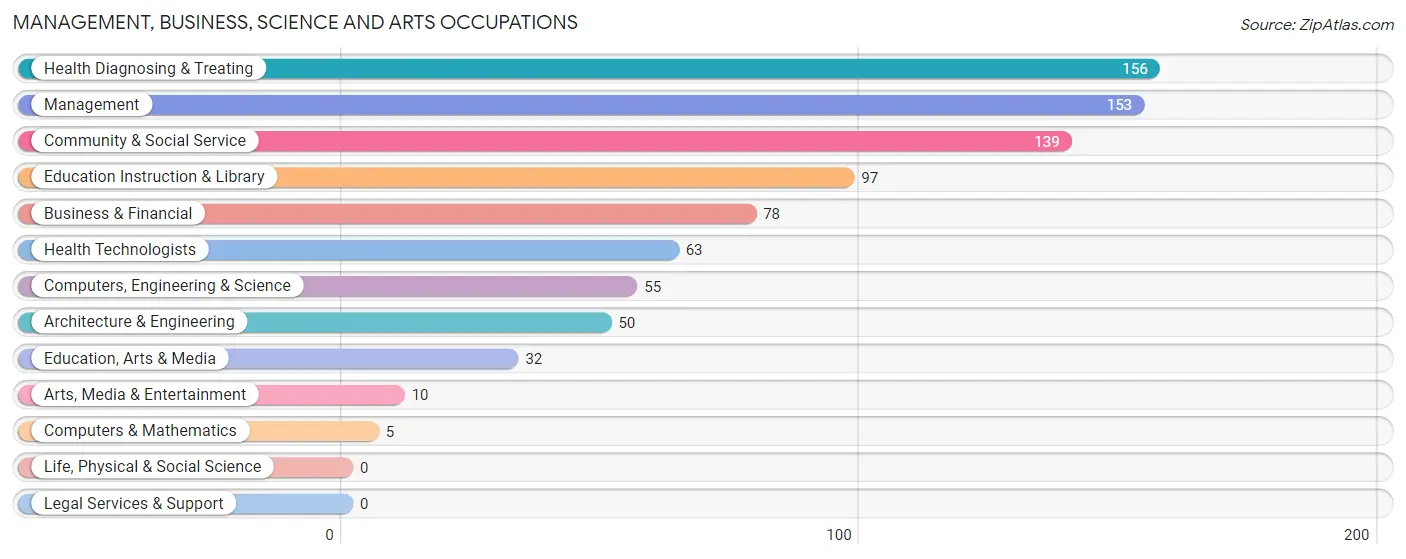
Management, Business, Science and Arts Occupations
The most common Management, Business, Science and Arts occupations in Linton are Health Diagnosing & Treating (156 | 7.0%), Management (153 | 6.9%), Community & Social Service (139 | 6.3%), Education Instruction & Library (97 | 4.4%), and Business & Financial (78 | 3.5%).
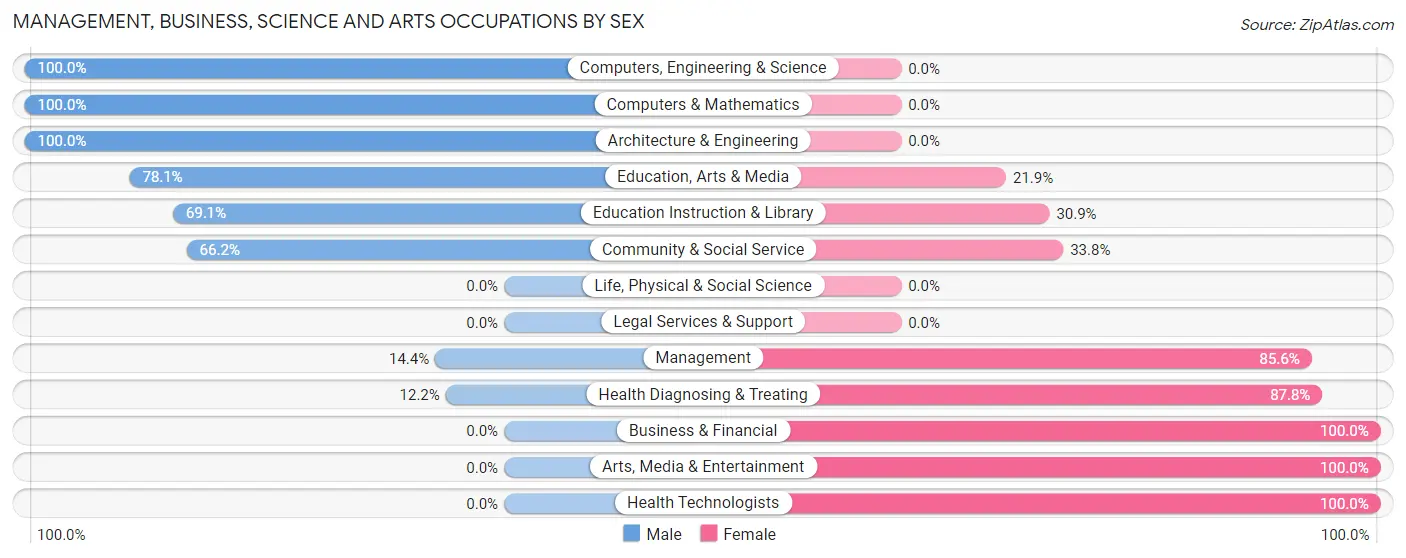
Management, Business, Science and Arts Occupations by Sex
Within the Management, Business, Science and Arts occupations in Linton, the most male-oriented occupations are Computers, Engineering & Science (100.0%), Computers & Mathematics (100.0%), and Architecture & Engineering (100.0%), while the most female-oriented occupations are Business & Financial (100.0%), Arts, Media & Entertainment (100.0%), and Health Technologists (100.0%).
| Occupation | Male | Female |
| Management | 22 (14.4%) | 131 (85.6%) |
| Business & Financial | 0 (0.0%) | 78 (100.0%) |
| Computers, Engineering & Science | 55 (100.0%) | 0 (0.0%) |
| Computers & Mathematics | 5 (100.0%) | 0 (0.0%) |
| Architecture & Engineering | 50 (100.0%) | 0 (0.0%) |
| Life, Physical & Social Science | 0 (0.0%) | 0 (0.0%) |
| Community & Social Service | 92 (66.2%) | 47 (33.8%) |
| Education, Arts & Media | 25 (78.1%) | 7 (21.9%) |
| Legal Services & Support | 0 (0.0%) | 0 (0.0%) |
| Education Instruction & Library | 67 (69.1%) | 30 (30.9%) |
| Arts, Media & Entertainment | 0 (0.0%) | 10 (100.0%) |
| Health Diagnosing & Treating | 19 (12.2%) | 137 (87.8%) |
| Health Technologists | 0 (0.0%) | 63 (100.0%) |
| Total (Category) | 188 (32.4%) | 393 (67.6%) |
| Total (Overall) | 1,077 (48.6%) | 1,140 (51.4%) |
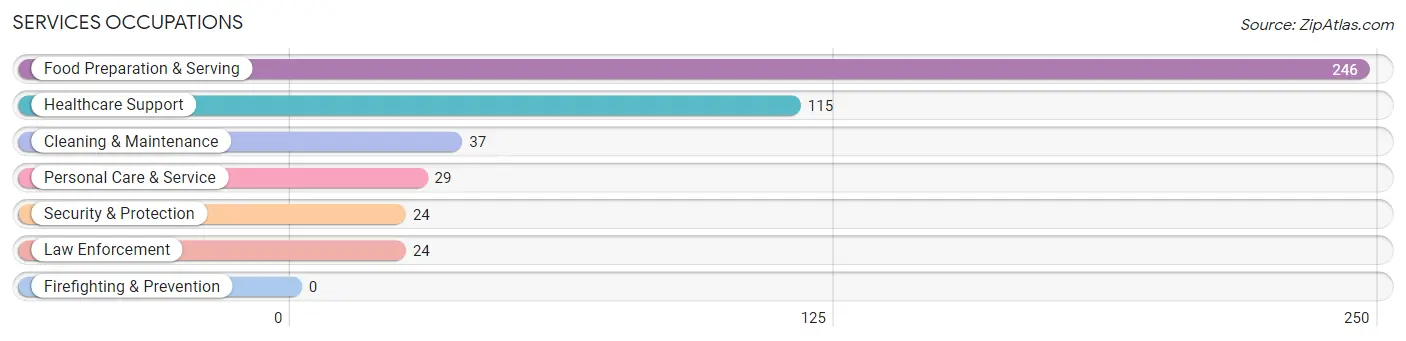
Services Occupations
The most common Services occupations in Linton are Food Preparation & Serving (246 | 11.1%), Healthcare Support (115 | 5.2%), Cleaning & Maintenance (37 | 1.7%), Personal Care & Service (29 | 1.3%), and Security & Protection (24 | 1.1%).
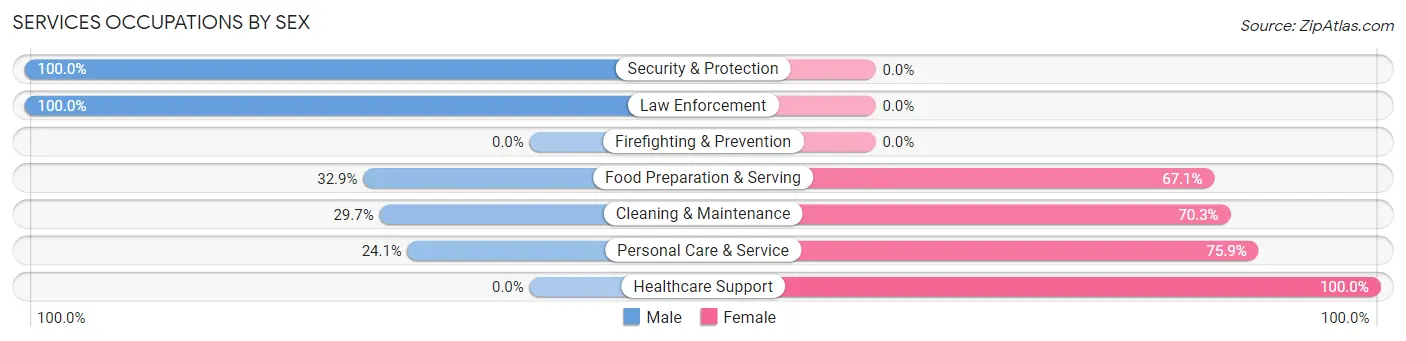
Services Occupations by Sex
Within the Services occupations in Linton, the most male-oriented occupations are Security & Protection (100.0%), Law Enforcement (100.0%), and Food Preparation & Serving (32.9%), while the most female-oriented occupations are Healthcare Support (100.0%), Personal Care & Service (75.9%), and Cleaning & Maintenance (70.3%).
| Occupation | Male | Female |
| Healthcare Support | 0 (0.0%) | 115 (100.0%) |
| Security & Protection | 24 (100.0%) | 0 (0.0%) |
| Firefighting & Prevention | 0 (0.0%) | 0 (0.0%) |
| Law Enforcement | 24 (100.0%) | 0 (0.0%) |
| Food Preparation & Serving | 81 (32.9%) | 165 (67.1%) |
| Cleaning & Maintenance | 11 (29.7%) | 26 (70.3%) |
| Personal Care & Service | 7 (24.1%) | 22 (75.9%) |
| Total (Category) | 123 (27.3%) | 328 (72.7%) |
| Total (Overall) | 1,077 (48.6%) | 1,140 (51.4%) |
Sales and Office Occupations
The most common Sales and Office occupations in Linton are Sales & Related (399 | 18.0%), and Office & Administration (96 | 4.3%).
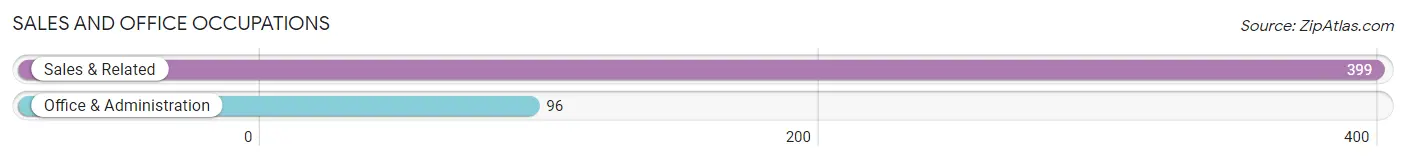
Sales and Office Occupations by Sex
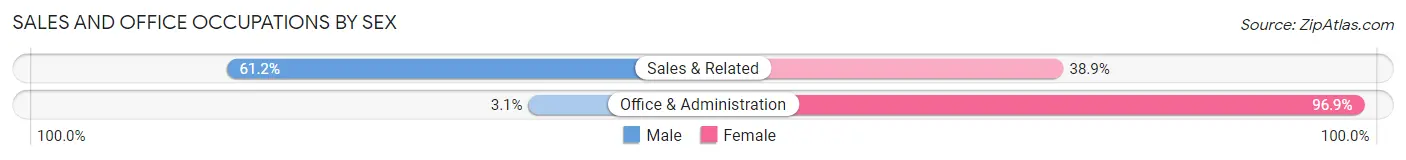
| Occupation | Male | Female |
| Sales & Related | 244 (61.2%) | 155 (38.9%) |
| Office & Administration | 3 (3.1%) | 93 (96.9%) |
| Total (Category) | 247 (49.9%) | 248 (50.1%) |
| Total (Overall) | 1,077 (48.6%) | 1,140 (51.4%) |
Natural Resources, Construction and Maintenance Occupations
The most common Natural Resources, Construction and Maintenance occupations in Linton are Construction & Extraction (167 | 7.5%), Installation, Maintenance & Repair (32 | 1.4%), and Farming, Fishing & Forestry (3 | 0.1%).
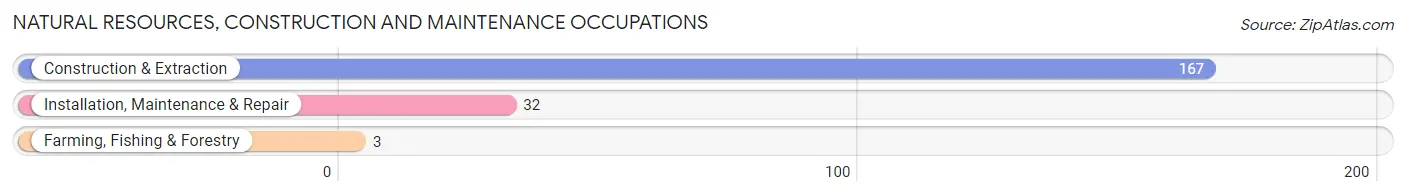
Natural Resources, Construction and Maintenance Occupations by Sex
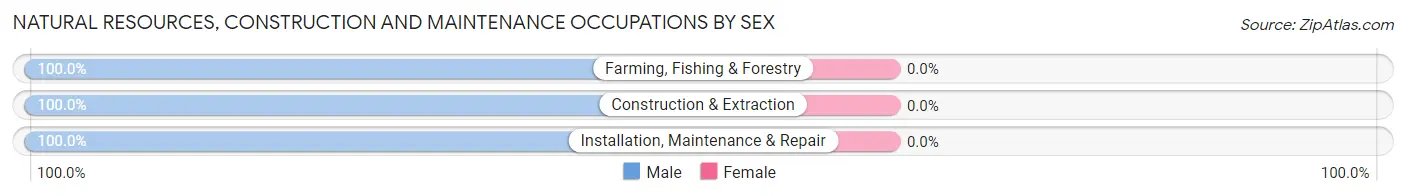
| Occupation | Male | Female |
| Farming, Fishing & Forestry | 3 (100.0%) | 0 (0.0%) |
| Construction & Extraction | 167 (100.0%) | 0 (0.0%) |
| Installation, Maintenance & Repair | 32 (100.0%) | 0 (0.0%) |
| Total (Category) | 202 (100.0%) | 0 (0.0%) |
| Total (Overall) | 1,077 (48.6%) | 1,140 (51.4%) |
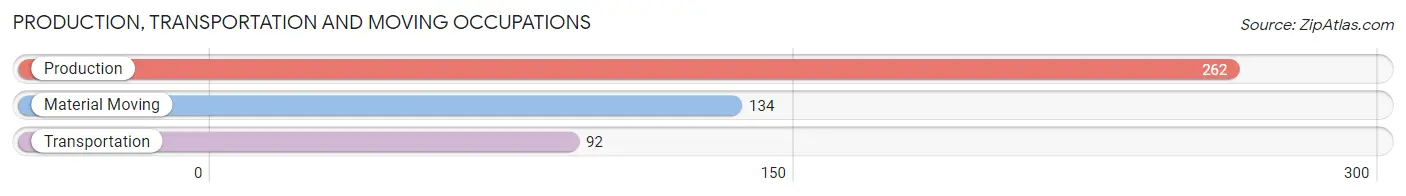
Production, Transportation and Moving Occupations
The most common Production, Transportation and Moving occupations in Linton are Production (262 | 11.8%), Material Moving (134 | 6.0%), and Transportation (92 | 4.2%).
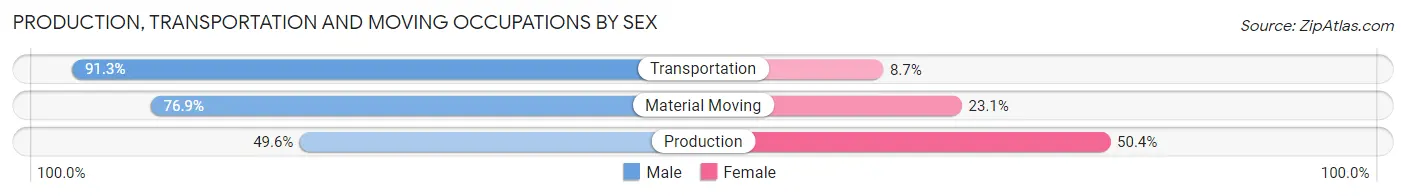
Production, Transportation and Moving Occupations by Sex
| Occupation | Male | Female |
| Production | 130 (49.6%) | 132 (50.4%) |
| Transportation | 84 (91.3%) | 8 (8.7%) |
| Material Moving | 103 (76.9%) | 31 (23.1%) |
| Total (Category) | 317 (65.0%) | 171 (35.0%) |
| Total (Overall) | 1,077 (48.6%) | 1,140 (51.4%) |
Employment Industries by Sex in Linton
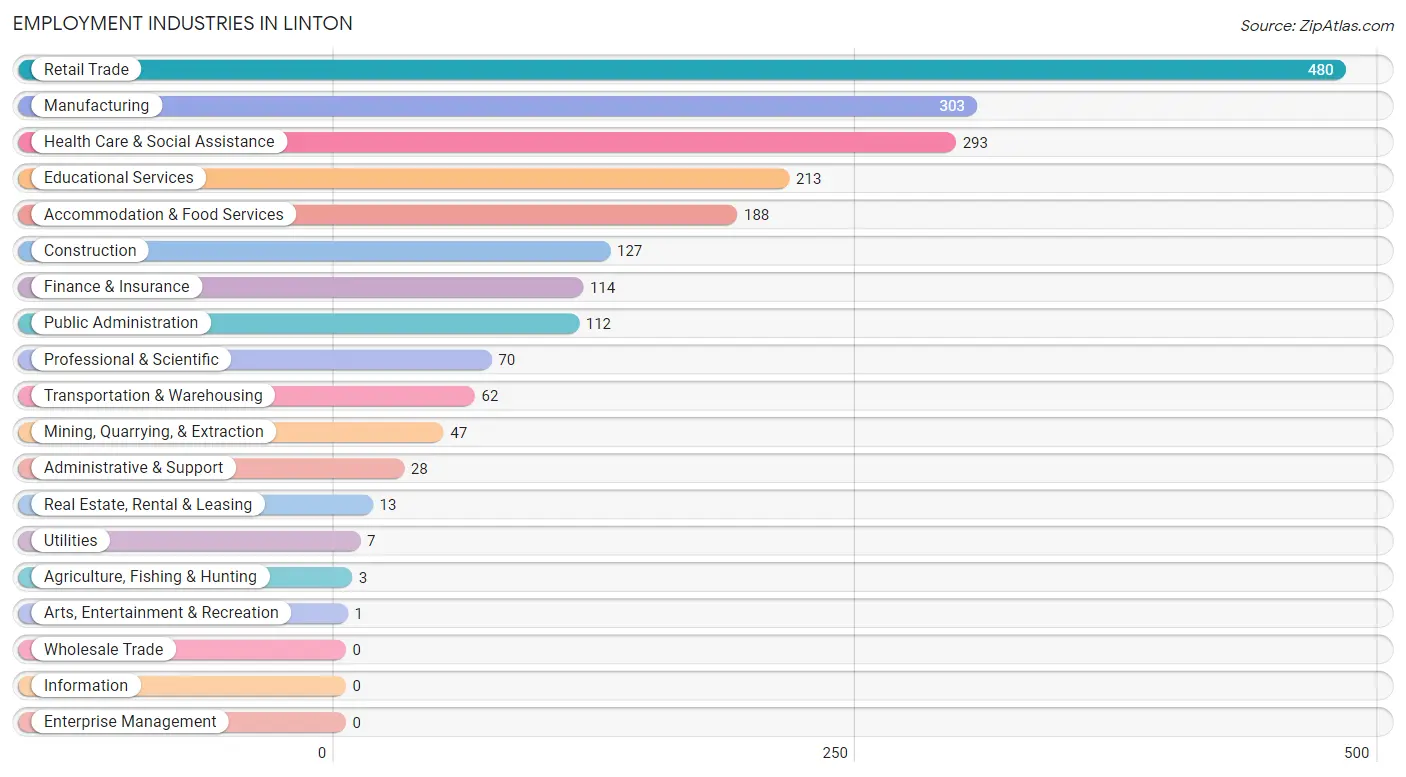
Employment Industries in Linton
The major employment industries in Linton include Retail Trade (480 | 21.6%), Manufacturing (303 | 13.7%), Health Care & Social Assistance (293 | 13.2%), Educational Services (213 | 9.6%), and Accommodation & Food Services (188 | 8.5%).
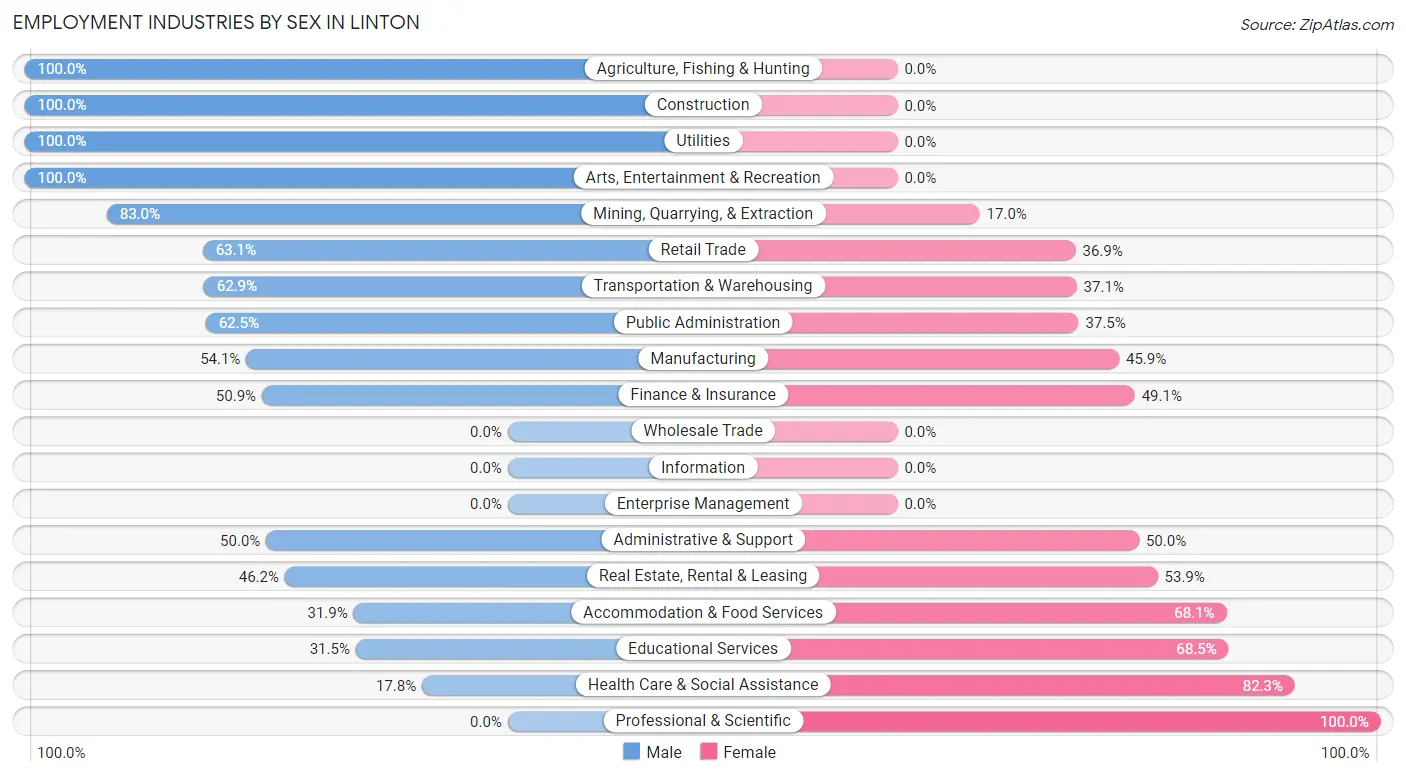
Employment Industries by Sex in Linton
The Linton industries that see more men than women are Agriculture, Fishing & Hunting (100.0%), Construction (100.0%), and Utilities (100.0%), whereas the industries that tend to have a higher number of women are Professional & Scientific (100.0%), Health Care & Social Assistance (82.3%), and Educational Services (68.5%).
| Industry | Male | Female |
| Agriculture, Fishing & Hunting | 3 (100.0%) | 0 (0.0%) |
| Mining, Quarrying, & Extraction | 39 (83.0%) | 8 (17.0%) |
| Construction | 127 (100.0%) | 0 (0.0%) |
| Manufacturing | 164 (54.1%) | 139 (45.9%) |
| Wholesale Trade | 0 (0.0%) | 0 (0.0%) |
| Retail Trade | 303 (63.1%) | 177 (36.9%) |
| Transportation & Warehousing | 39 (62.9%) | 23 (37.1%) |
| Utilities | 7 (100.0%) | 0 (0.0%) |
| Information | 0 (0.0%) | 0 (0.0%) |
| Finance & Insurance | 58 (50.9%) | 56 (49.1%) |
| Real Estate, Rental & Leasing | 6 (46.2%) | 7 (53.8%) |
| Professional & Scientific | 0 (0.0%) | 70 (100.0%) |
| Enterprise Management | 0 (0.0%) | 0 (0.0%) |
| Administrative & Support | 14 (50.0%) | 14 (50.0%) |
| Educational Services | 67 (31.5%) | 146 (68.5%) |
| Health Care & Social Assistance | 52 (17.7%) | 241 (82.3%) |
| Arts, Entertainment & Recreation | 1 (100.0%) | 0 (0.0%) |
| Accommodation & Food Services | 60 (31.9%) | 128 (68.1%) |
| Public Administration | 70 (62.5%) | 42 (37.5%) |
| Total | 1,077 (48.6%) | 1,140 (51.4%) |
Education in Linton
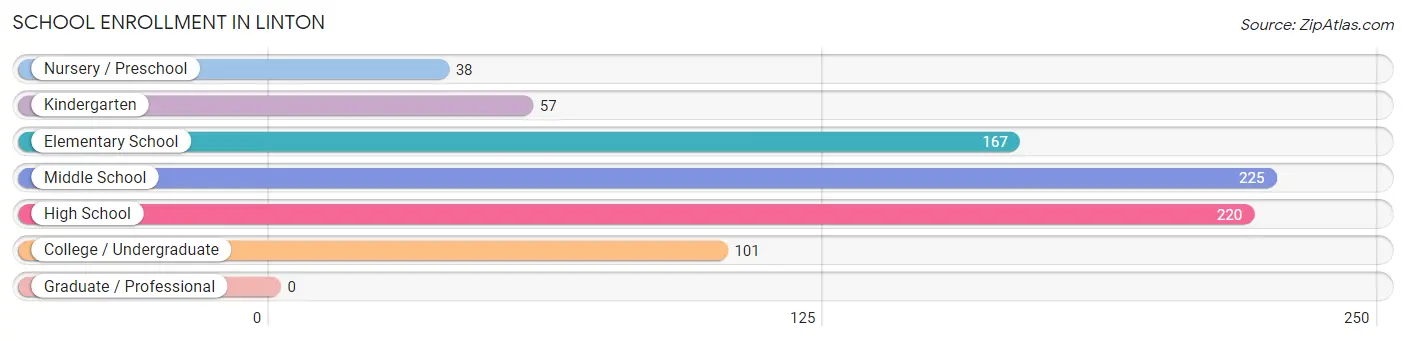
School Enrollment in Linton
The most common levels of schooling among the 808 students in Linton are middle school (225 | 27.9%), high school (220 | 27.2%), and elementary school (167 | 20.7%).
| School Level | # Students | % Students |
| Nursery / Preschool | 38 | 4.7% |
| Kindergarten | 57 | 7.0% |
| Elementary School | 167 | 20.7% |
| Middle School | 225 | 27.9% |
| High School | 220 | 27.2% |
| College / Undergraduate | 101 | 12.5% |
| Graduate / Professional | 0 | 0.0% |
| Total | 808 | 100.0% |
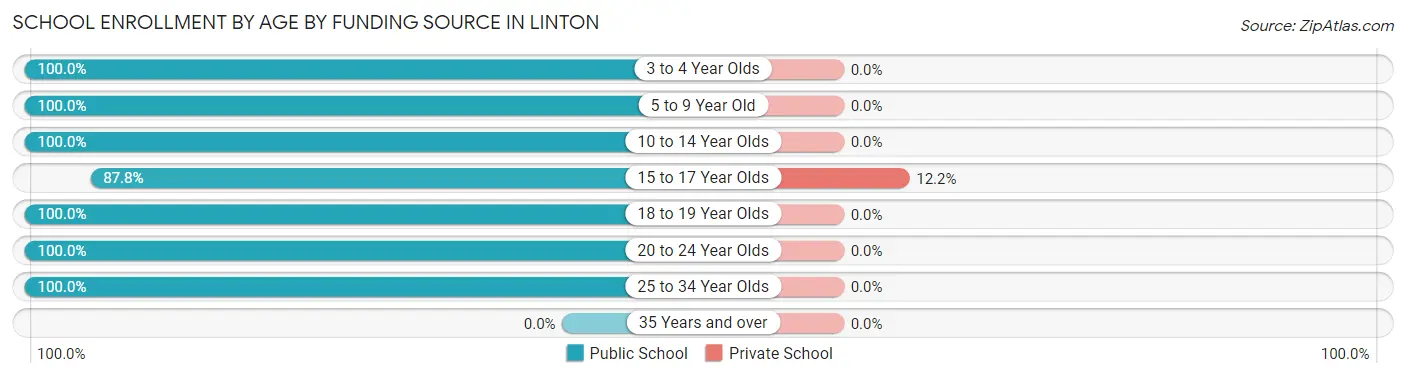
School Enrollment by Age by Funding Source in Linton
Out of a total of 808 students who are enrolled in schools in Linton, 17 (2.1%) attend a private institution, while the remaining 791 (97.9%) are enrolled in public schools. The age group of 15 to 17 year olds has the highest likelihood of being enrolled in private schools, with 17 (12.2% in the age bracket) enrolled. Conversely, the age group of 3 to 4 year olds has the lowest likelihood of being enrolled in a private school, with 37 (100.0% in the age bracket) attending a public institution.
| Age Bracket | Public School | Private School |
| 3 to 4 Year Olds | 37 (100.0%) | 0 (0.0%) |
| 5 to 9 Year Old | 218 (100.0%) | 0 (0.0%) |
| 10 to 14 Year Olds | 230 (100.0%) | 0 (0.0%) |
| 15 to 17 Year Olds | 122 (87.8%) | 17 (12.2%) |
| 18 to 19 Year Olds | 94 (100.0%) | 0 (0.0%) |
| 20 to 24 Year Olds | 80 (100.0%) | 0 (0.0%) |
| 25 to 34 Year Olds | 10 (100.0%) | 0 (0.0%) |
| 35 Years and over | 0 (0.0%) | 0 (0.0%) |
| Total | 791 (97.9%) | 17 (2.1%) |
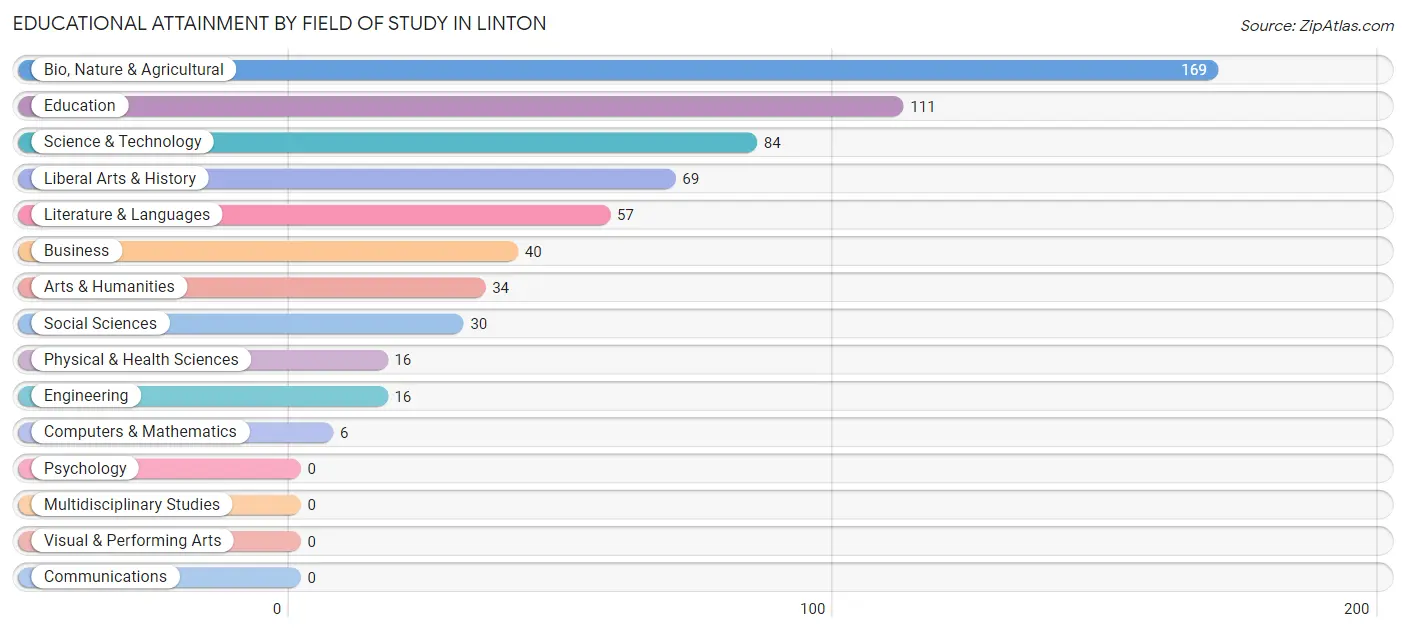
Educational Attainment by Field of Study in Linton
Bio, nature & agricultural (169 | 26.7%), education (111 | 17.6%), science & technology (84 | 13.3%), liberal arts & history (69 | 10.9%), and literature & languages (57 | 9.0%) are the most common fields of study among 632 individuals in Linton who have obtained a bachelor's degree or higher.
| Field of Study | # Graduates | % Graduates |
| Computers & Mathematics | 6 | 0.9% |
| Bio, Nature & Agricultural | 169 | 26.7% |
| Physical & Health Sciences | 16 | 2.5% |
| Psychology | 0 | 0.0% |
| Social Sciences | 30 | 4.8% |
| Engineering | 16 | 2.5% |
| Multidisciplinary Studies | 0 | 0.0% |
| Science & Technology | 84 | 13.3% |
| Business | 40 | 6.3% |
| Education | 111 | 17.6% |
| Literature & Languages | 57 | 9.0% |
| Liberal Arts & History | 69 | 10.9% |
| Visual & Performing Arts | 0 | 0.0% |
| Communications | 0 | 0.0% |
| Arts & Humanities | 34 | 5.4% |
| Total | 632 | 100.0% |
Transportation & Commute in Linton
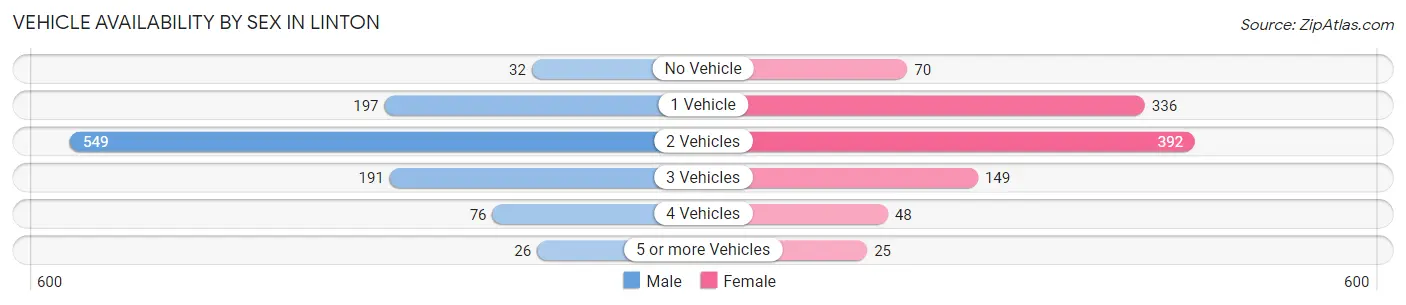
Vehicle Availability by Sex in Linton
The most prevalent vehicle ownership categories in Linton are males with 2 vehicles (549, accounting for 51.3%) and females with 2 vehicles (392, making up 53.8%).
| Vehicles Available | Male | Female |
| No Vehicle | 32 (3.0%) | 70 (6.9%) |
| 1 Vehicle | 197 (18.4%) | 336 (32.9%) |
| 2 Vehicles | 549 (51.3%) | 392 (38.4%) |
| 3 Vehicles | 191 (17.8%) | 149 (14.6%) |
| 4 Vehicles | 76 (7.1%) | 48 (4.7%) |
| 5 or more Vehicles | 26 (2.4%) | 25 (2.5%) |
| Total | 1,071 (100.0%) | 1,020 (100.0%) |
Commute Time in Linton
The most frequently occuring commute durations in Linton are 5 to 9 minutes (564 commuters, 27.8%), 45 to 59 minutes (240 commuters, 11.8%), and 25 to 29 minutes (209 commuters, 10.3%).
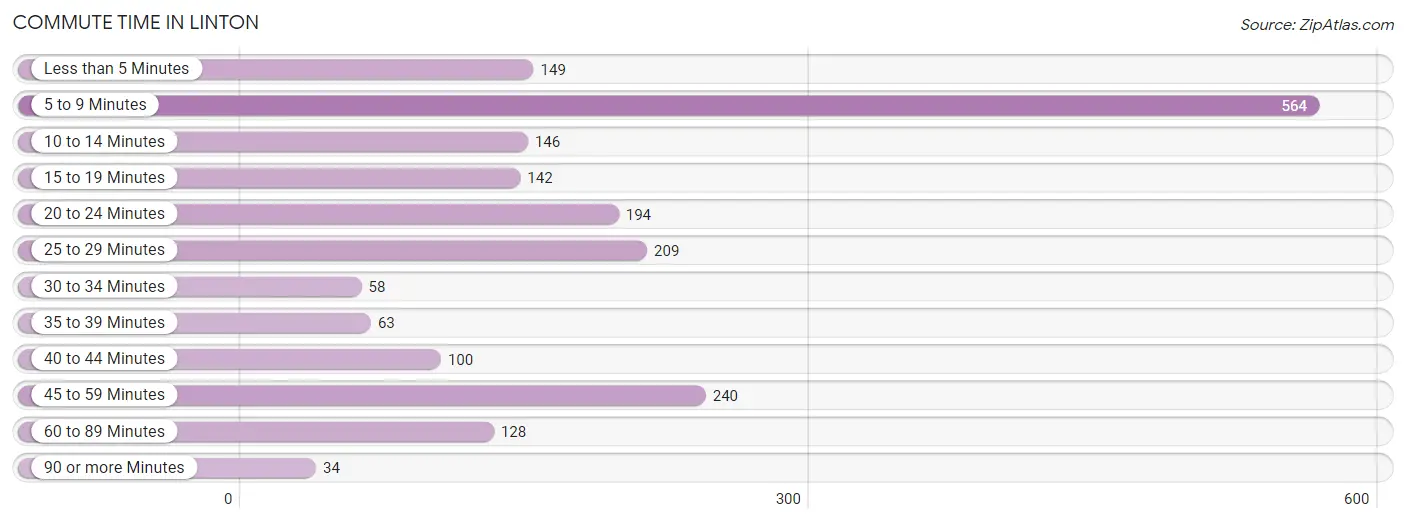
| Commute Time | # Commuters | % Commuters |
| Less than 5 Minutes | 149 | 7.3% |
| 5 to 9 Minutes | 564 | 27.8% |
| 10 to 14 Minutes | 146 | 7.2% |
| 15 to 19 Minutes | 142 | 7.0% |
| 20 to 24 Minutes | 194 | 9.6% |
| 25 to 29 Minutes | 209 | 10.3% |
| 30 to 34 Minutes | 58 | 2.9% |
| 35 to 39 Minutes | 63 | 3.1% |
| 40 to 44 Minutes | 100 | 4.9% |
| 45 to 59 Minutes | 240 | 11.8% |
| 60 to 89 Minutes | 128 | 6.3% |
| 90 or more Minutes | 34 | 1.7% |
Commute Time by Sex in Linton
The most common commute times in Linton are 5 to 9 minutes (264 commuters, 25.2%) for males and 5 to 9 minutes (300 commuters, 30.6%) for females.
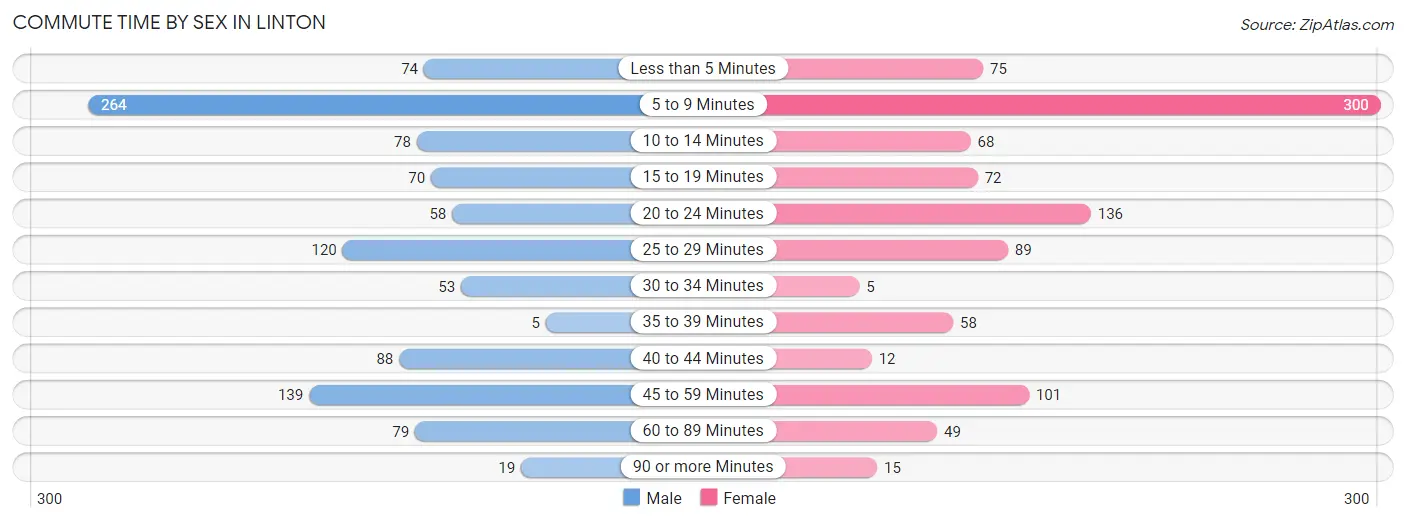
| Commute Time | Male | Female |
| Less than 5 Minutes | 74 (7.1%) | 75 (7.6%) |
| 5 to 9 Minutes | 264 (25.2%) | 300 (30.6%) |
| 10 to 14 Minutes | 78 (7.4%) | 68 (6.9%) |
| 15 to 19 Minutes | 70 (6.7%) | 72 (7.3%) |
| 20 to 24 Minutes | 58 (5.5%) | 136 (13.9%) |
| 25 to 29 Minutes | 120 (11.5%) | 89 (9.1%) |
| 30 to 34 Minutes | 53 (5.1%) | 5 (0.5%) |
| 35 to 39 Minutes | 5 (0.5%) | 58 (5.9%) |
| 40 to 44 Minutes | 88 (8.4%) | 12 (1.2%) |
| 45 to 59 Minutes | 139 (13.3%) | 101 (10.3%) |
| 60 to 89 Minutes | 79 (7.5%) | 49 (5.0%) |
| 90 or more Minutes | 19 (1.8%) | 15 (1.5%) |
Time of Departure to Work by Sex in Linton
The most frequent times of departure to work in Linton are 5:00 AM to 5:29 AM (146, 13.9%) for males and 7:00 AM to 7:29 AM (188, 19.2%) for females.
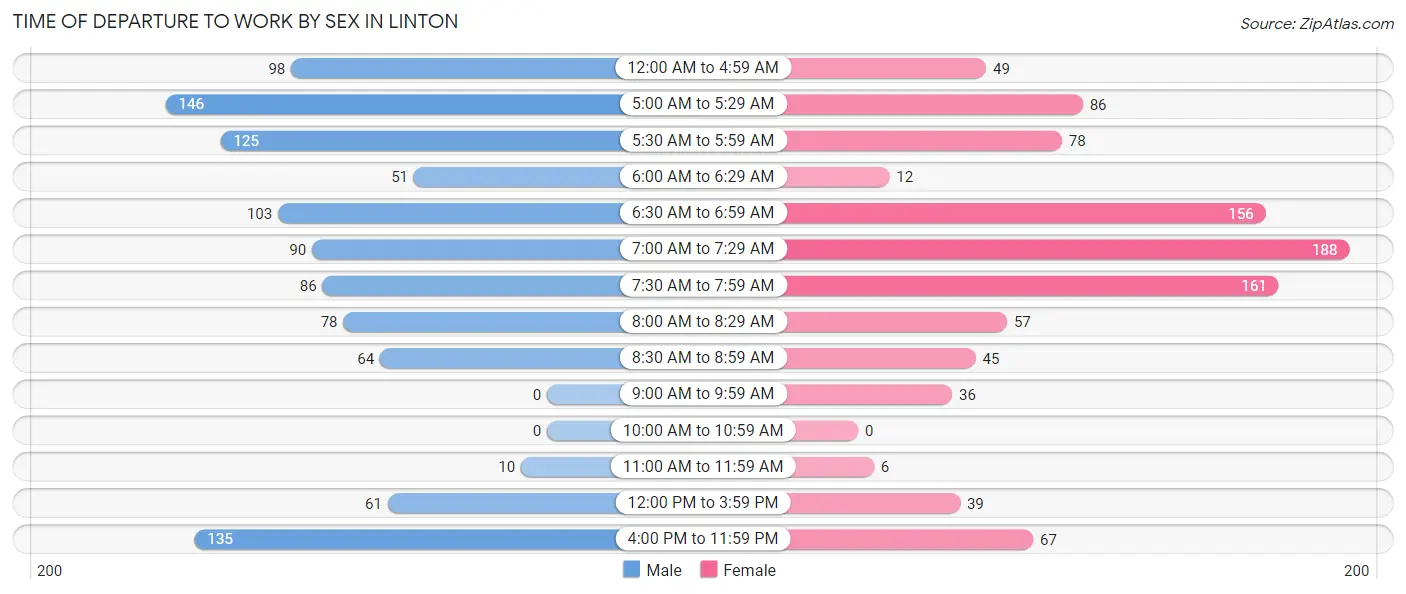
| Time of Departure | Male | Female |
| 12:00 AM to 4:59 AM | 98 (9.4%) | 49 (5.0%) |
| 5:00 AM to 5:29 AM | 146 (13.9%) | 86 (8.8%) |
| 5:30 AM to 5:59 AM | 125 (11.9%) | 78 (8.0%) |
| 6:00 AM to 6:29 AM | 51 (4.9%) | 12 (1.2%) |
| 6:30 AM to 6:59 AM | 103 (9.8%) | 156 (15.9%) |
| 7:00 AM to 7:29 AM | 90 (8.6%) | 188 (19.2%) |
| 7:30 AM to 7:59 AM | 86 (8.2%) | 161 (16.4%) |
| 8:00 AM to 8:29 AM | 78 (7.4%) | 57 (5.8%) |
| 8:30 AM to 8:59 AM | 64 (6.1%) | 45 (4.6%) |
| 9:00 AM to 9:59 AM | 0 (0.0%) | 36 (3.7%) |
| 10:00 AM to 10:59 AM | 0 (0.0%) | 0 (0.0%) |
| 11:00 AM to 11:59 AM | 10 (1.0%) | 6 (0.6%) |
| 12:00 PM to 3:59 PM | 61 (5.8%) | 39 (4.0%) |
| 4:00 PM to 11:59 PM | 135 (12.9%) | 67 (6.8%) |
| Total | 1,047 (100.0%) | 980 (100.0%) |
Housing Occupancy in Linton
Occupancy by Ownership in Linton
Of the total 2,331 dwellings in Linton, owner-occupied units account for 1,454 (62.4%), while renter-occupied units make up 877 (37.6%).
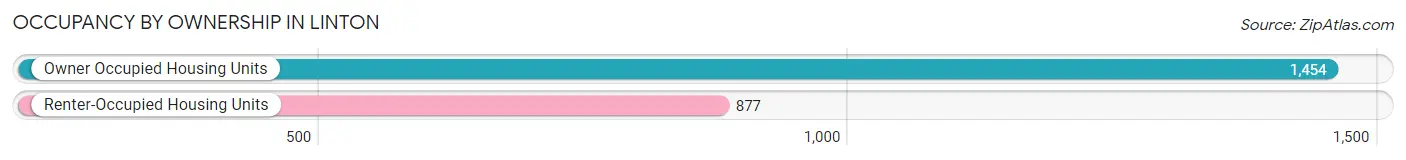
| Occupancy | # Housing Units | % Housing Units |
| Owner Occupied Housing Units | 1,454 | 62.4% |
| Renter-Occupied Housing Units | 877 | 37.6% |
| Total Occupied Housing Units | 2,331 | 100.0% |
Occupancy by Household Size in Linton
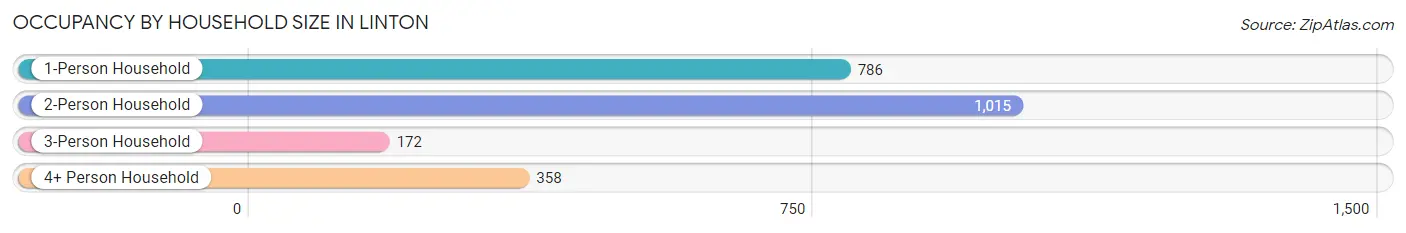
| Household Size | # Housing Units | % Housing Units |
| 1-Person Household | 786 | 33.7% |
| 2-Person Household | 1,015 | 43.5% |
| 3-Person Household | 172 | 7.4% |
| 4+ Person Household | 358 | 15.4% |
| Total Housing Units | 2,331 | 100.0% |
Occupancy by Ownership by Household Size in Linton
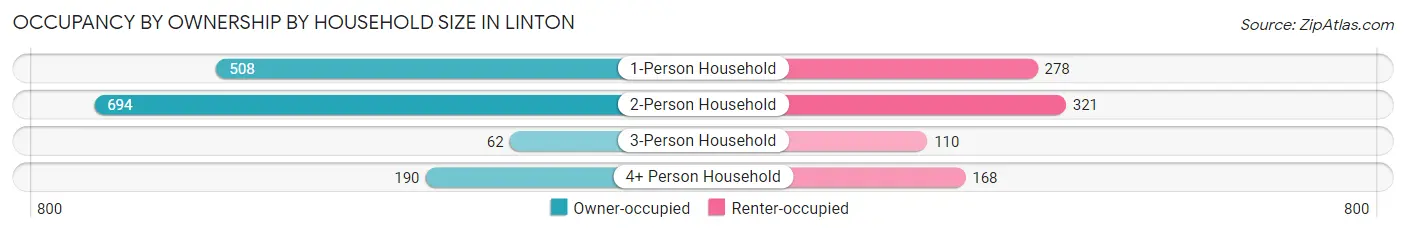
| Household Size | Owner-occupied | Renter-occupied |
| 1-Person Household | 508 (64.6%) | 278 (35.4%) |
| 2-Person Household | 694 (68.4%) | 321 (31.6%) |
| 3-Person Household | 62 (36.0%) | 110 (63.9%) |
| 4+ Person Household | 190 (53.1%) | 168 (46.9%) |
| Total Housing Units | 1,454 (62.4%) | 877 (37.6%) |
Occupancy by Educational Attainment in Linton
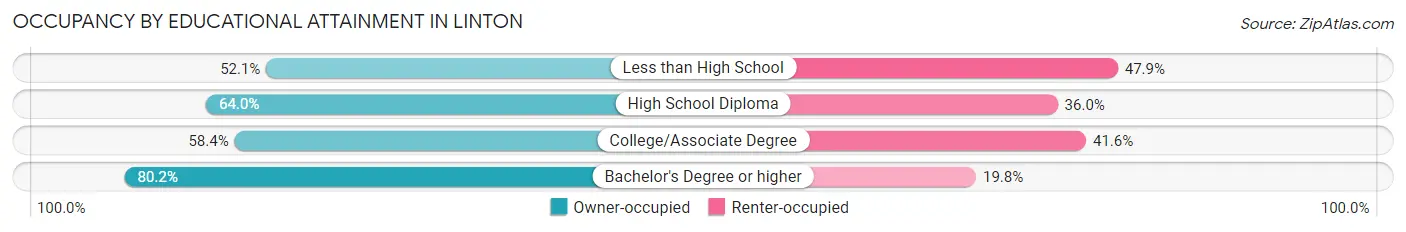
| Household Size | Owner-occupied | Renter-occupied |
| Less than High School | 174 (52.1%) | 160 (47.9%) |
| High School Diploma | 532 (64.0%) | 299 (36.0%) |
| College/Associate Degree | 501 (58.4%) | 357 (41.6%) |
| Bachelor's Degree or higher | 247 (80.2%) | 61 (19.8%) |
Occupancy by Age of Householder in Linton
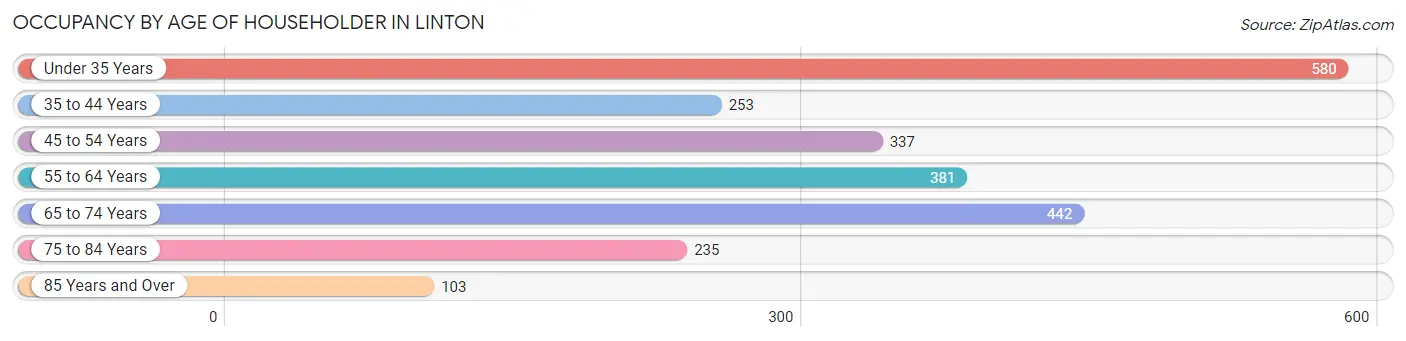
| Age Bracket | # Households | % Households |
| Under 35 Years | 580 | 24.9% |
| 35 to 44 Years | 253 | 10.8% |
| 45 to 54 Years | 337 | 14.5% |
| 55 to 64 Years | 381 | 16.3% |
| 65 to 74 Years | 442 | 19.0% |
| 75 to 84 Years | 235 | 10.1% |
| 85 Years and Over | 103 | 4.4% |
| Total | 2,331 | 100.0% |
Housing Finances in Linton
Median Income by Occupancy in Linton
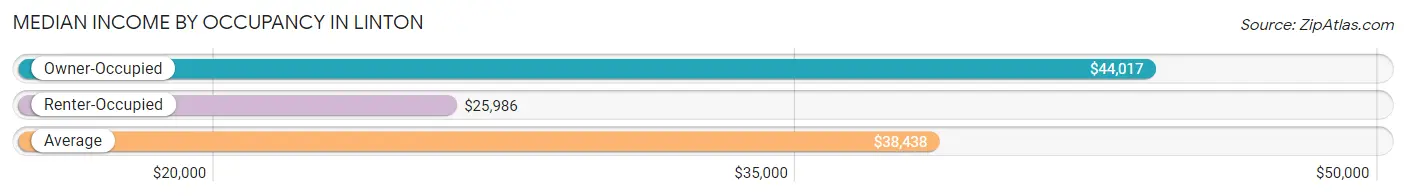
| Occupancy Type | # Households | Median Income |
| Owner-Occupied | 1,454 (62.4%) | $44,017 |
| Renter-Occupied | 877 (37.6%) | $25,986 |
| Average | 2,331 (100.0%) | $38,438 |
Occupancy by Householder Income Bracket in Linton
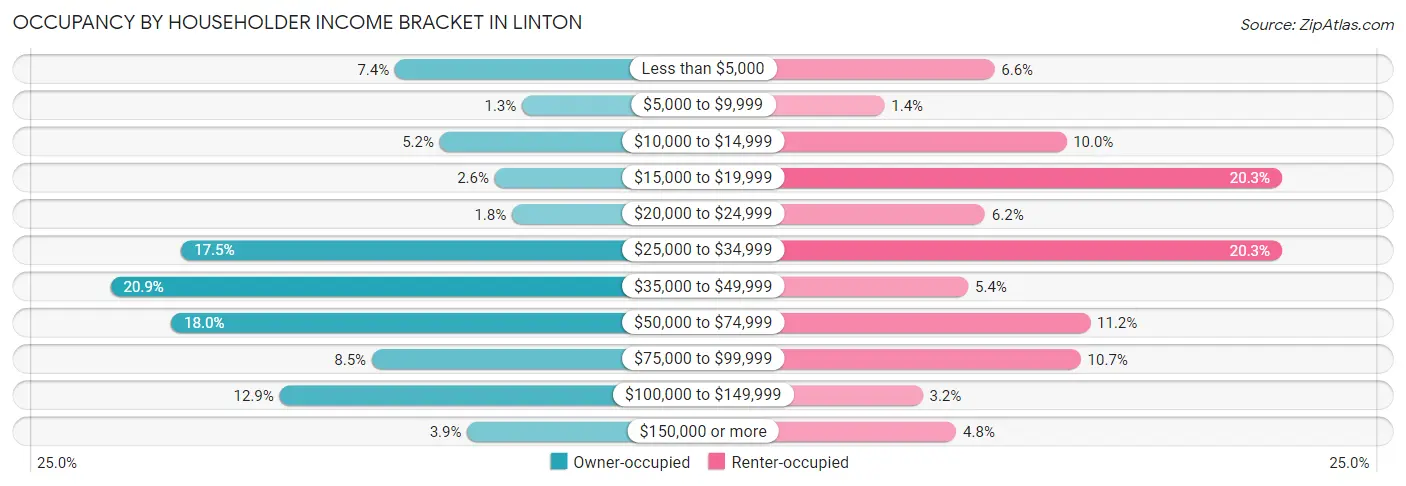
| Income Bracket | Owner-occupied | Renter-occupied |
| Less than $5,000 | 107 (7.4%) | 58 (6.6%) |
| $5,000 to $9,999 | 19 (1.3%) | 12 (1.4%) |
| $10,000 to $14,999 | 76 (5.2%) | 88 (10.0%) |
| $15,000 to $19,999 | 38 (2.6%) | 178 (20.3%) |
| $20,000 to $24,999 | 26 (1.8%) | 54 (6.2%) |
| $25,000 to $34,999 | 255 (17.5%) | 178 (20.3%) |
| $35,000 to $49,999 | 304 (20.9%) | 47 (5.4%) |
| $50,000 to $74,999 | 262 (18.0%) | 98 (11.2%) |
| $75,000 to $99,999 | 123 (8.5%) | 94 (10.7%) |
| $100,000 to $149,999 | 187 (12.9%) | 28 (3.2%) |
| $150,000 or more | 57 (3.9%) | 42 (4.8%) |
| Total | 1,454 (100.0%) | 877 (100.0%) |
Monthly Housing Cost Tiers in Linton
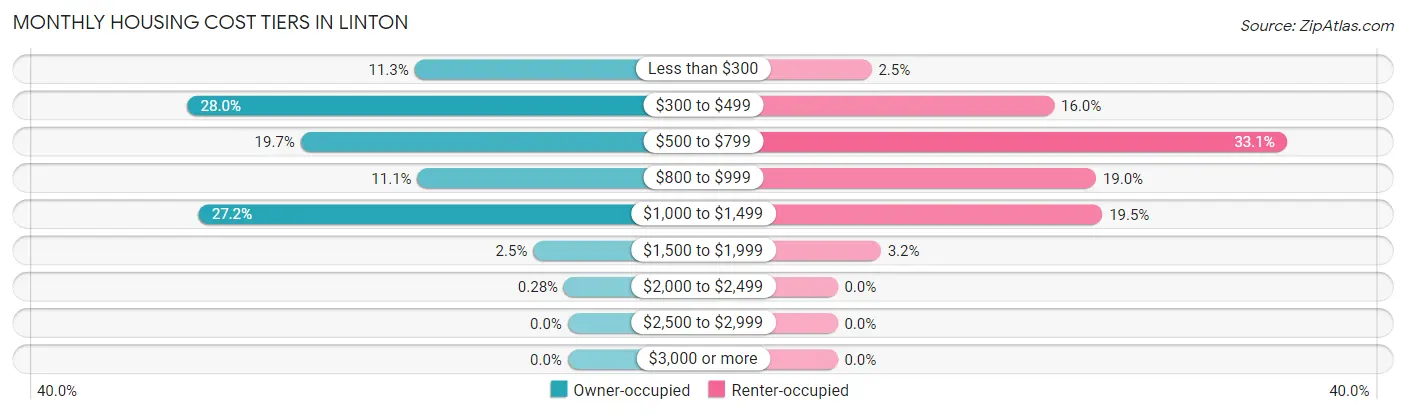
| Monthly Cost | Owner-occupied | Renter-occupied |
| Less than $300 | 164 (11.3%) | 22 (2.5%) |
| $300 to $499 | 407 (28.0%) | 140 (16.0%) |
| $500 to $799 | 286 (19.7%) | 290 (33.1%) |
| $800 to $999 | 161 (11.1%) | 167 (19.0%) |
| $1,000 to $1,499 | 395 (27.2%) | 171 (19.5%) |
| $1,500 to $1,999 | 37 (2.5%) | 28 (3.2%) |
| $2,000 to $2,499 | 4 (0.3%) | 0 (0.0%) |
| $2,500 to $2,999 | 0 (0.0%) | 0 (0.0%) |
| $3,000 or more | 0 (0.0%) | 0 (0.0%) |
| Total | 1,454 (100.0%) | 877 (100.0%) |
Physical Housing Characteristics in Linton
Housing Structures in Linton
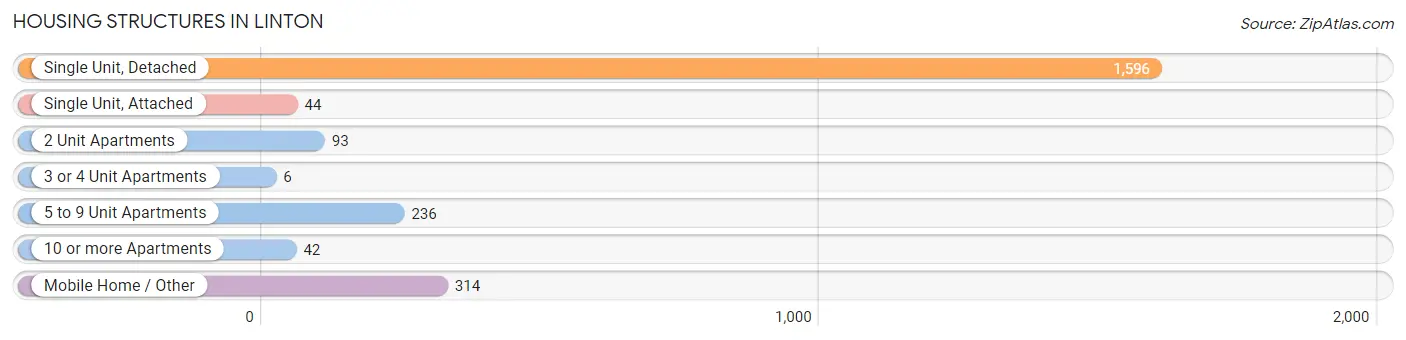
| Structure Type | # Housing Units | % Housing Units |
| Single Unit, Detached | 1,596 | 68.5% |
| Single Unit, Attached | 44 | 1.9% |
| 2 Unit Apartments | 93 | 4.0% |
| 3 or 4 Unit Apartments | 6 | 0.3% |
| 5 to 9 Unit Apartments | 236 | 10.1% |
| 10 or more Apartments | 42 | 1.8% |
| Mobile Home / Other | 314 | 13.5% |
| Total | 2,331 | 100.0% |
Housing Structures by Occupancy in Linton
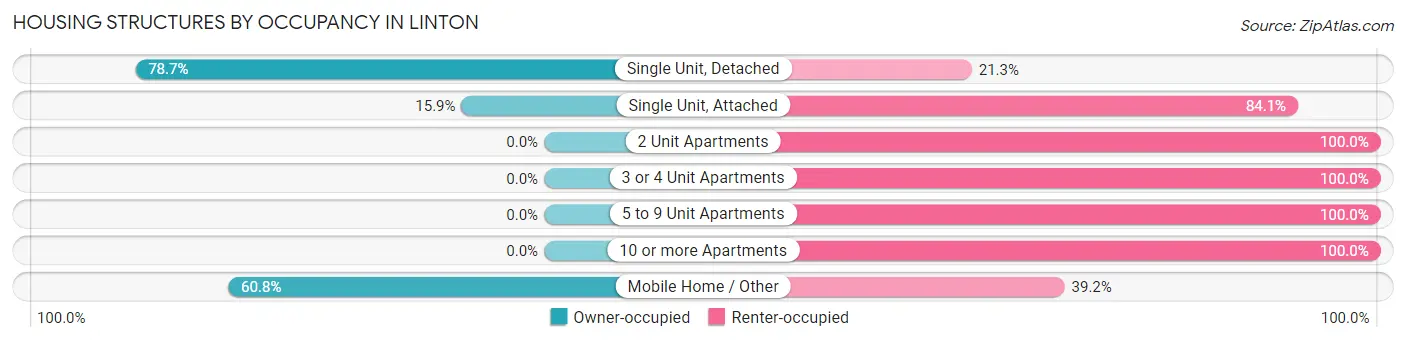
| Structure Type | Owner-occupied | Renter-occupied |
| Single Unit, Detached | 1,256 (78.7%) | 340 (21.3%) |
| Single Unit, Attached | 7 (15.9%) | 37 (84.1%) |
| 2 Unit Apartments | 0 (0.0%) | 93 (100.0%) |
| 3 or 4 Unit Apartments | 0 (0.0%) | 6 (100.0%) |
| 5 to 9 Unit Apartments | 0 (0.0%) | 236 (100.0%) |
| 10 or more Apartments | 0 (0.0%) | 42 (100.0%) |
| Mobile Home / Other | 191 (60.8%) | 123 (39.2%) |
| Total | 1,454 (62.4%) | 877 (37.6%) |
Housing Structures by Number of Rooms in Linton
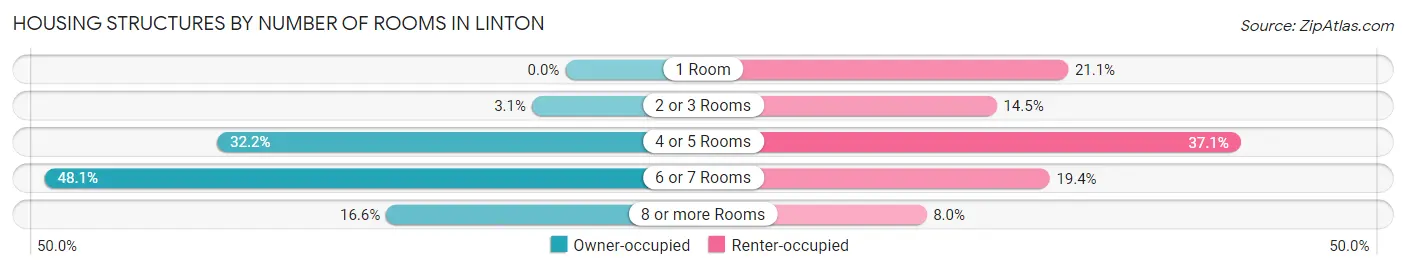
| Number of Rooms | Owner-occupied | Renter-occupied |
| 1 Room | 0 (0.0%) | 185 (21.1%) |
| 2 or 3 Rooms | 45 (3.1%) | 127 (14.5%) |
| 4 or 5 Rooms | 468 (32.2%) | 325 (37.1%) |
| 6 or 7 Rooms | 700 (48.1%) | 170 (19.4%) |
| 8 or more Rooms | 241 (16.6%) | 70 (8.0%) |
| Total | 1,454 (100.0%) | 877 (100.0%) |
Housing Structure by Heating Type in Linton
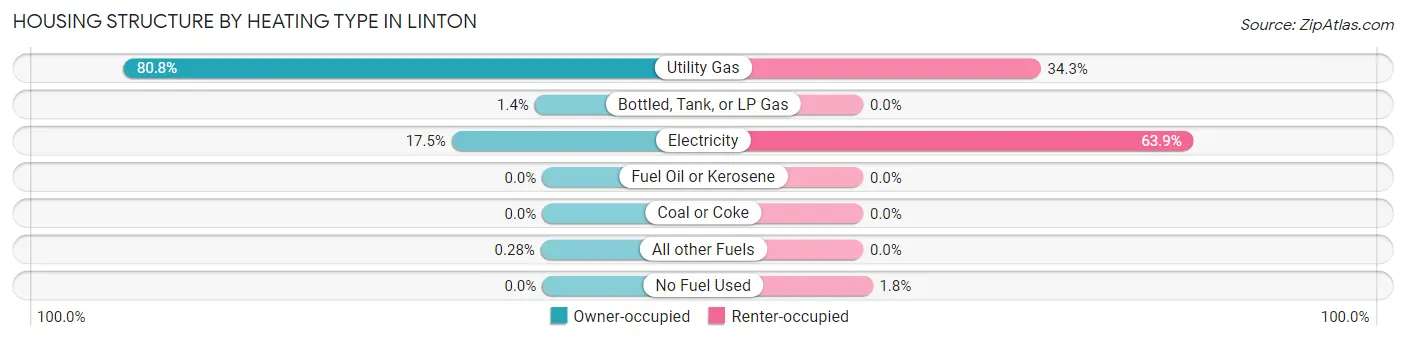
| Heating Type | Owner-occupied | Renter-occupied |
| Utility Gas | 1,175 (80.8%) | 301 (34.3%) |
| Bottled, Tank, or LP Gas | 21 (1.4%) | 0 (0.0%) |
| Electricity | 254 (17.5%) | 560 (63.8%) |
| Fuel Oil or Kerosene | 0 (0.0%) | 0 (0.0%) |
| Coal or Coke | 0 (0.0%) | 0 (0.0%) |
| All other Fuels | 4 (0.3%) | 0 (0.0%) |
| No Fuel Used | 0 (0.0%) | 16 (1.8%) |
| Total | 1,454 (100.0%) | 877 (100.0%) |
Household Vehicle Usage in Linton
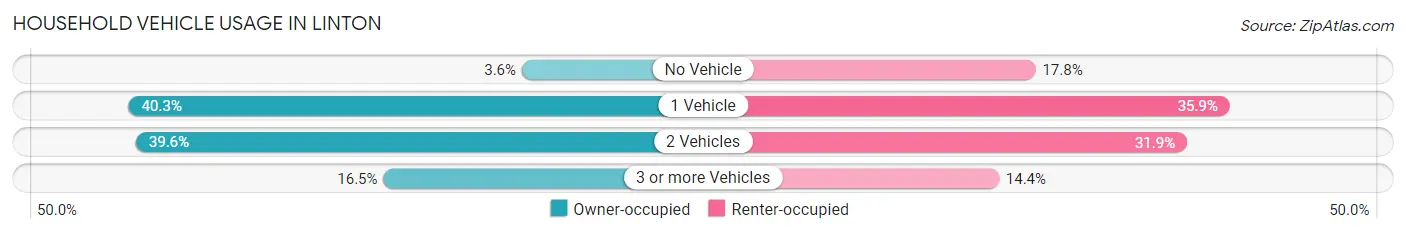
| Vehicles per Household | Owner-occupied | Renter-occupied |
| No Vehicle | 52 (3.6%) | 156 (17.8%) |
| 1 Vehicle | 586 (40.3%) | 315 (35.9%) |
| 2 Vehicles | 576 (39.6%) | 280 (31.9%) |
| 3 or more Vehicles | 240 (16.5%) | 126 (14.4%) |
| Total | 1,454 (100.0%) | 877 (100.0%) |
Real Estate & Mortgages in Linton
Real Estate and Mortgage Overview in Linton
| Characteristic | Without Mortgage | With Mortgage |
| Housing Units | 870 | 584 |
| Median Property Value | $75,200 | $89,000 |
| Median Household Income | $41,364 | $20 |
| Monthly Housing Costs | $390 | $0 |
| Real Estate Taxes | $574 | $16 |
Property Value by Mortgage Status in Linton
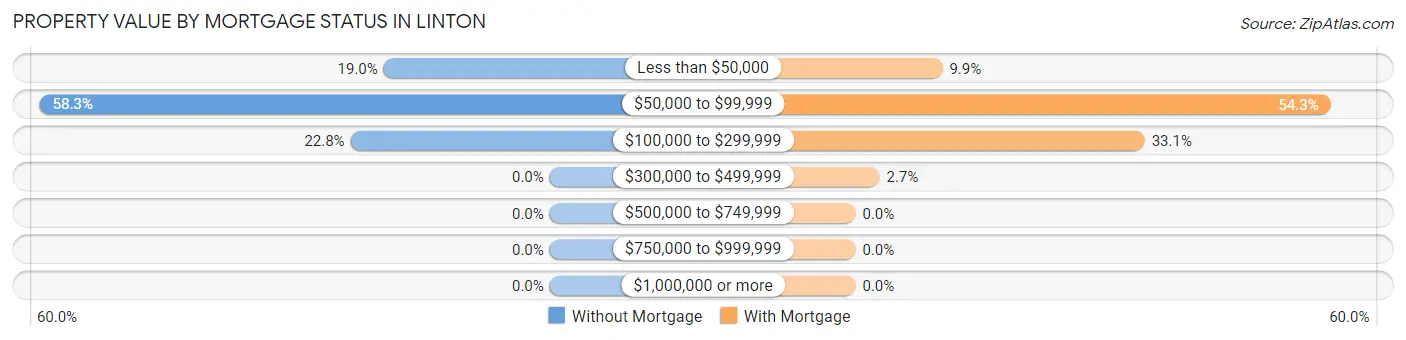
| Property Value | Without Mortgage | With Mortgage |
| Less than $50,000 | 165 (19.0%) | 58 (9.9%) |
| $50,000 to $99,999 | 507 (58.3%) | 317 (54.3%) |
| $100,000 to $299,999 | 198 (22.8%) | 193 (33.1%) |
| $300,000 to $499,999 | 0 (0.0%) | 16 (2.7%) |
| $500,000 to $749,999 | 0 (0.0%) | 0 (0.0%) |
| $750,000 to $999,999 | 0 (0.0%) | 0 (0.0%) |
| $1,000,000 or more | 0 (0.0%) | 0 (0.0%) |
| Total | 870 (100.0%) | 584 (100.0%) |
Household Income by Mortgage Status in Linton
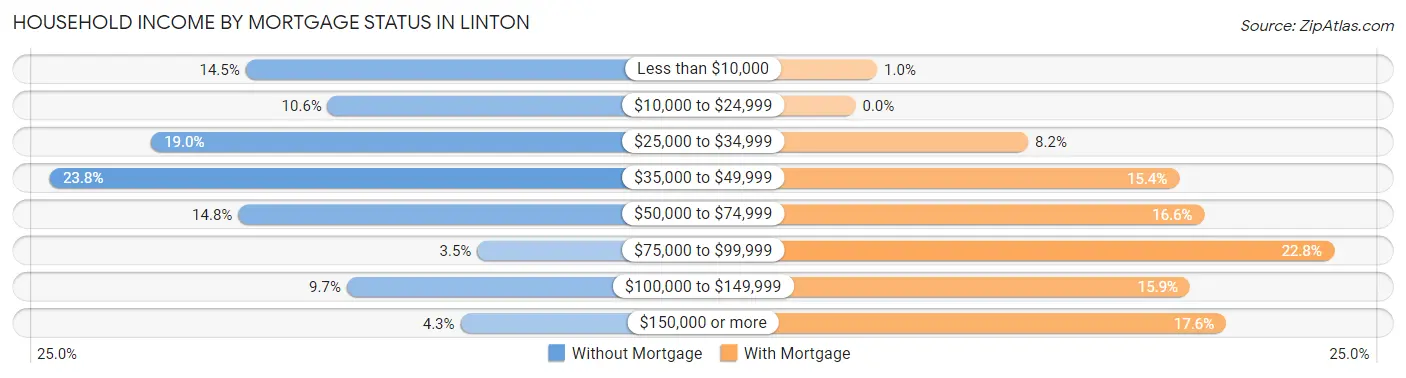
| Household Income | Without Mortgage | With Mortgage |
| Less than $10,000 | 126 (14.5%) | 6 (1.0%) |
| $10,000 to $24,999 | 92 (10.6%) | 0 (0.0%) |
| $25,000 to $34,999 | 165 (19.0%) | 48 (8.2%) |
| $35,000 to $49,999 | 207 (23.8%) | 90 (15.4%) |
| $50,000 to $74,999 | 129 (14.8%) | 97 (16.6%) |
| $75,000 to $99,999 | 30 (3.5%) | 133 (22.8%) |
| $100,000 to $149,999 | 84 (9.7%) | 93 (15.9%) |
| $150,000 or more | 37 (4.3%) | 103 (17.6%) |
| Total | 870 (100.0%) | 584 (100.0%) |
Property Value to Household Income Ratio in Linton
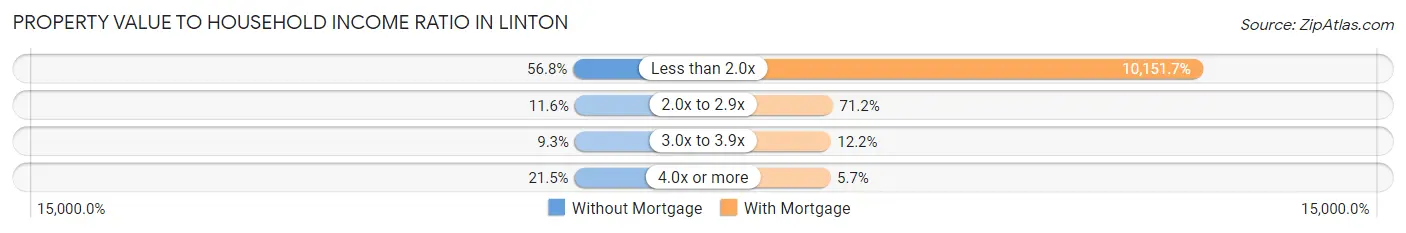
| Value-to-Income Ratio | Without Mortgage | With Mortgage |
| Less than 2.0x | 494 (56.8%) | 59,286 (10,151.7%) |
| 2.0x to 2.9x | 101 (11.6%) | 416 (71.2%) |
| 3.0x to 3.9x | 81 (9.3%) | 71 (12.2%) |
| 4.0x or more | 187 (21.5%) | 33 (5.7%) |
| Total | 870 (100.0%) | 584 (100.0%) |
Real Estate Taxes by Mortgage Status in Linton
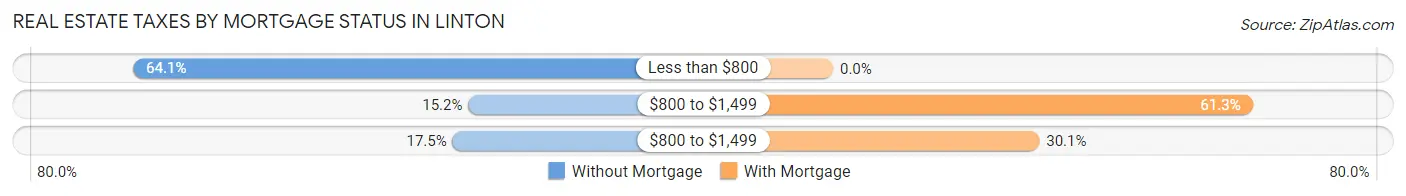
| Property Taxes | Without Mortgage | With Mortgage |
| Less than $800 | 558 (64.1%) | 0 (0.0%) |
| $800 to $1,499 | 132 (15.2%) | 358 (61.3%) |
| $800 to $1,499 | 152 (17.5%) | 176 (30.1%) |
| Total | 870 (100.0%) | 584 (100.0%) |
Health & Disability in Linton
Health Insurance Coverage by Age in Linton
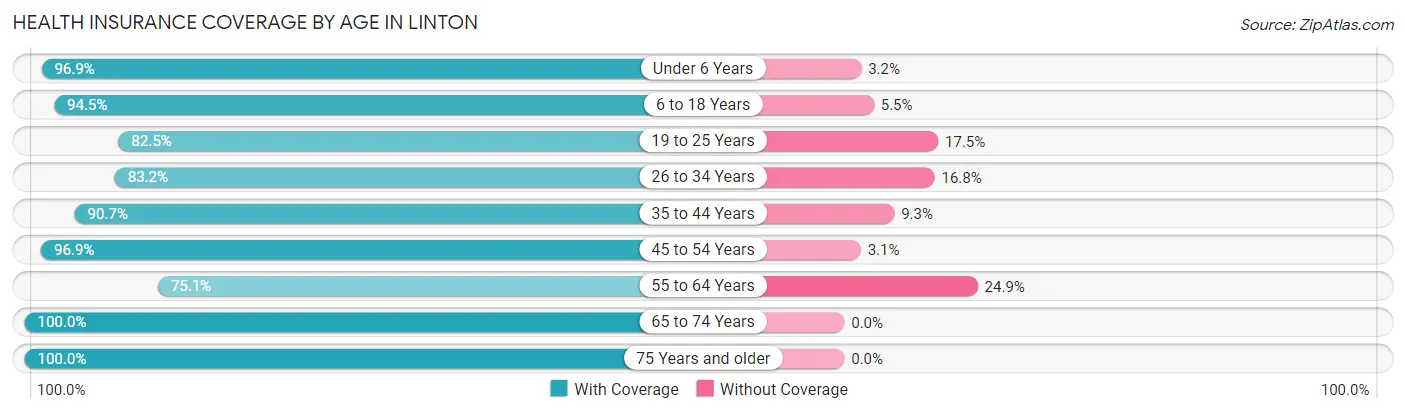
| Age Bracket | With Coverage | Without Coverage |
| Under 6 Years | 246 (96.9%) | 8 (3.2%) |
| 6 to 18 Years | 739 (94.5%) | 43 (5.5%) |
| 19 to 25 Years | 448 (82.5%) | 95 (17.5%) |
| 26 to 34 Years | 583 (83.2%) | 118 (16.8%) |
| 35 to 44 Years | 526 (90.7%) | 54 (9.3%) |
| 45 to 54 Years | 536 (96.9%) | 17 (3.1%) |
| 55 to 64 Years | 435 (75.1%) | 144 (24.9%) |
| 65 to 74 Years | 659 (100.0%) | 0 (0.0%) |
| 75 Years and older | 462 (100.0%) | 0 (0.0%) |
| Total | 4,634 (90.6%) | 479 (9.4%) |
Health Insurance Coverage by Citizenship Status in Linton
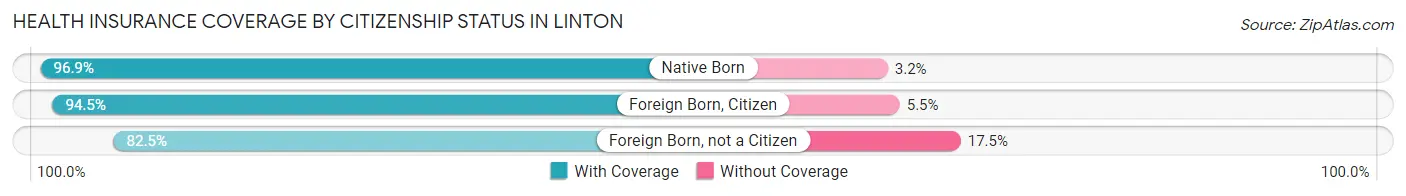
| Citizenship Status | With Coverage | Without Coverage |
| Native Born | 246 (96.9%) | 8 (3.2%) |
| Foreign Born, Citizen | 739 (94.5%) | 43 (5.5%) |
| Foreign Born, not a Citizen | 448 (82.5%) | 95 (17.5%) |
Health Insurance Coverage by Household Income in Linton
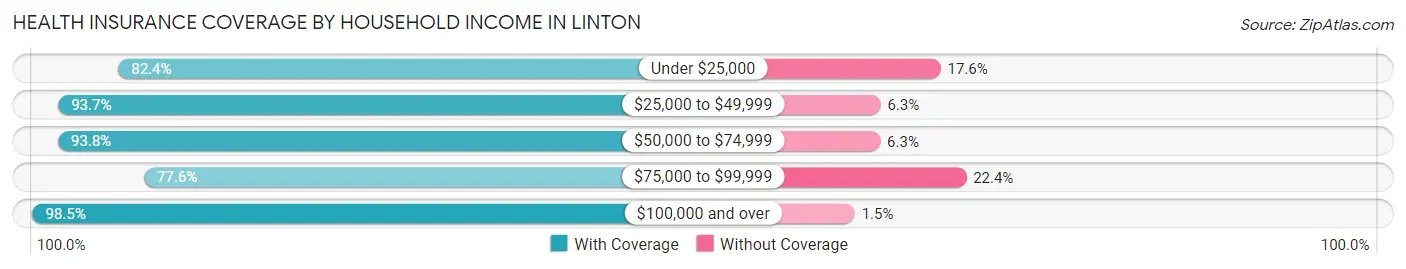
| Household Income | With Coverage | Without Coverage |
| Under $25,000 | 803 (82.4%) | 171 (17.6%) |
| $25,000 to $49,999 | 1,247 (93.7%) | 84 (6.3%) |
| $50,000 to $74,999 | 1,095 (93.8%) | 73 (6.2%) |
| $75,000 to $99,999 | 472 (77.6%) | 136 (22.4%) |
| $100,000 and over | 1,000 (98.5%) | 15 (1.5%) |
Public vs Private Health Insurance Coverage by Age in Linton
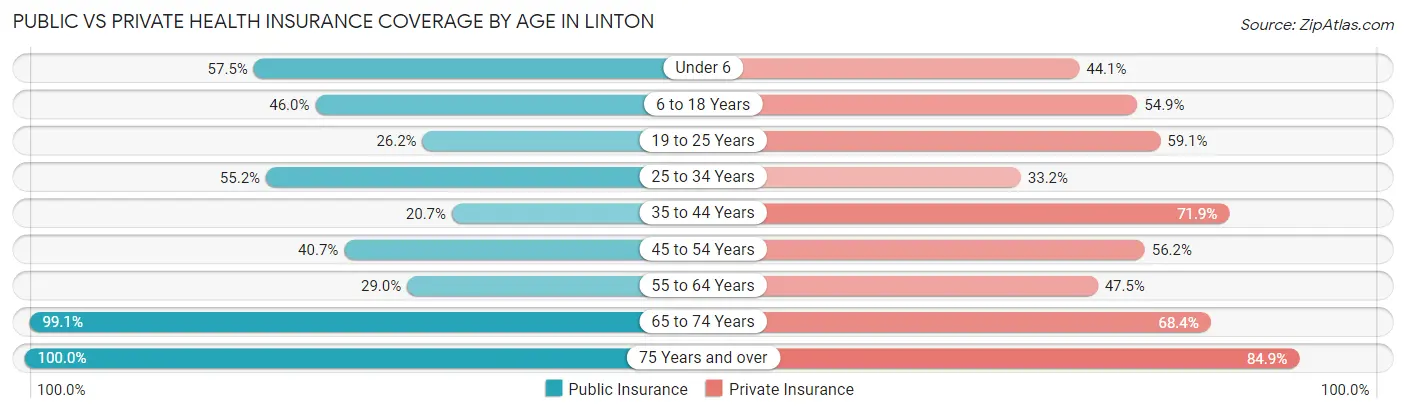
| Age Bracket | Public Insurance | Private Insurance |
| Under 6 | 146 (57.5%) | 112 (44.1%) |
| 6 to 18 Years | 360 (46.0%) | 429 (54.9%) |
| 19 to 25 Years | 142 (26.2%) | 321 (59.1%) |
| 25 to 34 Years | 387 (55.2%) | 233 (33.2%) |
| 35 to 44 Years | 120 (20.7%) | 417 (71.9%) |
| 45 to 54 Years | 225 (40.7%) | 311 (56.2%) |
| 55 to 64 Years | 168 (29.0%) | 275 (47.5%) |
| 65 to 74 Years | 653 (99.1%) | 451 (68.4%) |
| 75 Years and over | 462 (100.0%) | 392 (84.9%) |
| Total | 2,663 (52.1%) | 2,941 (57.5%) |
Disability Status by Sex by Age in Linton
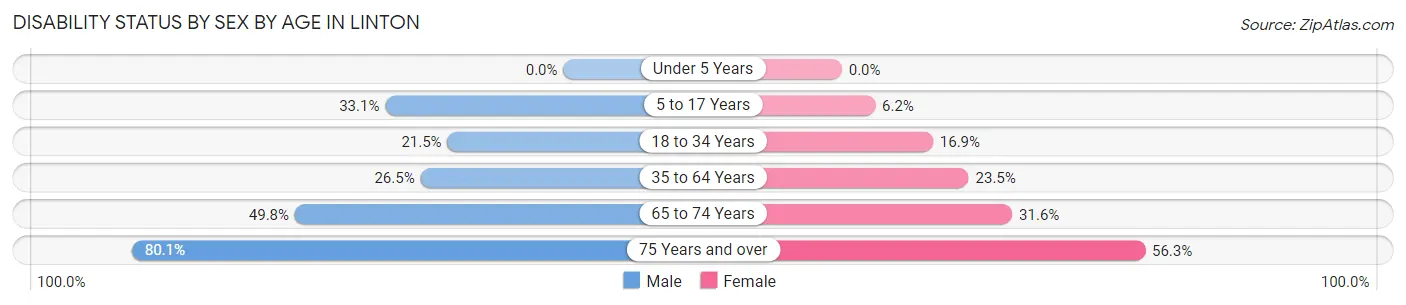
| Age Bracket | Male | Female |
| Under 5 Years | 0 (0.0%) | 0 (0.0%) |
| 5 to 17 Years | 121 (33.1%) | 22 (6.2%) |
| 18 to 34 Years | 134 (21.5%) | 119 (16.9%) |
| 35 to 64 Years | 222 (26.5%) | 206 (23.5%) |
| 65 to 74 Years | 144 (49.8%) | 117 (31.6%) |
| 75 Years and over | 185 (80.1%) | 130 (56.3%) |
Disability Class by Sex by Age in Linton
Disability Class: Hearing Difficulty
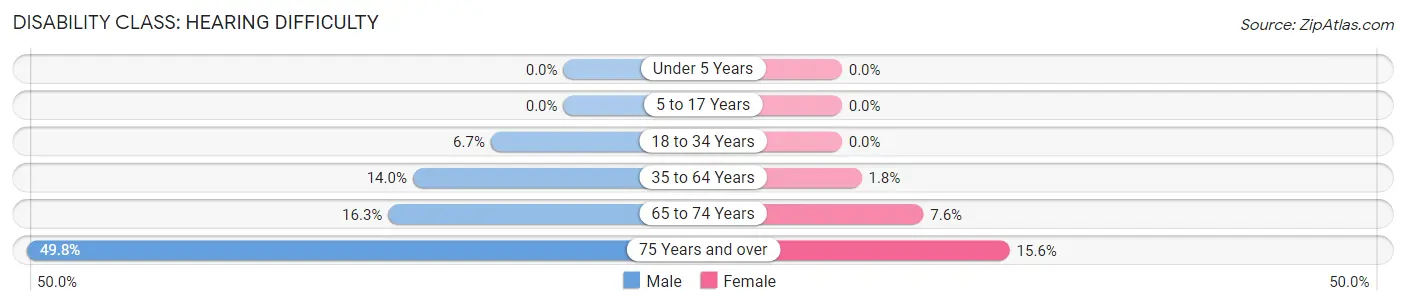
| Age Bracket | Male | Female |
| Under 5 Years | 0 (0.0%) | 0 (0.0%) |
| 5 to 17 Years | 0 (0.0%) | 0 (0.0%) |
| 18 to 34 Years | 42 (6.7%) | 0 (0.0%) |
| 35 to 64 Years | 117 (14.0%) | 16 (1.8%) |
| 65 to 74 Years | 47 (16.3%) | 28 (7.6%) |
| 75 Years and over | 115 (49.8%) | 36 (15.6%) |
Disability Class: Vision Difficulty
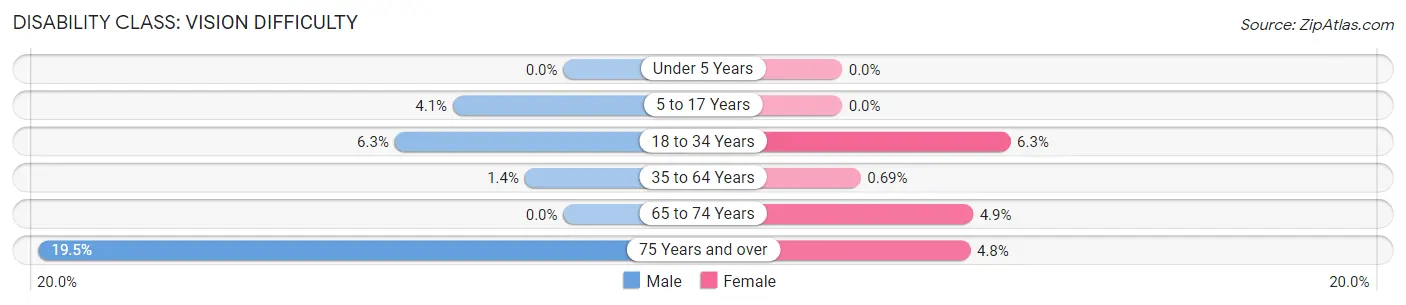
| Age Bracket | Male | Female |
| Under 5 Years | 0 (0.0%) | 0 (0.0%) |
| 5 to 17 Years | 15 (4.1%) | 0 (0.0%) |
| 18 to 34 Years | 39 (6.3%) | 44 (6.2%) |
| 35 to 64 Years | 12 (1.4%) | 6 (0.7%) |
| 65 to 74 Years | 0 (0.0%) | 18 (4.9%) |
| 75 Years and over | 45 (19.5%) | 11 (4.8%) |
Disability Class: Cognitive Difficulty
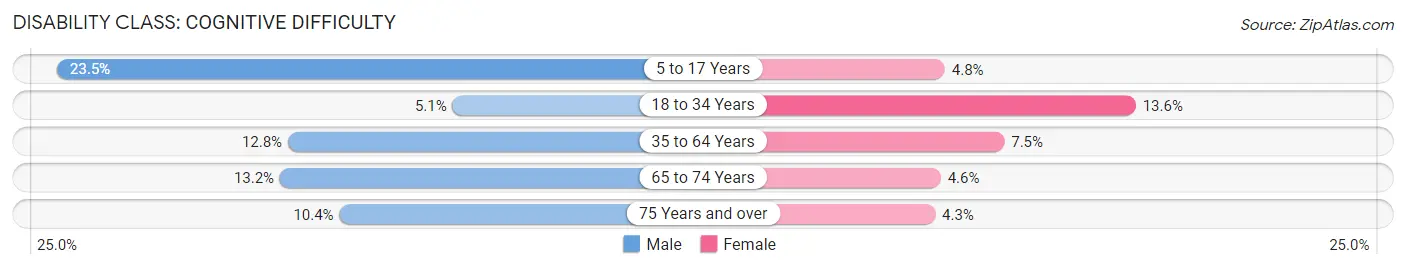
| Age Bracket | Male | Female |
| 5 to 17 Years | 86 (23.5%) | 17 (4.8%) |
| 18 to 34 Years | 32 (5.1%) | 96 (13.6%) |
| 35 to 64 Years | 107 (12.8%) | 66 (7.5%) |
| 65 to 74 Years | 38 (13.2%) | 17 (4.6%) |
| 75 Years and over | 24 (10.4%) | 10 (4.3%) |
Disability Class: Ambulatory Difficulty
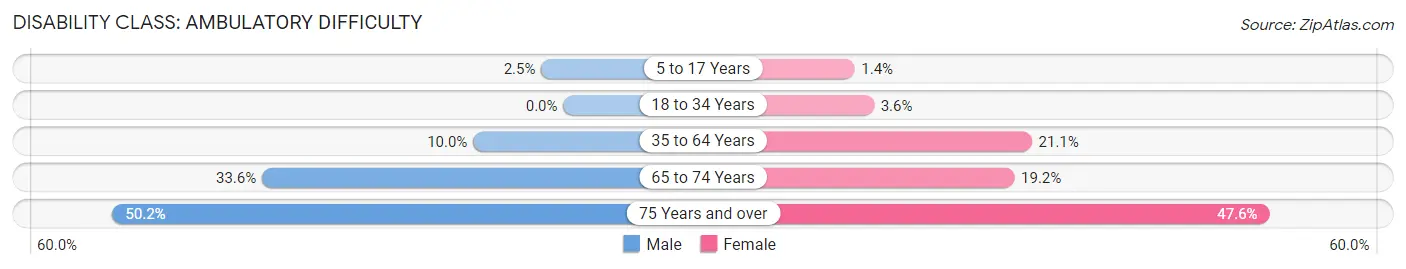
| Age Bracket | Male | Female |
| 5 to 17 Years | 9 (2.5%) | 5 (1.4%) |
| 18 to 34 Years | 0 (0.0%) | 25 (3.5%) |
| 35 to 64 Years | 84 (10.0%) | 185 (21.1%) |
| 65 to 74 Years | 97 (33.6%) | 71 (19.2%) |
| 75 Years and over | 116 (50.2%) | 110 (47.6%) |
Disability Class: Self-Care Difficulty
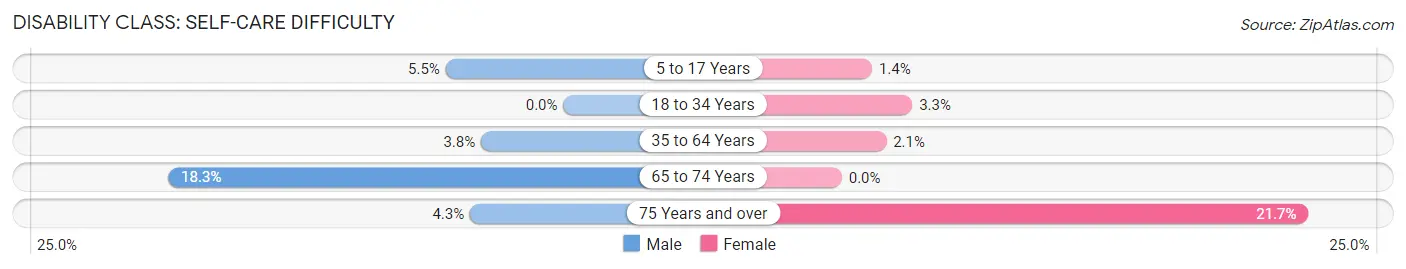
| Age Bracket | Male | Female |
| 5 to 17 Years | 20 (5.5%) | 5 (1.4%) |
| 18 to 34 Years | 0 (0.0%) | 23 (3.3%) |
| 35 to 64 Years | 32 (3.8%) | 18 (2.1%) |
| 65 to 74 Years | 53 (18.3%) | 0 (0.0%) |
| 75 Years and over | 10 (4.3%) | 50 (21.6%) |
Technology Access in Linton
Computing Device Access in Linton
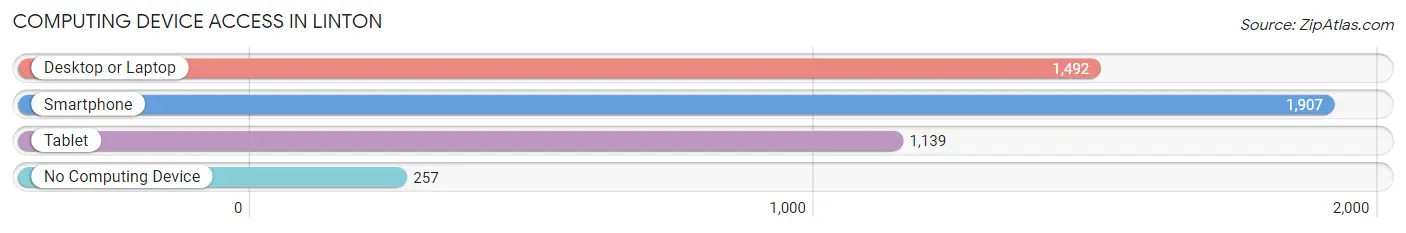
| Device Type | # Households | % Households |
| Desktop or Laptop | 1,492 | 64.0% |
| Smartphone | 1,907 | 81.8% |
| Tablet | 1,139 | 48.9% |
| No Computing Device | 257 | 11.0% |
| Total | 2,331 | 100.0% |
Internet Access in Linton
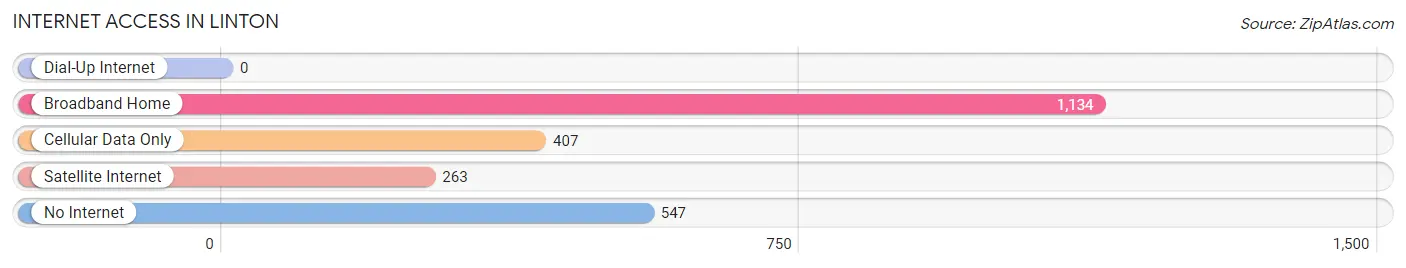
| Internet Type | # Households | % Households |
| Dial-Up Internet | 0 | 0.0% |
| Broadband Home | 1,134 | 48.6% |
| Cellular Data Only | 407 | 17.5% |
| Satellite Internet | 263 | 11.3% |
| No Internet | 547 | 23.5% |
| Total | 2,331 | 100.0% |
Linton Summary
Linton is a city located in Greene County, Indiana, United States. It is the county seat of Greene County and is located in the southwestern part of the state. The population was 5,413 at the 2010 census.
History
Linton was founded in 1837 by William Linton, a local landowner. The town was originally called Lintonville, but the name was changed to Linton in 1839. The town was incorporated in 1859.
Linton was a major coal mining center in the late 19th and early 20th centuries. The coal industry was the main source of employment for the town's residents. The coal mines were closed in the 1950s, and the town's economy shifted to agriculture and manufacturing.
Geography
Linton is located at 39°20'25"N 87°14'45"W (39.340278, -87.245833). It is situated in the southwestern part of Indiana, about 40 miles southwest of Bloomington. The city is located in the Wabash Valley, which is part of the larger Illinois-Indiana-Ohio tri-state area.
The city is situated on the banks of the Wabash River, which forms the city's western boundary. The city is surrounded by rolling hills and farmland. The climate is humid continental, with hot summers and cold winters.
Economy
Linton's economy is largely based on agriculture and manufacturing. The city is home to several manufacturing companies, including a steel mill, a paper mill, and a plastics plant. The city also has a large agricultural sector, with corn, soybeans, and wheat being the main crops.
The city is also home to several retail stores, restaurants, and other businesses. The city is served by two hospitals, a community college, and a vocational school.
Demographics
As of the 2010 census, the population of Linton was 5,413. The racial makeup of the city was 95.3% White, 0.7% African American, 0.3% Native American, 0.3% Asian, 0.1% Pacific Islander, 1.2% from other races, and 2.3% from two or more races. Hispanic or Latino of any race were 3.2% of the population.
The median income for a household in the city was $35,938, and the median income for a family was $45,938. The per capita income for the city was $17,938. About 16.3% of families and 19.2% of the population were below the poverty line, including 25.3% of those under age 18 and 11.2% of those age 65 or over.
The city is served by the Linton-Stockton School Corporation, which consists of two elementary schools, one middle school, and one high school. The city is also home to a branch of the Vincennes University.
Common Questions
What is Per Capita Income in Linton?
Per Capita income in Linton is $24,062.
What is the Median Family Income in Linton?
Median Family Income in Linton is $49,868.
What is the Median Household income in Linton?
Median Household Income in Linton is $38,438.
What is Income or Wage Gap in Linton?
Income or Wage Gap in Linton is 38.0%.
Women in Linton earn 62.0 cents for every dollar earned by a man.
What is Inequality or Gini Index in Linton?
Inequality or Gini Index in Linton is 0.45.
What is the Total Population of Linton?
Total Population of Linton is 5,149.
What is the Total Male Population of Linton?
Total Male Population of Linton is 2,459.
What is the Total Female Population of Linton?
Total Female Population of Linton is 2,690.
What is the Ratio of Males per 100 Females in Linton?
There are 91.41 Males per 100 Females in Linton.
What is the Ratio of Females per 100 Males in Linton?
There are 109.39 Females per 100 Males in Linton.
What is the Median Population Age in Linton?
Median Population Age in Linton is 39.5 Years.
What is the Average Family Size in Linton
Average Family Size in Linton is 2.8 People.
What is the Average Household Size in Linton
Average Household Size in Linton is 2.2 People.
How Large is the Labor Force in Linton?
There are 2,465 People in the Labor Forcein in Linton.
What is the Percentage of People in the Labor Force in Linton?
57.6% of People are in the Labor Force in Linton.
What is the Unemployment Rate in Linton?
Unemployment Rate in Linton is 10.0%.