Zip Codes with the Highest Percentage of Population Employed in Food Preparation & Serving in Elkhart, IN
RELATED REPORTS & OPTIONS
Food Preparation & Serving
Elkhart
Compare Zip Codes
Map of Zip Codes with the Highest Percentage of Population Employed in Food Preparation & Serving in Elkhart
5.4%
6.4%
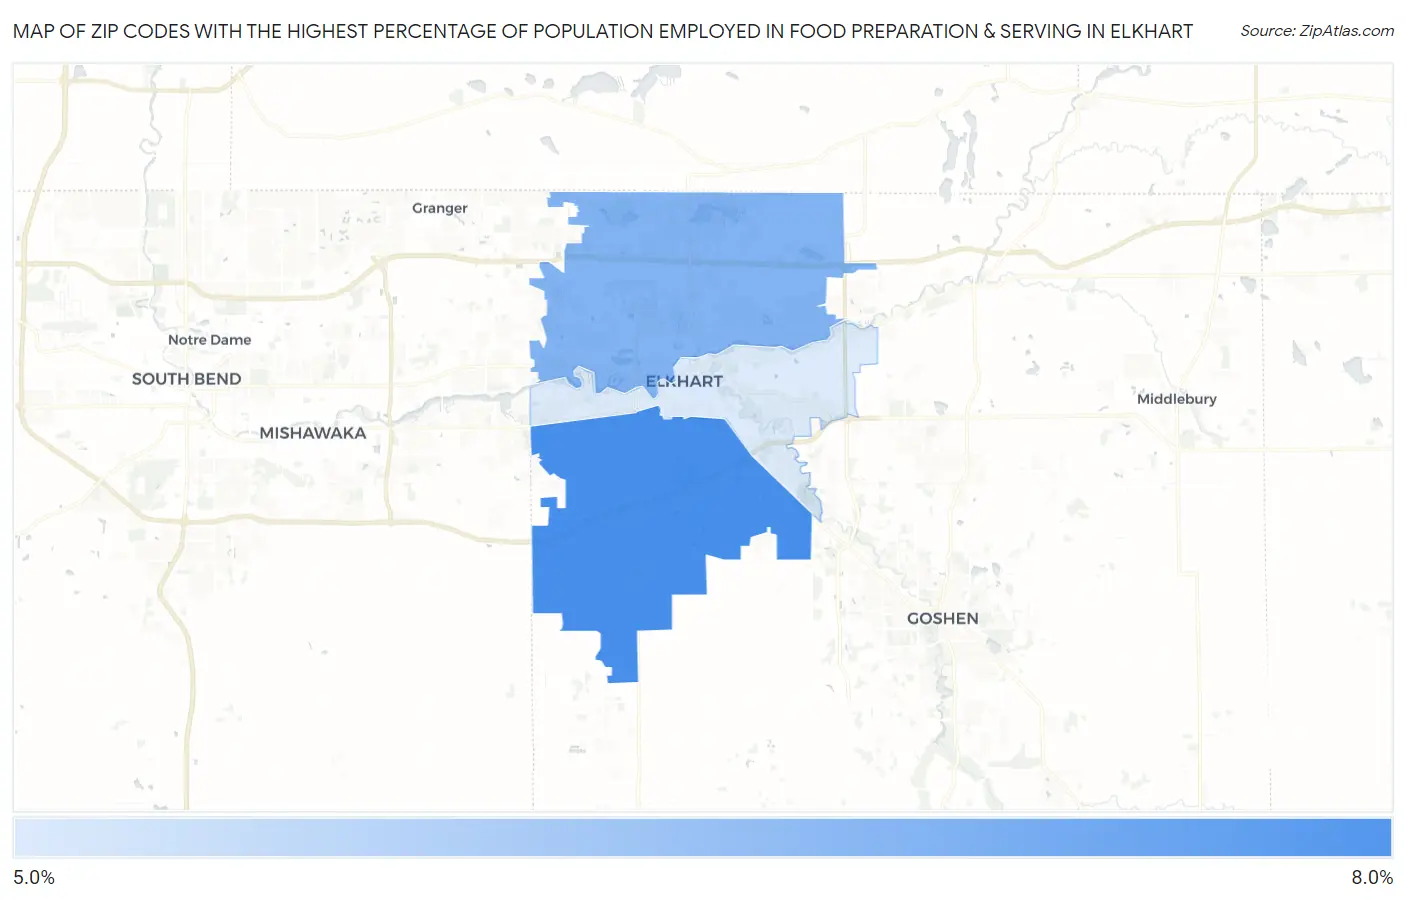
Zip Codes with the Highest Percentage of Population Employed in Food Preparation & Serving in Elkhart, IN
| Zip Code | % Employed | vs State | vs National | |
| 1. | 46517 | 6.4% | 5.3%(+1.13)#185 | 5.3%(+1.16)#8,023 |
| 2. | 46514 | 6.0% | 5.3%(+0.711)#231 | 5.3%(+0.739)#9,259 |
| 3. | 46516 | 5.4% | 5.3%(+0.064)#287 | 5.3%(+0.092)#11,478 |
1
Common Questions
What are the Top Zip Codes with the Highest Percentage of Population Employed in Food Preparation & Serving in Elkhart, IN?
Top Zip Codes with the Highest Percentage of Population Employed in Food Preparation & Serving in Elkhart, IN are:
What zip code has the Highest Percentage of Population Employed in Food Preparation & Serving in Elkhart, IN?
46517 has the Highest Percentage of Population Employed in Food Preparation & Serving in Elkhart, IN with 6.4%.
What is the Percentage of Population Employed in Food Preparation & Serving in Elkhart, IN?
Percentage of Population Employed in Food Preparation & Serving in Elkhart is 6.8%.
What is the Percentage of Population Employed in Food Preparation & Serving in Indiana?
Percentage of Population Employed in Food Preparation & Serving in Indiana is 5.3%.
What is the Percentage of Population Employed in Food Preparation & Serving in the United States?
Percentage of Population Employed in Food Preparation & Serving in the United States is 5.3%.