Zip Codes with the Highest Percentage of Population Employed in Food Preparation & Serving in Columbus, IN
RELATED REPORTS & OPTIONS
Food Preparation & Serving
Columbus
Compare Zip Codes
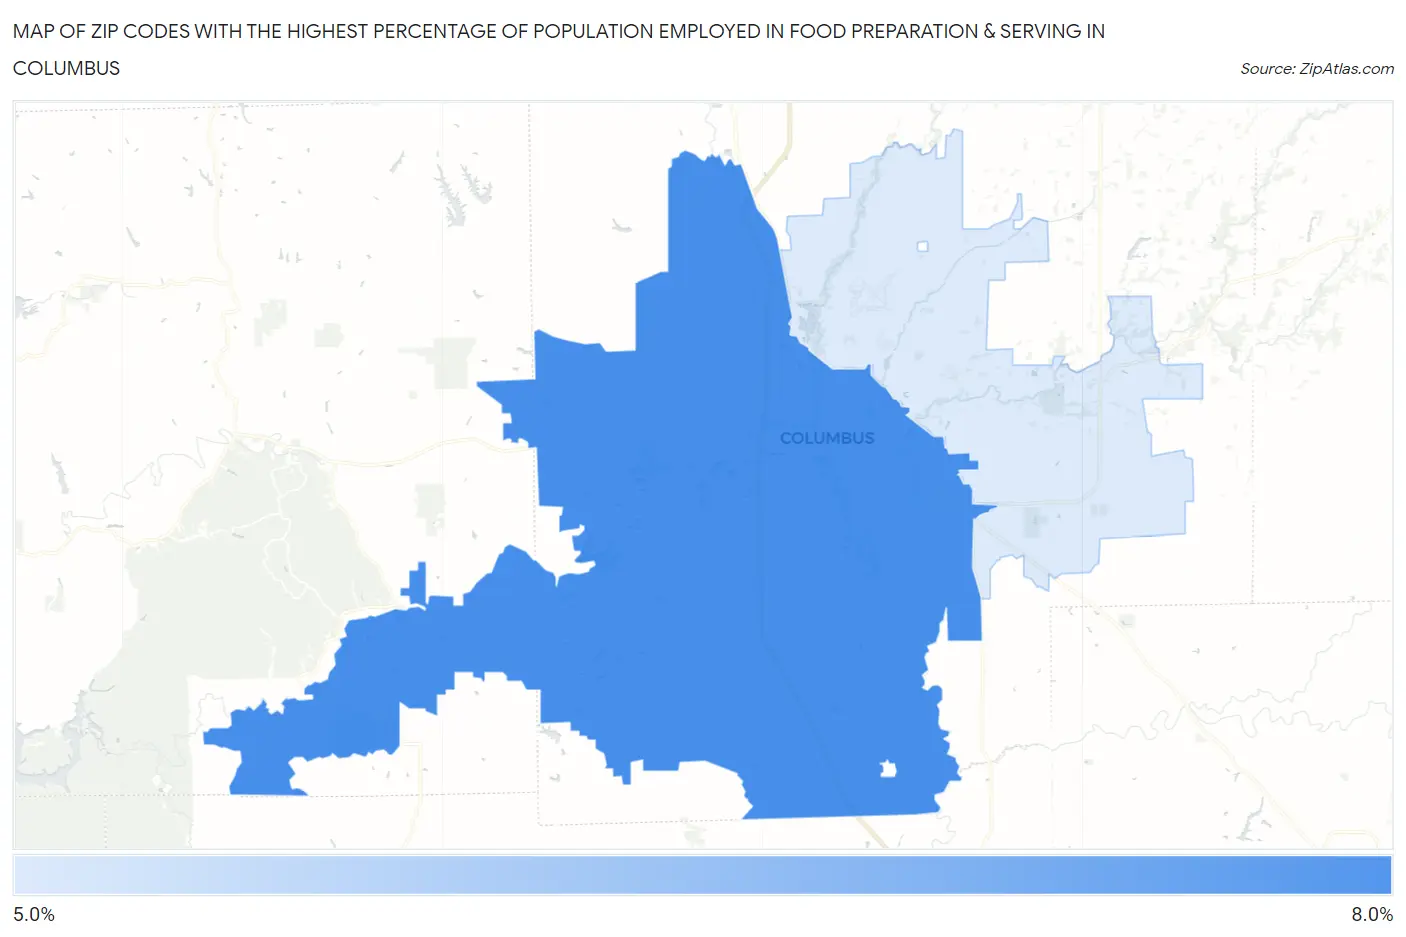
Map of Zip Codes with the Highest Percentage of Population Employed in Food Preparation & Serving in Columbus
5.9%
6.2%
Zip Codes with the Highest Percentage of Population Employed in Food Preparation & Serving in Columbus, IN
| Zip Code | % Employed | vs State | vs National | |
| 1. | 47201 | 6.2% | 5.3%(+0.877)#213 | 5.3%(+0.905)#8,762 |
| 2. | 47203 | 5.9% | 5.3%(+0.614)#245 | 5.3%(+0.642)#9,582 |
1
Common Questions
What are the Top Zip Codes with the Highest Percentage of Population Employed in Food Preparation & Serving in Columbus, IN?
Top Zip Codes with the Highest Percentage of Population Employed in Food Preparation & Serving in Columbus, IN are:
What zip code has the Highest Percentage of Population Employed in Food Preparation & Serving in Columbus, IN?
47201 has the Highest Percentage of Population Employed in Food Preparation & Serving in Columbus, IN with 6.2%.
What is the Percentage of Population Employed in Food Preparation & Serving in Columbus, IN?
Percentage of Population Employed in Food Preparation & Serving in Columbus is 5.5%.
What is the Percentage of Population Employed in Food Preparation & Serving in Indiana?
Percentage of Population Employed in Food Preparation & Serving in Indiana is 5.3%.
What is the Percentage of Population Employed in Food Preparation & Serving in the United States?
Percentage of Population Employed in Food Preparation & Serving in the United States is 5.3%.