Zip Codes with the Highest Percentage of Population Employed in Food Preparation & Serving in Marion, IN
RELATED REPORTS & OPTIONS
Food Preparation & Serving
Marion
Compare Zip Codes
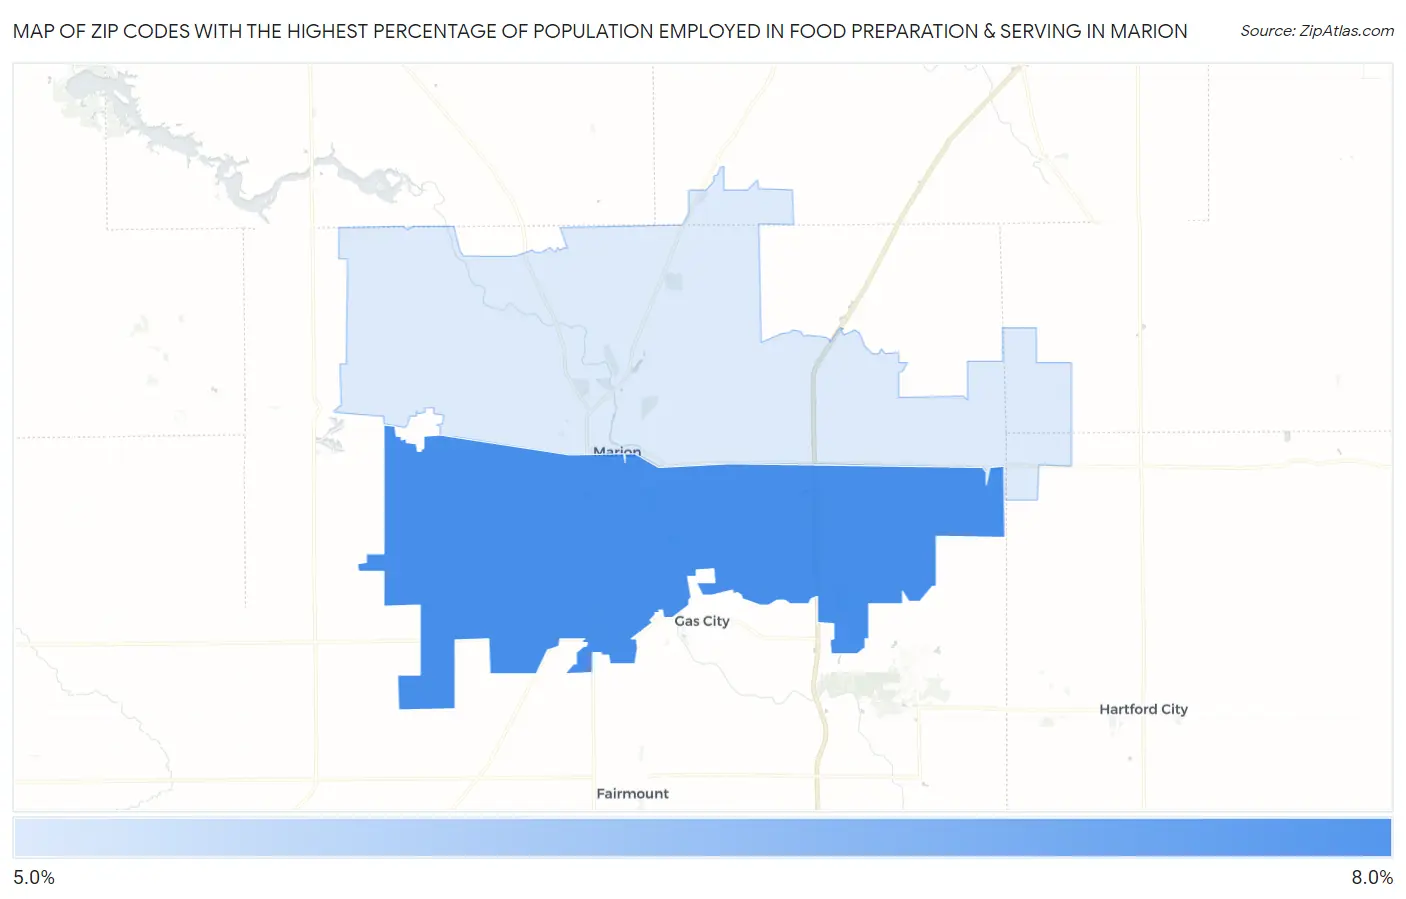
Map of Zip Codes with the Highest Percentage of Population Employed in Food Preparation & Serving in Marion
5.5%
6.6%
Zip Codes with the Highest Percentage of Population Employed in Food Preparation & Serving in Marion, IN
| Zip Code | % Employed | vs State | vs National | |
| 1. | 46953 | 6.6% | 5.3%(+1.28)#176 | 5.3%(+1.31)#7,623 |
| 2. | 46952 | 5.5% | 5.3%(+0.219)#276 | 5.3%(+0.248)#10,950 |
1
Common Questions
What are the Top Zip Codes with the Highest Percentage of Population Employed in Food Preparation & Serving in Marion, IN?
Top Zip Codes with the Highest Percentage of Population Employed in Food Preparation & Serving in Marion, IN are:
What zip code has the Highest Percentage of Population Employed in Food Preparation & Serving in Marion, IN?
46953 has the Highest Percentage of Population Employed in Food Preparation & Serving in Marion, IN with 6.6%.
What is the Percentage of Population Employed in Food Preparation & Serving in Indiana?
Percentage of Population Employed in Food Preparation & Serving in Indiana is 5.3%.
What is the Percentage of Population Employed in Food Preparation & Serving in the United States?
Percentage of Population Employed in Food Preparation & Serving in the United States is 5.3%.