Boston, IN Map & Demographics
Boston Map
Boston Overview
$18,749
PER CAPITA INCOME
$56,750
AVG FAMILY INCOME
$55,750
AVG HOUSEHOLD INCOME
0.41
INEQUALITY / GINI INDEX
227
TOTAL POPULATION
79
MALE POPULATION
148
FEMALE POPULATION
53.38
MALES / 100 FEMALES
187.34
FEMALES / 100 MALES
39.3
MEDIAN AGE
2.9
AVG FAMILY SIZE
3.0
AVG HOUSEHOLD SIZE
113
LABOR FORCE [ PEOPLE ]
66.9%
PERCENT IN LABOR FORCE
8.0%
UNEMPLOYMENT RATE
Boston Zip Codes
Boston Area Codes
Income in Boston
Income Overview in Boston
Per Capita Income in Boston is $18,749, while median incomes of families and households are $56,750 and $55,750 respectively.
| Characteristic | Number | Measure |
| Per Capita Income | 227 | $18,749 |
| Median Family Income | 69 | $56,750 |
| Mean Family Income | 69 | $54,888 |
| Median Household Income | 77 | $55,750 |
| Mean Household Income | 77 | $52,935 |
| Income Deficit | 69 | $0 |
| Wage / Income Gap (%) | 227 | 0.00% |
| Wage / Income Gap ($) | 227 | 100.00¢ per $1 |
| Gini / Inequality Index | 227 | 0.41 |
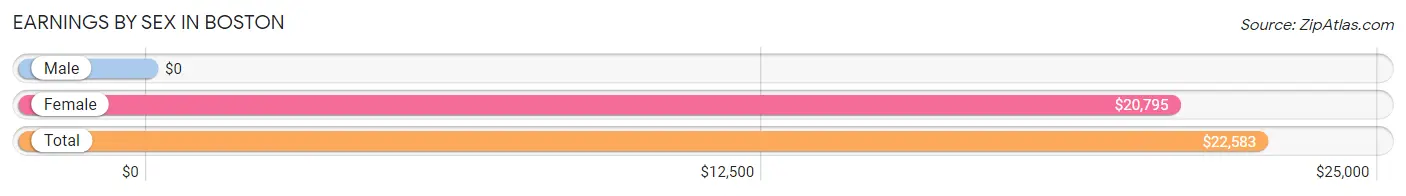
Earnings by Sex in Boston
| Sex | Number | Average Earnings |
| Male | 47 (39.5%) | $0 |
| Female | 72 (60.5%) | $20,795 |
| Total | 119 (100.0%) | $22,583 |
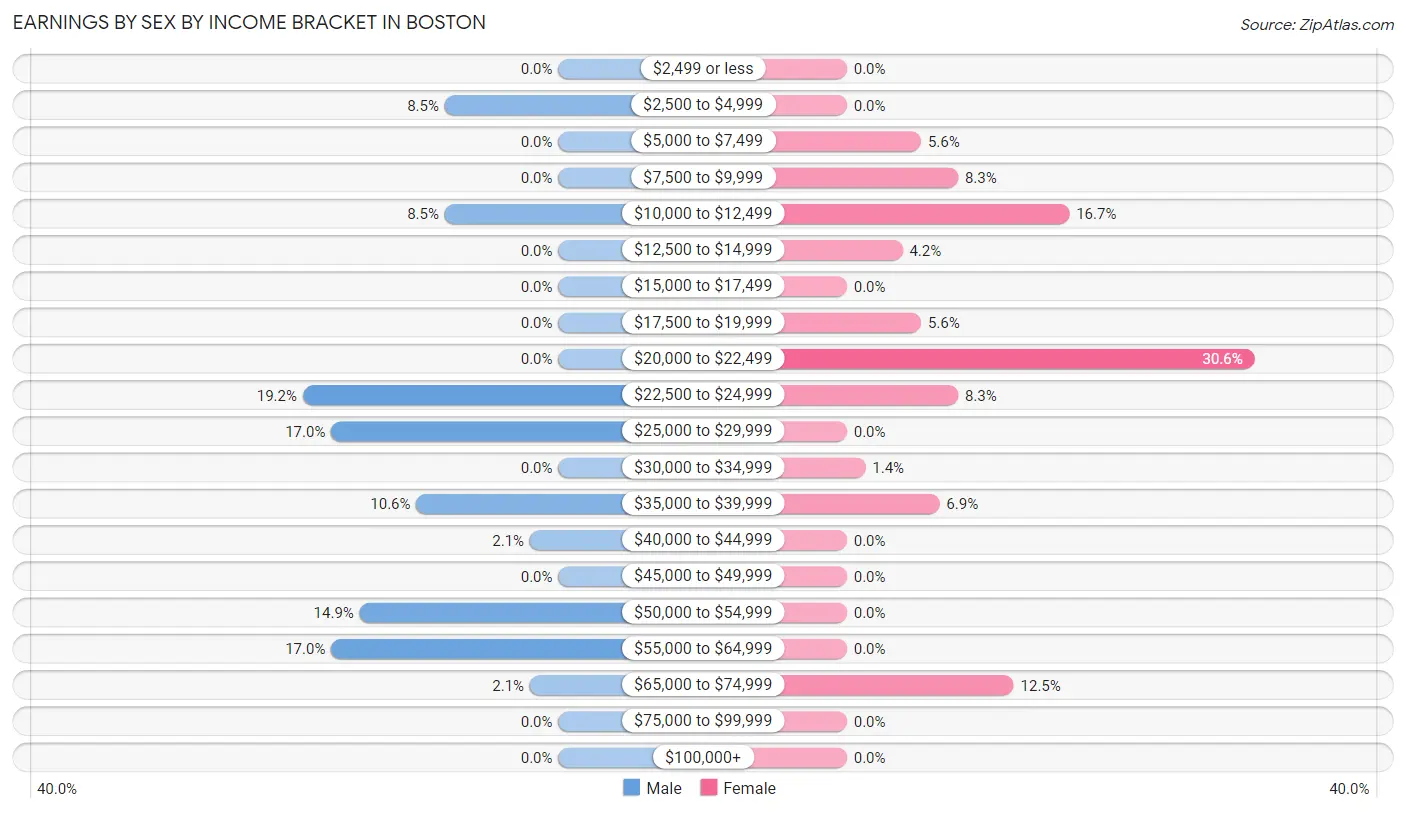
Earnings by Sex by Income Bracket in Boston
The most common earnings brackets in Boston are $22,500 to $24,999 for men (9 | 19.2%) and $20,000 to $22,499 for women (22 | 30.6%).
| Income | Male | Female |
| $2,499 or less | 0 (0.0%) | 0 (0.0%) |
| $2,500 to $4,999 | 4 (8.5%) | 0 (0.0%) |
| $5,000 to $7,499 | 0 (0.0%) | 4 (5.6%) |
| $7,500 to $9,999 | 0 (0.0%) | 6 (8.3%) |
| $10,000 to $12,499 | 4 (8.5%) | 12 (16.7%) |
| $12,500 to $14,999 | 0 (0.0%) | 3 (4.2%) |
| $15,000 to $17,499 | 0 (0.0%) | 0 (0.0%) |
| $17,500 to $19,999 | 0 (0.0%) | 4 (5.6%) |
| $20,000 to $22,499 | 0 (0.0%) | 22 (30.6%) |
| $22,500 to $24,999 | 9 (19.2%) | 6 (8.3%) |
| $25,000 to $29,999 | 8 (17.0%) | 0 (0.0%) |
| $30,000 to $34,999 | 0 (0.0%) | 1 (1.4%) |
| $35,000 to $39,999 | 5 (10.6%) | 5 (6.9%) |
| $40,000 to $44,999 | 1 (2.1%) | 0 (0.0%) |
| $45,000 to $49,999 | 0 (0.0%) | 0 (0.0%) |
| $50,000 to $54,999 | 7 (14.9%) | 0 (0.0%) |
| $55,000 to $64,999 | 8 (17.0%) | 0 (0.0%) |
| $65,000 to $74,999 | 1 (2.1%) | 9 (12.5%) |
| $75,000 to $99,999 | 0 (0.0%) | 0 (0.0%) |
| $100,000+ | 0 (0.0%) | 0 (0.0%) |
| Total | 47 (100.0%) | 72 (100.0%) |
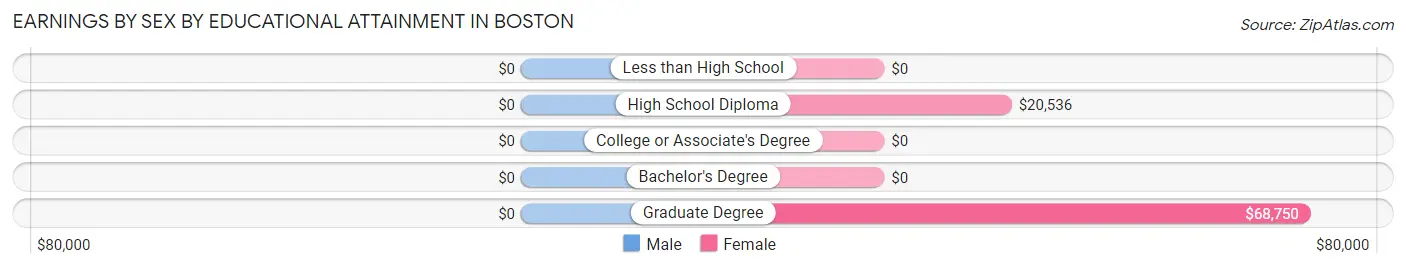
Earnings by Sex by Educational Attainment in Boston
| Educational Attainment | Male Income | Female Income |
| Less than High School | - | - |
| High School Diploma | - | - |
| College or Associate's Degree | - | - |
| Bachelor's Degree | - | - |
| Graduate Degree | - | - |
| Total | $38,750 | $21,648 |
Family Income in Boston
Family Income Brackets in Boston
According to the Boston family income data, there are 28 families falling into the $50,000 to $74,999 income range, which is the most common income bracket and makes up 40.6% of all families.
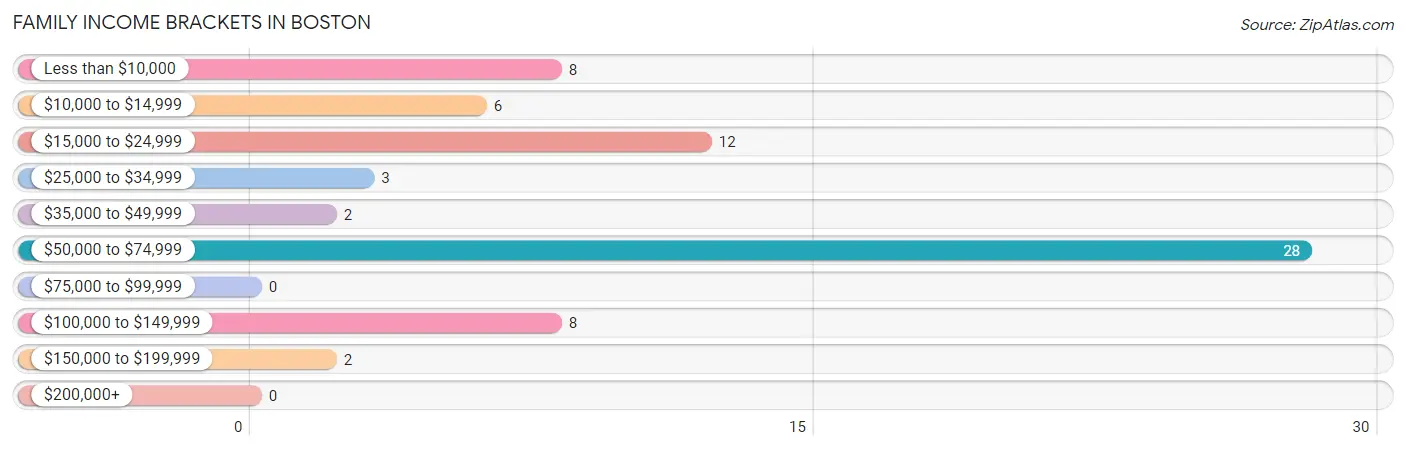
| Income Bracket | # Families | % Families |
| Less than $10,000 | 8 | 11.6% |
| $10,000 to $14,999 | 6 | 8.7% |
| $15,000 to $24,999 | 12 | 17.4% |
| $25,000 to $34,999 | 3 | 4.3% |
| $35,000 to $49,999 | 2 | 2.9% |
| $50,000 to $74,999 | 28 | 40.6% |
| $75,000 to $99,999 | 0 | 0.0% |
| $100,000 to $149,999 | 8 | 11.6% |
| $150,000 to $199,999 | 2 | 2.9% |
| $200,000+ | 0 | 0.0% |
Family Income by Famaliy Size in Boston
2-person families (35 | 50.7%) account for the highest median family income in Boston with $55,625 per family, while 2-person families (35 | 50.7%) have the highest median income of $27,812 per family member.
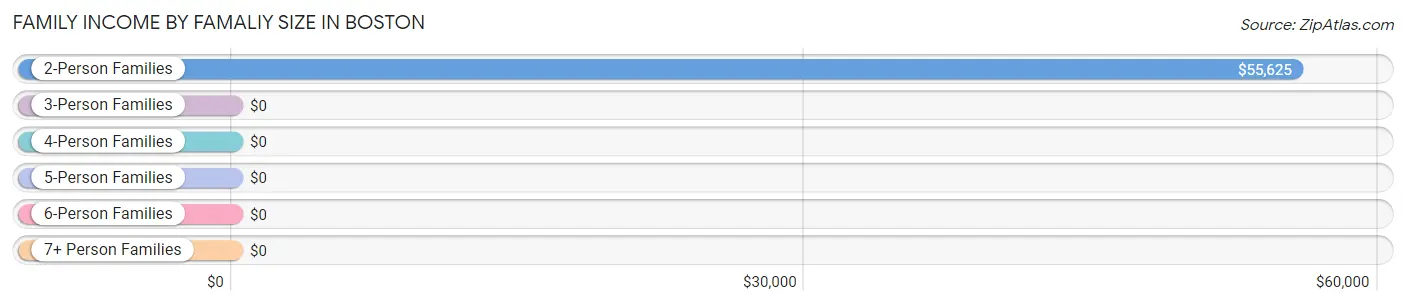
| Income Bracket | # Families | Median Income |
| 2-Person Families | 35 (50.7%) | $55,625 |
| 3-Person Families | 19 (27.5%) | $0 |
| 4-Person Families | 12 (17.4%) | $0 |
| 5-Person Families | 2 (2.9%) | $0 |
| 6-Person Families | 1 (1.5%) | $0 |
| 7+ Person Families | 0 (0.0%) | $0 |
| Total | 69 (100.0%) | $56,750 |
Family Income by Number of Earners in Boston
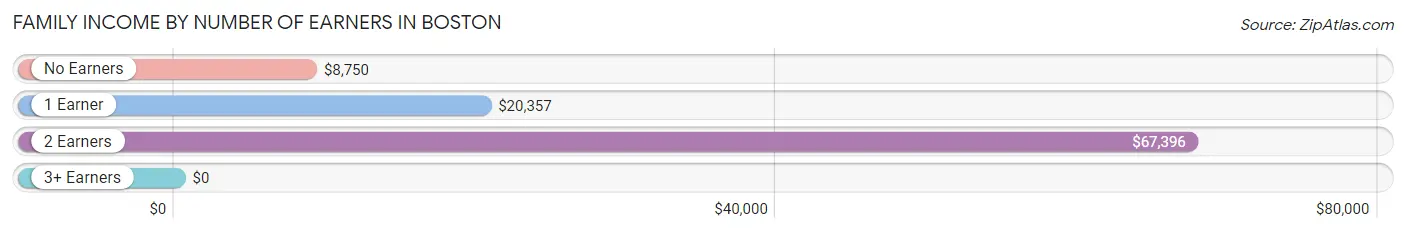
| Number of Earners | # Families | Median Income |
| No Earners | 13 (18.8%) | $8,750 |
| 1 Earner | 20 (29.0%) | $20,357 |
| 2 Earners | 29 (42.0%) | $67,396 |
| 3+ Earners | 7 (10.1%) | $0 |
| Total | 69 (100.0%) | $56,750 |
Household Income in Boston
Household Income Brackets in Boston
With 30 households falling in the category, the $50,000 to $74,999 income range is the most frequent in Boston, accounting for 39.0% of all households.
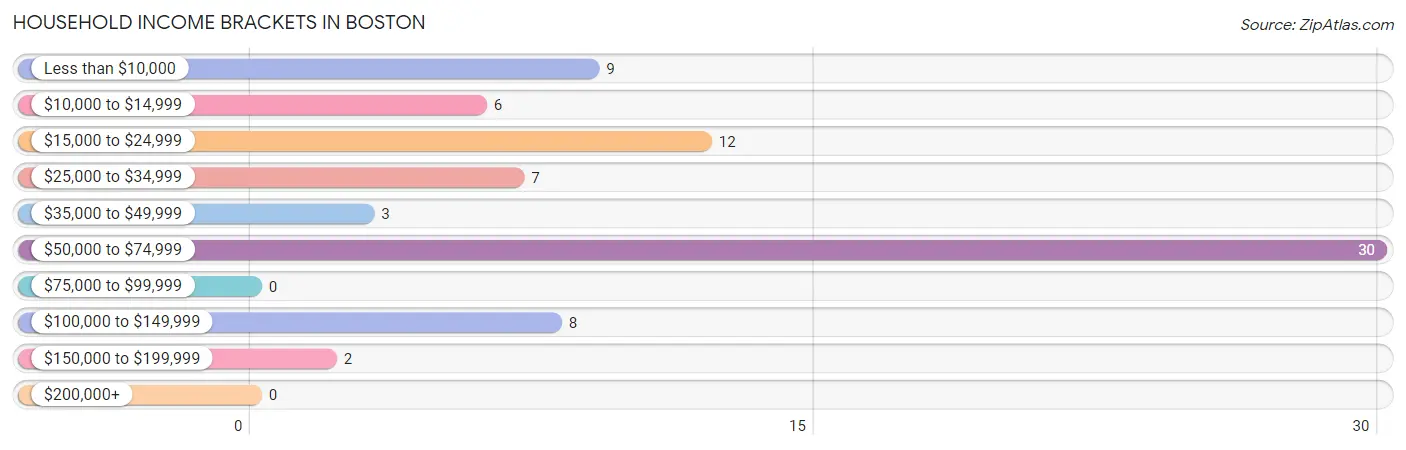
| Income Bracket | # Households | % Households |
| Less than $10,000 | 9 | 11.7% |
| $10,000 to $14,999 | 6 | 7.8% |
| $15,000 to $24,999 | 12 | 15.6% |
| $25,000 to $34,999 | 7 | 9.1% |
| $35,000 to $49,999 | 3 | 3.9% |
| $50,000 to $74,999 | 30 | 39.0% |
| $75,000 to $99,999 | 0 | 0.0% |
| $100,000 to $149,999 | 8 | 10.4% |
| $150,000 to $199,999 | 2 | 2.6% |
| $200,000+ | 0 | 0.0% |
Household Income by Householder Age in Boston
The median household income in Boston is $55,750, with the highest median household income of $66,042 found in the 45 to 64 years age bracket for the primary householder. A total of 36 households (46.8%) fall into this category.
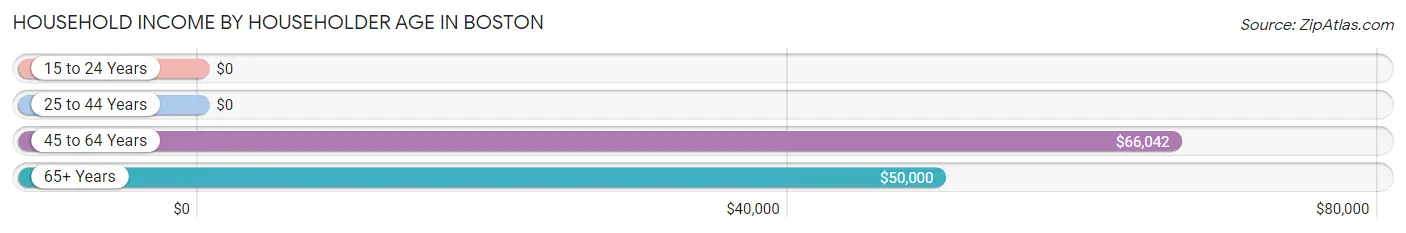
| Income Bracket | # Households | Median Income |
| 15 to 24 Years | 0 (0.0%) | $0 |
| 25 to 44 Years | 29 (37.7%) | $0 |
| 45 to 64 Years | 36 (46.8%) | $66,042 |
| 65+ Years | 12 (15.6%) | $50,000 |
| Total | 77 (100.0%) | $55,750 |
Poverty in Boston
Income Below Poverty by Sex and Age in Boston
With 36.5% poverty level for males and 37.2% for females among the residents of Boston, 5 year old males and 12 to 14 year old females are the most vulnerable to poverty, with 3 males (100.0%) and 5 females (100.0%) in their respective age groups living below the poverty level.
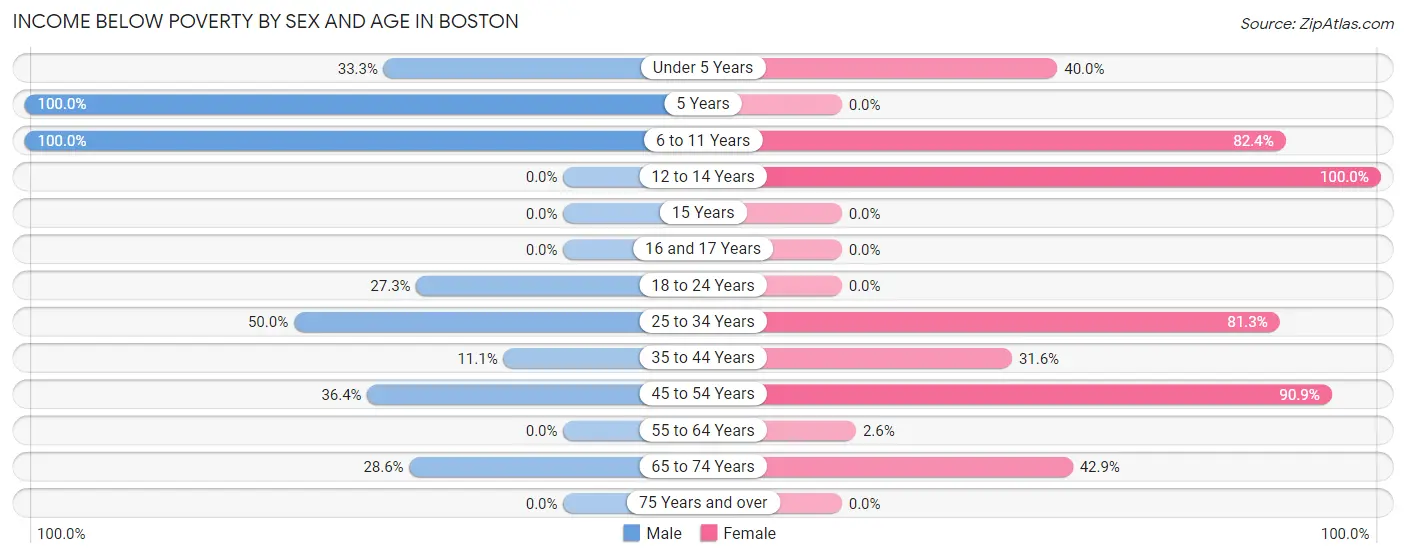
| Age Bracket | Male | Female |
| Under 5 Years | 1 (33.3%) | 2 (40.0%) |
| 5 Years | 3 (100.0%) | 0 (0.0%) |
| 6 to 11 Years | 8 (100.0%) | 14 (82.4%) |
| 12 to 14 Years | 0 (0.0%) | 5 (100.0%) |
| 15 Years | 0 (0.0%) | 0 (0.0%) |
| 16 and 17 Years | 0 (0.0%) | 0 (0.0%) |
| 18 to 24 Years | 3 (27.3%) | 0 (0.0%) |
| 25 to 34 Years | 5 (50.0%) | 13 (81.2%) |
| 35 to 44 Years | 1 (11.1%) | 6 (31.6%) |
| 45 to 54 Years | 4 (36.4%) | 10 (90.9%) |
| 55 to 64 Years | 0 (0.0%) | 1 (2.6%) |
| 65 to 74 Years | 2 (28.6%) | 3 (42.9%) |
| 75 Years and over | 0 (0.0%) | 0 (0.0%) |
| Total | 27 (36.5%) | 54 (37.2%) |
Income Above Poverty by Sex and Age in Boston
According to the poverty statistics in Boston, males aged 55 to 64 years and females aged 15 years are the age groups that are most secure financially, with 100.0% of males and 100.0% of females in these age groups living above the poverty line.
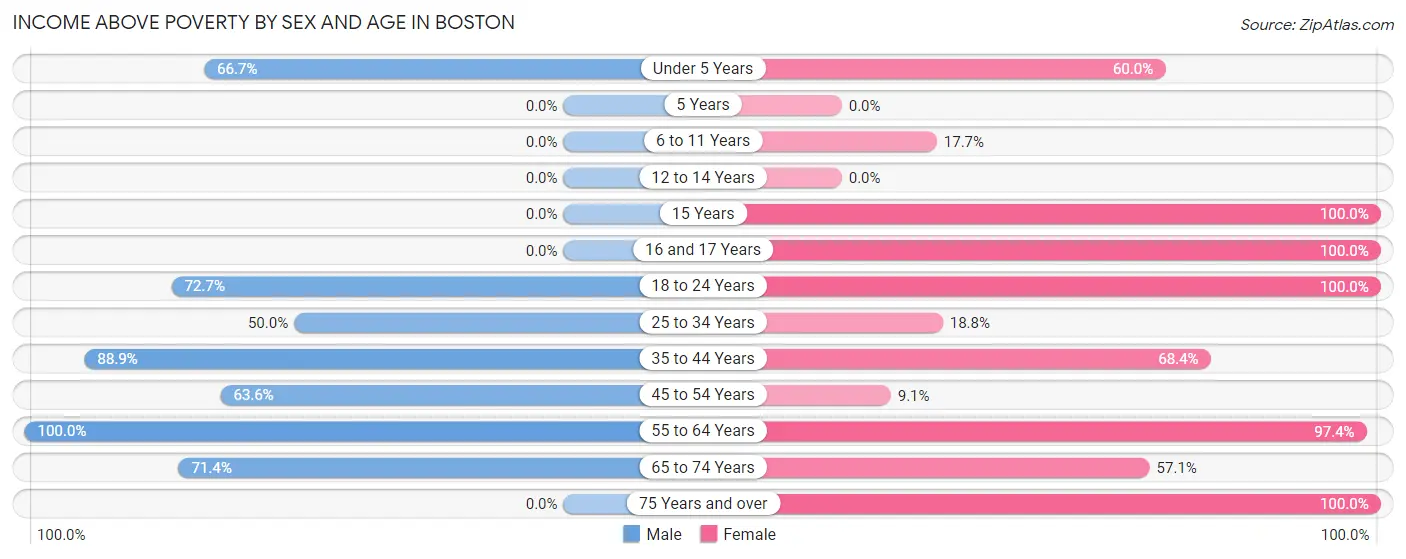
| Age Bracket | Male | Female |
| Under 5 Years | 2 (66.7%) | 3 (60.0%) |
| 5 Years | 0 (0.0%) | 0 (0.0%) |
| 6 to 11 Years | 0 (0.0%) | 3 (17.6%) |
| 12 to 14 Years | 0 (0.0%) | 0 (0.0%) |
| 15 Years | 0 (0.0%) | 9 (100.0%) |
| 16 and 17 Years | 0 (0.0%) | 11 (100.0%) |
| 18 to 24 Years | 8 (72.7%) | 4 (100.0%) |
| 25 to 34 Years | 5 (50.0%) | 3 (18.8%) |
| 35 to 44 Years | 8 (88.9%) | 13 (68.4%) |
| 45 to 54 Years | 7 (63.6%) | 1 (9.1%) |
| 55 to 64 Years | 12 (100.0%) | 37 (97.4%) |
| 65 to 74 Years | 5 (71.4%) | 4 (57.1%) |
| 75 Years and over | 0 (0.0%) | 3 (100.0%) |
| Total | 47 (63.5%) | 91 (62.8%) |
Income Below Poverty Among Married-Couple Families in Boston
The poverty statistics for married-couple families in Boston show that 13.5% or 5 of the total 37 families live below the poverty line. Families with 1 or 2 children have the highest poverty rate of 62.5%, comprising of 5 families. On the other hand, families with no children have the lowest poverty rate of 0.0%, which includes 0 families.
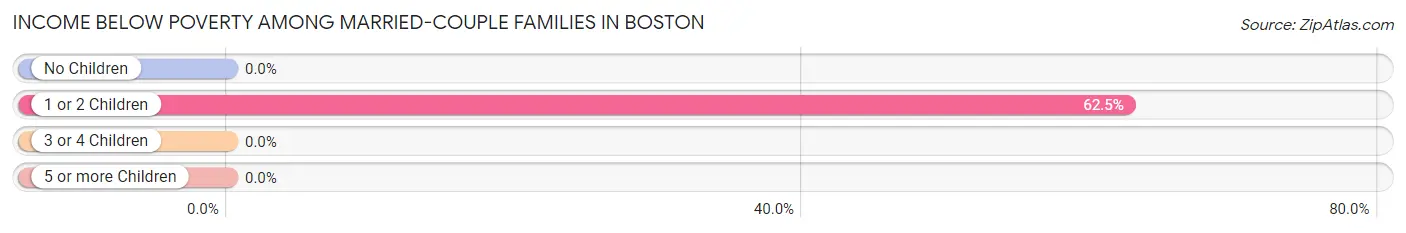
| Children | Above Poverty | Below Poverty |
| No Children | 29 (100.0%) | 0 (0.0%) |
| 1 or 2 Children | 3 (37.5%) | 5 (62.5%) |
| 3 or 4 Children | 0 (0.0%) | 0 (0.0%) |
| 5 or more Children | 0 (0.0%) | 0 (0.0%) |
| Total | 32 (86.5%) | 5 (13.5%) |
Income Below Poverty Among Single-Parent Households in Boston
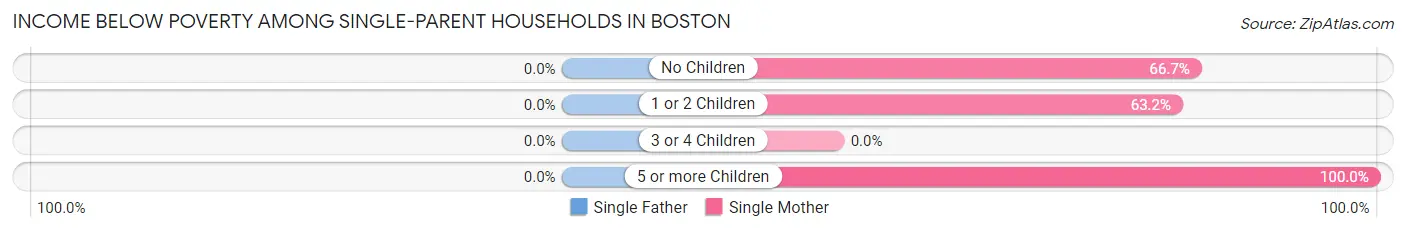
| Children | Single Father | Single Mother |
| No Children | 0 (0.0%) | 8 (66.7%) |
| 1 or 2 Children | 0 (0.0%) | 12 (63.2%) |
| 3 or 4 Children | 0 (0.0%) | 0 (0.0%) |
| 5 or more Children | 0 (0.0%) | 1 (100.0%) |
| Total | 0 (0.0%) | 21 (65.6%) |
Income Below Poverty Among Married-Couple vs Single-Parent Households in Boston
The poverty data for Boston shows that 5 of the married-couple family households (13.5%) and 21 of the single-parent households (65.6%) are living below the poverty level. Within the married-couple family households, those with 1 or 2 children have the highest poverty rate, with 5 households (62.5%) falling below the poverty line. Among the single-parent households, those with 5 or more children have the highest poverty rate, with 1 household (100.0%) living below poverty.
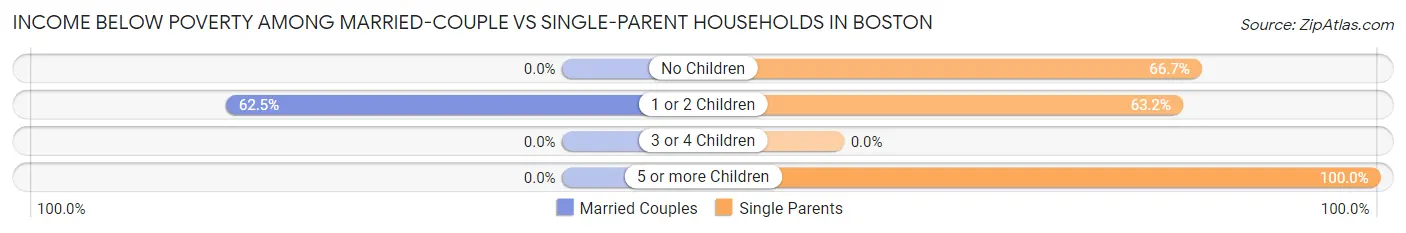
| Children | Married-Couple Families | Single-Parent Households |
| No Children | 0 (0.0%) | 8 (66.7%) |
| 1 or 2 Children | 5 (62.5%) | 12 (63.2%) |
| 3 or 4 Children | 0 (0.0%) | 0 (0.0%) |
| 5 or more Children | 0 (0.0%) | 1 (100.0%) |
| Total | 5 (13.5%) | 21 (65.6%) |
Race in Boston
The most populous races in Boston are White / Caucasian (219 | 96.5%), Two or more Races (8 | 3.5%), and Hispanic or Latino (3 | 1.3%).
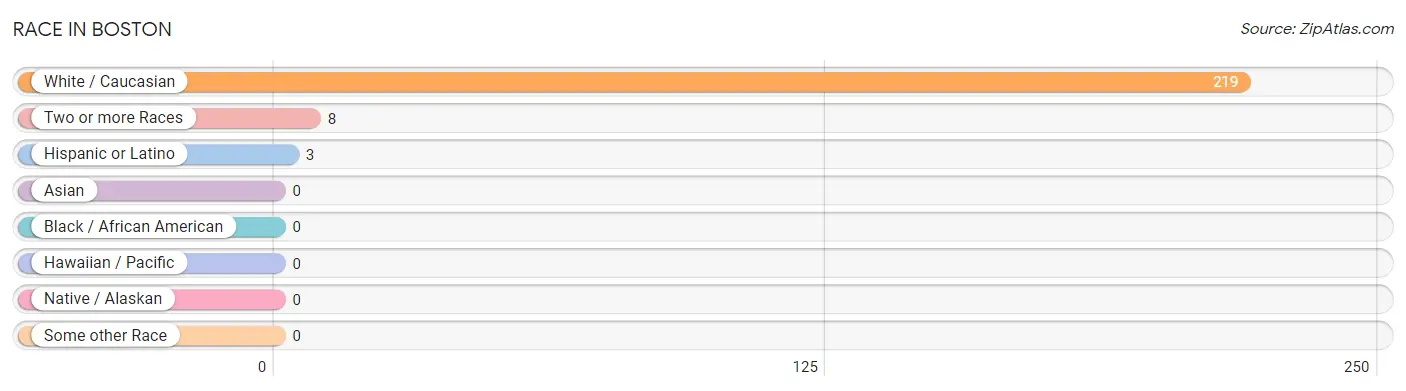
| Race | # Population | % Population |
| Asian | 0 | 0.0% |
| Black / African American | 0 | 0.0% |
| Hawaiian / Pacific | 0 | 0.0% |
| Hispanic or Latino | 3 | 1.3% |
| Native / Alaskan | 0 | 0.0% |
| White / Caucasian | 219 | 96.5% |
| Two or more Races | 8 | 3.5% |
| Some other Race | 0 | 0.0% |
| Total | 227 | 100.0% |
Ancestry in Boston
The most populous ancestries reported in Boston are English (53 | 23.4%), Irish (12 | 5.3%), German (10 | 4.4%), American (5 | 2.2%), and European (3 | 1.3%), together accounting for 36.6% of all Boston residents.
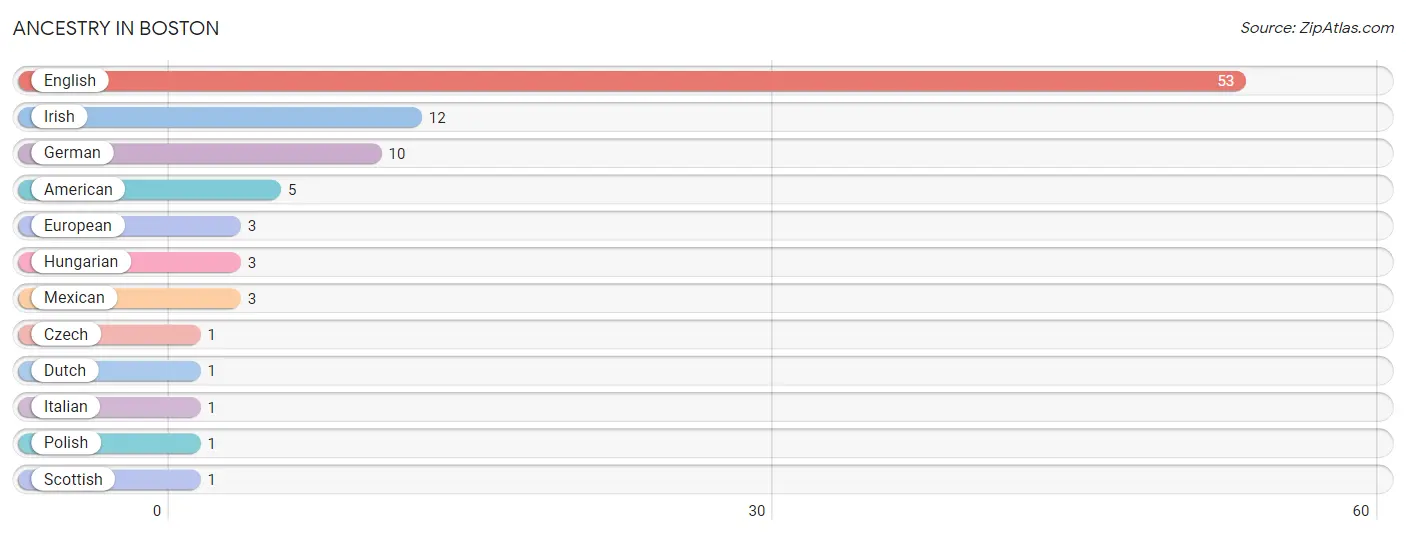
| Ancestry | # Population | % Population |
| American | 5 | 2.2% |
| Czech | 1 | 0.4% |
| Dutch | 1 | 0.4% |
| English | 53 | 23.4% |
| European | 3 | 1.3% |
| German | 10 | 4.4% |
| Hungarian | 3 | 1.3% |
| Irish | 12 | 5.3% |
| Italian | 1 | 0.4% |
| Mexican | 3 | 1.3% |
| Polish | 1 | 0.4% |
| Scottish | 1 | 0.4% | View All 12 Rows |
Immigrants in Boston
The most numerous immigrant groups reported in Boston came from Central America (2 | 0.9%), Latin America (2 | 0.9%), and Mexico (2 | 0.9%), together accounting for 2.6% of all Boston residents.
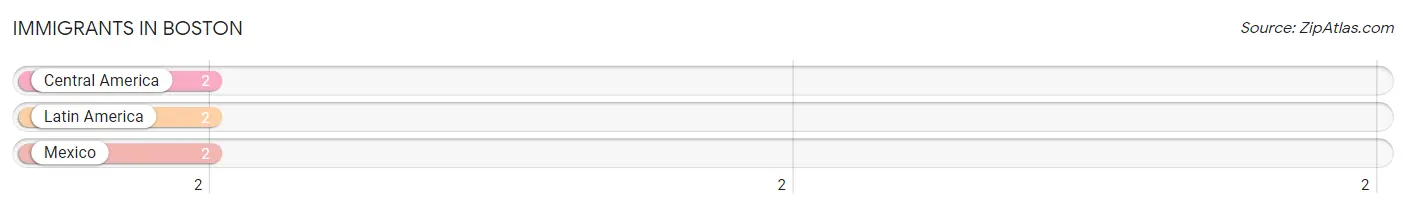
| Immigration Origin | # Population | % Population |
| Central America | 2 | 0.9% |
| Latin America | 2 | 0.9% |
| Mexico | 2 | 0.9% | View All 3 Rows |
Sex and Age in Boston
Sex and Age in Boston
The most populous age groups in Boston are 5 to 9 Years (10 | 12.7%) for men and 55 to 59 Years (21 | 14.2%) for women.
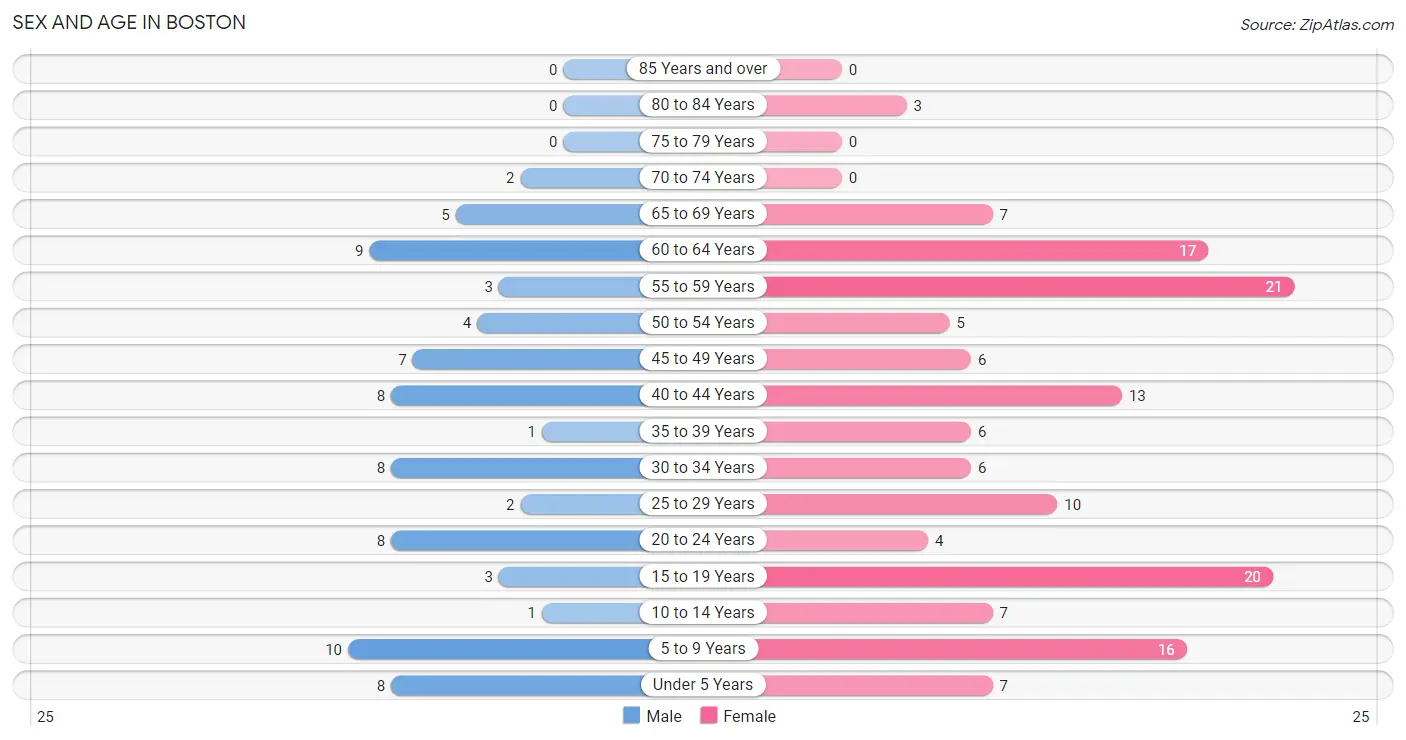
| Age Bracket | Male | Female |
| Under 5 Years | 8 (10.1%) | 7 (4.7%) |
| 5 to 9 Years | 10 (12.7%) | 16 (10.8%) |
| 10 to 14 Years | 1 (1.3%) | 7 (4.7%) |
| 15 to 19 Years | 3 (3.8%) | 20 (13.5%) |
| 20 to 24 Years | 8 (10.1%) | 4 (2.7%) |
| 25 to 29 Years | 2 (2.5%) | 10 (6.8%) |
| 30 to 34 Years | 8 (10.1%) | 6 (4.1%) |
| 35 to 39 Years | 1 (1.3%) | 6 (4.1%) |
| 40 to 44 Years | 8 (10.1%) | 13 (8.8%) |
| 45 to 49 Years | 7 (8.9%) | 6 (4.1%) |
| 50 to 54 Years | 4 (5.1%) | 5 (3.4%) |
| 55 to 59 Years | 3 (3.8%) | 21 (14.2%) |
| 60 to 64 Years | 9 (11.4%) | 17 (11.5%) |
| 65 to 69 Years | 5 (6.3%) | 7 (4.7%) |
| 70 to 74 Years | 2 (2.5%) | 0 (0.0%) |
| 75 to 79 Years | 0 (0.0%) | 0 (0.0%) |
| 80 to 84 Years | 0 (0.0%) | 3 (2.0%) |
| 85 Years and over | 0 (0.0%) | 0 (0.0%) |
| Total | 79 (100.0%) | 148 (100.0%) |
Families and Households in Boston
Median Family Size in Boston
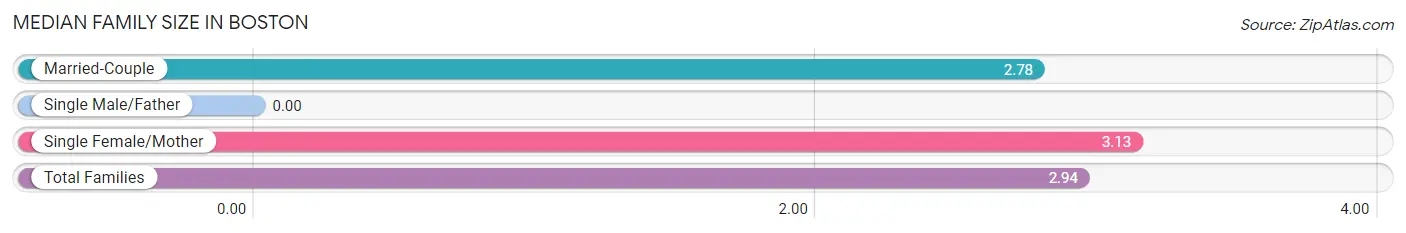
| Family Type | # Families | Family Size |
| Married-Couple | 37 (53.6%) | 2.78 |
| Single Male/Father | 0 (0.0%) | - |
| Single Female/Mother | 32 (46.4%) | 3.13 |
| Total Families | 69 (100.0%) | 2.94 |
Median Household Size in Boston
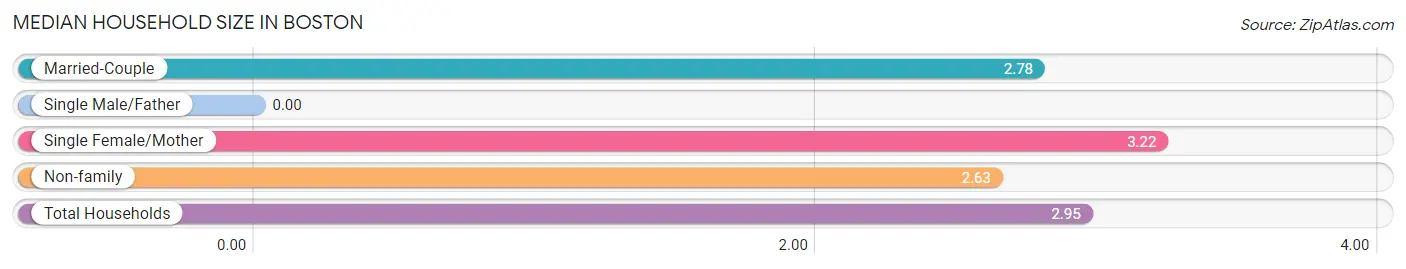
| Household Type | # Households | Household Size |
| Married-Couple | 37 (48.0%) | 2.78 |
| Single Male/Father | 0 (0.0%) | - |
| Single Female/Mother | 32 (41.6%) | 3.22 |
| Non-family | 8 (10.4%) | 2.63 |
| Total Households | 77 (100.0%) | 2.95 |
Household Size by Marriage Status in Boston
Out of a total of 77 households in Boston, 69 (89.6%) are family households, while 8 (10.4%) are nonfamily households. The most numerous type of family households are 2-person households, comprising 34, and the most common type of nonfamily households are 1-person households, comprising 4.
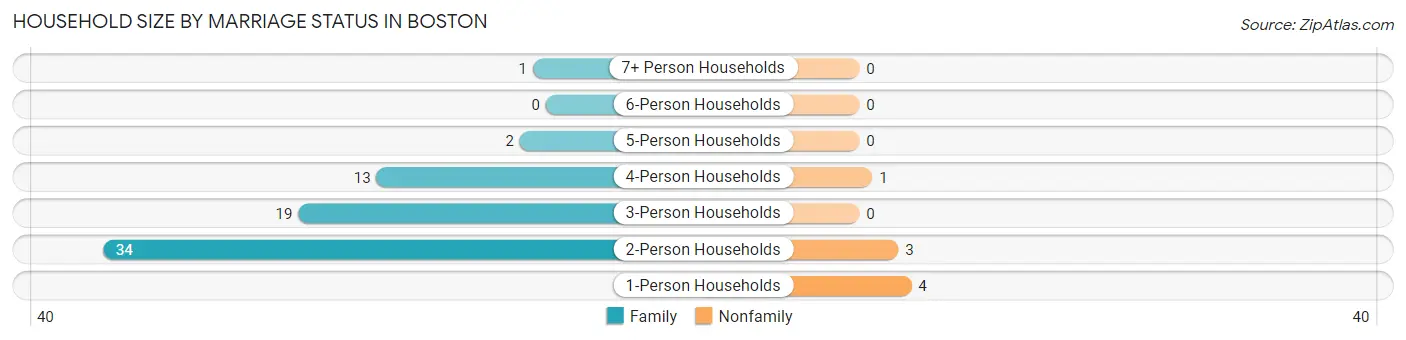
| Household Size | Family Households | Nonfamily Households |
| 1-Person Households | - | 4 (5.2%) |
| 2-Person Households | 34 (44.2%) | 3 (3.9%) |
| 3-Person Households | 19 (24.7%) | 0 (0.0%) |
| 4-Person Households | 13 (16.9%) | 1 (1.3%) |
| 5-Person Households | 2 (2.6%) | 0 (0.0%) |
| 6-Person Households | 0 (0.0%) | 0 (0.0%) |
| 7+ Person Households | 1 (1.3%) | 0 (0.0%) |
| Total | 69 (89.6%) | 8 (10.4%) |
Female Fertility in Boston
Fertility by Age in Boston
Average fertility rate in Boston is 31.0 births per 1,000 women. Women in the age bracket of 20 to 34 years have the highest fertility rate with 100.0 births per 1,000 women. Women in the age bracket of 20 to 34 years acount for 100.0% of all women with births.
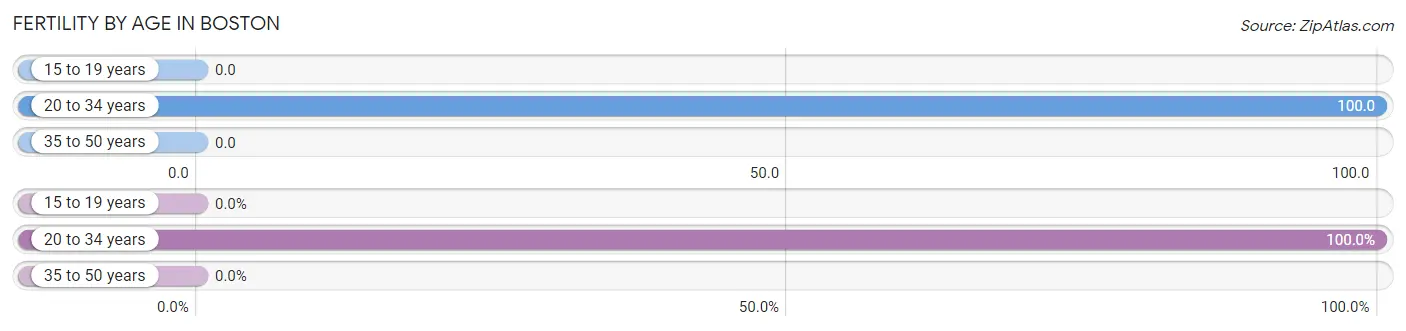
| Age Bracket | Women with Births | Births / 1,000 Women |
| 15 to 19 years | 0 (0.0%) | 0.0 |
| 20 to 34 years | 2 (100.0%) | 100.0 |
| 35 to 50 years | 0 (0.0%) | 0.0 |
| Total | 2 (100.0%) | 31.0 |
Fertility by Age by Marriage Status in Boston
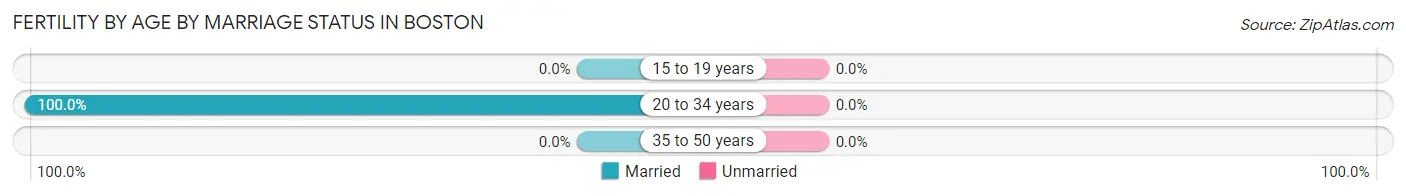
| Age Bracket | Married | Unmarried |
| 15 to 19 years | 0 (0.0%) | 0 (0.0%) |
| 20 to 34 years | 2 (100.0%) | 0 (0.0%) |
| 35 to 50 years | 0 (0.0%) | 0 (0.0%) |
| Total | 2 (100.0%) | 0 (0.0%) |
Fertility by Education in Boston
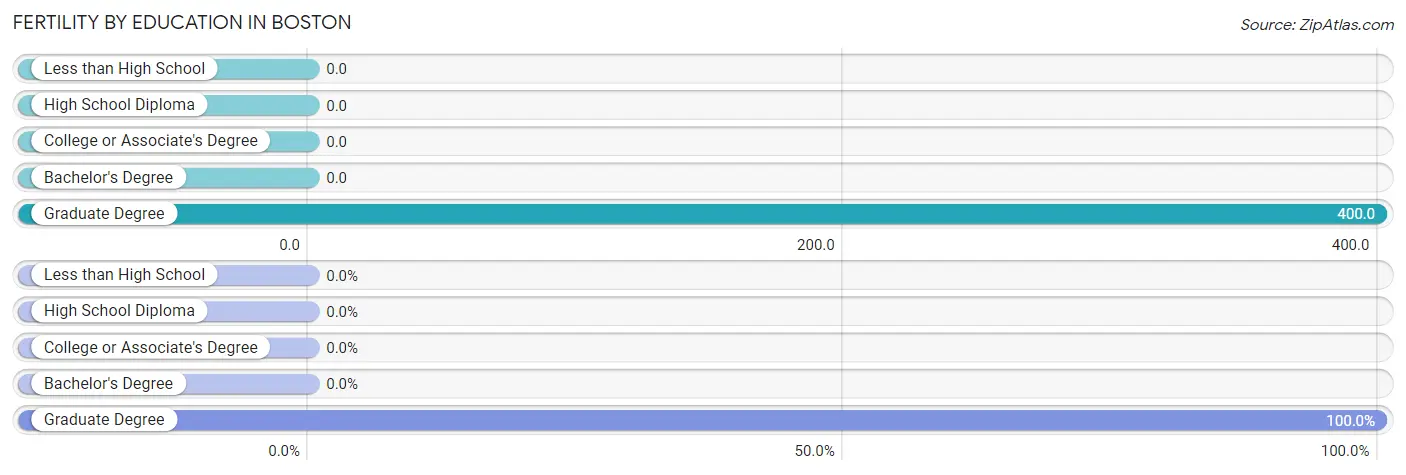
| Educational Attainment | Women with Births | Births / 1,000 Women |
| Less than High School | 0 (0.0%) | 0.0 |
| High School Diploma | 0 (0.0%) | 0.0 |
| College or Associate's Degree | 0 (0.0%) | 0.0 |
| Bachelor's Degree | 0 (0.0%) | 0.0 |
| Graduate Degree | 2 (100.0%) | 400.0 |
| Total | 2 (100.0%) | 31.0 |
Fertility by Education by Marriage Status in Boston
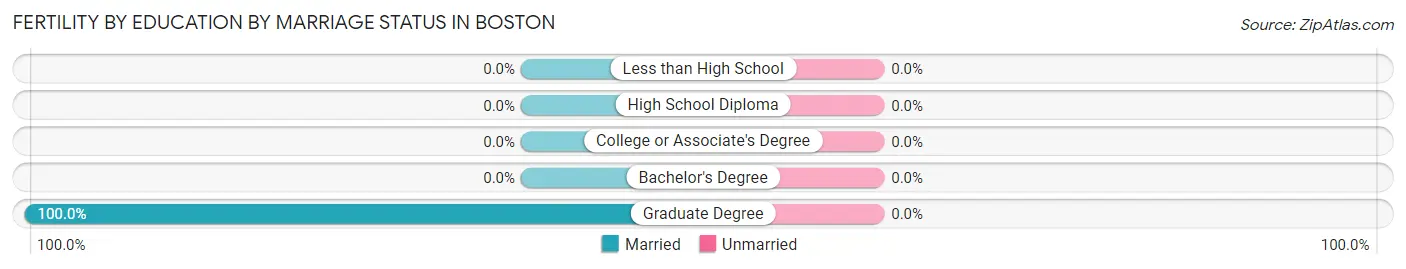
| Educational Attainment | Married | Unmarried |
| Less than High School | 0 (0.0%) | 0 (0.0%) |
| High School Diploma | 0 (0.0%) | 0 (0.0%) |
| College or Associate's Degree | 0 (0.0%) | 0 (0.0%) |
| Bachelor's Degree | 0 (0.0%) | 0 (0.0%) |
| Graduate Degree | 2 (100.0%) | 0 (0.0%) |
| Total | 2 (100.0%) | 0 (0.0%) |
Employment Characteristics in Boston
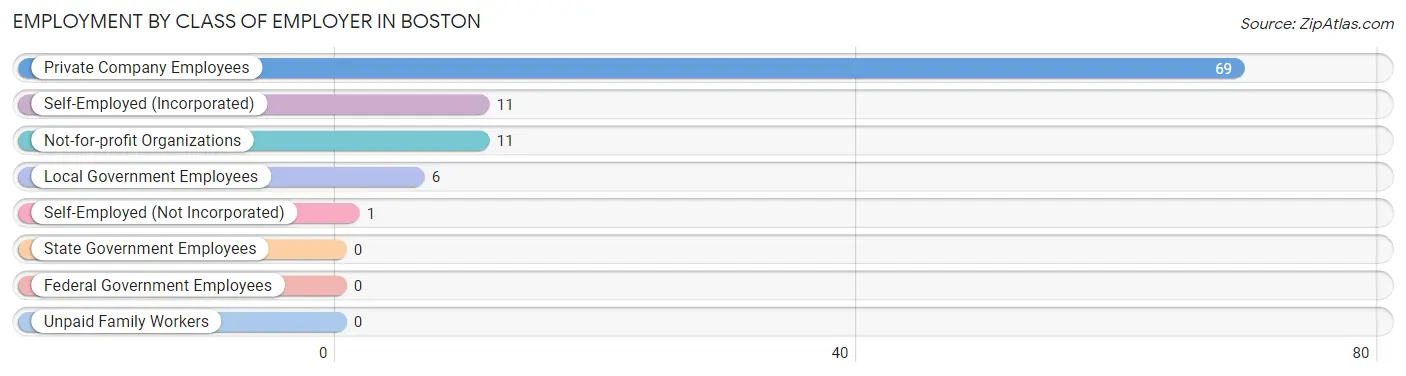
Employment by Class of Employer in Boston
Among the 98 employed individuals in Boston, private company employees (69 | 70.4%), self-employed (incorporated) (11 | 11.2%), and not-for-profit organizations (11 | 11.2%) make up the most common classes of employment.
| Employer Class | # Employees | % Employees |
| Private Company Employees | 69 | 70.4% |
| Self-Employed (Incorporated) | 11 | 11.2% |
| Self-Employed (Not Incorporated) | 1 | 1.0% |
| Not-for-profit Organizations | 11 | 11.2% |
| Local Government Employees | 6 | 6.1% |
| State Government Employees | 0 | 0.0% |
| Federal Government Employees | 0 | 0.0% |
| Unpaid Family Workers | 0 | 0.0% |
| Total | 98 | 100.0% |
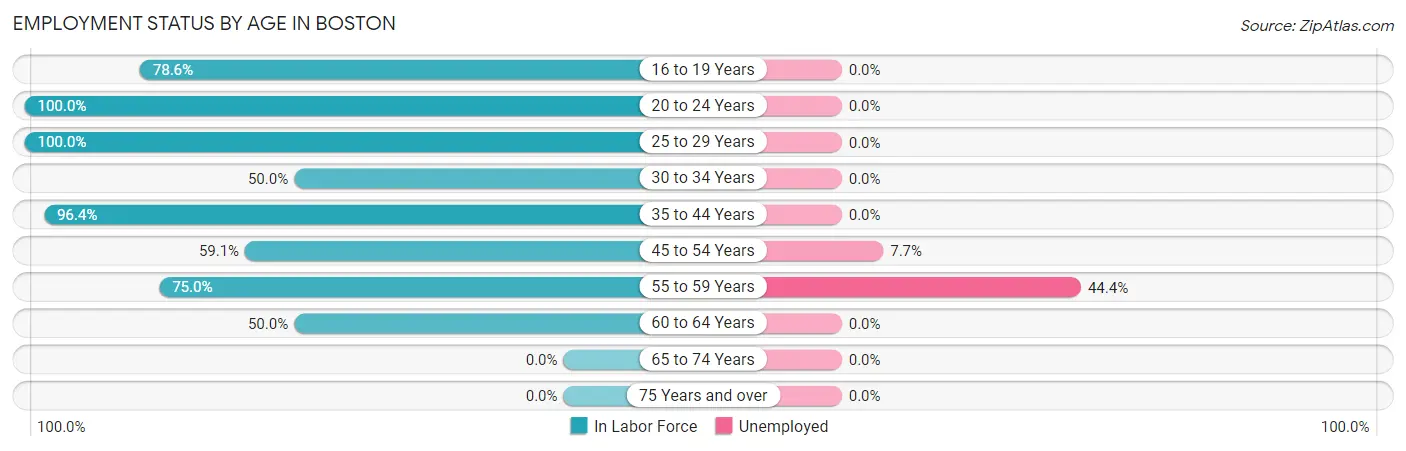
Employment Status by Age in Boston
According to the labor force statistics for Boston, out of the total population over 16 years of age (169), 66.9% or 113 individuals are in the labor force, with 8.0% or 9 of them unemployed. The age group with the highest labor force participation rate is 20 to 24 years, with 100.0% or 12 individuals in the labor force. Within the labor force, the 55 to 59 years age range has the highest percentage of unemployed individuals, with 44.4% or 8 of them being unemployed.
| Age Bracket | In Labor Force | Unemployed |
| 16 to 19 Years | 11 (78.6%) | 0 (0.0%) |
| 20 to 24 Years | 12 (100.0%) | 0 (0.0%) |
| 25 to 29 Years | 12 (100.0%) | 0 (0.0%) |
| 30 to 34 Years | 7 (50.0%) | 0 (0.0%) |
| 35 to 44 Years | 27 (96.4%) | 0 (0.0%) |
| 45 to 54 Years | 13 (59.1%) | 1 (7.7%) |
| 55 to 59 Years | 18 (75.0%) | 8 (44.4%) |
| 60 to 64 Years | 13 (50.0%) | 0 (0.0%) |
| 65 to 74 Years | 0 (0.0%) | 0 (0.0%) |
| 75 Years and over | 0 (0.0%) | 0 (0.0%) |
| Total | 113 (66.9%) | 9 (8.0%) |
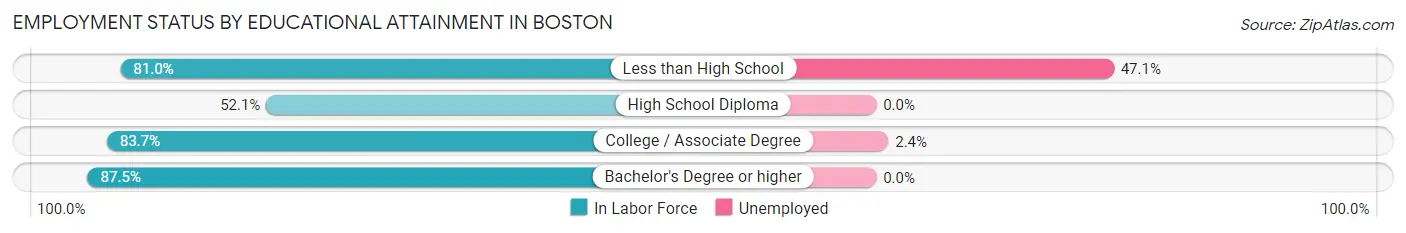
Employment Status by Educational Attainment in Boston
According to labor force statistics for Boston, 71.4% of individuals (90) out of the total population between 25 and 64 years of age (126) are in the labor force, with 10.0% or 9 of them being unemployed. The group with the highest labor force participation rate are those with the educational attainment of bachelor's degree or higher, with 87.5% or 7 individuals in the labor force. Within the labor force, individuals with less than high school education have the highest percentage of unemployment, with 47.1% or 8 of them being unemployed.
| Educational Attainment | In Labor Force | Unemployed |
| Less than High School | 17 (81.0%) | 10 (47.1%) |
| High School Diploma | 25 (52.1%) | 0 (0.0%) |
| College / Associate Degree | 41 (83.7%) | 1 (2.4%) |
| Bachelor's Degree or higher | 7 (87.5%) | 0 (0.0%) |
| Total | 90 (71.4%) | 13 (10.0%) |
Employment Occupations by Sex in Boston
Management, Business, Science and Arts Occupations
The most common Management, Business, Science and Arts occupations in Boston are Management (12 | 11.5%), Health Diagnosing & Treating (6 | 5.8%), Community & Social Service (4 | 3.8%), Education, Arts & Media (3 | 2.9%), and Education Instruction & Library (1 | 1.0%).
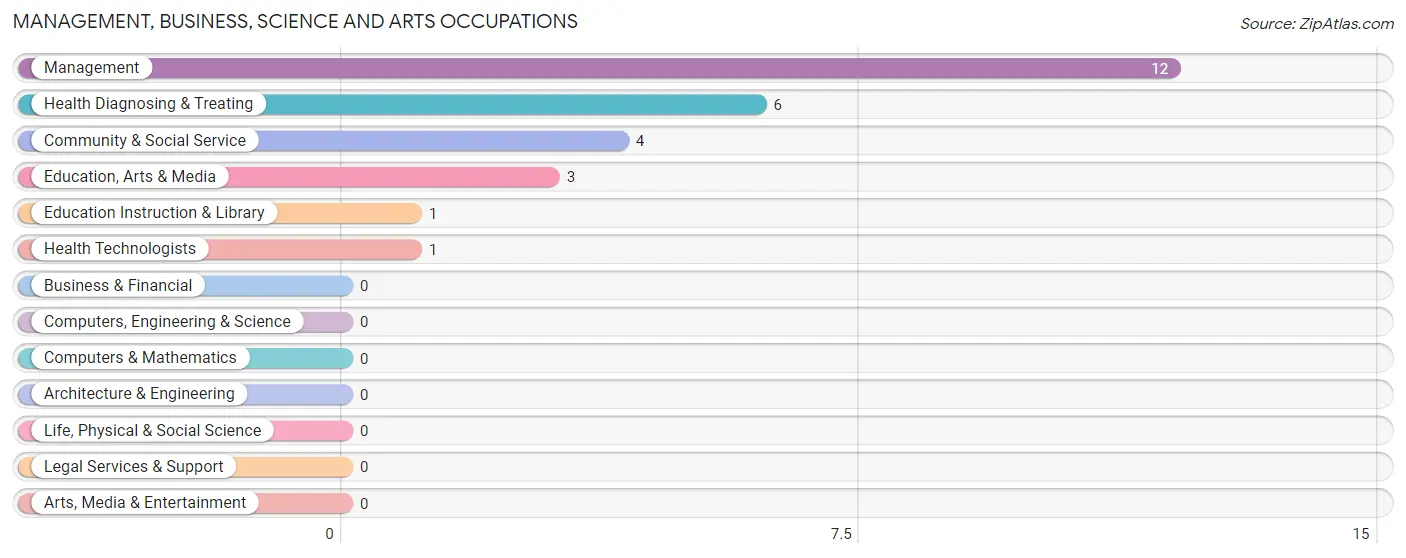
Management, Business, Science and Arts Occupations by Sex
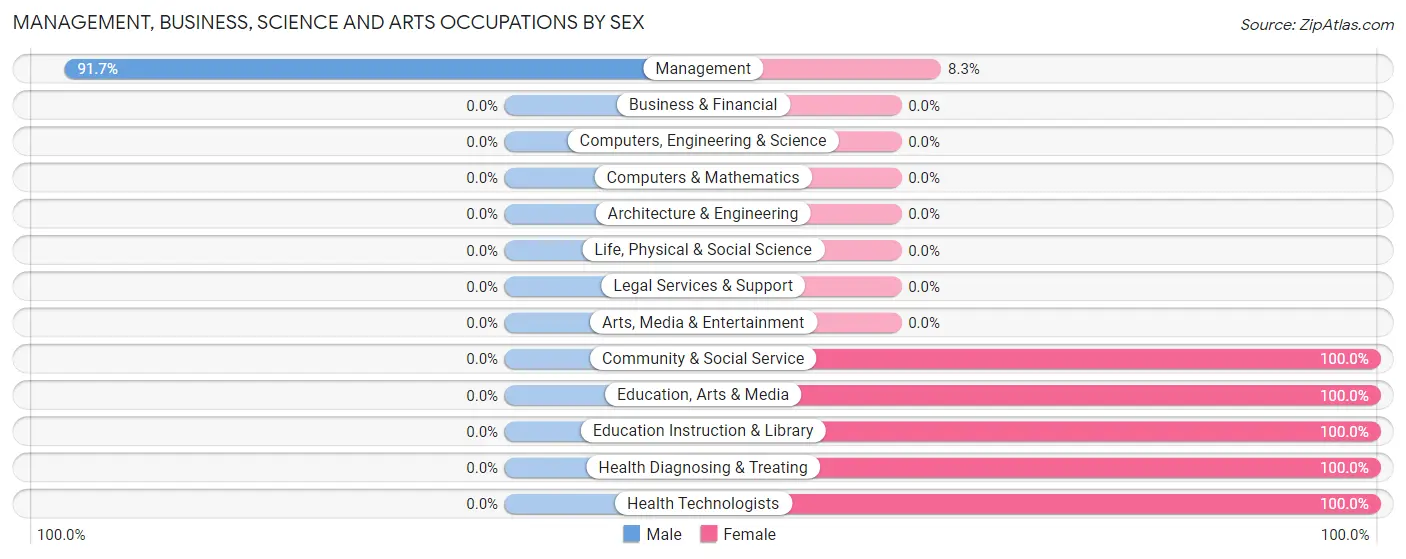
| Occupation | Male | Female |
| Management | 11 (91.7%) | 1 (8.3%) |
| Business & Financial | 0 (0.0%) | 0 (0.0%) |
| Computers, Engineering & Science | 0 (0.0%) | 0 (0.0%) |
| Computers & Mathematics | 0 (0.0%) | 0 (0.0%) |
| Architecture & Engineering | 0 (0.0%) | 0 (0.0%) |
| Life, Physical & Social Science | 0 (0.0%) | 0 (0.0%) |
| Community & Social Service | 0 (0.0%) | 4 (100.0%) |
| Education, Arts & Media | 0 (0.0%) | 3 (100.0%) |
| Legal Services & Support | 0 (0.0%) | 0 (0.0%) |
| Education Instruction & Library | 0 (0.0%) | 1 (100.0%) |
| Arts, Media & Entertainment | 0 (0.0%) | 0 (0.0%) |
| Health Diagnosing & Treating | 0 (0.0%) | 6 (100.0%) |
| Health Technologists | 0 (0.0%) | 1 (100.0%) |
| Total (Category) | 11 (50.0%) | 11 (50.0%) |
| Total (Overall) | 47 (45.2%) | 57 (54.8%) |
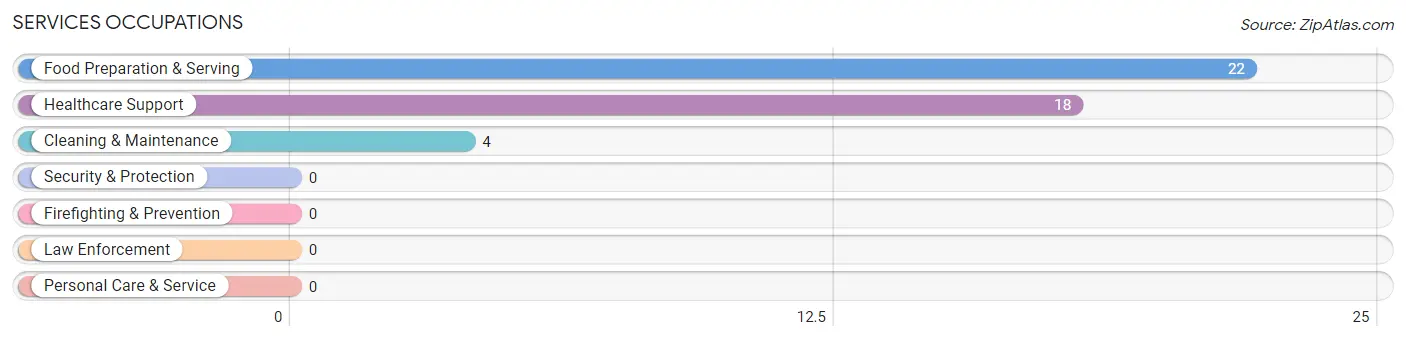
Services Occupations
The most common Services occupations in Boston are Food Preparation & Serving (22 | 21.1%), Healthcare Support (18 | 17.3%), and Cleaning & Maintenance (4 | 3.8%).
Services Occupations by Sex
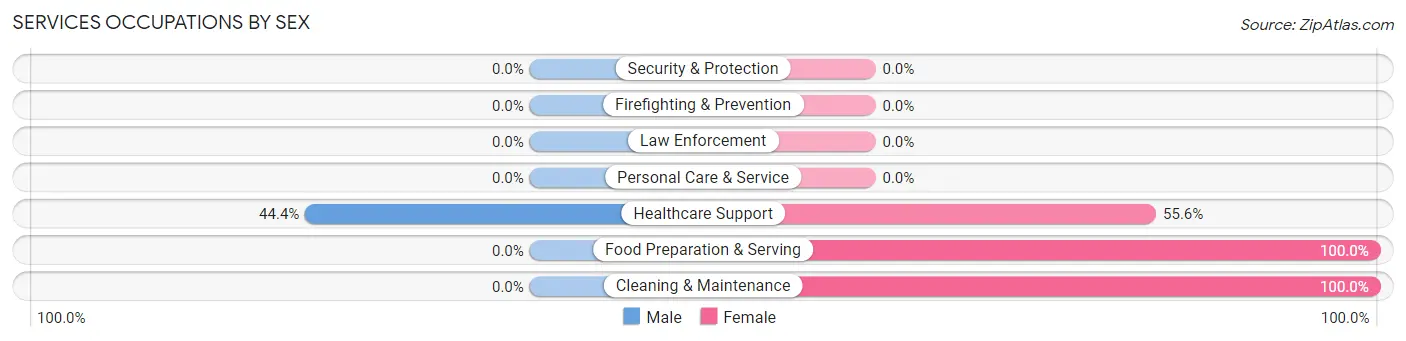
| Occupation | Male | Female |
| Healthcare Support | 8 (44.4%) | 10 (55.6%) |
| Security & Protection | 0 (0.0%) | 0 (0.0%) |
| Firefighting & Prevention | 0 (0.0%) | 0 (0.0%) |
| Law Enforcement | 0 (0.0%) | 0 (0.0%) |
| Food Preparation & Serving | 0 (0.0%) | 22 (100.0%) |
| Cleaning & Maintenance | 0 (0.0%) | 4 (100.0%) |
| Personal Care & Service | 0 (0.0%) | 0 (0.0%) |
| Total (Category) | 8 (18.2%) | 36 (81.8%) |
| Total (Overall) | 47 (45.2%) | 57 (54.8%) |
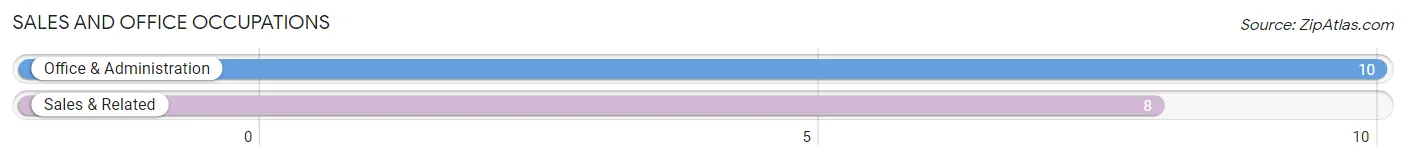
Sales and Office Occupations
The most common Sales and Office occupations in Boston are Office & Administration (10 | 9.6%), and Sales & Related (8 | 7.7%).
Sales and Office Occupations by Sex
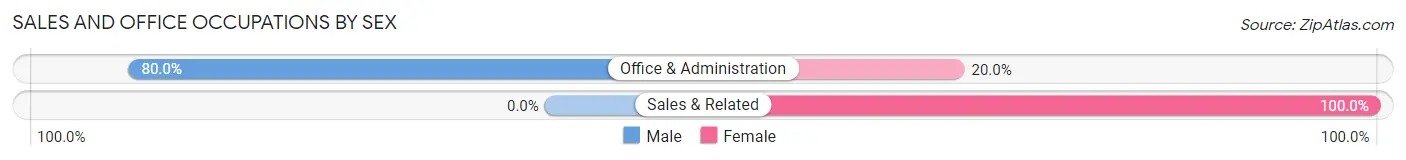
| Occupation | Male | Female |
| Sales & Related | 0 (0.0%) | 8 (100.0%) |
| Office & Administration | 8 (80.0%) | 2 (20.0%) |
| Total (Category) | 8 (44.4%) | 10 (55.6%) |
| Total (Overall) | 47 (45.2%) | 57 (54.8%) |
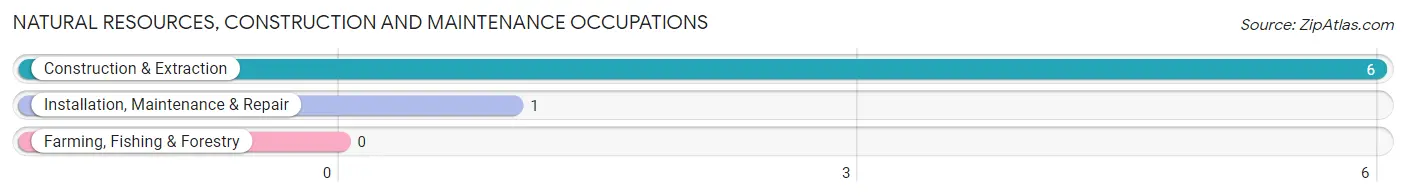
Natural Resources, Construction and Maintenance Occupations
The most common Natural Resources, Construction and Maintenance occupations in Boston are Construction & Extraction (6 | 5.8%), and Installation, Maintenance & Repair (1 | 1.0%).
Natural Resources, Construction and Maintenance Occupations by Sex
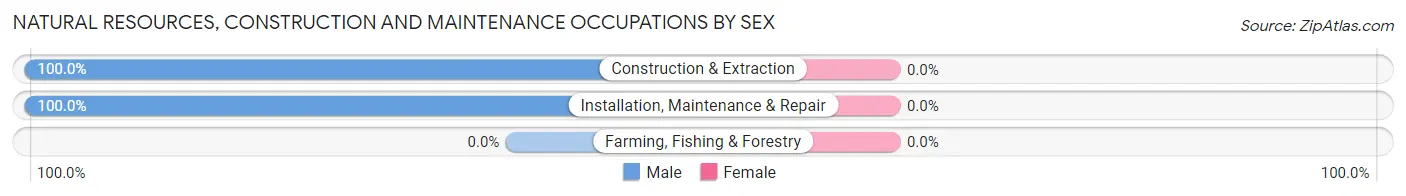
| Occupation | Male | Female |
| Farming, Fishing & Forestry | 0 (0.0%) | 0 (0.0%) |
| Construction & Extraction | 6 (100.0%) | 0 (0.0%) |
| Installation, Maintenance & Repair | 1 (100.0%) | 0 (0.0%) |
| Total (Category) | 7 (100.0%) | 0 (0.0%) |
| Total (Overall) | 47 (45.2%) | 57 (54.8%) |
Production, Transportation and Moving Occupations
The most common Production, Transportation and Moving occupations in Boston are Production (9 | 8.6%), and Transportation (4 | 3.8%).
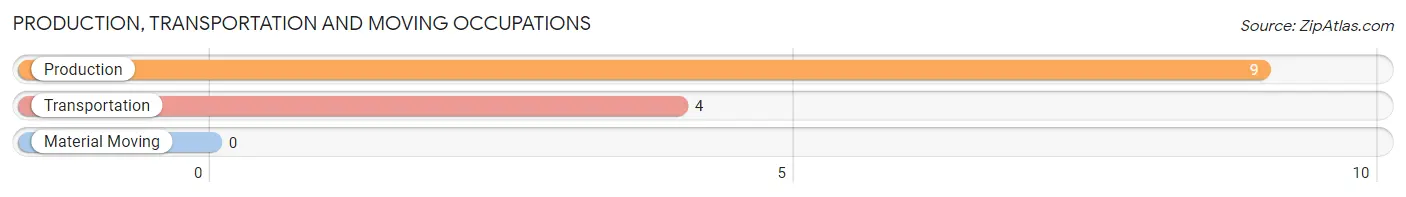
Production, Transportation and Moving Occupations by Sex
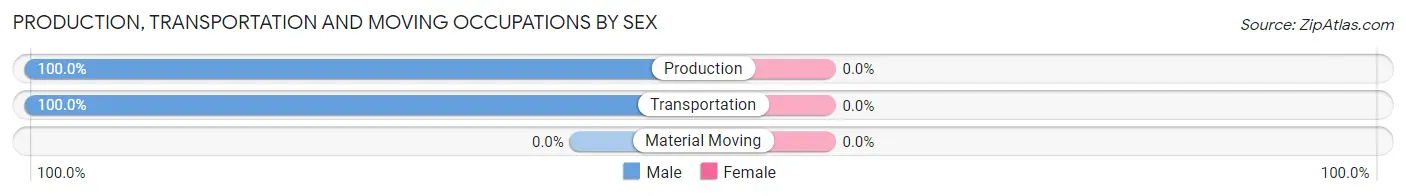
| Occupation | Male | Female |
| Production | 9 (100.0%) | 0 (0.0%) |
| Transportation | 4 (100.0%) | 0 (0.0%) |
| Material Moving | 0 (0.0%) | 0 (0.0%) |
| Total (Category) | 13 (100.0%) | 0 (0.0%) |
| Total (Overall) | 47 (45.2%) | 57 (54.8%) |
Employment Industries by Sex in Boston
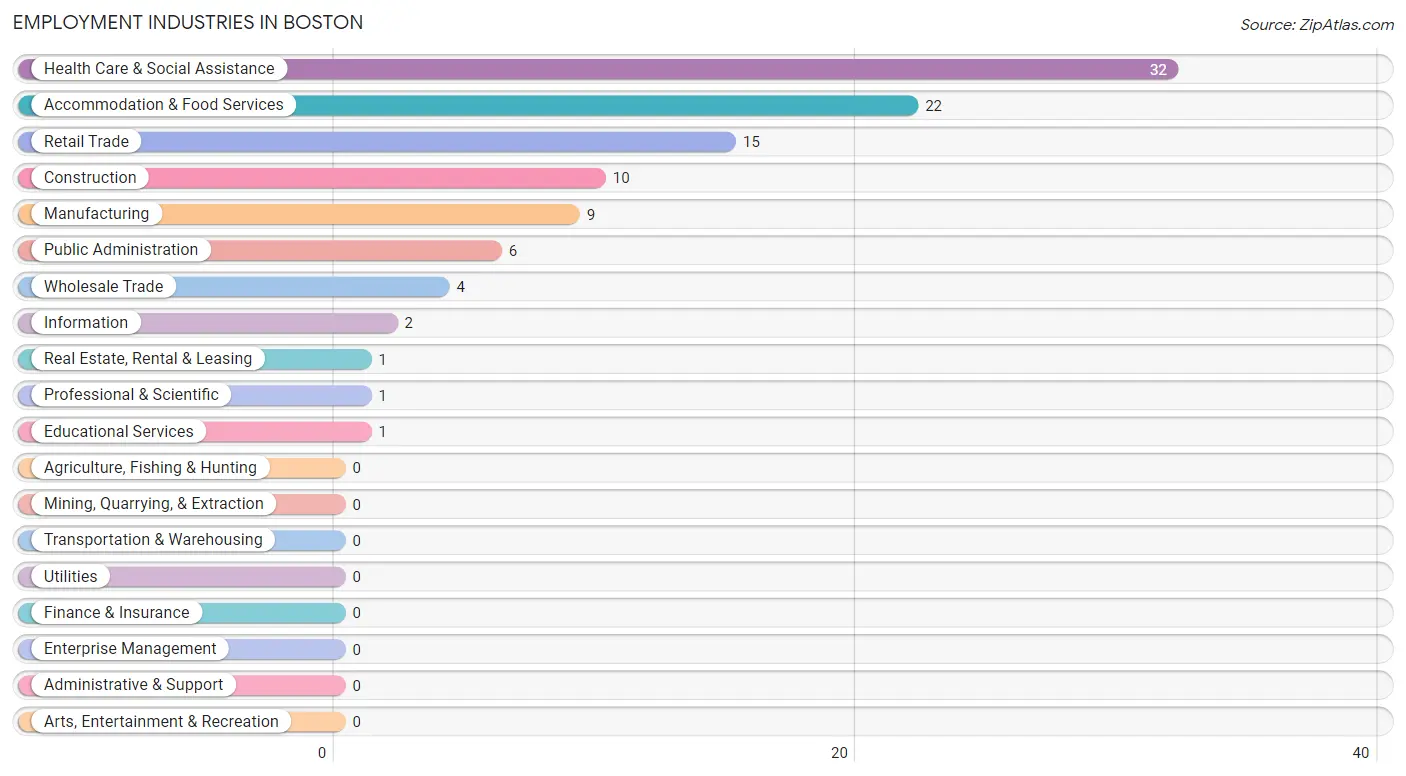
Employment Industries in Boston
The major employment industries in Boston include Health Care & Social Assistance (32 | 30.8%), Accommodation & Food Services (22 | 21.1%), Retail Trade (15 | 14.4%), Construction (10 | 9.6%), and Manufacturing (9 | 8.6%).
Employment Industries by Sex in Boston
The Boston industries that see more men than women are Construction (100.0%), Manufacturing (100.0%), and Wholesale Trade (100.0%), whereas the industries that tend to have a higher number of women are Information (100.0%), Real Estate, Rental & Leasing (100.0%), and Educational Services (100.0%).
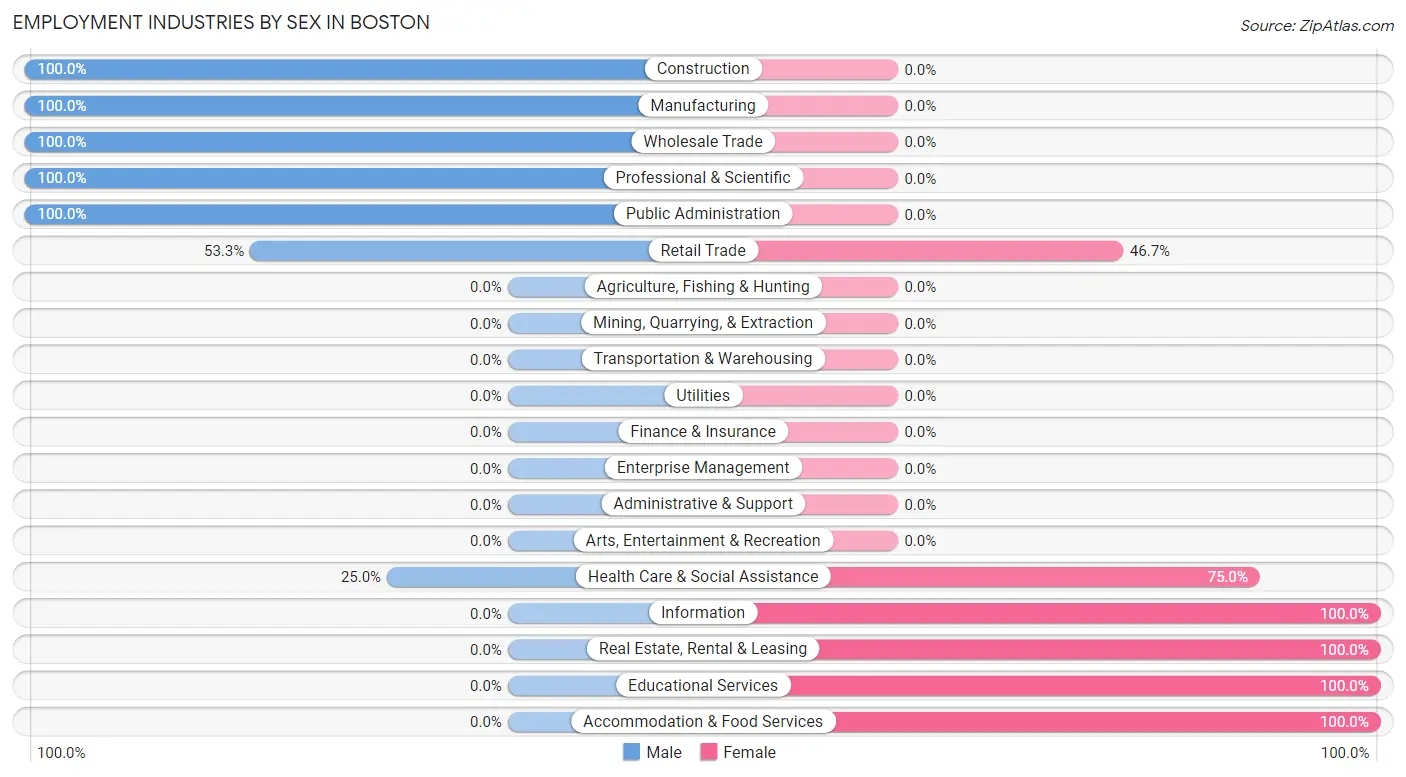
| Industry | Male | Female |
| Agriculture, Fishing & Hunting | 0 (0.0%) | 0 (0.0%) |
| Mining, Quarrying, & Extraction | 0 (0.0%) | 0 (0.0%) |
| Construction | 10 (100.0%) | 0 (0.0%) |
| Manufacturing | 9 (100.0%) | 0 (0.0%) |
| Wholesale Trade | 4 (100.0%) | 0 (0.0%) |
| Retail Trade | 8 (53.3%) | 7 (46.7%) |
| Transportation & Warehousing | 0 (0.0%) | 0 (0.0%) |
| Utilities | 0 (0.0%) | 0 (0.0%) |
| Information | 0 (0.0%) | 2 (100.0%) |
| Finance & Insurance | 0 (0.0%) | 0 (0.0%) |
| Real Estate, Rental & Leasing | 0 (0.0%) | 1 (100.0%) |
| Professional & Scientific | 1 (100.0%) | 0 (0.0%) |
| Enterprise Management | 0 (0.0%) | 0 (0.0%) |
| Administrative & Support | 0 (0.0%) | 0 (0.0%) |
| Educational Services | 0 (0.0%) | 1 (100.0%) |
| Health Care & Social Assistance | 8 (25.0%) | 24 (75.0%) |
| Arts, Entertainment & Recreation | 0 (0.0%) | 0 (0.0%) |
| Accommodation & Food Services | 0 (0.0%) | 22 (100.0%) |
| Public Administration | 6 (100.0%) | 0 (0.0%) |
| Total | 47 (45.2%) | 57 (54.8%) |
Education in Boston
School Enrollment in Boston
The most common levels of schooling among the 58 students in Boston are high school (23 | 39.7%), elementary school (18 | 31.0%), and kindergarten (9 | 15.5%).
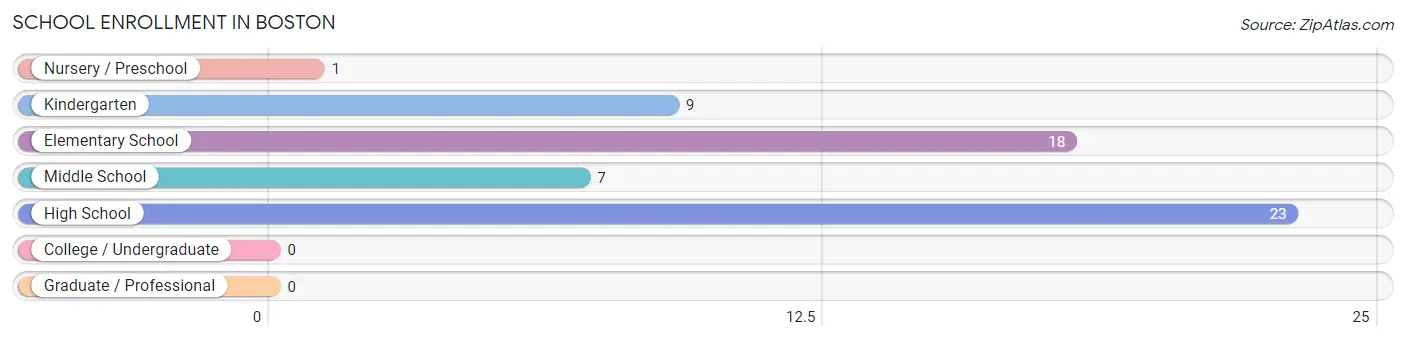
| School Level | # Students | % Students |
| Nursery / Preschool | 1 | 1.7% |
| Kindergarten | 9 | 15.5% |
| Elementary School | 18 | 31.0% |
| Middle School | 7 | 12.1% |
| High School | 23 | 39.7% |
| College / Undergraduate | 0 | 0.0% |
| Graduate / Professional | 0 | 0.0% |
| Total | 58 | 100.0% |
School Enrollment by Age by Funding Source in Boston
Out of a total of 58 students who are enrolled in schools in Boston, 1 (1.7%) attend a private institution, while the remaining 57 (98.3%) are enrolled in public schools. The age group of 3 to 4 year olds has the highest likelihood of being enrolled in private schools, with 1 (100.0% in the age bracket) enrolled. Conversely, the age group of 5 to 9 year old has the lowest likelihood of being enrolled in a private school, with 26 (100.0% in the age bracket) attending a public institution.
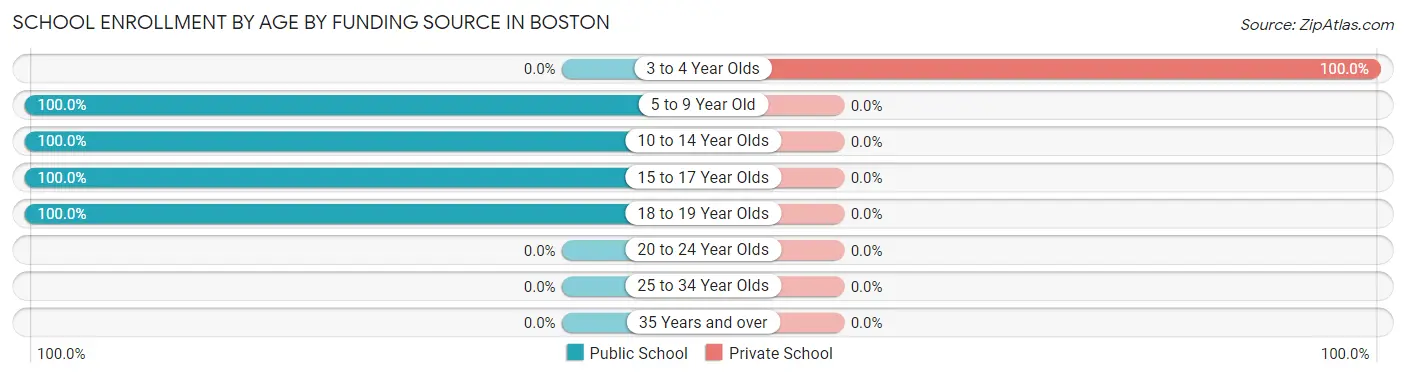
| Age Bracket | Public School | Private School |
| 3 to 4 Year Olds | 0 (0.0%) | 1 (100.0%) |
| 5 to 9 Year Old | 26 (100.0%) | 0 (0.0%) |
| 10 to 14 Year Olds | 8 (100.0%) | 0 (0.0%) |
| 15 to 17 Year Olds | 20 (100.0%) | 0 (0.0%) |
| 18 to 19 Year Olds | 3 (100.0%) | 0 (0.0%) |
| 20 to 24 Year Olds | 0 (0.0%) | 0 (0.0%) |
| 25 to 34 Year Olds | 0 (0.0%) | 0 (0.0%) |
| 35 Years and over | 0 (0.0%) | 0 (0.0%) |
| Total | 57 (98.3%) | 1 (1.7%) |
Educational Attainment by Field of Study in Boston
Psychology (4 | 44.4%), bio, nature & agricultural (2 | 22.2%), social sciences (2 | 22.2%), and education (1 | 11.1%) are the most common fields of study among 9 individuals in Boston who have obtained a bachelor's degree or higher.
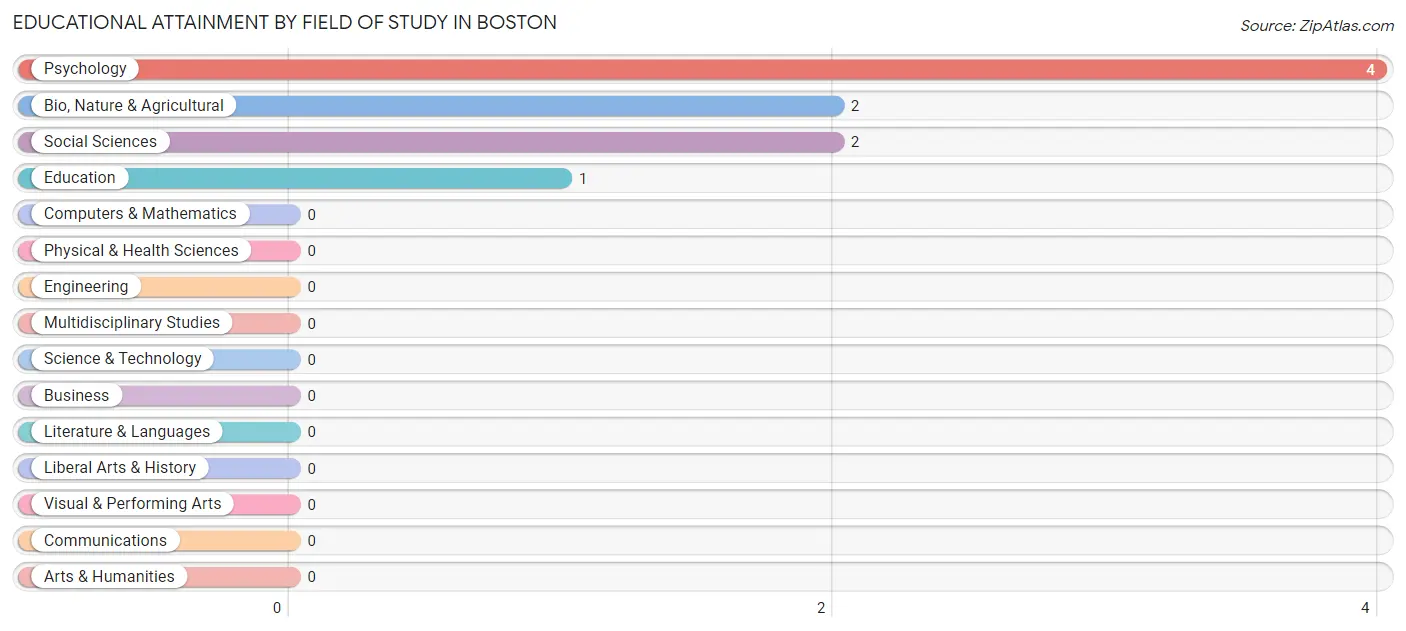
| Field of Study | # Graduates | % Graduates |
| Computers & Mathematics | 0 | 0.0% |
| Bio, Nature & Agricultural | 2 | 22.2% |
| Physical & Health Sciences | 0 | 0.0% |
| Psychology | 4 | 44.4% |
| Social Sciences | 2 | 22.2% |
| Engineering | 0 | 0.0% |
| Multidisciplinary Studies | 0 | 0.0% |
| Science & Technology | 0 | 0.0% |
| Business | 0 | 0.0% |
| Education | 1 | 11.1% |
| Literature & Languages | 0 | 0.0% |
| Liberal Arts & History | 0 | 0.0% |
| Visual & Performing Arts | 0 | 0.0% |
| Communications | 0 | 0.0% |
| Arts & Humanities | 0 | 0.0% |
| Total | 9 | 100.0% |
Transportation & Commute in Boston
Vehicle Availability by Sex in Boston
The most prevalent vehicle ownership categories in Boston are males with 3 vehicles (25, accounting for 59.5%) and females with 3 vehicles (26, making up 44.6%).
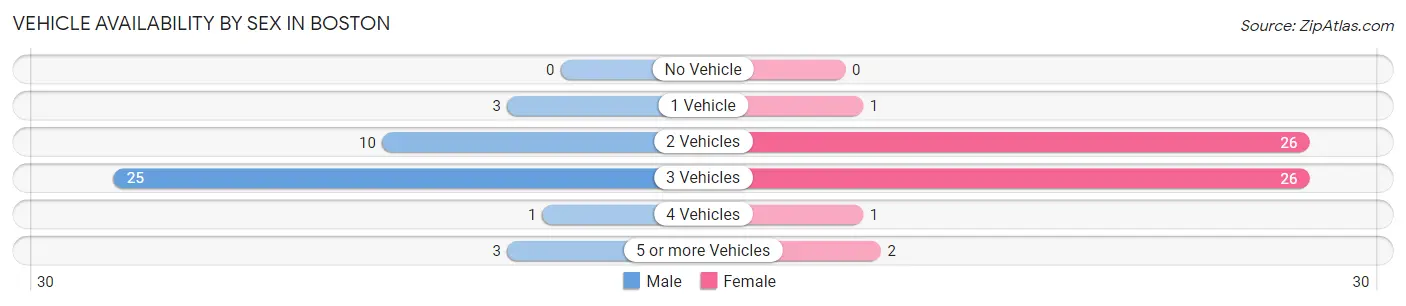
| Vehicles Available | Male | Female |
| No Vehicle | 0 (0.0%) | 0 (0.0%) |
| 1 Vehicle | 3 (7.1%) | 1 (1.8%) |
| 2 Vehicles | 10 (23.8%) | 26 (46.4%) |
| 3 Vehicles | 25 (59.5%) | 26 (46.4%) |
| 4 Vehicles | 1 (2.4%) | 1 (1.8%) |
| 5 or more Vehicles | 3 (7.1%) | 2 (3.6%) |
| Total | 42 (100.0%) | 56 (100.0%) |
Commute Time in Boston
The most frequently occuring commute durations in Boston are 20 to 24 minutes (32 commuters, 32.7%), 30 to 34 minutes (23 commuters, 23.5%), and 15 to 19 minutes (14 commuters, 14.3%).
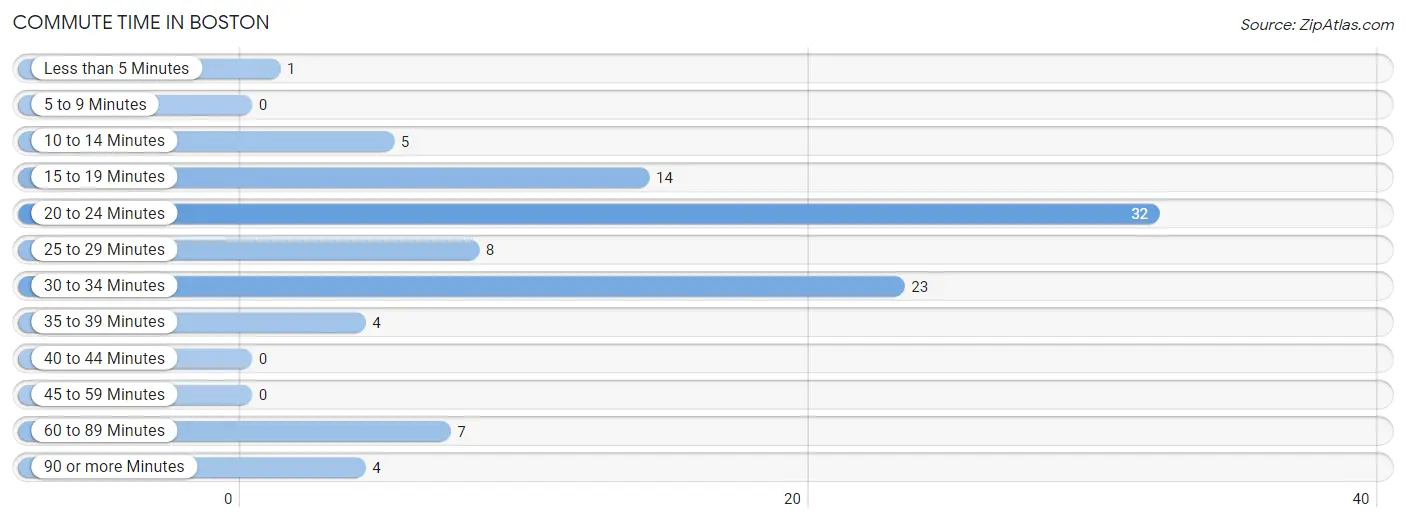
| Commute Time | # Commuters | % Commuters |
| Less than 5 Minutes | 1 | 1.0% |
| 5 to 9 Minutes | 0 | 0.0% |
| 10 to 14 Minutes | 5 | 5.1% |
| 15 to 19 Minutes | 14 | 14.3% |
| 20 to 24 Minutes | 32 | 32.7% |
| 25 to 29 Minutes | 8 | 8.2% |
| 30 to 34 Minutes | 23 | 23.5% |
| 35 to 39 Minutes | 4 | 4.1% |
| 40 to 44 Minutes | 0 | 0.0% |
| 45 to 59 Minutes | 0 | 0.0% |
| 60 to 89 Minutes | 7 | 7.1% |
| 90 or more Minutes | 4 | 4.1% |
Commute Time by Sex in Boston
The most common commute times in Boston are 30 to 34 minutes (16 commuters, 38.1%) for males and 20 to 24 minutes (23 commuters, 41.1%) for females.
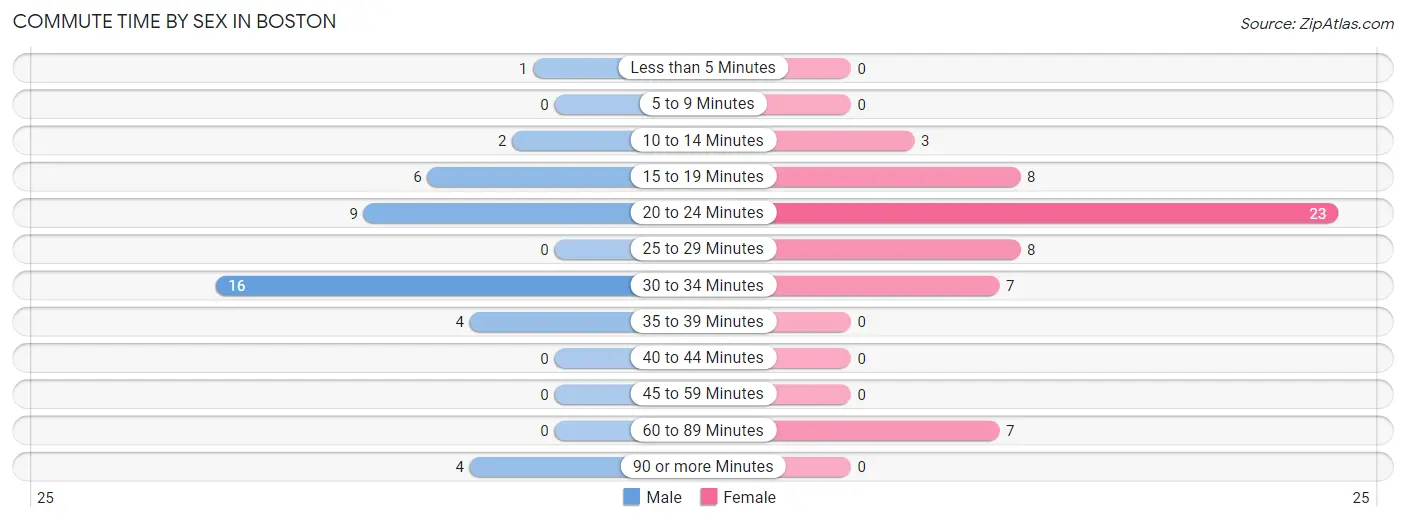
| Commute Time | Male | Female |
| Less than 5 Minutes | 1 (2.4%) | 0 (0.0%) |
| 5 to 9 Minutes | 0 (0.0%) | 0 (0.0%) |
| 10 to 14 Minutes | 2 (4.8%) | 3 (5.4%) |
| 15 to 19 Minutes | 6 (14.3%) | 8 (14.3%) |
| 20 to 24 Minutes | 9 (21.4%) | 23 (41.1%) |
| 25 to 29 Minutes | 0 (0.0%) | 8 (14.3%) |
| 30 to 34 Minutes | 16 (38.1%) | 7 (12.5%) |
| 35 to 39 Minutes | 4 (9.5%) | 0 (0.0%) |
| 40 to 44 Minutes | 0 (0.0%) | 0 (0.0%) |
| 45 to 59 Minutes | 0 (0.0%) | 0 (0.0%) |
| 60 to 89 Minutes | 0 (0.0%) | 7 (12.5%) |
| 90 or more Minutes | 4 (9.5%) | 0 (0.0%) |
Time of Departure to Work by Sex in Boston
The most frequent times of departure to work in Boston are 6:30 AM to 6:59 AM (12, 28.6%) for males and 4:00 PM to 11:59 PM (19, 33.9%) for females.
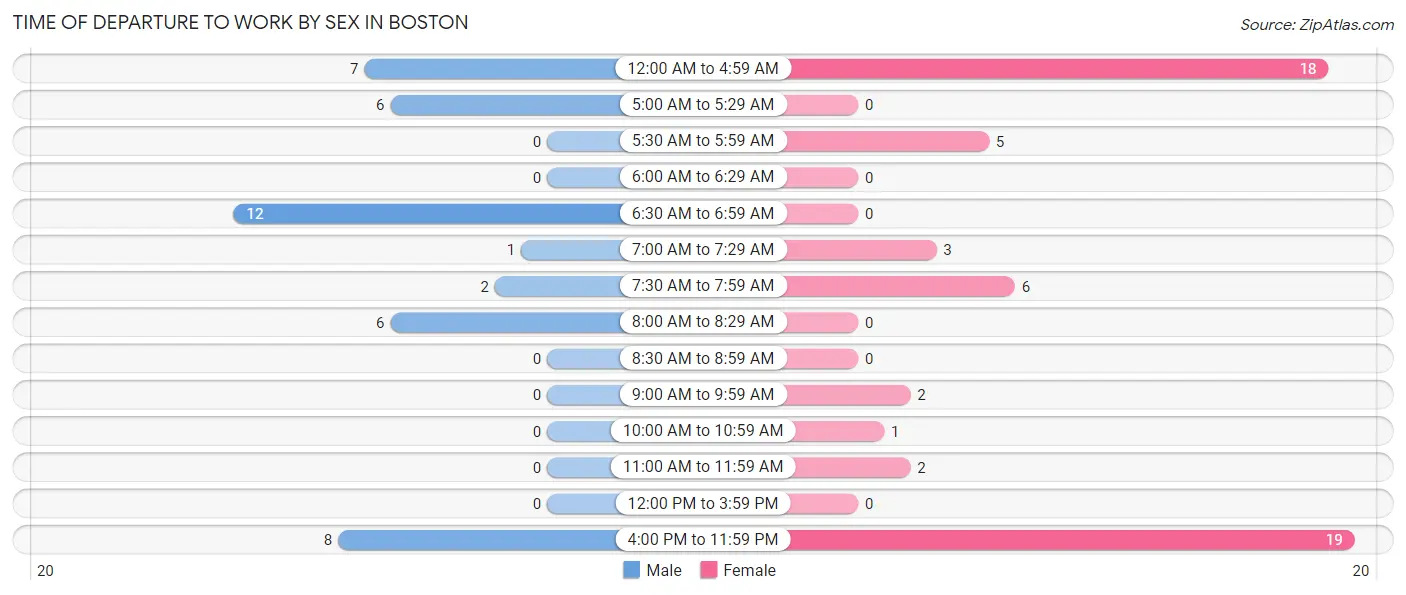
| Time of Departure | Male | Female |
| 12:00 AM to 4:59 AM | 7 (16.7%) | 18 (32.1%) |
| 5:00 AM to 5:29 AM | 6 (14.3%) | 0 (0.0%) |
| 5:30 AM to 5:59 AM | 0 (0.0%) | 5 (8.9%) |
| 6:00 AM to 6:29 AM | 0 (0.0%) | 0 (0.0%) |
| 6:30 AM to 6:59 AM | 12 (28.6%) | 0 (0.0%) |
| 7:00 AM to 7:29 AM | 1 (2.4%) | 3 (5.4%) |
| 7:30 AM to 7:59 AM | 2 (4.8%) | 6 (10.7%) |
| 8:00 AM to 8:29 AM | 6 (14.3%) | 0 (0.0%) |
| 8:30 AM to 8:59 AM | 0 (0.0%) | 0 (0.0%) |
| 9:00 AM to 9:59 AM | 0 (0.0%) | 2 (3.6%) |
| 10:00 AM to 10:59 AM | 0 (0.0%) | 1 (1.8%) |
| 11:00 AM to 11:59 AM | 0 (0.0%) | 2 (3.6%) |
| 12:00 PM to 3:59 PM | 0 (0.0%) | 0 (0.0%) |
| 4:00 PM to 11:59 PM | 8 (19.1%) | 19 (33.9%) |
| Total | 42 (100.0%) | 56 (100.0%) |
Housing Occupancy in Boston
Occupancy by Ownership in Boston
Of the total 77 dwellings in Boston, owner-occupied units account for 41 (53.2%), while renter-occupied units make up 36 (46.8%).
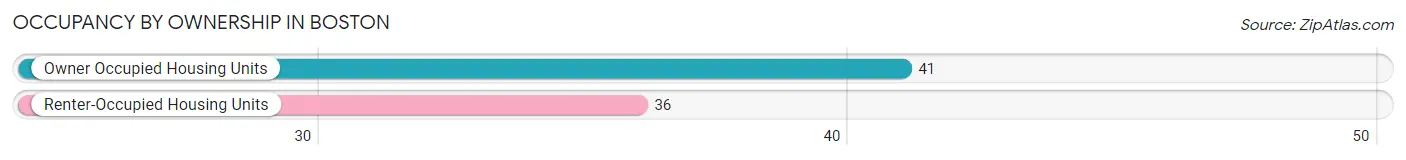
| Occupancy | # Housing Units | % Housing Units |
| Owner Occupied Housing Units | 41 | 53.2% |
| Renter-Occupied Housing Units | 36 | 46.8% |
| Total Occupied Housing Units | 77 | 100.0% |
Occupancy by Household Size in Boston
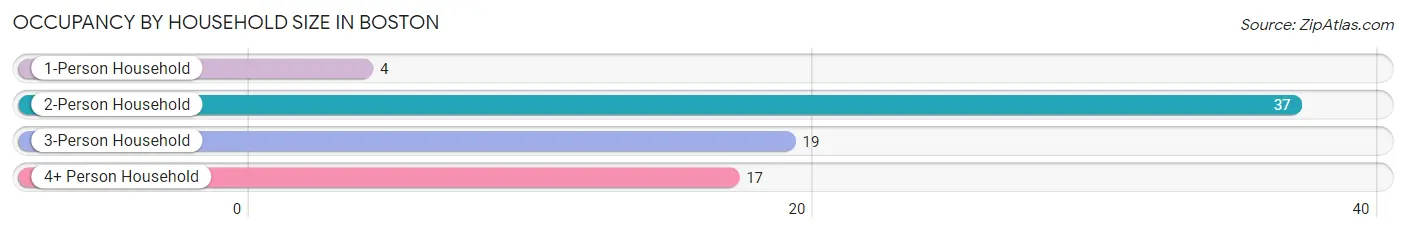
| Household Size | # Housing Units | % Housing Units |
| 1-Person Household | 4 | 5.2% |
| 2-Person Household | 37 | 48.0% |
| 3-Person Household | 19 | 24.7% |
| 4+ Person Household | 17 | 22.1% |
| Total Housing Units | 77 | 100.0% |
Occupancy by Ownership by Household Size in Boston
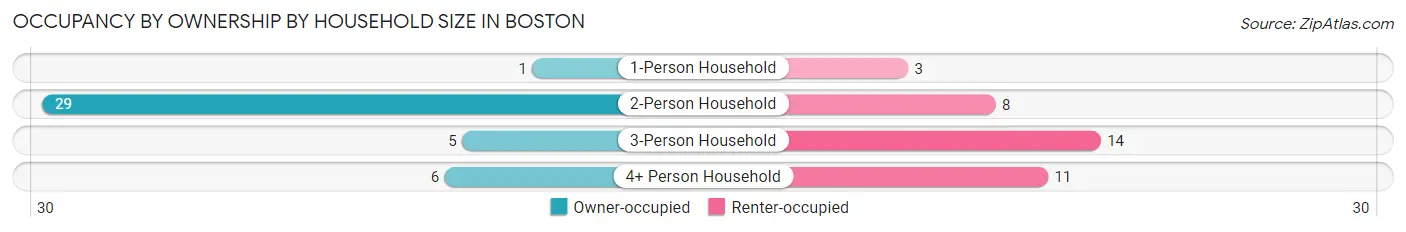
| Household Size | Owner-occupied | Renter-occupied |
| 1-Person Household | 1 (25.0%) | 3 (75.0%) |
| 2-Person Household | 29 (78.4%) | 8 (21.6%) |
| 3-Person Household | 5 (26.3%) | 14 (73.7%) |
| 4+ Person Household | 6 (35.3%) | 11 (64.7%) |
| Total Housing Units | 41 (53.2%) | 36 (46.8%) |
Occupancy by Educational Attainment in Boston
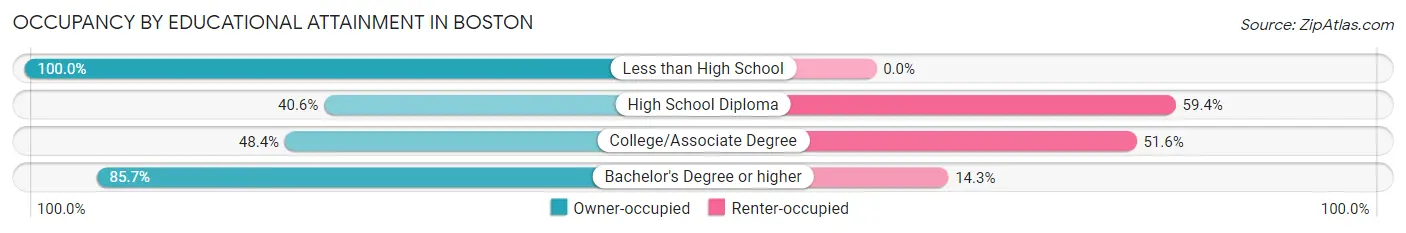
| Household Size | Owner-occupied | Renter-occupied |
| Less than High School | 7 (100.0%) | 0 (0.0%) |
| High School Diploma | 13 (40.6%) | 19 (59.4%) |
| College/Associate Degree | 15 (48.4%) | 16 (51.6%) |
| Bachelor's Degree or higher | 6 (85.7%) | 1 (14.3%) |
Occupancy by Age of Householder in Boston
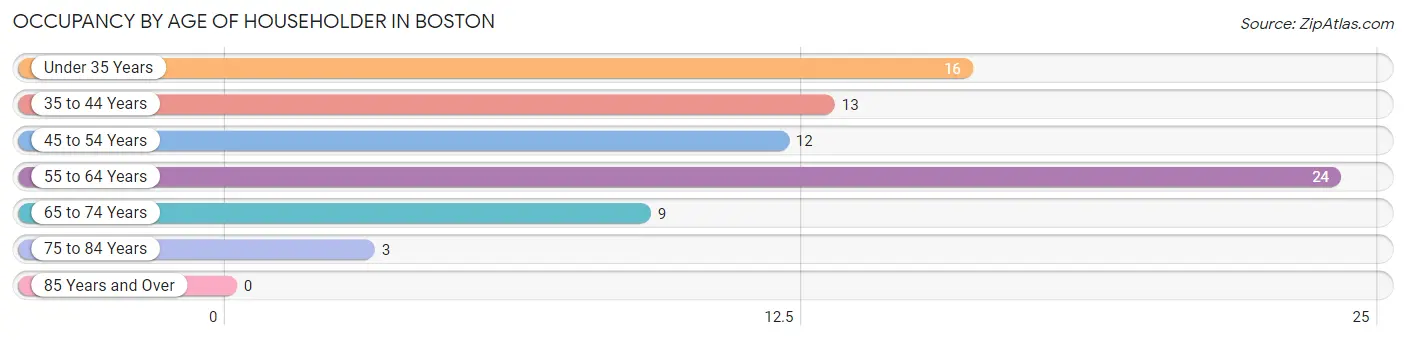
| Age Bracket | # Households | % Households |
| Under 35 Years | 16 | 20.8% |
| 35 to 44 Years | 13 | 16.9% |
| 45 to 54 Years | 12 | 15.6% |
| 55 to 64 Years | 24 | 31.2% |
| 65 to 74 Years | 9 | 11.7% |
| 75 to 84 Years | 3 | 3.9% |
| 85 Years and Over | 0 | 0.0% |
| Total | 77 | 100.0% |
Housing Finances in Boston
Median Income by Occupancy in Boston
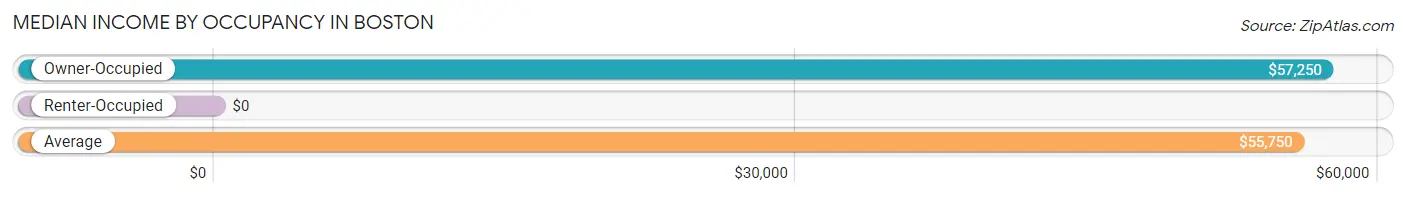
| Occupancy Type | # Households | Median Income |
| Owner-Occupied | 41 (53.2%) | $57,250 |
| Renter-Occupied | 36 (46.8%) | $0 |
| Average | 77 (100.0%) | $55,750 |
Occupancy by Householder Income Bracket in Boston
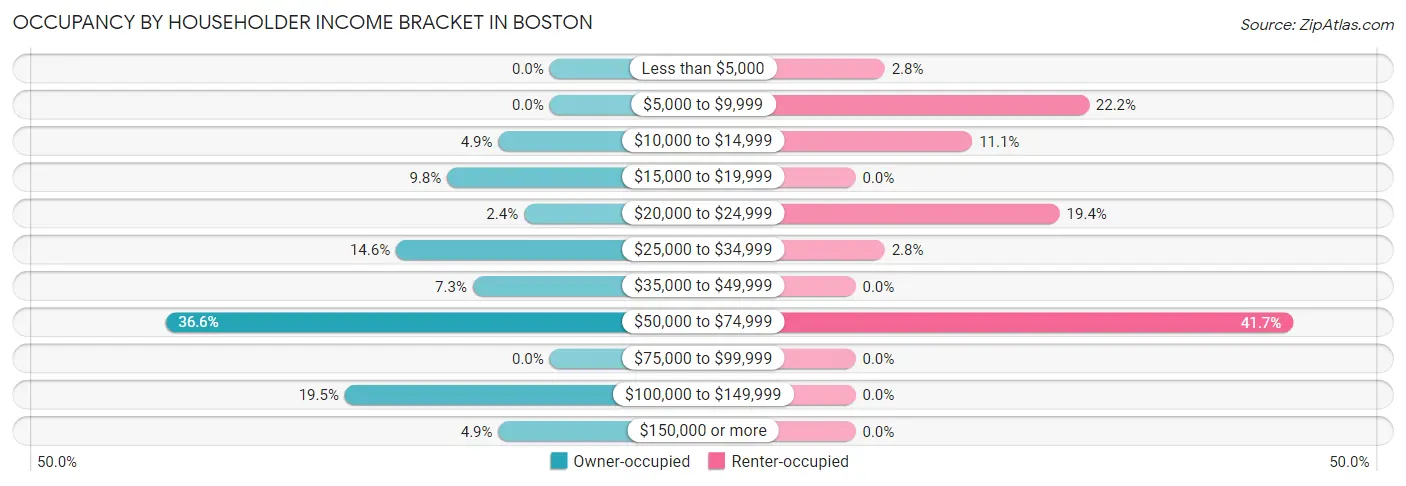
| Income Bracket | Owner-occupied | Renter-occupied |
| Less than $5,000 | 0 (0.0%) | 1 (2.8%) |
| $5,000 to $9,999 | 0 (0.0%) | 8 (22.2%) |
| $10,000 to $14,999 | 2 (4.9%) | 4 (11.1%) |
| $15,000 to $19,999 | 4 (9.8%) | 0 (0.0%) |
| $20,000 to $24,999 | 1 (2.4%) | 7 (19.4%) |
| $25,000 to $34,999 | 6 (14.6%) | 1 (2.8%) |
| $35,000 to $49,999 | 3 (7.3%) | 0 (0.0%) |
| $50,000 to $74,999 | 15 (36.6%) | 15 (41.7%) |
| $75,000 to $99,999 | 0 (0.0%) | 0 (0.0%) |
| $100,000 to $149,999 | 8 (19.5%) | 0 (0.0%) |
| $150,000 or more | 2 (4.9%) | 0 (0.0%) |
| Total | 41 (100.0%) | 36 (100.0%) |
Monthly Housing Cost Tiers in Boston
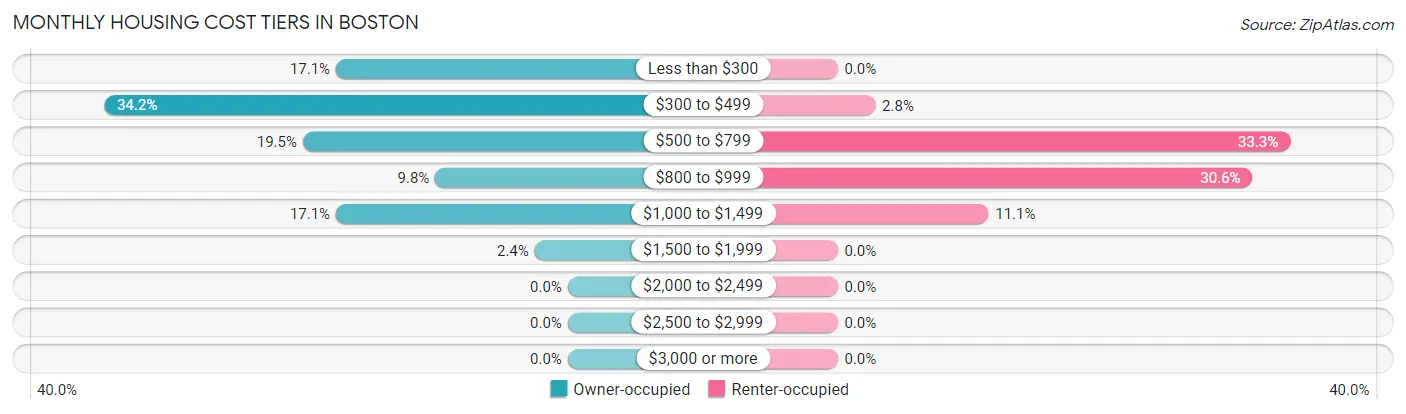
| Monthly Cost | Owner-occupied | Renter-occupied |
| Less than $300 | 7 (17.1%) | 0 (0.0%) |
| $300 to $499 | 14 (34.2%) | 1 (2.8%) |
| $500 to $799 | 8 (19.5%) | 12 (33.3%) |
| $800 to $999 | 4 (9.8%) | 11 (30.6%) |
| $1,000 to $1,499 | 7 (17.1%) | 4 (11.1%) |
| $1,500 to $1,999 | 1 (2.4%) | 0 (0.0%) |
| $2,000 to $2,499 | 0 (0.0%) | 0 (0.0%) |
| $2,500 to $2,999 | 0 (0.0%) | 0 (0.0%) |
| $3,000 or more | 0 (0.0%) | 0 (0.0%) |
| Total | 41 (100.0%) | 36 (100.0%) |
Physical Housing Characteristics in Boston
Housing Structures in Boston
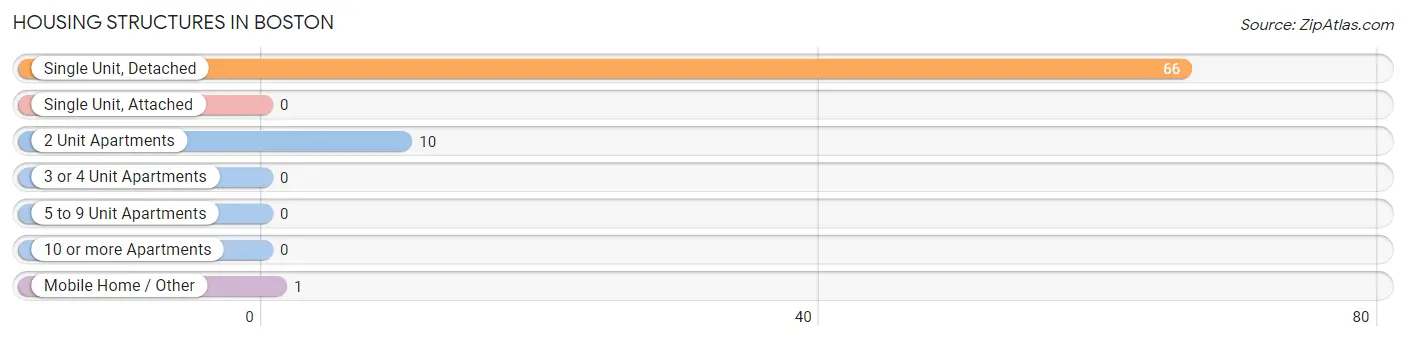
| Structure Type | # Housing Units | % Housing Units |
| Single Unit, Detached | 66 | 85.7% |
| Single Unit, Attached | 0 | 0.0% |
| 2 Unit Apartments | 10 | 13.0% |
| 3 or 4 Unit Apartments | 0 | 0.0% |
| 5 to 9 Unit Apartments | 0 | 0.0% |
| 10 or more Apartments | 0 | 0.0% |
| Mobile Home / Other | 1 | 1.3% |
| Total | 77 | 100.0% |
Housing Structures by Occupancy in Boston
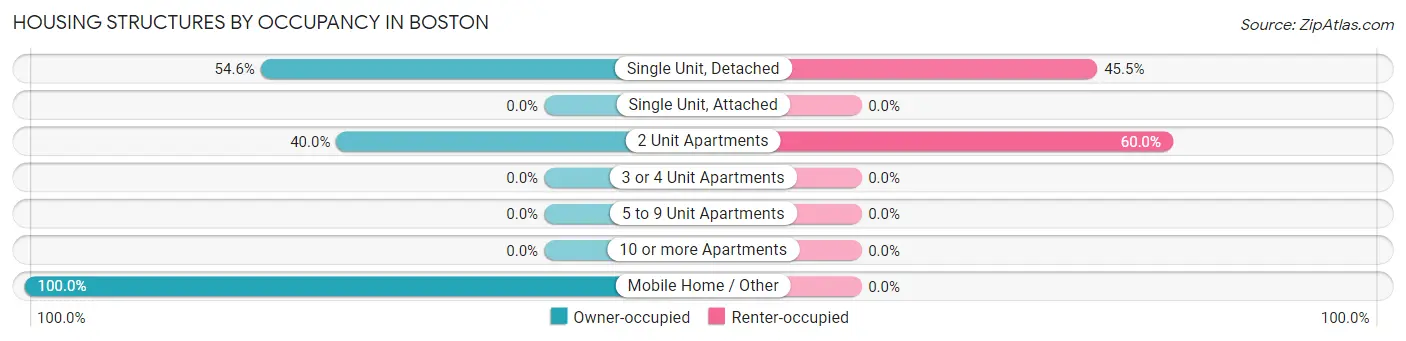
| Structure Type | Owner-occupied | Renter-occupied |
| Single Unit, Detached | 36 (54.5%) | 30 (45.5%) |
| Single Unit, Attached | 0 (0.0%) | 0 (0.0%) |
| 2 Unit Apartments | 4 (40.0%) | 6 (60.0%) |
| 3 or 4 Unit Apartments | 0 (0.0%) | 0 (0.0%) |
| 5 to 9 Unit Apartments | 0 (0.0%) | 0 (0.0%) |
| 10 or more Apartments | 0 (0.0%) | 0 (0.0%) |
| Mobile Home / Other | 1 (100.0%) | 0 (0.0%) |
| Total | 41 (53.2%) | 36 (46.8%) |
Housing Structures by Number of Rooms in Boston
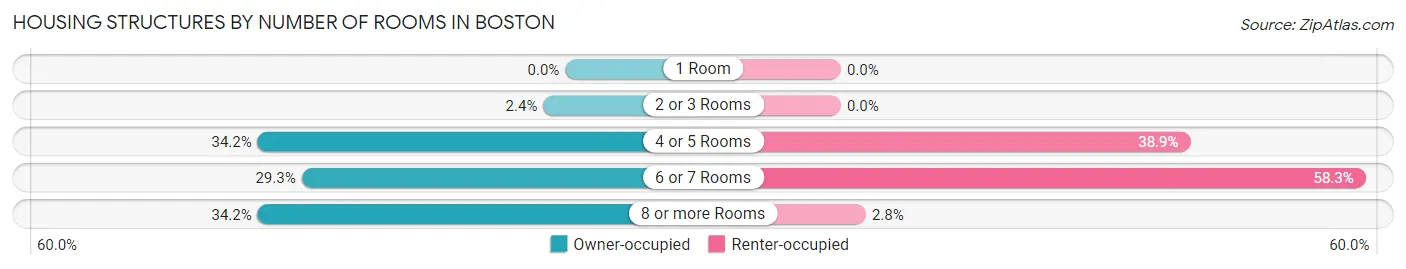
| Number of Rooms | Owner-occupied | Renter-occupied |
| 1 Room | 0 (0.0%) | 0 (0.0%) |
| 2 or 3 Rooms | 1 (2.4%) | 0 (0.0%) |
| 4 or 5 Rooms | 14 (34.2%) | 14 (38.9%) |
| 6 or 7 Rooms | 12 (29.3%) | 21 (58.3%) |
| 8 or more Rooms | 14 (34.2%) | 1 (2.8%) |
| Total | 41 (100.0%) | 36 (100.0%) |
Housing Structure by Heating Type in Boston
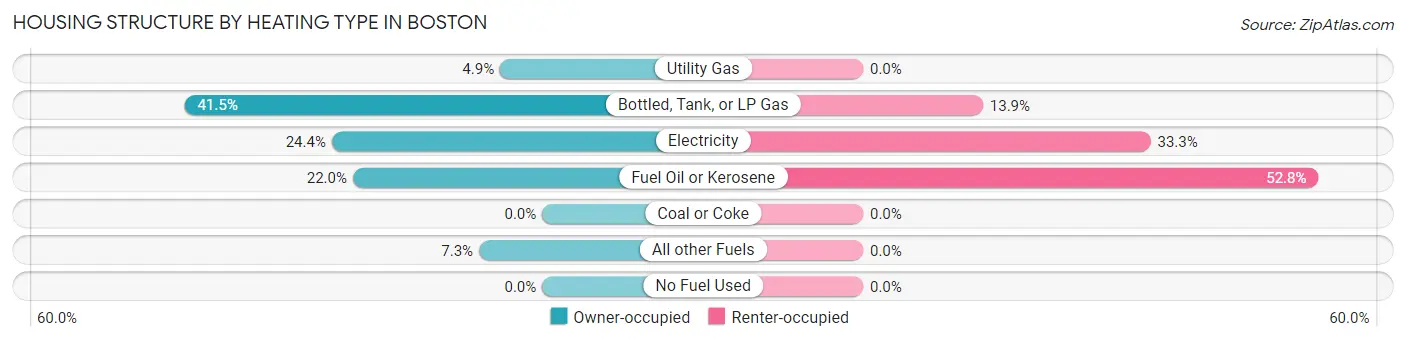
| Heating Type | Owner-occupied | Renter-occupied |
| Utility Gas | 2 (4.9%) | 0 (0.0%) |
| Bottled, Tank, or LP Gas | 17 (41.5%) | 5 (13.9%) |
| Electricity | 10 (24.4%) | 12 (33.3%) |
| Fuel Oil or Kerosene | 9 (22.0%) | 19 (52.8%) |
| Coal or Coke | 0 (0.0%) | 0 (0.0%) |
| All other Fuels | 3 (7.3%) | 0 (0.0%) |
| No Fuel Used | 0 (0.0%) | 0 (0.0%) |
| Total | 41 (100.0%) | 36 (100.0%) |
Household Vehicle Usage in Boston
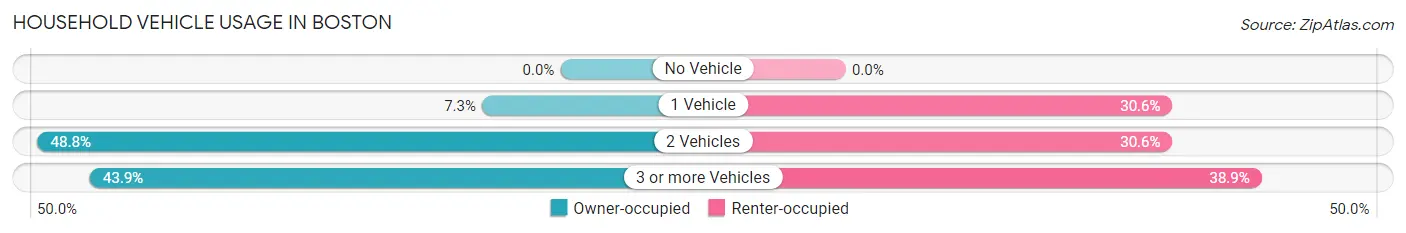
| Vehicles per Household | Owner-occupied | Renter-occupied |
| No Vehicle | 0 (0.0%) | 0 (0.0%) |
| 1 Vehicle | 3 (7.3%) | 11 (30.6%) |
| 2 Vehicles | 20 (48.8%) | 11 (30.6%) |
| 3 or more Vehicles | 18 (43.9%) | 14 (38.9%) |
| Total | 41 (100.0%) | 36 (100.0%) |
Real Estate & Mortgages in Boston
Real Estate and Mortgage Overview in Boston
| Characteristic | Without Mortgage | With Mortgage |
| Housing Units | 26 | 15 |
| Median Property Value | $72,900 | $75,800 |
| Median Household Income | $55,833 | $0 |
| Monthly Housing Costs | $350 | $0 |
| Real Estate Taxes | $400 | $0 |
Property Value by Mortgage Status in Boston
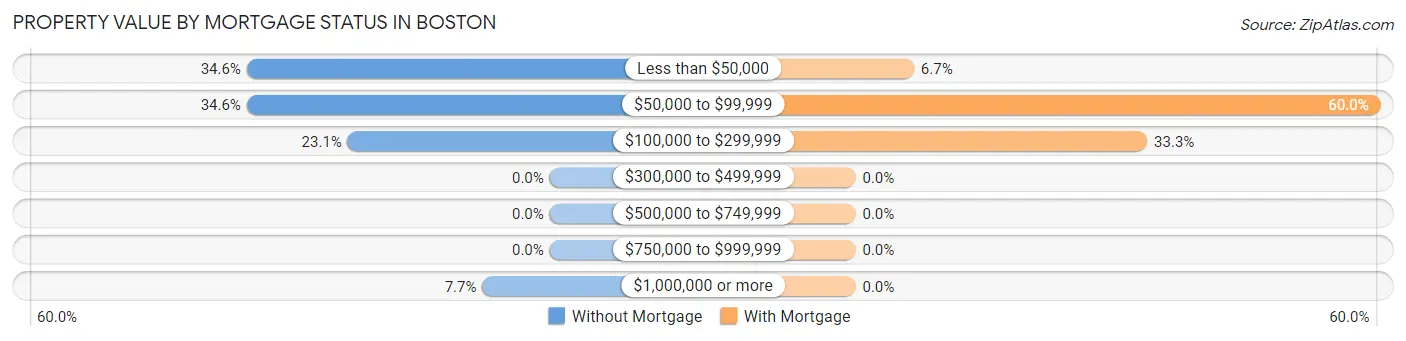
| Property Value | Without Mortgage | With Mortgage |
| Less than $50,000 | 9 (34.6%) | 1 (6.7%) |
| $50,000 to $99,999 | 9 (34.6%) | 9 (60.0%) |
| $100,000 to $299,999 | 6 (23.1%) | 5 (33.3%) |
| $300,000 to $499,999 | 0 (0.0%) | 0 (0.0%) |
| $500,000 to $749,999 | 0 (0.0%) | 0 (0.0%) |
| $750,000 to $999,999 | 0 (0.0%) | 0 (0.0%) |
| $1,000,000 or more | 2 (7.7%) | 0 (0.0%) |
| Total | 26 (100.0%) | 15 (100.0%) |
Household Income by Mortgage Status in Boston
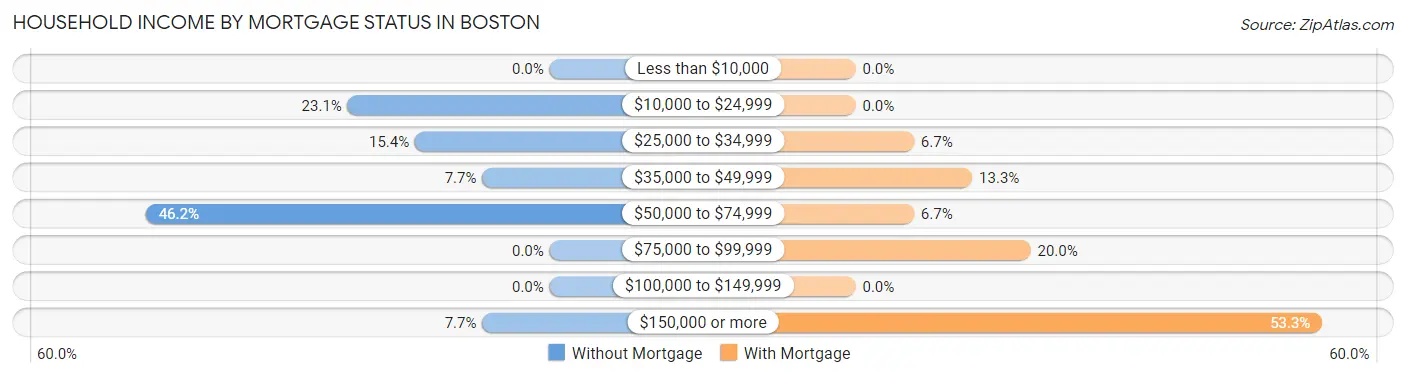
| Household Income | Without Mortgage | With Mortgage |
| Less than $10,000 | 0 (0.0%) | 0 (0.0%) |
| $10,000 to $24,999 | 6 (23.1%) | 0 (0.0%) |
| $25,000 to $34,999 | 4 (15.4%) | 1 (6.7%) |
| $35,000 to $49,999 | 2 (7.7%) | 2 (13.3%) |
| $50,000 to $74,999 | 12 (46.2%) | 1 (6.7%) |
| $75,000 to $99,999 | 0 (0.0%) | 3 (20.0%) |
| $100,000 to $149,999 | 0 (0.0%) | 0 (0.0%) |
| $150,000 or more | 2 (7.7%) | 8 (53.3%) |
| Total | 26 (100.0%) | 15 (100.0%) |
Property Value to Household Income Ratio in Boston
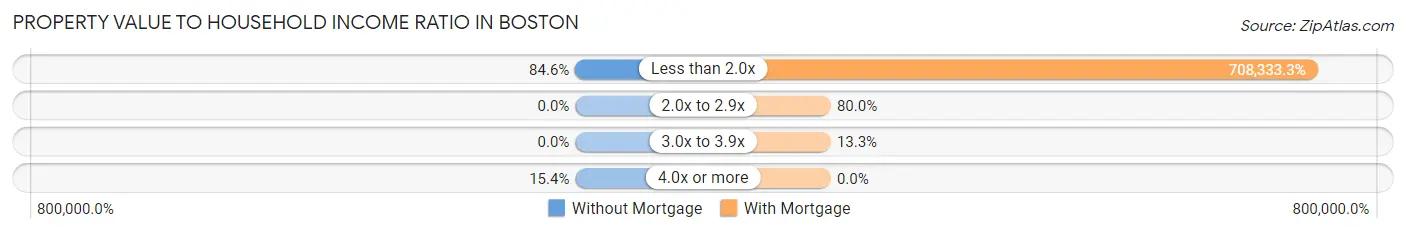
| Value-to-Income Ratio | Without Mortgage | With Mortgage |
| Less than 2.0x | 22 (84.6%) | 106,250 (708,333.3%) |
| 2.0x to 2.9x | 0 (0.0%) | 12 (80.0%) |
| 3.0x to 3.9x | 0 (0.0%) | 2 (13.3%) |
| 4.0x or more | 4 (15.4%) | 0 (0.0%) |
| Total | 26 (100.0%) | 15 (100.0%) |
Real Estate Taxes by Mortgage Status in Boston
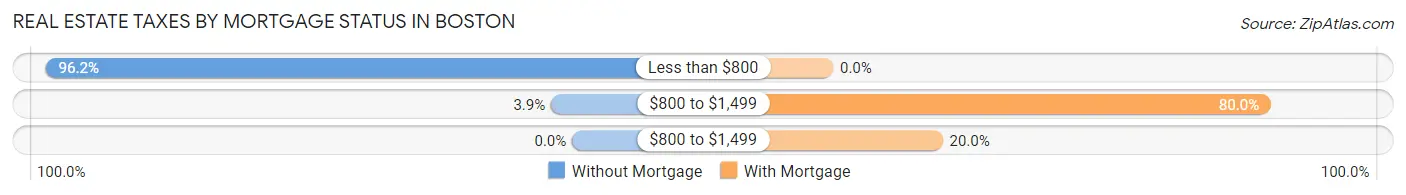
| Property Taxes | Without Mortgage | With Mortgage |
| Less than $800 | 25 (96.2%) | 0 (0.0%) |
| $800 to $1,499 | 1 (3.8%) | 12 (80.0%) |
| $800 to $1,499 | 0 (0.0%) | 3 (20.0%) |
| Total | 26 (100.0%) | 15 (100.0%) |
Health & Disability in Boston
Health Insurance Coverage by Age in Boston
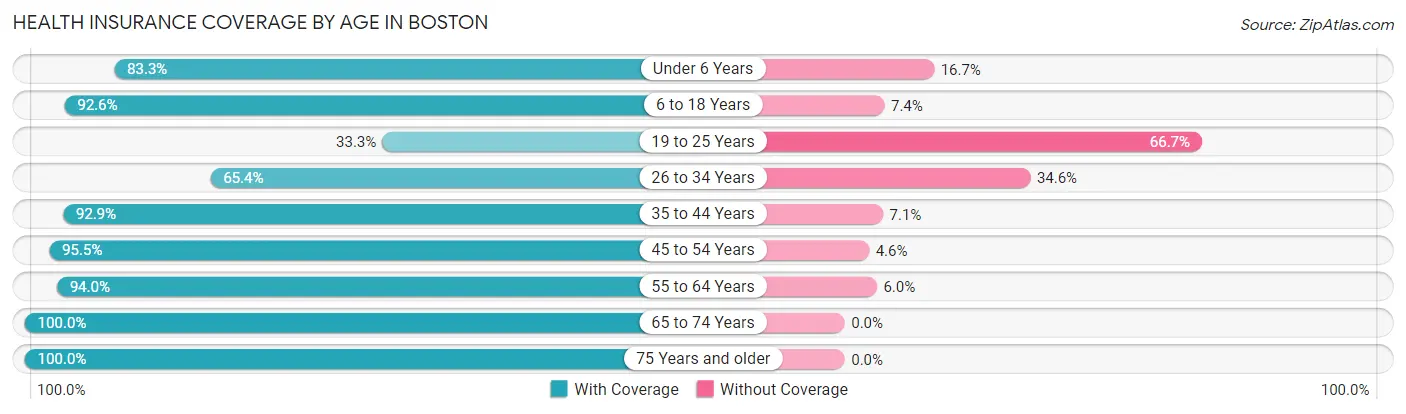
| Age Bracket | With Coverage | Without Coverage |
| Under 6 Years | 15 (83.3%) | 3 (16.7%) |
| 6 to 18 Years | 50 (92.6%) | 4 (7.4%) |
| 19 to 25 Years | 4 (33.3%) | 8 (66.7%) |
| 26 to 34 Years | 17 (65.4%) | 9 (34.6%) |
| 35 to 44 Years | 26 (92.9%) | 2 (7.1%) |
| 45 to 54 Years | 21 (95.5%) | 1 (4.5%) |
| 55 to 64 Years | 47 (94.0%) | 3 (6.0%) |
| 65 to 74 Years | 14 (100.0%) | 0 (0.0%) |
| 75 Years and older | 3 (100.0%) | 0 (0.0%) |
| Total | 197 (86.8%) | 30 (13.2%) |
Health Insurance Coverage by Citizenship Status in Boston
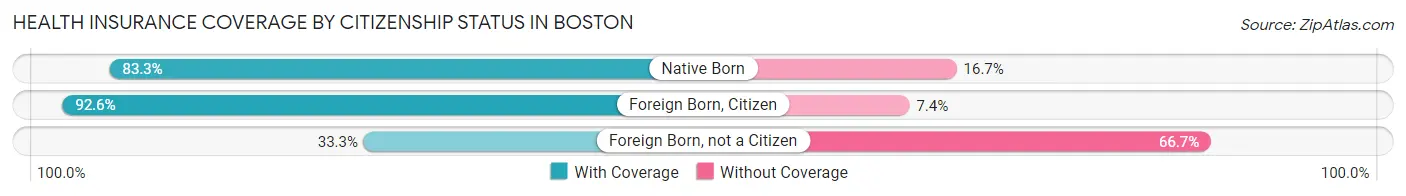
| Citizenship Status | With Coverage | Without Coverage |
| Native Born | 15 (83.3%) | 3 (16.7%) |
| Foreign Born, Citizen | 50 (92.6%) | 4 (7.4%) |
| Foreign Born, not a Citizen | 4 (33.3%) | 8 (66.7%) |
Health Insurance Coverage by Household Income in Boston
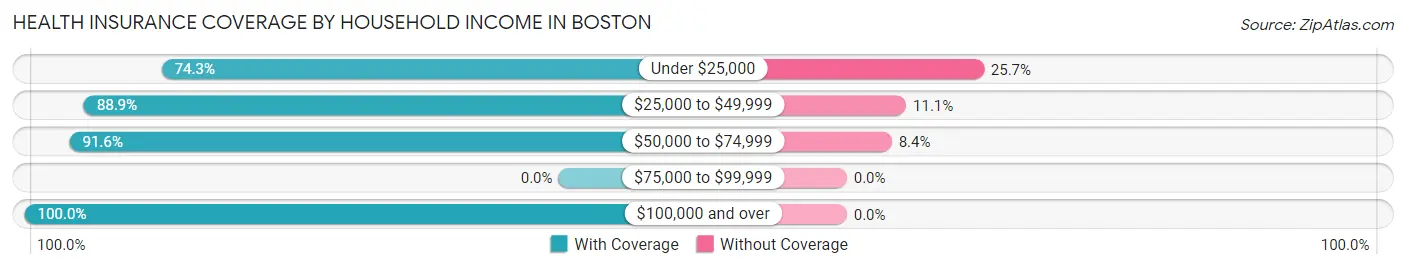
| Household Income | With Coverage | Without Coverage |
| Under $25,000 | 55 (74.3%) | 19 (25.7%) |
| $25,000 to $49,999 | 24 (88.9%) | 3 (11.1%) |
| $50,000 to $74,999 | 87 (91.6%) | 8 (8.4%) |
| $75,000 to $99,999 | 0 (0.0%) | 0 (0.0%) |
| $100,000 and over | 31 (100.0%) | 0 (0.0%) |
Public vs Private Health Insurance Coverage by Age in Boston
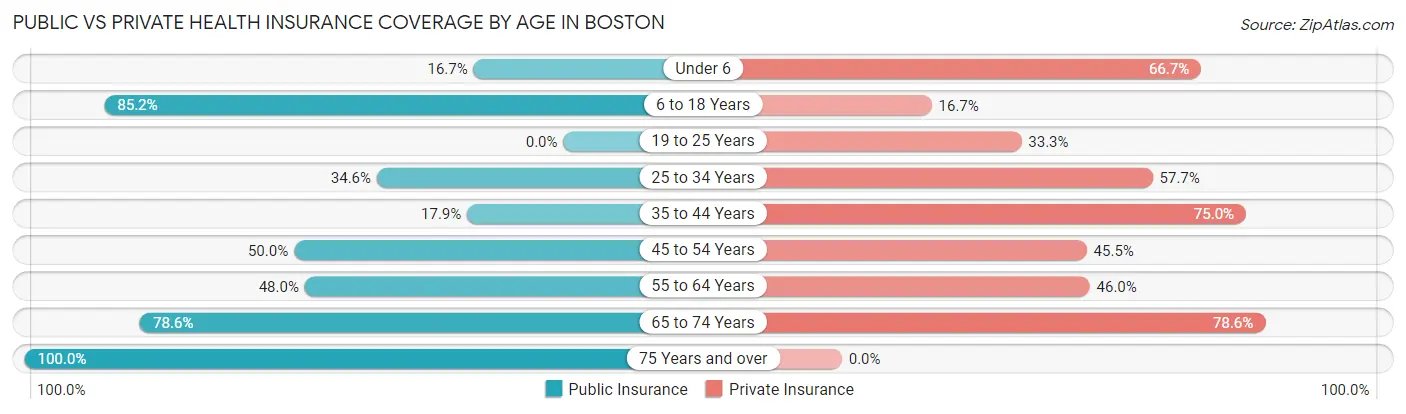
| Age Bracket | Public Insurance | Private Insurance |
| Under 6 | 3 (16.7%) | 12 (66.7%) |
| 6 to 18 Years | 46 (85.2%) | 9 (16.7%) |
| 19 to 25 Years | 0 (0.0%) | 4 (33.3%) |
| 25 to 34 Years | 9 (34.6%) | 15 (57.7%) |
| 35 to 44 Years | 5 (17.9%) | 21 (75.0%) |
| 45 to 54 Years | 11 (50.0%) | 10 (45.5%) |
| 55 to 64 Years | 24 (48.0%) | 23 (46.0%) |
| 65 to 74 Years | 11 (78.6%) | 11 (78.6%) |
| 75 Years and over | 3 (100.0%) | 0 (0.0%) |
| Total | 112 (49.3%) | 105 (46.3%) |
Disability Status by Sex by Age in Boston
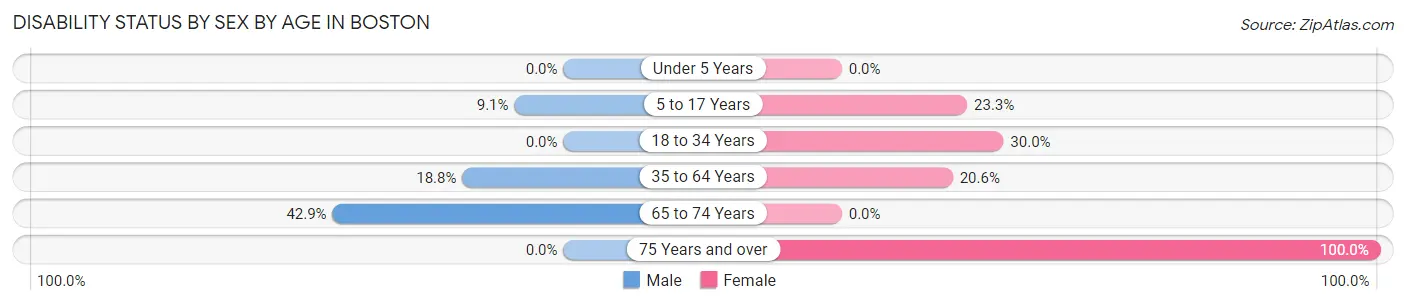
| Age Bracket | Male | Female |
| Under 5 Years | 0 (0.0%) | 0 (0.0%) |
| 5 to 17 Years | 1 (9.1%) | 10 (23.3%) |
| 18 to 34 Years | 0 (0.0%) | 6 (30.0%) |
| 35 to 64 Years | 6 (18.8%) | 14 (20.6%) |
| 65 to 74 Years | 3 (42.9%) | 0 (0.0%) |
| 75 Years and over | 0 (0.0%) | 3 (100.0%) |
Disability Class by Sex by Age in Boston
Disability Class: Hearing Difficulty
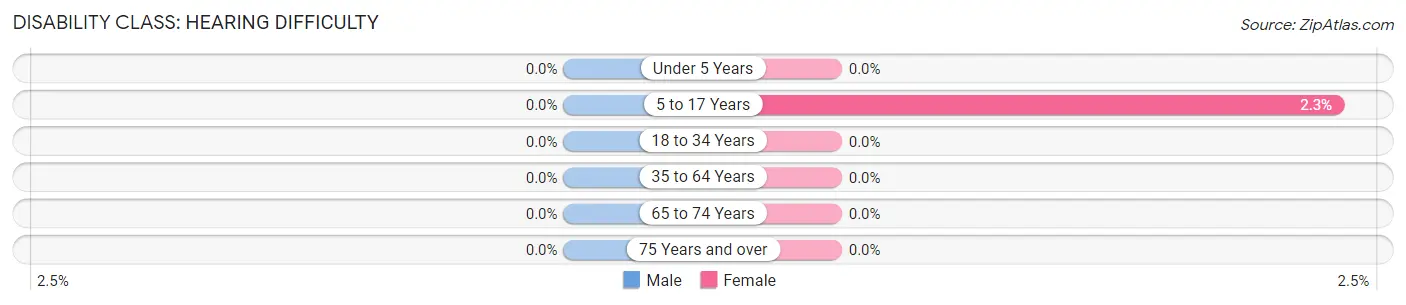
| Age Bracket | Male | Female |
| Under 5 Years | 0 (0.0%) | 0 (0.0%) |
| 5 to 17 Years | 0 (0.0%) | 1 (2.3%) |
| 18 to 34 Years | 0 (0.0%) | 0 (0.0%) |
| 35 to 64 Years | 0 (0.0%) | 0 (0.0%) |
| 65 to 74 Years | 0 (0.0%) | 0 (0.0%) |
| 75 Years and over | 0 (0.0%) | 0 (0.0%) |
Disability Class: Vision Difficulty
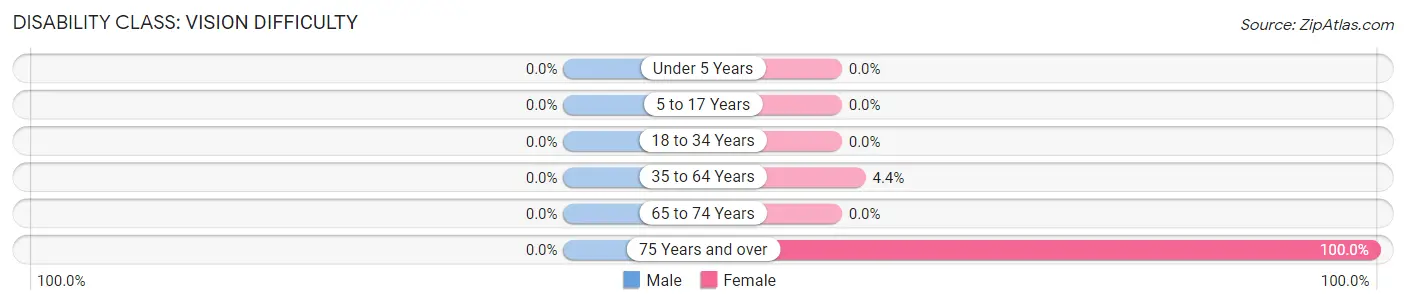
| Age Bracket | Male | Female |
| Under 5 Years | 0 (0.0%) | 0 (0.0%) |
| 5 to 17 Years | 0 (0.0%) | 0 (0.0%) |
| 18 to 34 Years | 0 (0.0%) | 0 (0.0%) |
| 35 to 64 Years | 0 (0.0%) | 3 (4.4%) |
| 65 to 74 Years | 0 (0.0%) | 0 (0.0%) |
| 75 Years and over | 0 (0.0%) | 3 (100.0%) |
Disability Class: Cognitive Difficulty
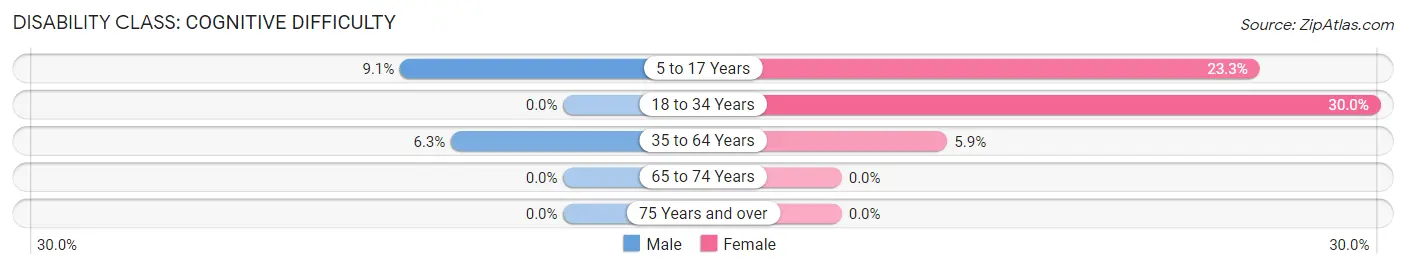
| Age Bracket | Male | Female |
| 5 to 17 Years | 1 (9.1%) | 10 (23.3%) |
| 18 to 34 Years | 0 (0.0%) | 6 (30.0%) |
| 35 to 64 Years | 2 (6.2%) | 4 (5.9%) |
| 65 to 74 Years | 0 (0.0%) | 0 (0.0%) |
| 75 Years and over | 0 (0.0%) | 0 (0.0%) |
Disability Class: Ambulatory Difficulty
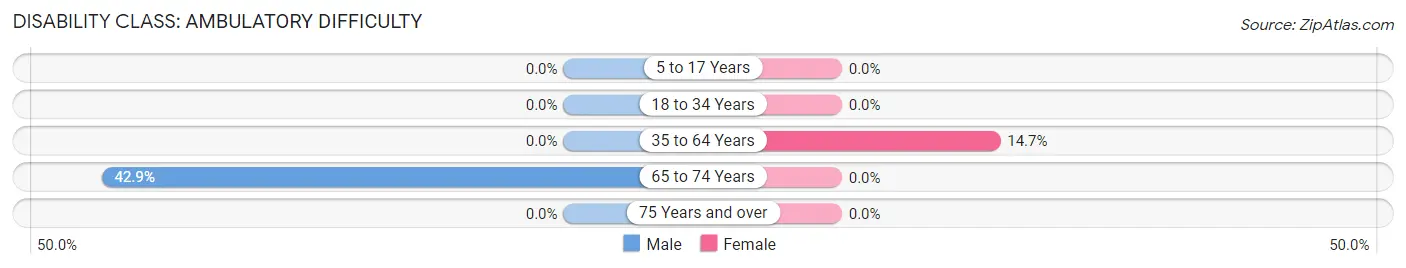
| Age Bracket | Male | Female |
| 5 to 17 Years | 0 (0.0%) | 0 (0.0%) |
| 18 to 34 Years | 0 (0.0%) | 0 (0.0%) |
| 35 to 64 Years | 0 (0.0%) | 10 (14.7%) |
| 65 to 74 Years | 3 (42.9%) | 0 (0.0%) |
| 75 Years and over | 0 (0.0%) | 0 (0.0%) |
Disability Class: Self-Care Difficulty
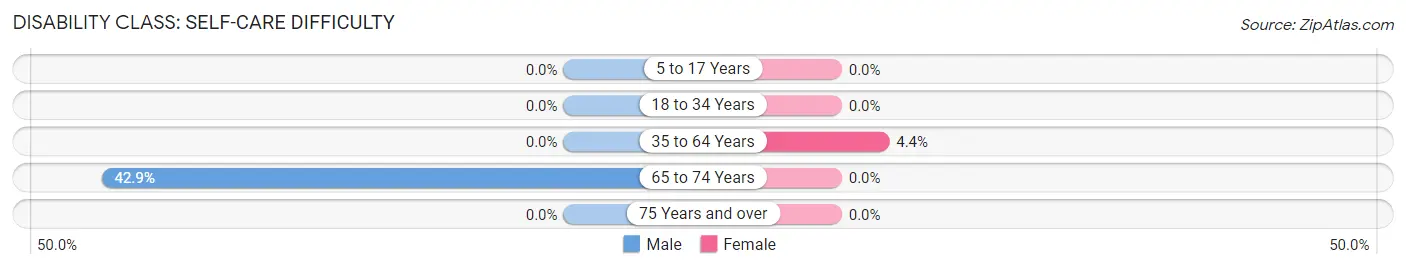
| Age Bracket | Male | Female |
| 5 to 17 Years | 0 (0.0%) | 0 (0.0%) |
| 18 to 34 Years | 0 (0.0%) | 0 (0.0%) |
| 35 to 64 Years | 0 (0.0%) | 3 (4.4%) |
| 65 to 74 Years | 3 (42.9%) | 0 (0.0%) |
| 75 Years and over | 0 (0.0%) | 0 (0.0%) |
Technology Access in Boston
Computing Device Access in Boston
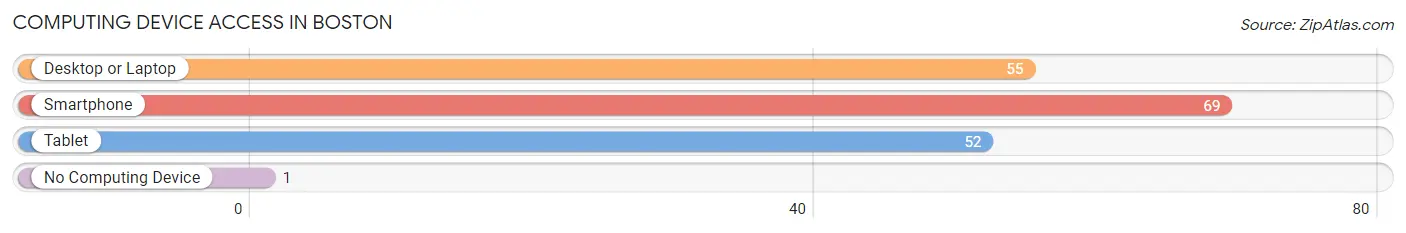
| Device Type | # Households | % Households |
| Desktop or Laptop | 55 | 71.4% |
| Smartphone | 69 | 89.6% |
| Tablet | 52 | 67.5% |
| No Computing Device | 1 | 1.3% |
| Total | 77 | 100.0% |
Internet Access in Boston
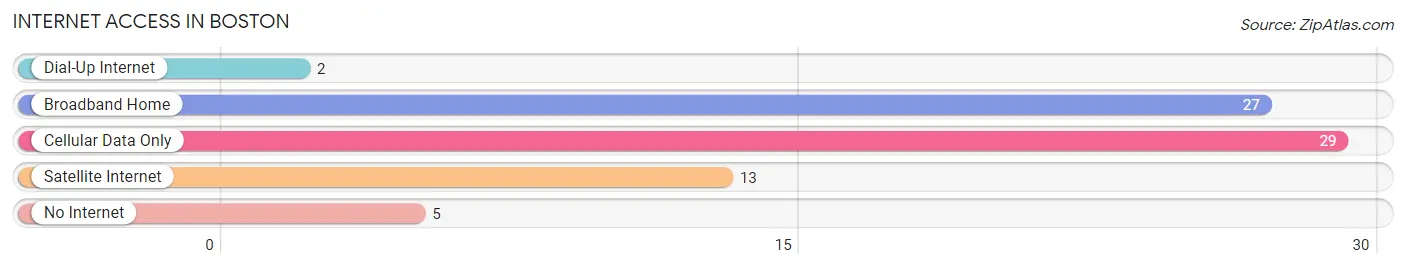
| Internet Type | # Households | % Households |
| Dial-Up Internet | 2 | 2.6% |
| Broadband Home | 27 | 35.1% |
| Cellular Data Only | 29 | 37.7% |
| Satellite Internet | 13 | 16.9% |
| No Internet | 5 | 6.5% |
| Total | 77 | 100.0% |
Boston Summary
Boston, Massachusetts is a city located in the northeastern United States. It is the capital of the Commonwealth of Massachusetts and the largest city in New England. Boston is one of the oldest cities in the United States, founded in 1630 by Puritan settlers from England. It has since become a major center of culture, education, and industry. The city is home to numerous universities, museums, and other cultural institutions, as well as a vibrant economy and a diverse population.
Geography
Boston is located in eastern Massachusetts, on the Atlantic coast. It is bordered by the cities of Cambridge, Somerville, and Brookline to the north; the towns of Winthrop, Revere, and Chelsea to the east; the towns of Milton and Quincy to the south; and the towns of Dedham and Needham to the west. The city is situated on a peninsula, with the Charles River to the west and the Mystic River to the east. The city covers an area of 89.6 square miles, with a population of 667,137 in 2019.
Climate
Boston has a humid continental climate, with warm summers and cold winters. The average temperature in July is 73°F, while the average temperature in January is 28°F. The city receives an average of 43 inches of precipitation per year, with the most occurring in the months of March and April.
Economy
Boston is a major economic center in the United States. The city is home to numerous Fortune 500 companies, including Liberty Mutual Insurance, State Street Corporation, and Fidelity Investments. The city is also a major center for the financial services industry, with many banks and investment firms located in the city. The city is also home to a number of universities and colleges, including Harvard University, Boston University, and the Massachusetts Institute of Technology. These institutions are major employers in the city, as well as major sources of research and development.
Demographics
Boston is a diverse city, with a population of 667,137 in 2019. The city is majority white, with a population that is 44.2% white, 25.5% African American, 17.4% Hispanic or Latino, 8.9% Asian, and 4.0% other. The median household income in the city is $63,872, and the median home value is $541,400.
Conclusion
Boston is a major city in the northeastern United States, with a rich history, diverse population, and vibrant economy. The city is home to numerous universities, museums, and other cultural institutions, as well as a number of Fortune 500 companies. The city is also a major center for the financial services industry, and is home to a diverse population. Boston is a city of opportunity, with a strong economy and a diverse population.
Common Questions
What is Per Capita Income in Boston?
Per Capita income in Boston is $18,749.
What is the Median Family Income in Boston?
Median Family Income in Boston is $56,750.
What is the Median Household income in Boston?
Median Household Income in Boston is $55,750.
What is Inequality or Gini Index in Boston?
Inequality or Gini Index in Boston is 0.41.
What is the Total Population of Boston?
Total Population of Boston is 227.
What is the Total Male Population of Boston?
Total Male Population of Boston is 79.
What is the Total Female Population of Boston?
Total Female Population of Boston is 148.
What is the Ratio of Males per 100 Females in Boston?
There are 53.38 Males per 100 Females in Boston.
What is the Ratio of Females per 100 Males in Boston?
There are 187.34 Females per 100 Males in Boston.
What is the Median Population Age in Boston?
Median Population Age in Boston is 39.3 Years.
What is the Average Family Size in Boston
Average Family Size in Boston is 2.9 People.
What is the Average Household Size in Boston
Average Household Size in Boston is 3.0 People.
How Large is the Labor Force in Boston?
There are 113 People in the Labor Forcein in Boston.
What is the Percentage of People in the Labor Force in Boston?
66.9% of People are in the Labor Force in Boston.
What is the Unemployment Rate in Boston?
Unemployment Rate in Boston is 8.0%.