Michiana Shores, IN Map & Demographics
Michiana Shores Map
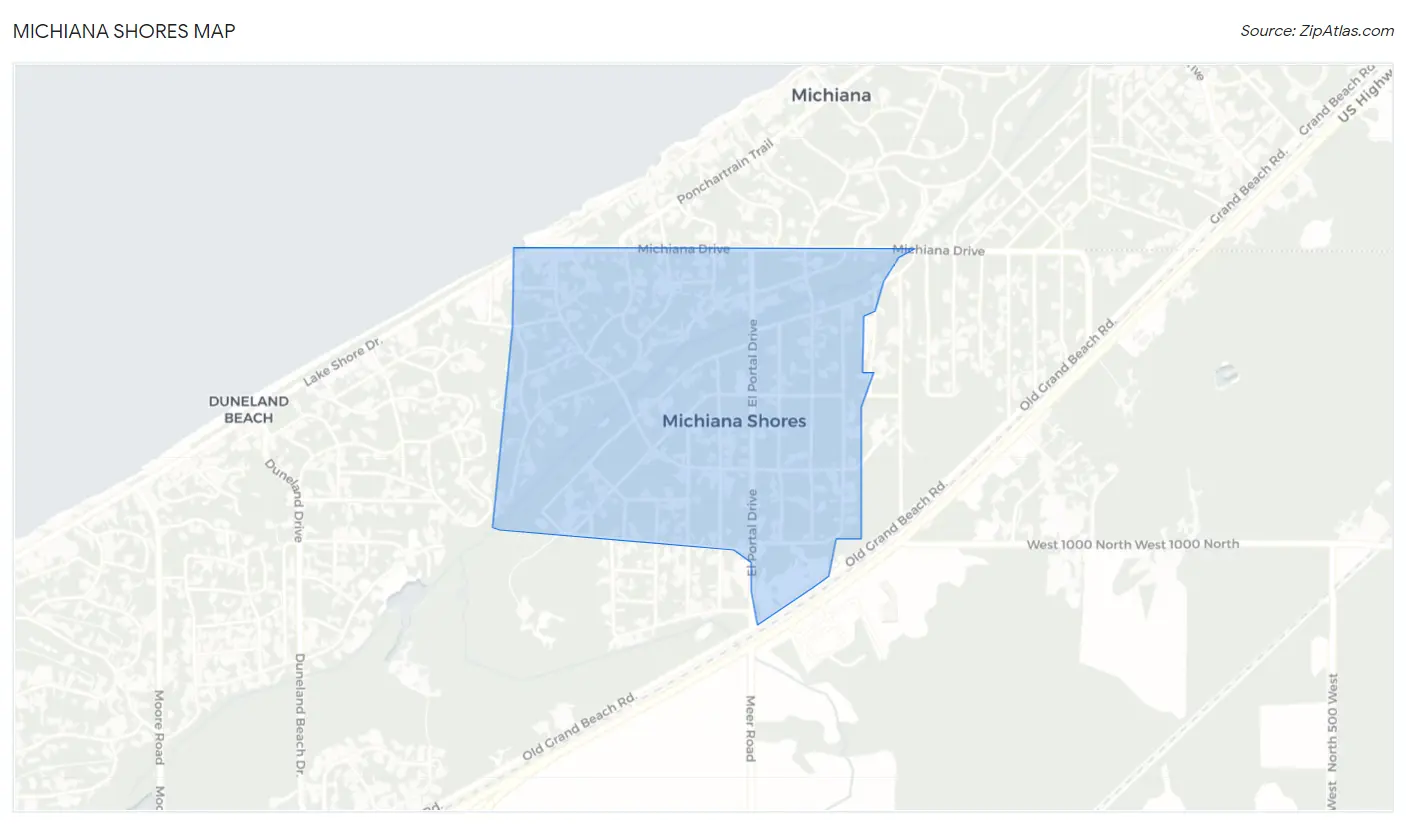
Michiana Shores Overview
$79,113
PER CAPITA INCOME
$125,417
AVG FAMILY INCOME
$87,500
AVG HOUSEHOLD INCOME
55.6%
WAGE / INCOME GAP [ % ]
44.4¢/ $1
WAGE / INCOME GAP [ $ ]
0.56
INEQUALITY / GINI INDEX
420
TOTAL POPULATION
211
MALE POPULATION
209
FEMALE POPULATION
100.96
MALES / 100 FEMALES
99.05
FEMALES / 100 MALES
62.2
MEDIAN AGE
2.5
AVG FAMILY SIZE
1.9
AVG HOUSEHOLD SIZE
186
LABOR FORCE [ PEOPLE ]
49.1%
PERCENT IN LABOR FORCE
2.7%
UNEMPLOYMENT RATE
Michiana Shores Area Codes
Income in Michiana Shores
Income Overview in Michiana Shores
Per Capita Income in Michiana Shores is $79,113, while median incomes of families and households are $125,417 and $87,500 respectively.
| Characteristic | Number | Measure |
| Per Capita Income | 420 | $79,113 |
| Median Family Income | 117 | $125,417 |
| Mean Family Income | 117 | $185,207 |
| Median Household Income | 218 | $87,500 |
| Mean Household Income | 218 | $157,824 |
| Income Deficit | 117 | $0 |
| Wage / Income Gap (%) | 420 | 55.61% |
| Wage / Income Gap ($) | 420 | 44.39¢ per $1 |
| Gini / Inequality Index | 420 | 0.56 |
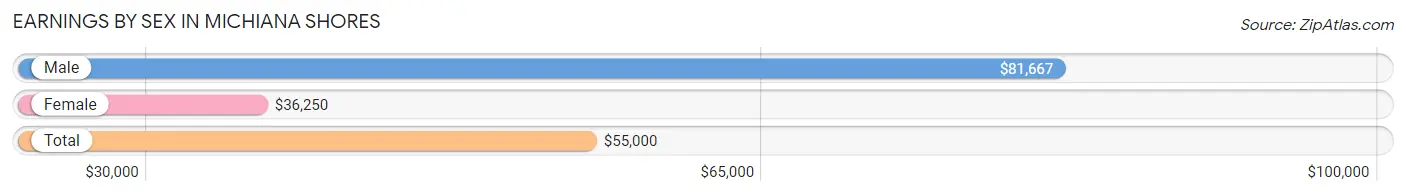
Earnings by Sex in Michiana Shores
Average Earnings in Michiana Shores are $55,000, $81,667 for men and $36,250 for women, a difference of 55.6%.
| Sex | Number | Average Earnings |
| Male | 108 (55.7%) | $81,667 |
| Female | 86 (44.3%) | $36,250 |
| Total | 194 (100.0%) | $55,000 |
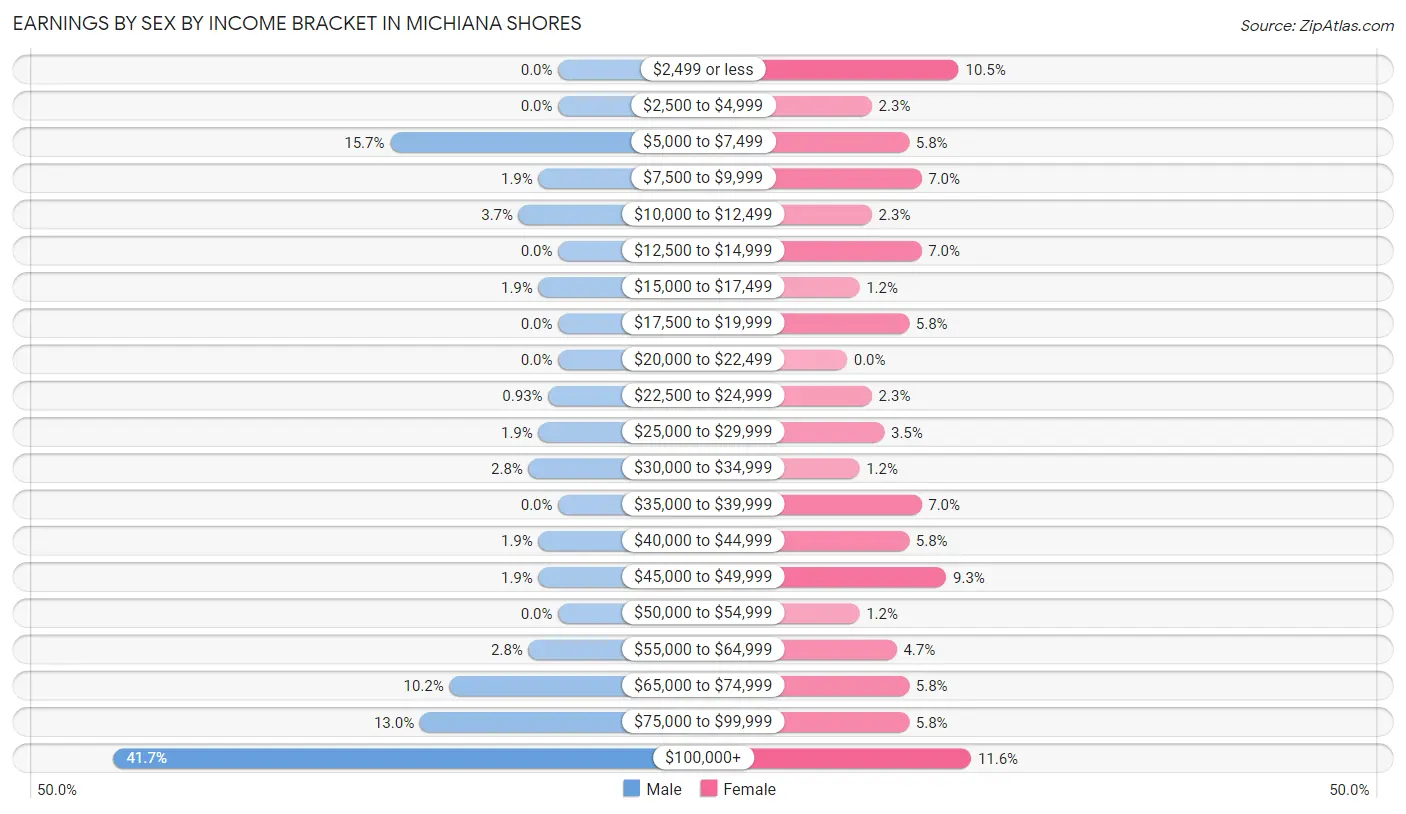
Earnings by Sex by Income Bracket in Michiana Shores
The most common earnings brackets in Michiana Shores are $100,000+ for men (45 | 41.7%) and $100,000+ for women (10 | 11.6%).
| Income | Male | Female |
| $2,499 or less | 0 (0.0%) | 9 (10.5%) |
| $2,500 to $4,999 | 0 (0.0%) | 2 (2.3%) |
| $5,000 to $7,499 | 17 (15.7%) | 5 (5.8%) |
| $7,500 to $9,999 | 2 (1.8%) | 6 (7.0%) |
| $10,000 to $12,499 | 4 (3.7%) | 2 (2.3%) |
| $12,500 to $14,999 | 0 (0.0%) | 6 (7.0%) |
| $15,000 to $17,499 | 2 (1.8%) | 1 (1.2%) |
| $17,500 to $19,999 | 0 (0.0%) | 5 (5.8%) |
| $20,000 to $22,499 | 0 (0.0%) | 0 (0.0%) |
| $22,500 to $24,999 | 1 (0.9%) | 2 (2.3%) |
| $25,000 to $29,999 | 2 (1.8%) | 3 (3.5%) |
| $30,000 to $34,999 | 3 (2.8%) | 1 (1.2%) |
| $35,000 to $39,999 | 0 (0.0%) | 6 (7.0%) |
| $40,000 to $44,999 | 2 (1.8%) | 5 (5.8%) |
| $45,000 to $49,999 | 2 (1.8%) | 8 (9.3%) |
| $50,000 to $54,999 | 0 (0.0%) | 1 (1.2%) |
| $55,000 to $64,999 | 3 (2.8%) | 4 (4.6%) |
| $65,000 to $74,999 | 11 (10.2%) | 5 (5.8%) |
| $75,000 to $99,999 | 14 (13.0%) | 5 (5.8%) |
| $100,000+ | 45 (41.7%) | 10 (11.6%) |
| Total | 108 (100.0%) | 86 (100.0%) |
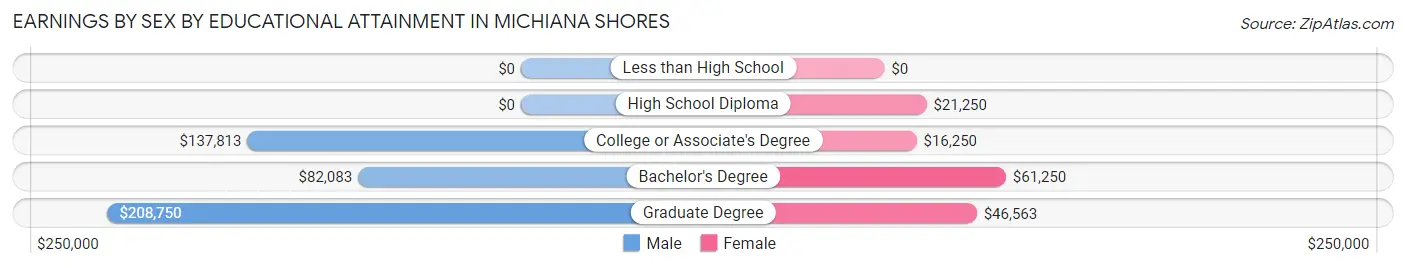
Earnings by Sex by Educational Attainment in Michiana Shores
Average earnings in Michiana Shores are $103,750 for men and $38,125 for women, a difference of 63.2%. Men with an educational attainment of graduate degree enjoy the highest average annual earnings of $208,750, while those with bachelor's degree education earn the least with $82,083. Women with an educational attainment of bachelor's degree earn the most with the average annual earnings of $61,250, while those with college or associate's degree education have the smallest earnings of $16,250.
| Educational Attainment | Male Income | Female Income |
| Less than High School | - | - |
| High School Diploma | - | - |
| College or Associate's Degree | $137,813 | $16,250 |
| Bachelor's Degree | $82,083 | $61,250 |
| Graduate Degree | $208,750 | $46,563 |
| Total | $103,750 | $38,125 |
Family Income in Michiana Shores
Family Income Brackets in Michiana Shores
According to the Michiana Shores family income data, there are 25 families falling into the $200,000+ income range, which is the most common income bracket and makes up 21.4% of all families.
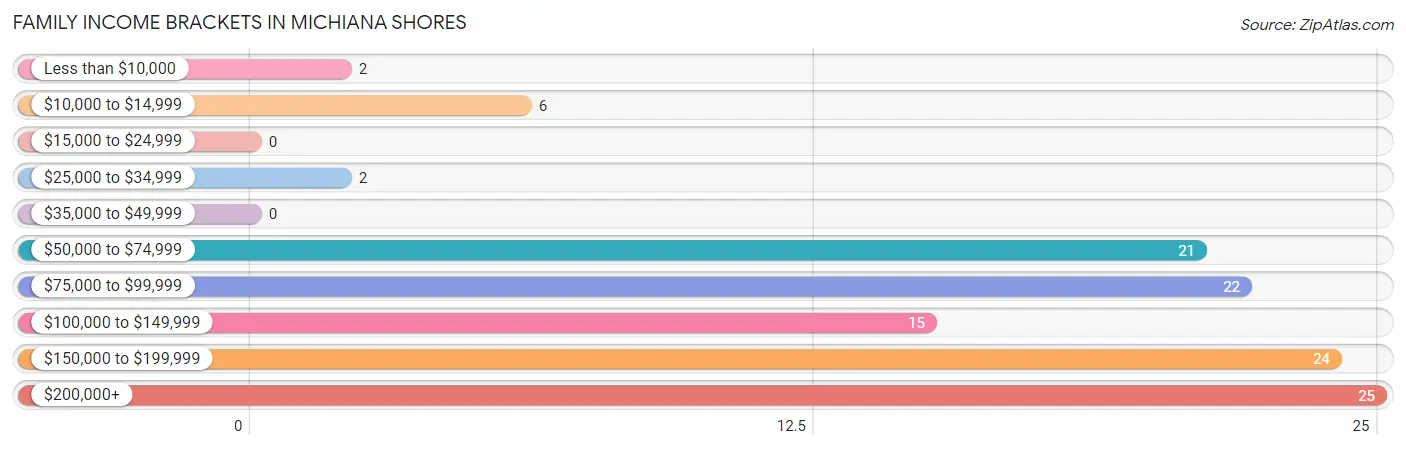
| Income Bracket | # Families | % Families |
| Less than $10,000 | 2 | 1.7% |
| $10,000 to $14,999 | 6 | 5.1% |
| $15,000 to $24,999 | 0 | 0.0% |
| $25,000 to $34,999 | 2 | 1.7% |
| $35,000 to $49,999 | 0 | 0.0% |
| $50,000 to $74,999 | 21 | 17.9% |
| $75,000 to $99,999 | 22 | 18.8% |
| $100,000 to $149,999 | 15 | 12.8% |
| $150,000 to $199,999 | 24 | 20.5% |
| $200,000+ | 25 | 21.4% |
Family Income by Famaliy Size in Michiana Shores
3-person families (10 | 8.6%) account for the highest median family income in Michiana Shores with $138,750 per family, while 2-person families (88 | 75.2%) have the highest median income of $55,625 per family member.
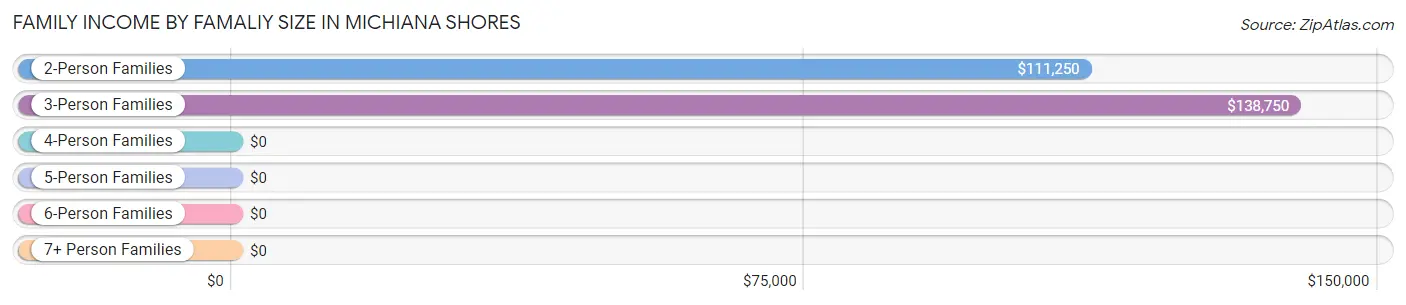
| Income Bracket | # Families | Median Income |
| 2-Person Families | 88 (75.2%) | $111,250 |
| 3-Person Families | 10 (8.6%) | $138,750 |
| 4-Person Families | 5 (4.3%) | $0 |
| 5-Person Families | 12 (10.3%) | $0 |
| 6-Person Families | 2 (1.7%) | $0 |
| 7+ Person Families | 0 (0.0%) | $0 |
| Total | 117 (100.0%) | $125,417 |
Family Income by Number of Earners in Michiana Shores
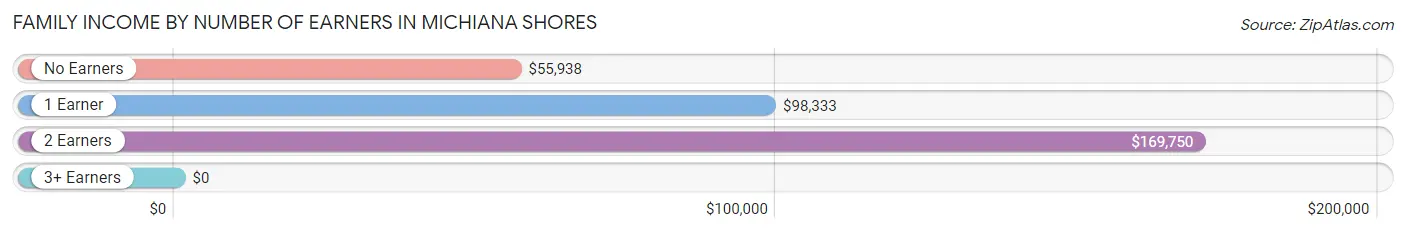
| Number of Earners | # Families | Median Income |
| No Earners | 33 (28.2%) | $55,938 |
| 1 Earner | 34 (29.1%) | $98,333 |
| 2 Earners | 45 (38.5%) | $169,750 |
| 3+ Earners | 5 (4.3%) | $0 |
| Total | 117 (100.0%) | $125,417 |
Household Income in Michiana Shores
Household Income Brackets in Michiana Shores
With 44 households falling in the category, the $200,000+ income range is the most frequent in Michiana Shores, accounting for 20.2% of all households. In contrast, only 5 households (2.3%) fall into the less than $10,000 income bracket, making it the least populous group.
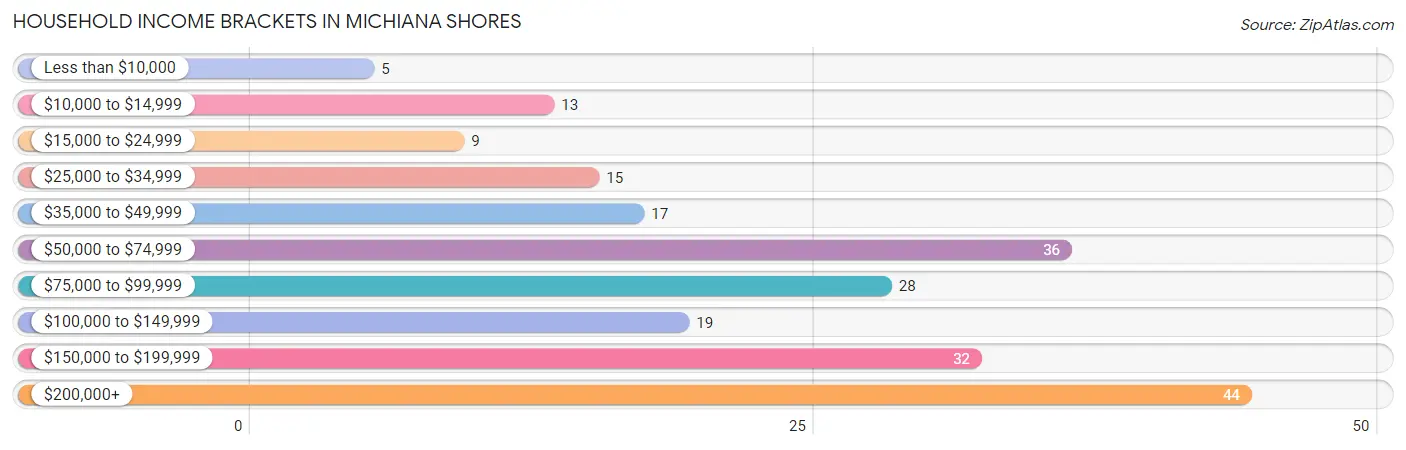
| Income Bracket | # Households | % Households |
| Less than $10,000 | 5 | 2.3% |
| $10,000 to $14,999 | 13 | 6.0% |
| $15,000 to $24,999 | 9 | 4.1% |
| $25,000 to $34,999 | 15 | 6.9% |
| $35,000 to $49,999 | 17 | 7.8% |
| $50,000 to $74,999 | 36 | 16.5% |
| $75,000 to $99,999 | 28 | 12.8% |
| $100,000 to $149,999 | 19 | 8.7% |
| $150,000 to $199,999 | 32 | 14.7% |
| $200,000+ | 44 | 20.2% |
Household Income by Householder Age in Michiana Shores
The median household income in Michiana Shores is $87,500, with the highest median household income of $142,000 found in the 45 to 64 years age bracket for the primary householder. A total of 86 households (39.5%) fall into this category. Meanwhile, the 15 to 24 years age bracket for the primary householder has the lowest median household income of $0, with 5 households (2.3%) in this group.
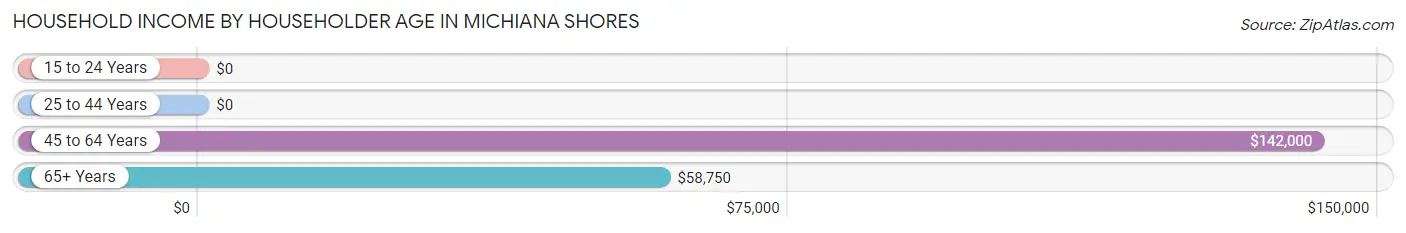
| Income Bracket | # Households | Median Income |
| 15 to 24 Years | 5 (2.3%) | $0 |
| 25 to 44 Years | 24 (11.0%) | $0 |
| 45 to 64 Years | 86 (39.5%) | $142,000 |
| 65+ Years | 103 (47.2%) | $58,750 |
| Total | 218 (100.0%) | $87,500 |
Poverty in Michiana Shores
Income Below Poverty by Sex and Age in Michiana Shores
With 14.7% poverty level for males and 13.4% for females among the residents of Michiana Shores, 6 to 11 year old males and 35 to 44 year old females are the most vulnerable to poverty, with 6 males (100.0%) and 7 females (41.2%) in their respective age groups living below the poverty level.
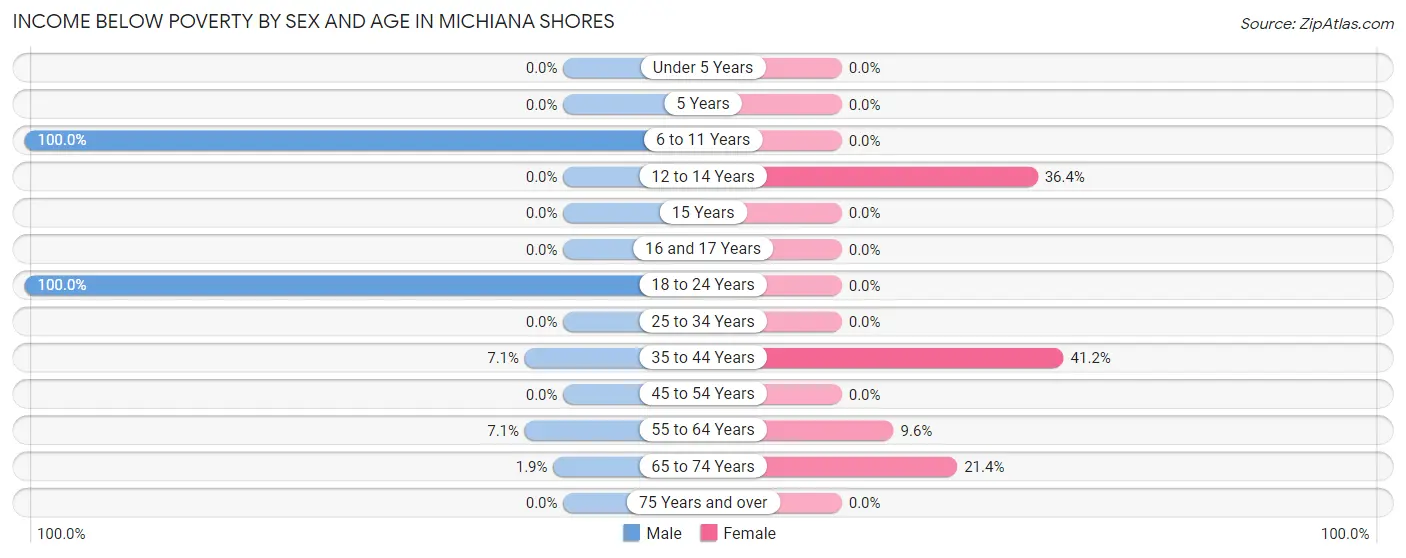
| Age Bracket | Male | Female |
| Under 5 Years | 0 (0.0%) | 0 (0.0%) |
| 5 Years | 0 (0.0%) | 0 (0.0%) |
| 6 to 11 Years | 6 (100.0%) | 0 (0.0%) |
| 12 to 14 Years | 0 (0.0%) | 4 (36.4%) |
| 15 Years | 0 (0.0%) | 0 (0.0%) |
| 16 and 17 Years | 0 (0.0%) | 0 (0.0%) |
| 18 to 24 Years | 20 (100.0%) | 0 (0.0%) |
| 25 to 34 Years | 0 (0.0%) | 0 (0.0%) |
| 35 to 44 Years | 1 (7.1%) | 7 (41.2%) |
| 45 to 54 Years | 0 (0.0%) | 0 (0.0%) |
| 55 to 64 Years | 3 (7.1%) | 5 (9.6%) |
| 65 to 74 Years | 1 (1.8%) | 12 (21.4%) |
| 75 Years and over | 0 (0.0%) | 0 (0.0%) |
| Total | 31 (14.7%) | 28 (13.4%) |
Income Above Poverty by Sex and Age in Michiana Shores
According to the poverty statistics in Michiana Shores, males aged under 5 years and females aged under 5 years are the age groups that are most secure financially, with 100.0% of males and 100.0% of females in these age groups living above the poverty line.
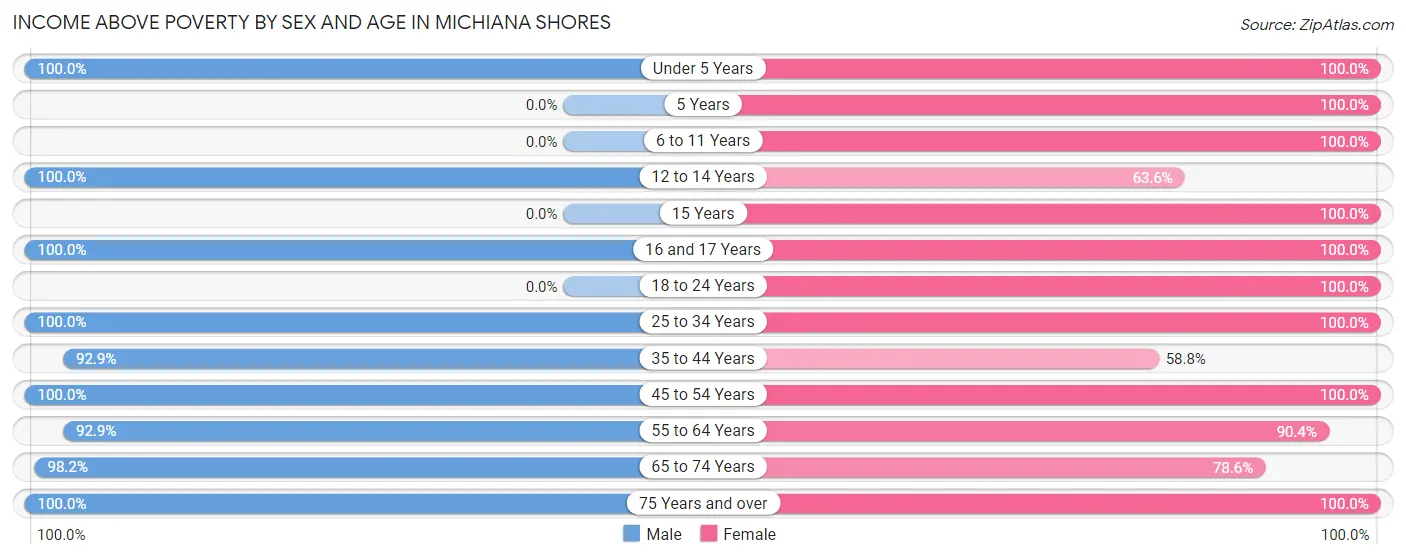
| Age Bracket | Male | Female |
| Under 5 Years | 5 (100.0%) | 3 (100.0%) |
| 5 Years | 0 (0.0%) | 5 (100.0%) |
| 6 to 11 Years | 0 (0.0%) | 7 (100.0%) |
| 12 to 14 Years | 3 (100.0%) | 7 (63.6%) |
| 15 Years | 0 (0.0%) | 1 (100.0%) |
| 16 and 17 Years | 3 (100.0%) | 7 (100.0%) |
| 18 to 24 Years | 0 (0.0%) | 2 (100.0%) |
| 25 to 34 Years | 11 (100.0%) | 7 (100.0%) |
| 35 to 44 Years | 13 (92.9%) | 10 (58.8%) |
| 45 to 54 Years | 20 (100.0%) | 16 (100.0%) |
| 55 to 64 Years | 39 (92.9%) | 47 (90.4%) |
| 65 to 74 Years | 53 (98.2%) | 44 (78.6%) |
| 75 Years and over | 33 (100.0%) | 25 (100.0%) |
| Total | 180 (85.3%) | 181 (86.6%) |
Income Below Poverty Among Married-Couple Families in Michiana Shores
The poverty statistics for married-couple families in Michiana Shores show that 2.8% or 3 of the total 109 families live below the poverty line. Families with no children have the highest poverty rate of 3.4%, comprising of 3 families. On the other hand, families with 1 or 2 children have the lowest poverty rate of 0.0%, which includes 0 families.
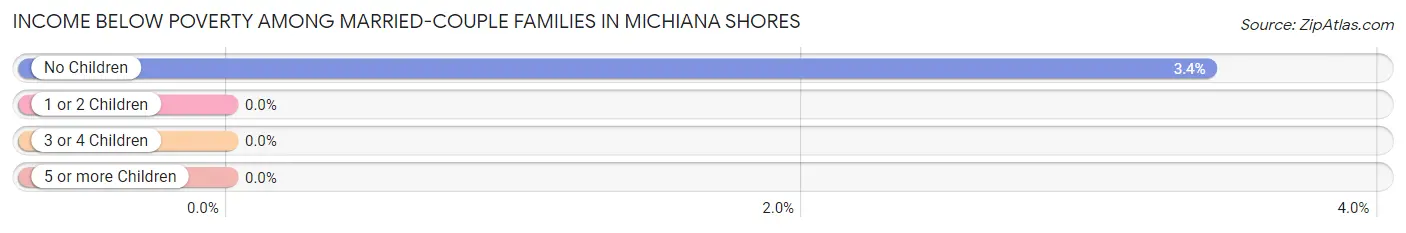
| Children | Above Poverty | Below Poverty |
| No Children | 85 (96.6%) | 3 (3.4%) |
| 1 or 2 Children | 12 (100.0%) | 0 (0.0%) |
| 3 or 4 Children | 9 (100.0%) | 0 (0.0%) |
| 5 or more Children | 0 (0.0%) | 0 (0.0%) |
| Total | 106 (97.3%) | 3 (2.8%) |
Income Below Poverty Among Single-Parent Households in Michiana Shores
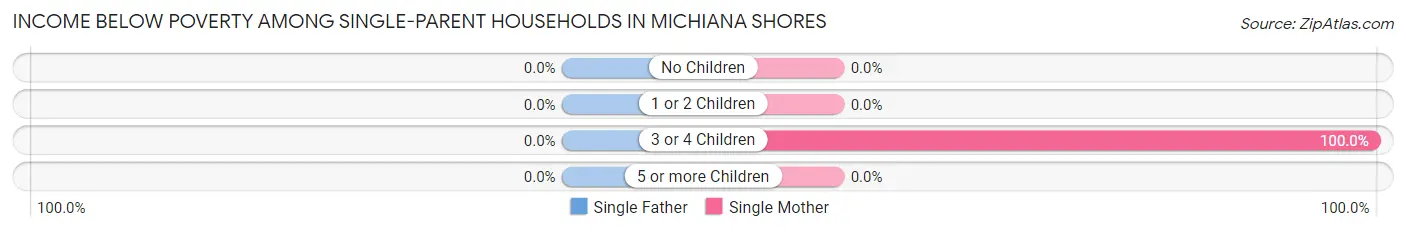
| Children | Single Father | Single Mother |
| No Children | 0 (0.0%) | 0 (0.0%) |
| 1 or 2 Children | 0 (0.0%) | 0 (0.0%) |
| 3 or 4 Children | 0 (0.0%) | 5 (100.0%) |
| 5 or more Children | 0 (0.0%) | 0 (0.0%) |
| Total | 0 (0.0%) | 5 (62.5%) |
Income Below Poverty Among Married-Couple vs Single-Parent Households in Michiana Shores
The poverty data for Michiana Shores shows that 3 of the married-couple family households (2.8%) and 5 of the single-parent households (62.5%) are living below the poverty level. Within the married-couple family households, those with no children have the highest poverty rate, with 3 households (3.4%) falling below the poverty line. Among the single-parent households, those with 3 or 4 children have the highest poverty rate, with 5 household (100.0%) living below poverty.
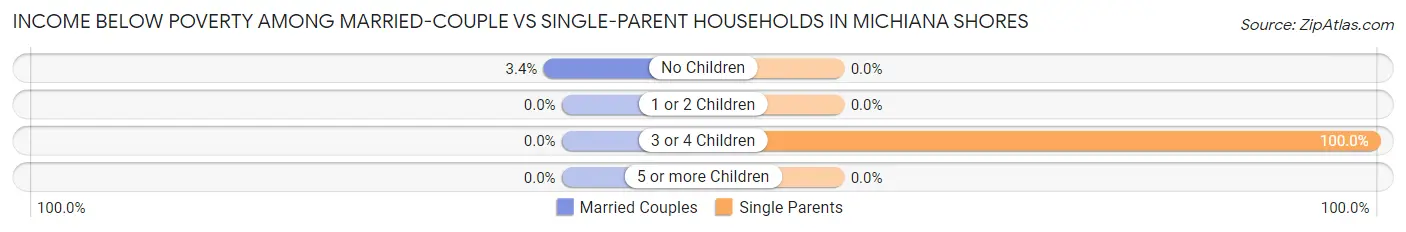
| Children | Married-Couple Families | Single-Parent Households |
| No Children | 3 (3.4%) | 0 (0.0%) |
| 1 or 2 Children | 0 (0.0%) | 0 (0.0%) |
| 3 or 4 Children | 0 (0.0%) | 5 (100.0%) |
| 5 or more Children | 0 (0.0%) | 0 (0.0%) |
| Total | 3 (2.8%) | 5 (62.5%) |
Race in Michiana Shores
The most populous races in Michiana Shores are White / Caucasian (380 | 90.5%), Two or more Races (34 | 8.1%), and Hispanic or Latino (6 | 1.4%).
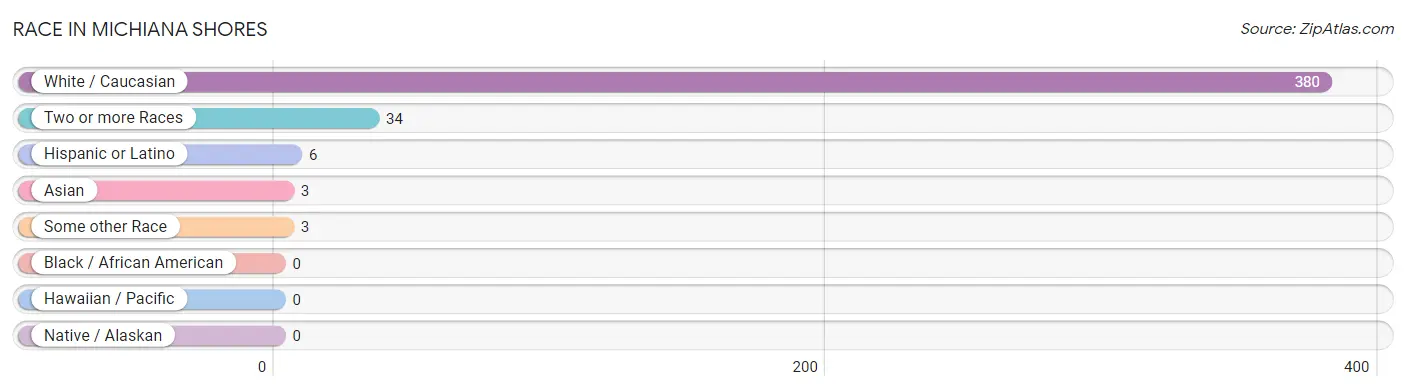
| Race | # Population | % Population |
| Asian | 3 | 0.7% |
| Black / African American | 0 | 0.0% |
| Hawaiian / Pacific | 0 | 0.0% |
| Hispanic or Latino | 6 | 1.4% |
| Native / Alaskan | 0 | 0.0% |
| White / Caucasian | 380 | 90.5% |
| Two or more Races | 34 | 8.1% |
| Some other Race | 3 | 0.7% |
| Total | 420 | 100.0% |
Ancestry in Michiana Shores
The most populous ancestries reported in Michiana Shores are German (141 | 33.6%), Polish (90 | 21.4%), English (49 | 11.7%), Irish (43 | 10.2%), and French (35 | 8.3%), together accounting for 85.2% of all Michiana Shores residents.
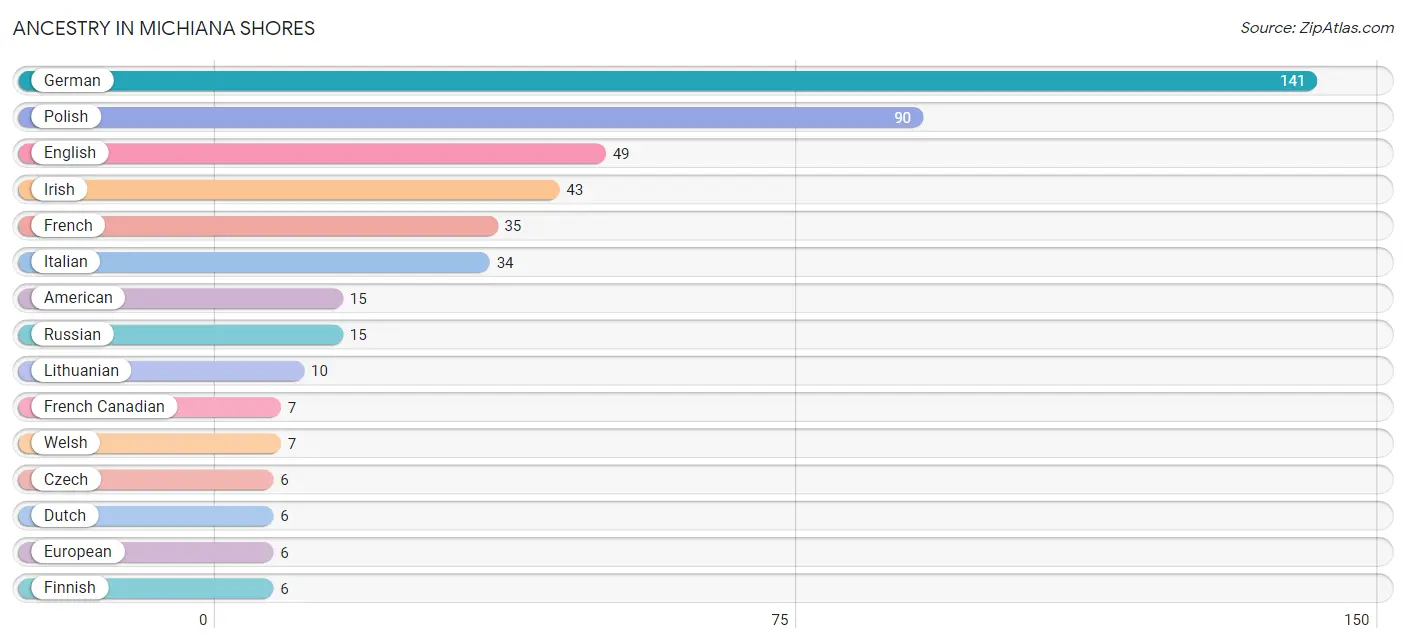
| Ancestry | # Population | % Population |
| American | 15 | 3.6% |
| Arab | 2 | 0.5% |
| Austrian | 5 | 1.2% |
| Burmese | 3 | 0.7% |
| Croatian | 3 | 0.7% |
| Czech | 6 | 1.4% |
| Dutch | 6 | 1.4% |
| English | 49 | 11.7% |
| European | 6 | 1.4% |
| Finnish | 6 | 1.4% |
| French | 35 | 8.3% |
| French American Indian | 1 | 0.2% |
| French Canadian | 7 | 1.7% |
| German | 141 | 33.6% |
| Greek | 1 | 0.2% |
| Hungarian | 4 | 0.9% |
| Irish | 43 | 10.2% |
| Italian | 34 | 8.1% |
| Lebanese | 2 | 0.5% |
| Lithuanian | 10 | 2.4% |
| Mexican | 3 | 0.7% |
| Norwegian | 6 | 1.4% |
| Polish | 90 | 21.4% |
| Russian | 15 | 3.6% |
| Scandinavian | 2 | 0.5% |
| Scotch-Irish | 2 | 0.5% |
| Scottish | 2 | 0.5% |
| Slovak | 1 | 0.2% |
| Slovene | 2 | 0.5% |
| Subsaharan African | 1 | 0.2% |
| Swedish | 6 | 1.4% |
| Thai | 3 | 0.7% |
| Ukrainian | 5 | 1.2% |
| Welsh | 7 | 1.7% | View All 34 Rows |
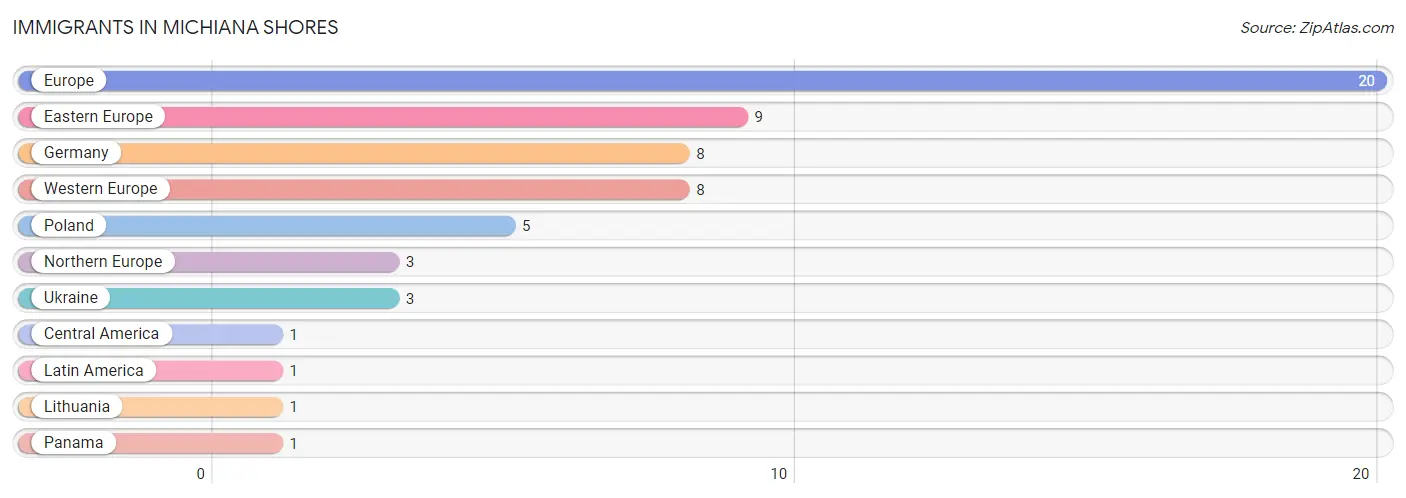
Immigrants in Michiana Shores
The most numerous immigrant groups reported in Michiana Shores came from Europe (20 | 4.8%), Eastern Europe (9 | 2.1%), Germany (8 | 1.9%), Western Europe (8 | 1.9%), and Poland (5 | 1.2%), together accounting for 11.9% of all Michiana Shores residents.
| Immigration Origin | # Population | % Population |
| Central America | 1 | 0.2% |
| Eastern Europe | 9 | 2.1% |
| Europe | 20 | 4.8% |
| Germany | 8 | 1.9% |
| Latin America | 1 | 0.2% |
| Lithuania | 1 | 0.2% |
| Northern Europe | 3 | 0.7% |
| Panama | 1 | 0.2% |
| Poland | 5 | 1.2% |
| Ukraine | 3 | 0.7% |
| Western Europe | 8 | 1.9% | View All 11 Rows |
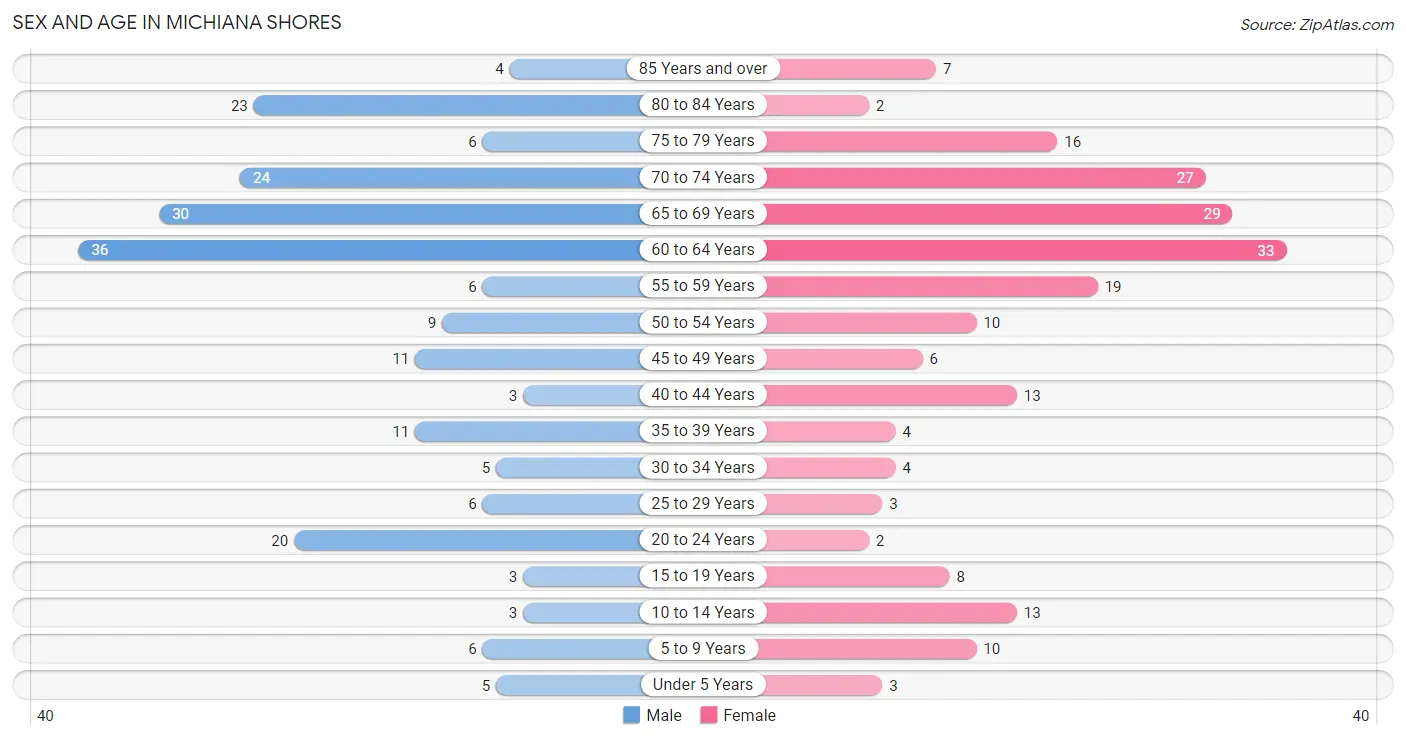
Sex and Age in Michiana Shores
Sex and Age in Michiana Shores
The most populous age groups in Michiana Shores are 60 to 64 Years (36 | 17.1%) for men and 60 to 64 Years (33 | 15.8%) for women.
| Age Bracket | Male | Female |
| Under 5 Years | 5 (2.4%) | 3 (1.4%) |
| 5 to 9 Years | 6 (2.8%) | 10 (4.8%) |
| 10 to 14 Years | 3 (1.4%) | 13 (6.2%) |
| 15 to 19 Years | 3 (1.4%) | 8 (3.8%) |
| 20 to 24 Years | 20 (9.5%) | 2 (1.0%) |
| 25 to 29 Years | 6 (2.8%) | 3 (1.4%) |
| 30 to 34 Years | 5 (2.4%) | 4 (1.9%) |
| 35 to 39 Years | 11 (5.2%) | 4 (1.9%) |
| 40 to 44 Years | 3 (1.4%) | 13 (6.2%) |
| 45 to 49 Years | 11 (5.2%) | 6 (2.9%) |
| 50 to 54 Years | 9 (4.3%) | 10 (4.8%) |
| 55 to 59 Years | 6 (2.8%) | 19 (9.1%) |
| 60 to 64 Years | 36 (17.1%) | 33 (15.8%) |
| 65 to 69 Years | 30 (14.2%) | 29 (13.9%) |
| 70 to 74 Years | 24 (11.4%) | 27 (12.9%) |
| 75 to 79 Years | 6 (2.8%) | 16 (7.7%) |
| 80 to 84 Years | 23 (10.9%) | 2 (1.0%) |
| 85 Years and over | 4 (1.9%) | 7 (3.4%) |
| Total | 211 (100.0%) | 209 (100.0%) |
Families and Households in Michiana Shores
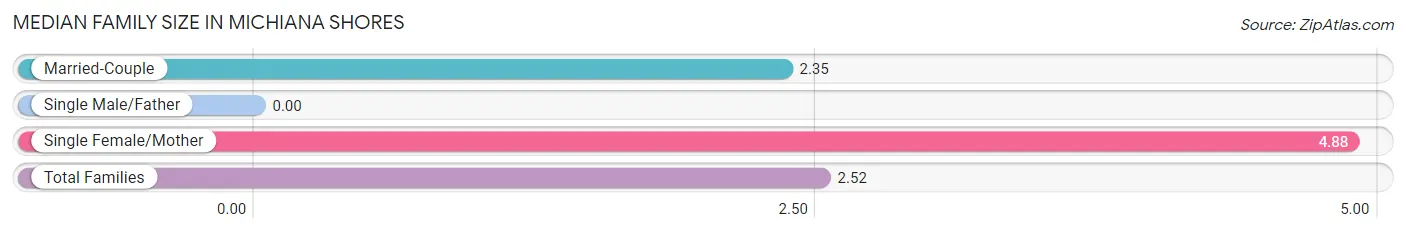
Median Family Size in Michiana Shores
| Family Type | # Families | Family Size |
| Married-Couple | 109 (93.2%) | 2.35 |
| Single Male/Father | 0 (0.0%) | - |
| Single Female/Mother | 8 (6.8%) | 4.88 |
| Total Families | 117 (100.0%) | 2.52 |
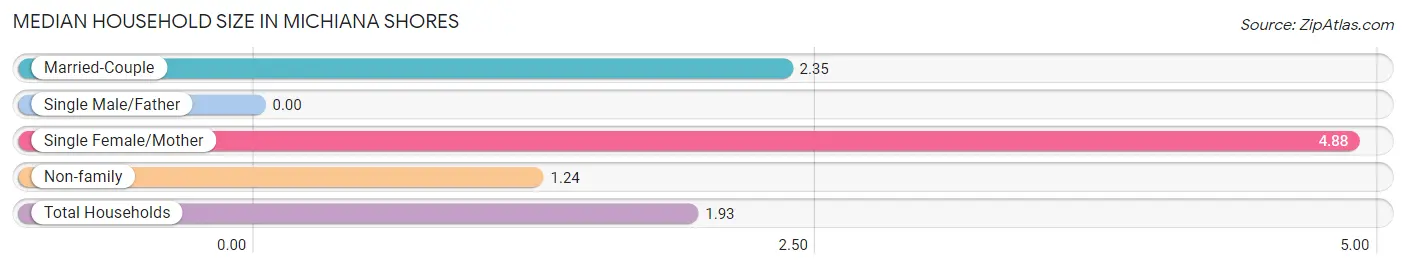
Median Household Size in Michiana Shores
| Household Type | # Households | Household Size |
| Married-Couple | 109 (50.0%) | 2.35 |
| Single Male/Father | 0 (0.0%) | - |
| Single Female/Mother | 8 (3.7%) | 4.88 |
| Non-family | 101 (46.3%) | 1.24 |
| Total Households | 218 (100.0%) | 1.93 |
Household Size by Marriage Status in Michiana Shores
Out of a total of 218 households in Michiana Shores, 117 (53.7%) are family households, while 101 (46.3%) are nonfamily households. The most numerous type of family households are 2-person households, comprising 88, and the most common type of nonfamily households are 1-person households, comprising 82.
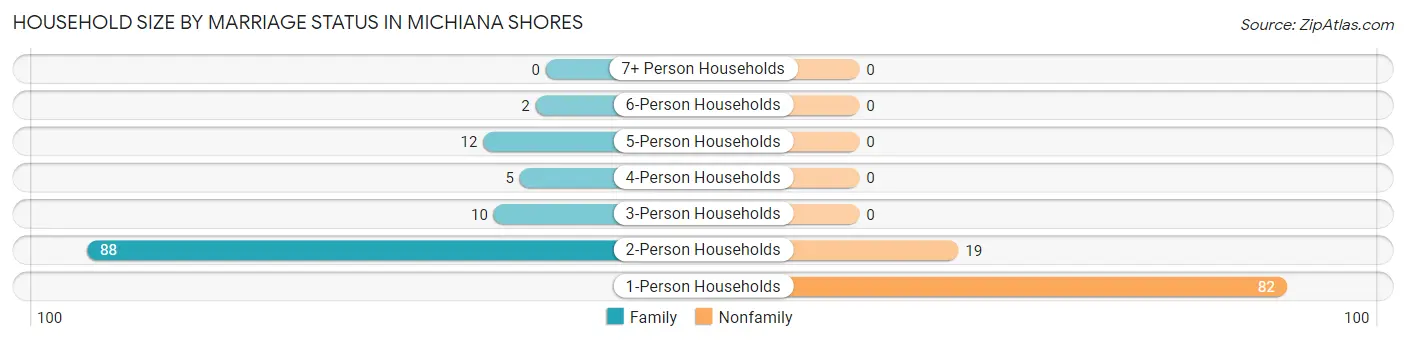
| Household Size | Family Households | Nonfamily Households |
| 1-Person Households | - | 82 (37.6%) |
| 2-Person Households | 88 (40.4%) | 19 (8.7%) |
| 3-Person Households | 10 (4.6%) | 0 (0.0%) |
| 4-Person Households | 5 (2.3%) | 0 (0.0%) |
| 5-Person Households | 12 (5.5%) | 0 (0.0%) |
| 6-Person Households | 2 (0.9%) | 0 (0.0%) |
| 7+ Person Households | 0 (0.0%) | 0 (0.0%) |
| Total | 117 (53.7%) | 101 (46.3%) |
Female Fertility in Michiana Shores
Fertility by Age in Michiana Shores
Average fertility rate in Michiana Shores is 48.0 births per 1,000 women. Women in the age bracket of 20 to 34 years have the highest fertility rate with 222.0 births per 1,000 women. Women in the age bracket of 20 to 34 years acount for 100.0% of all women with births.
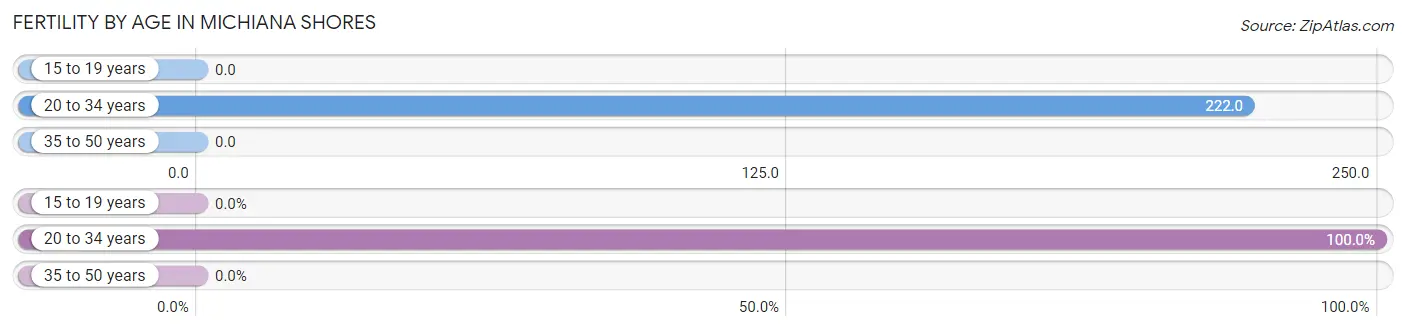
| Age Bracket | Women with Births | Births / 1,000 Women |
| 15 to 19 years | 0 (0.0%) | 0.0 |
| 20 to 34 years | 2 (100.0%) | 222.0 |
| 35 to 50 years | 0 (0.0%) | 0.0 |
| Total | 2 (100.0%) | 48.0 |
Fertility by Age by Marriage Status in Michiana Shores
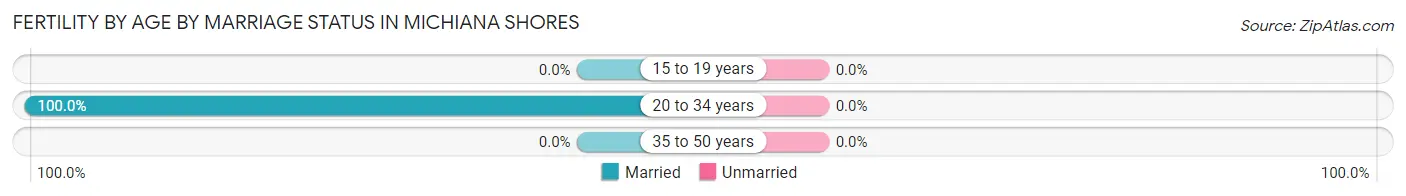
| Age Bracket | Married | Unmarried |
| 15 to 19 years | 0 (0.0%) | 0 (0.0%) |
| 20 to 34 years | 2 (100.0%) | 0 (0.0%) |
| 35 to 50 years | 0 (0.0%) | 0 (0.0%) |
| Total | 2 (100.0%) | 0 (0.0%) |
Fertility by Education in Michiana Shores
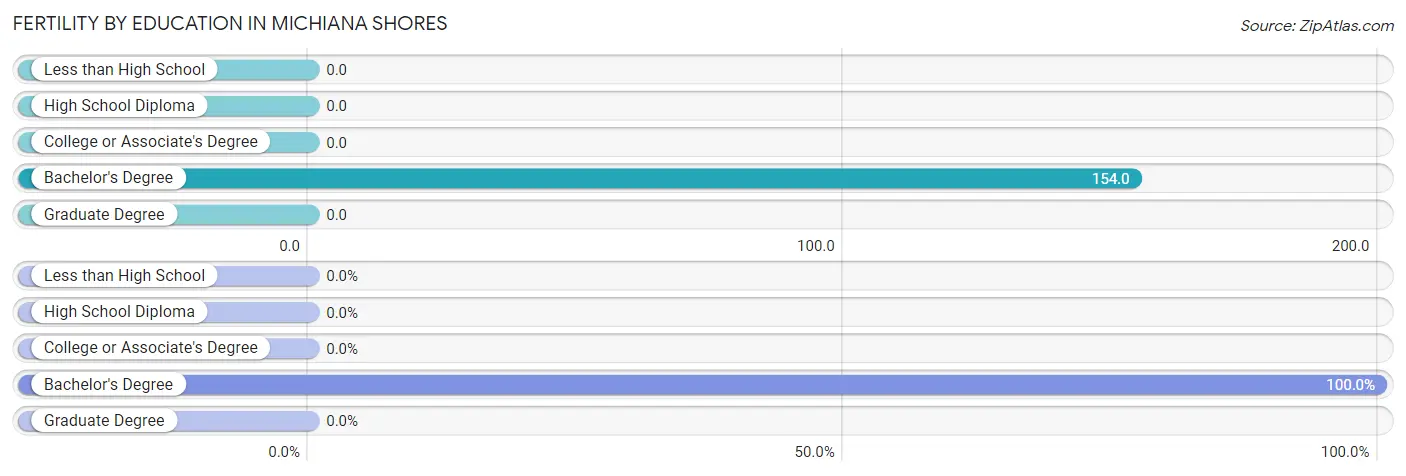
| Educational Attainment | Women with Births | Births / 1,000 Women |
| Less than High School | 0 (0.0%) | 0.0 |
| High School Diploma | 0 (0.0%) | 0.0 |
| College or Associate's Degree | 0 (0.0%) | 0.0 |
| Bachelor's Degree | 2 (100.0%) | 154.0 |
| Graduate Degree | 0 (0.0%) | 0.0 |
| Total | 2 (100.0%) | 48.0 |
Fertility by Education by Marriage Status in Michiana Shores
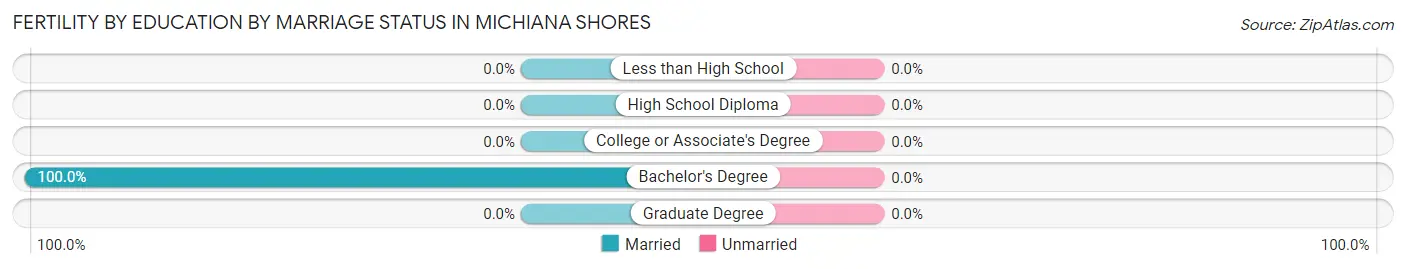
| Educational Attainment | Married | Unmarried |
| Less than High School | 0 (0.0%) | 0 (0.0%) |
| High School Diploma | 0 (0.0%) | 0 (0.0%) |
| College or Associate's Degree | 0 (0.0%) | 0 (0.0%) |
| Bachelor's Degree | 2 (100.0%) | 0 (0.0%) |
| Graduate Degree | 0 (0.0%) | 0 (0.0%) |
| Total | 2 (100.0%) | 0 (0.0%) |
Employment Characteristics in Michiana Shores
Employment by Class of Employer in Michiana Shores
Among the 181 employed individuals in Michiana Shores, private company employees (96 | 53.0%), not-for-profit organizations (32 | 17.7%), and self-employed (not incorporated) (23 | 12.7%) make up the most common classes of employment.
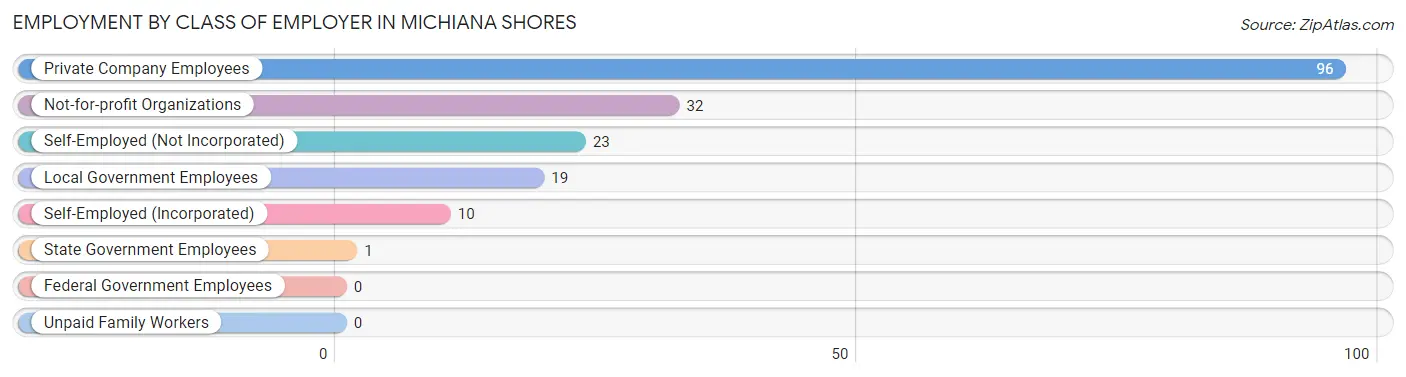
| Employer Class | # Employees | % Employees |
| Private Company Employees | 96 | 53.0% |
| Self-Employed (Incorporated) | 10 | 5.5% |
| Self-Employed (Not Incorporated) | 23 | 12.7% |
| Not-for-profit Organizations | 32 | 17.7% |
| Local Government Employees | 19 | 10.5% |
| State Government Employees | 1 | 0.5% |
| Federal Government Employees | 0 | 0.0% |
| Unpaid Family Workers | 0 | 0.0% |
| Total | 181 | 100.0% |
Employment Status by Age in Michiana Shores
According to the labor force statistics for Michiana Shores, out of the total population over 16 years of age (379), 49.1% or 186 individuals are in the labor force, with 2.7% or 5 of them unemployed. The age group with the highest labor force participation rate is 25 to 29 years, with 100.0% or 9 individuals in the labor force. Within the labor force, the 35 to 44 years age range has the highest percentage of unemployed individuals, with 8.7% or 2 of them being unemployed.
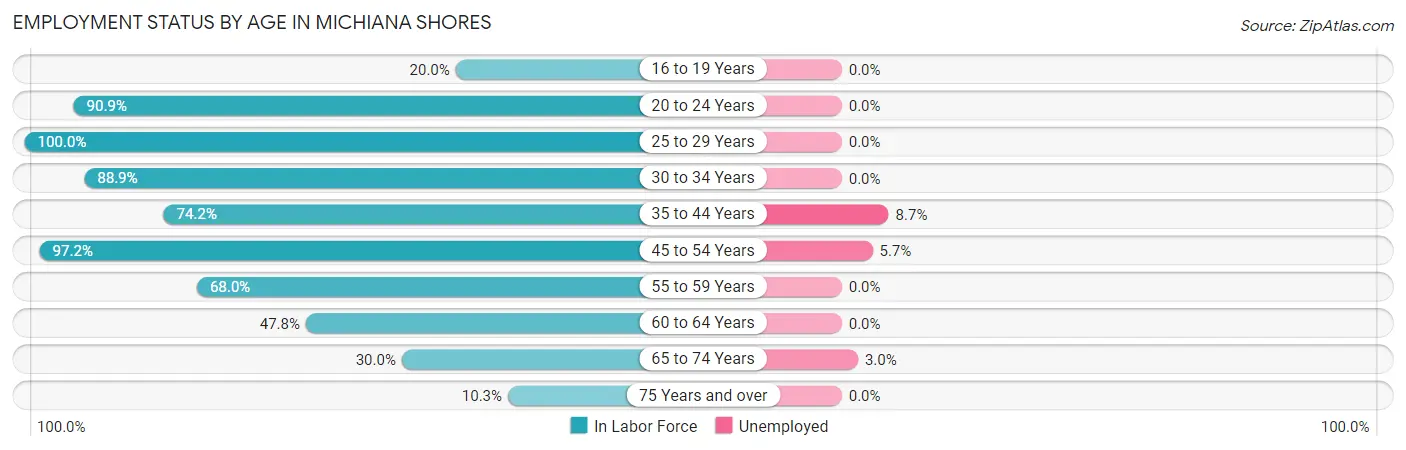
| Age Bracket | In Labor Force | Unemployed |
| 16 to 19 Years | 2 (20.0%) | 0 (0.0%) |
| 20 to 24 Years | 20 (90.9%) | 0 (0.0%) |
| 25 to 29 Years | 9 (100.0%) | 0 (0.0%) |
| 30 to 34 Years | 8 (88.9%) | 0 (0.0%) |
| 35 to 44 Years | 23 (74.2%) | 2 (8.7%) |
| 45 to 54 Years | 35 (97.2%) | 2 (5.7%) |
| 55 to 59 Years | 17 (68.0%) | 0 (0.0%) |
| 60 to 64 Years | 33 (47.8%) | 0 (0.0%) |
| 65 to 74 Years | 33 (30.0%) | 1 (3.0%) |
| 75 Years and over | 6 (10.3%) | 0 (0.0%) |
| Total | 186 (49.1%) | 5 (2.7%) |
Employment Status by Educational Attainment in Michiana Shores
According to labor force statistics for Michiana Shores, 69.8% of individuals (125) out of the total population between 25 and 64 years of age (179) are in the labor force, with 3.2% or 4 of them being unemployed. The group with the highest labor force participation rate are those with the educational attainment of bachelor's degree or higher, with 79.4% or 81 individuals in the labor force. Within the labor force, individuals with college / associate degree education have the highest percentage of unemployment, with 8.6% or 3 of them being unemployed.
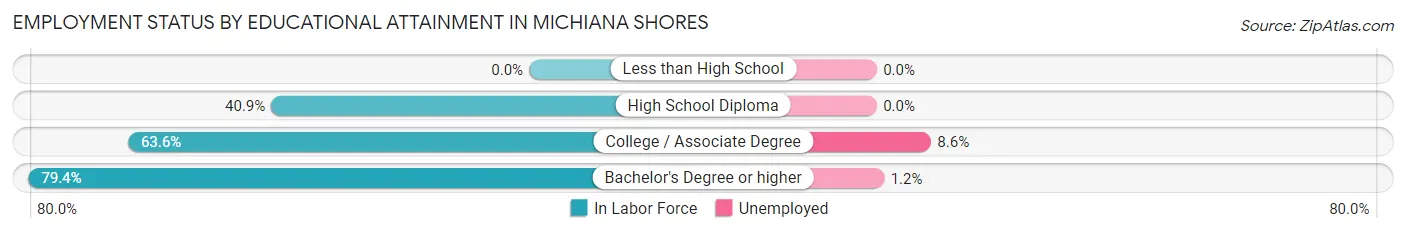
| Educational Attainment | In Labor Force | Unemployed |
| Less than High School | 0 (0.0%) | 0 (0.0%) |
| High School Diploma | 9 (40.9%) | 0 (0.0%) |
| College / Associate Degree | 35 (63.6%) | 5 (8.6%) |
| Bachelor's Degree or higher | 81 (79.4%) | 1 (1.2%) |
| Total | 125 (69.8%) | 6 (3.2%) |
Employment Occupations by Sex in Michiana Shores
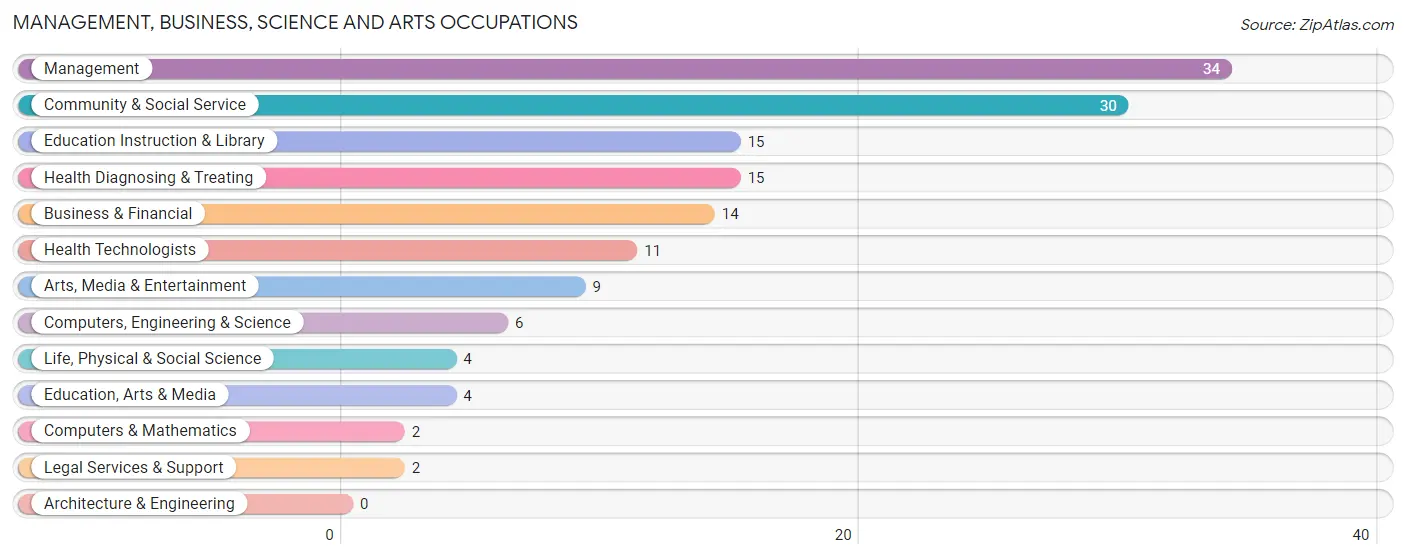
Management, Business, Science and Arts Occupations
The most common Management, Business, Science and Arts occupations in Michiana Shores are Management (34 | 18.8%), Community & Social Service (30 | 16.6%), Education Instruction & Library (15 | 8.3%), Health Diagnosing & Treating (15 | 8.3%), and Business & Financial (14 | 7.7%).
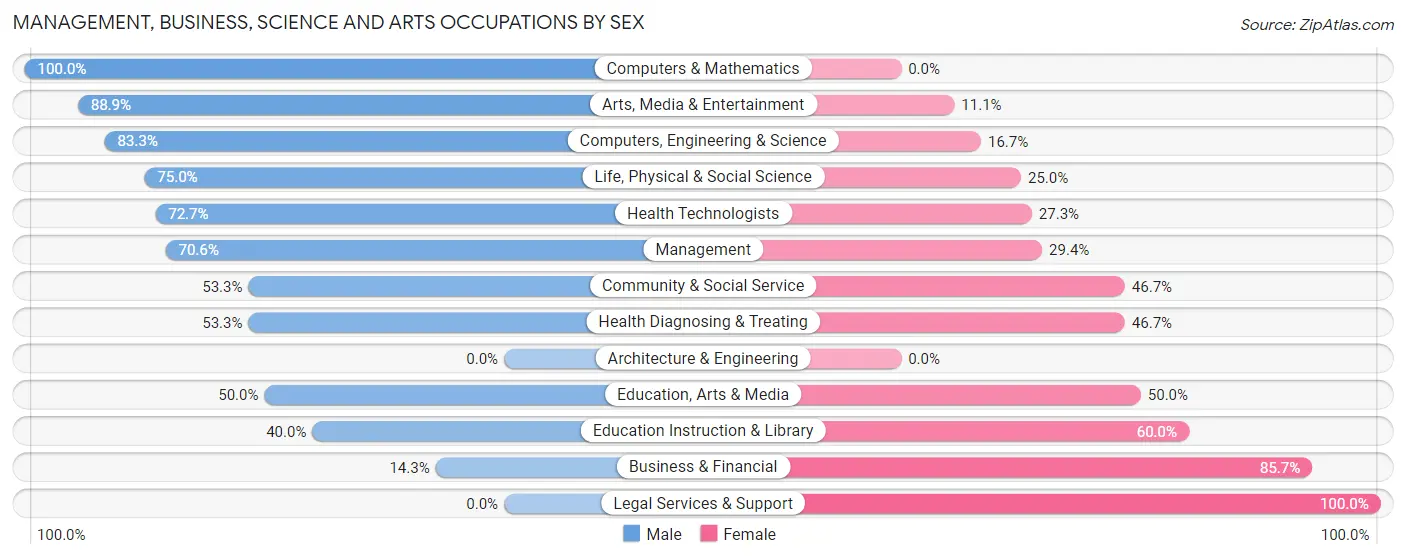
Management, Business, Science and Arts Occupations by Sex
Within the Management, Business, Science and Arts occupations in Michiana Shores, the most male-oriented occupations are Computers & Mathematics (100.0%), Arts, Media & Entertainment (88.9%), and Computers, Engineering & Science (83.3%), while the most female-oriented occupations are Legal Services & Support (100.0%), Business & Financial (85.7%), and Education Instruction & Library (60.0%).
| Occupation | Male | Female |
| Management | 24 (70.6%) | 10 (29.4%) |
| Business & Financial | 2 (14.3%) | 12 (85.7%) |
| Computers, Engineering & Science | 5 (83.3%) | 1 (16.7%) |
| Computers & Mathematics | 2 (100.0%) | 0 (0.0%) |
| Architecture & Engineering | 0 (0.0%) | 0 (0.0%) |
| Life, Physical & Social Science | 3 (75.0%) | 1 (25.0%) |
| Community & Social Service | 16 (53.3%) | 14 (46.7%) |
| Education, Arts & Media | 2 (50.0%) | 2 (50.0%) |
| Legal Services & Support | 0 (0.0%) | 2 (100.0%) |
| Education Instruction & Library | 6 (40.0%) | 9 (60.0%) |
| Arts, Media & Entertainment | 8 (88.9%) | 1 (11.1%) |
| Health Diagnosing & Treating | 8 (53.3%) | 7 (46.7%) |
| Health Technologists | 8 (72.7%) | 3 (27.3%) |
| Total (Category) | 55 (55.6%) | 44 (44.4%) |
| Total (Overall) | 102 (56.4%) | 79 (43.6%) |
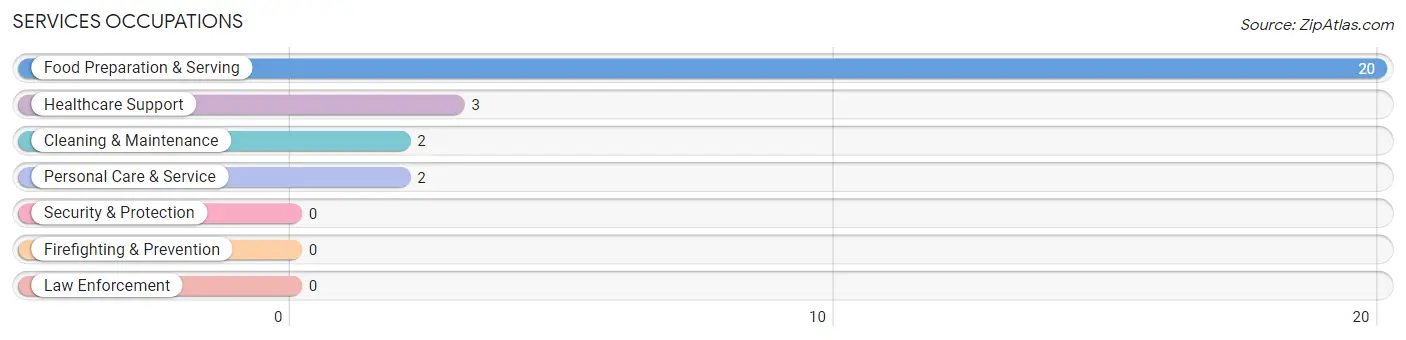
Services Occupations
The most common Services occupations in Michiana Shores are Food Preparation & Serving (20 | 11.1%), Healthcare Support (3 | 1.7%), Cleaning & Maintenance (2 | 1.1%), and Personal Care & Service (2 | 1.1%).
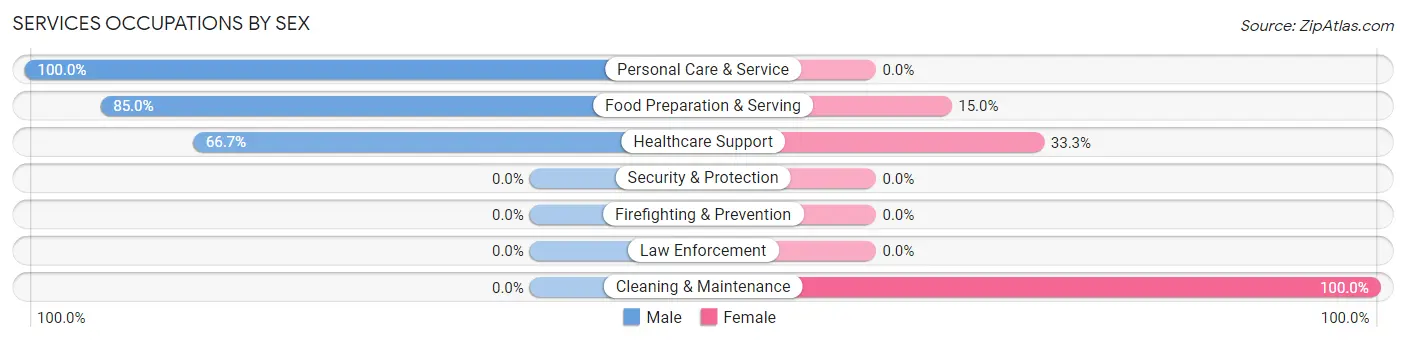
Services Occupations by Sex
Within the Services occupations in Michiana Shores, the most male-oriented occupations are Personal Care & Service (100.0%), Food Preparation & Serving (85.0%), and Healthcare Support (66.7%), while the most female-oriented occupations are Cleaning & Maintenance (100.0%), Healthcare Support (33.3%), and Food Preparation & Serving (15.0%).
| Occupation | Male | Female |
| Healthcare Support | 2 (66.7%) | 1 (33.3%) |
| Security & Protection | 0 (0.0%) | 0 (0.0%) |
| Firefighting & Prevention | 0 (0.0%) | 0 (0.0%) |
| Law Enforcement | 0 (0.0%) | 0 (0.0%) |
| Food Preparation & Serving | 17 (85.0%) | 3 (15.0%) |
| Cleaning & Maintenance | 0 (0.0%) | 2 (100.0%) |
| Personal Care & Service | 2 (100.0%) | 0 (0.0%) |
| Total (Category) | 21 (77.8%) | 6 (22.2%) |
| Total (Overall) | 102 (56.4%) | 79 (43.6%) |
Sales and Office Occupations
The most common Sales and Office occupations in Michiana Shores are Office & Administration (28 | 15.5%), and Sales & Related (18 | 9.9%).
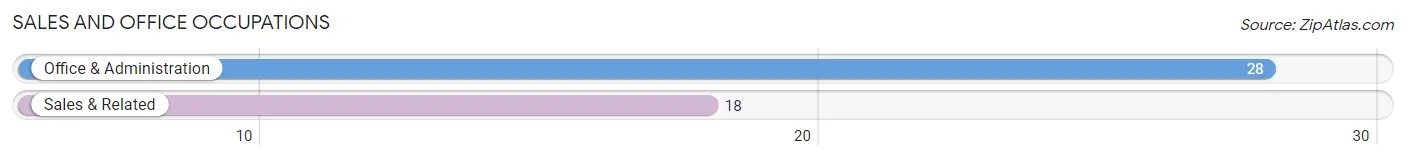
Sales and Office Occupations by Sex
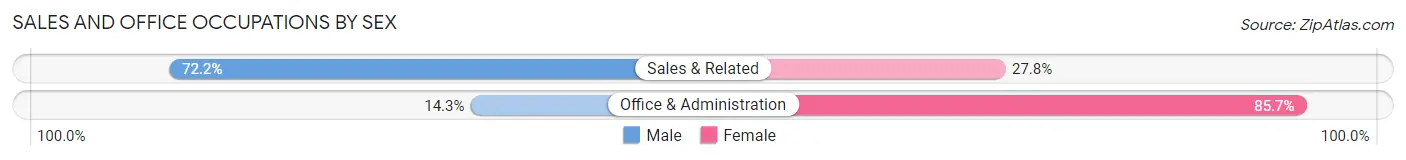
| Occupation | Male | Female |
| Sales & Related | 13 (72.2%) | 5 (27.8%) |
| Office & Administration | 4 (14.3%) | 24 (85.7%) |
| Total (Category) | 17 (37.0%) | 29 (63.0%) |
| Total (Overall) | 102 (56.4%) | 79 (43.6%) |
Natural Resources, Construction and Maintenance Occupations
The most common Natural Resources, Construction and Maintenance occupations in Michiana Shores are , and Construction & Extraction (3 | 1.7%).
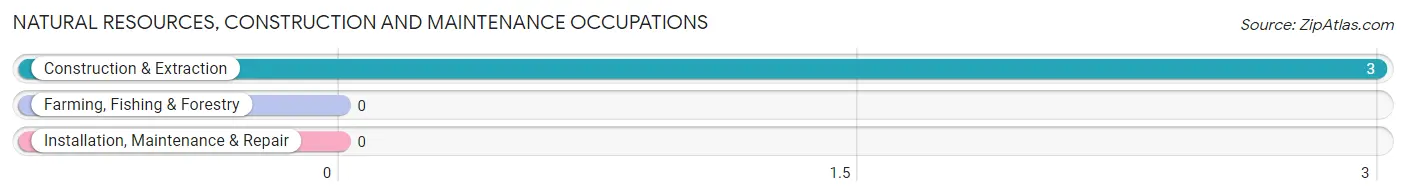
Natural Resources, Construction and Maintenance Occupations by Sex
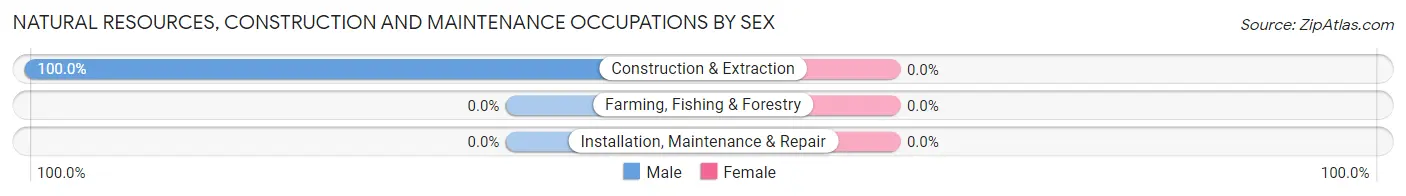
| Occupation | Male | Female |
| Farming, Fishing & Forestry | 0 (0.0%) | 0 (0.0%) |
| Construction & Extraction | 3 (100.0%) | 0 (0.0%) |
| Installation, Maintenance & Repair | 0 (0.0%) | 0 (0.0%) |
| Total (Category) | 3 (100.0%) | 0 (0.0%) |
| Total (Overall) | 102 (56.4%) | 79 (43.6%) |
Production, Transportation and Moving Occupations
The most common Production, Transportation and Moving occupations in Michiana Shores are Production (3 | 1.7%), Material Moving (2 | 1.1%), and Transportation (1 | 0.5%).
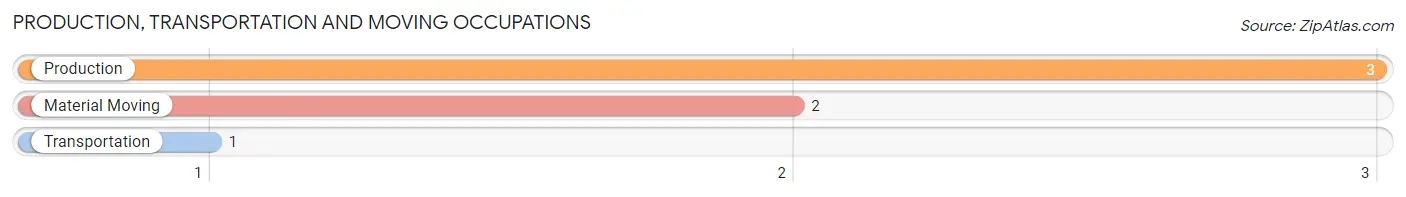
Production, Transportation and Moving Occupations by Sex
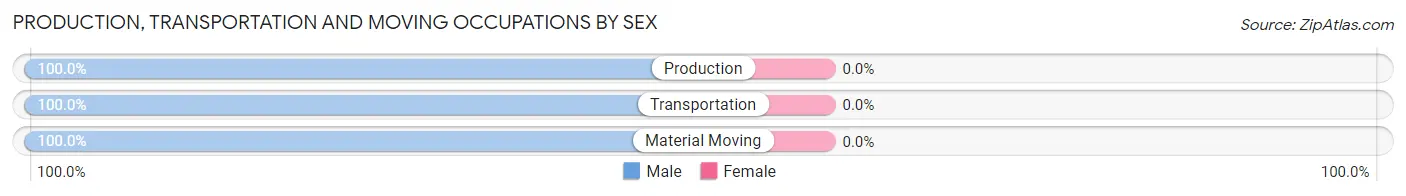
| Occupation | Male | Female |
| Production | 3 (100.0%) | 0 (0.0%) |
| Transportation | 1 (100.0%) | 0 (0.0%) |
| Material Moving | 2 (100.0%) | 0 (0.0%) |
| Total (Category) | 6 (100.0%) | 0 (0.0%) |
| Total (Overall) | 102 (56.4%) | 79 (43.6%) |
Employment Industries by Sex in Michiana Shores
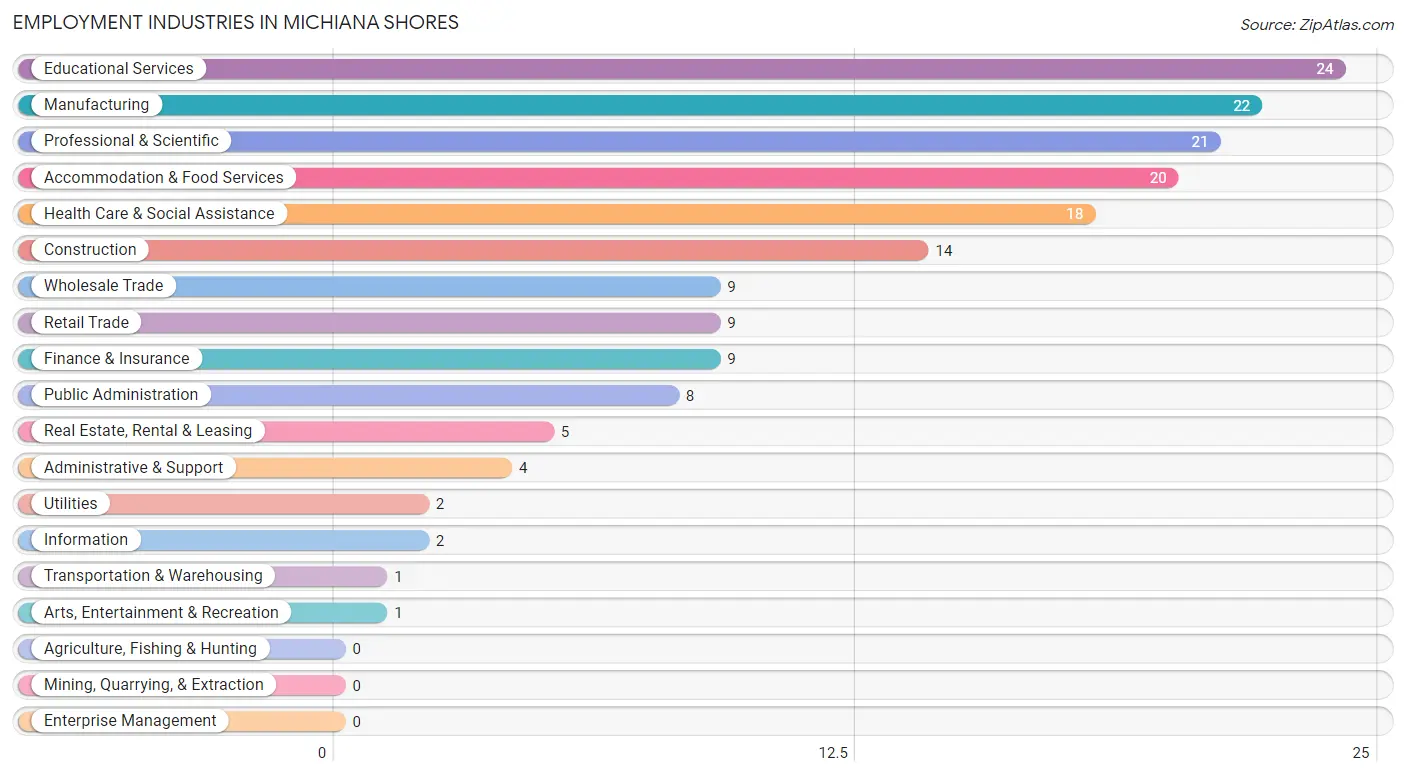
Employment Industries in Michiana Shores
The major employment industries in Michiana Shores include Educational Services (24 | 13.3%), Manufacturing (22 | 12.1%), Professional & Scientific (21 | 11.6%), Accommodation & Food Services (20 | 11.1%), and Health Care & Social Assistance (18 | 9.9%).
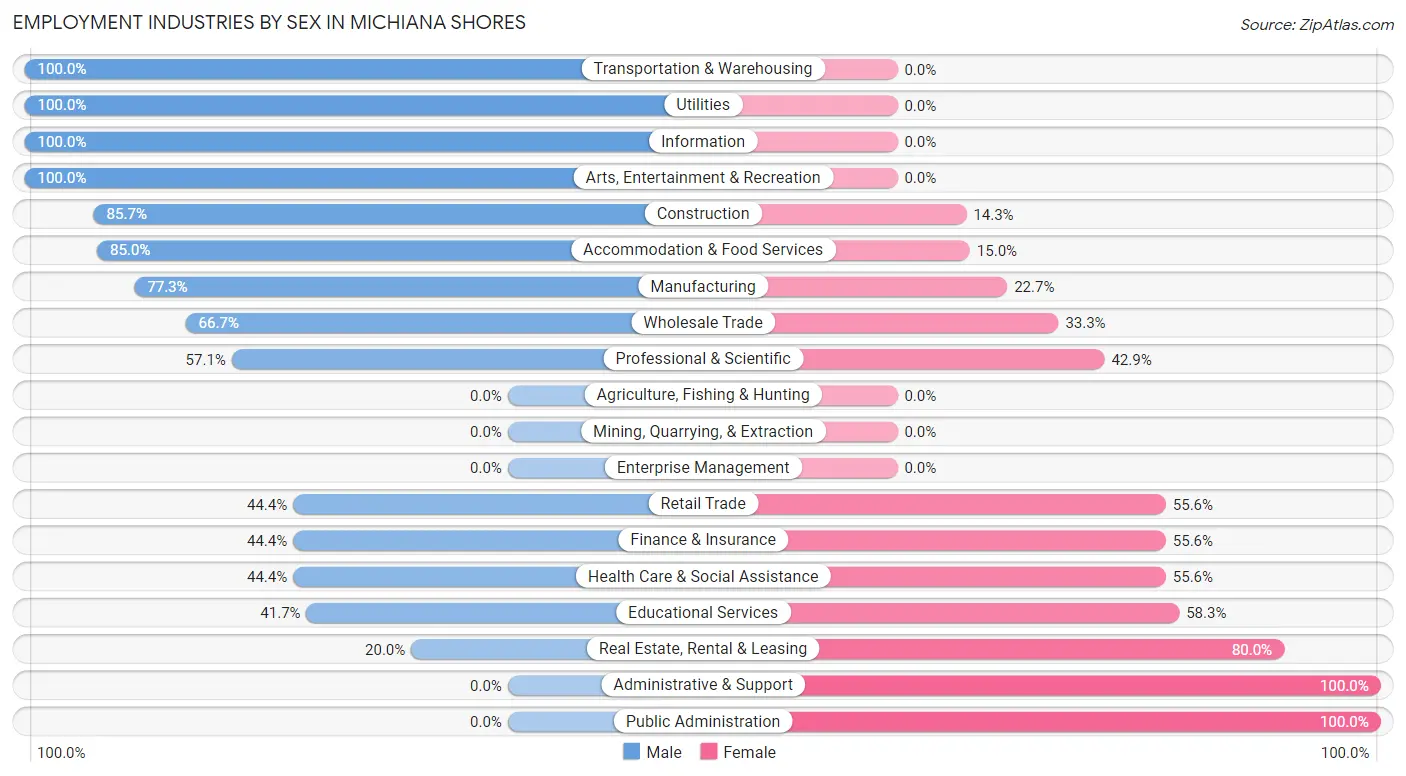
Employment Industries by Sex in Michiana Shores
The Michiana Shores industries that see more men than women are Transportation & Warehousing (100.0%), Utilities (100.0%), and Information (100.0%), whereas the industries that tend to have a higher number of women are Administrative & Support (100.0%), Public Administration (100.0%), and Real Estate, Rental & Leasing (80.0%).
| Industry | Male | Female |
| Agriculture, Fishing & Hunting | 0 (0.0%) | 0 (0.0%) |
| Mining, Quarrying, & Extraction | 0 (0.0%) | 0 (0.0%) |
| Construction | 12 (85.7%) | 2 (14.3%) |
| Manufacturing | 17 (77.3%) | 5 (22.7%) |
| Wholesale Trade | 6 (66.7%) | 3 (33.3%) |
| Retail Trade | 4 (44.4%) | 5 (55.6%) |
| Transportation & Warehousing | 1 (100.0%) | 0 (0.0%) |
| Utilities | 2 (100.0%) | 0 (0.0%) |
| Information | 2 (100.0%) | 0 (0.0%) |
| Finance & Insurance | 4 (44.4%) | 5 (55.6%) |
| Real Estate, Rental & Leasing | 1 (20.0%) | 4 (80.0%) |
| Professional & Scientific | 12 (57.1%) | 9 (42.9%) |
| Enterprise Management | 0 (0.0%) | 0 (0.0%) |
| Administrative & Support | 0 (0.0%) | 4 (100.0%) |
| Educational Services | 10 (41.7%) | 14 (58.3%) |
| Health Care & Social Assistance | 8 (44.4%) | 10 (55.6%) |
| Arts, Entertainment & Recreation | 1 (100.0%) | 0 (0.0%) |
| Accommodation & Food Services | 17 (85.0%) | 3 (15.0%) |
| Public Administration | 0 (0.0%) | 8 (100.0%) |
| Total | 102 (56.4%) | 79 (43.6%) |
Education in Michiana Shores
School Enrollment in Michiana Shores
The most common levels of schooling among the 71 students in Michiana Shores are college / undergraduate (21 | 29.6%), middle school (14 | 19.7%), and high school (13 | 18.3%).
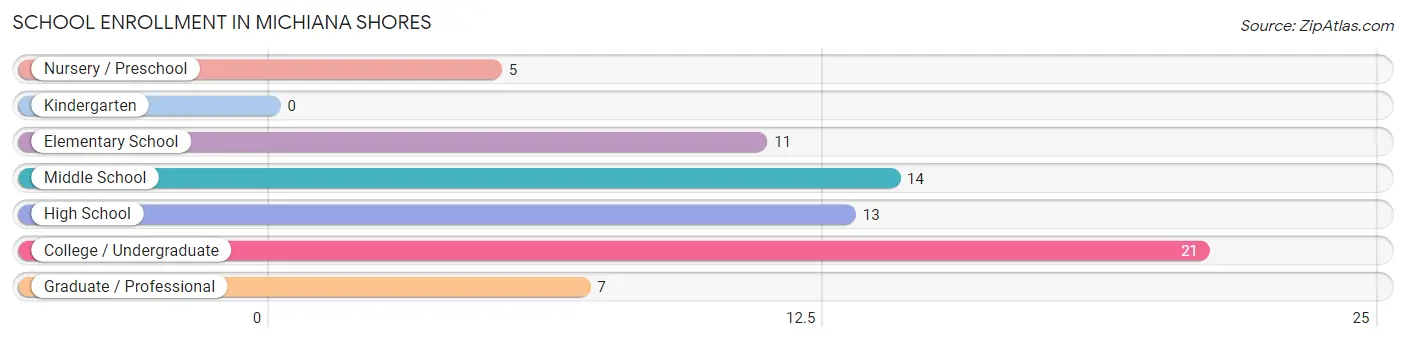
| School Level | # Students | % Students |
| Nursery / Preschool | 5 | 7.0% |
| Kindergarten | 0 | 0.0% |
| Elementary School | 11 | 15.5% |
| Middle School | 14 | 19.7% |
| High School | 13 | 18.3% |
| College / Undergraduate | 21 | 29.6% |
| Graduate / Professional | 7 | 9.9% |
| Total | 71 | 100.0% |
School Enrollment by Age by Funding Source in Michiana Shores
Out of a total of 71 students who are enrolled in schools in Michiana Shores, 11 (15.5%) attend a private institution, while the remaining 60 (84.5%) are enrolled in public schools. The age group of 25 to 34 year olds has the highest likelihood of being enrolled in private schools, with 2 (66.7% in the age bracket) enrolled. Conversely, the age group of 15 to 17 year olds has the lowest likelihood of being enrolled in a private school, with 11 (100.0% in the age bracket) attending a public institution.
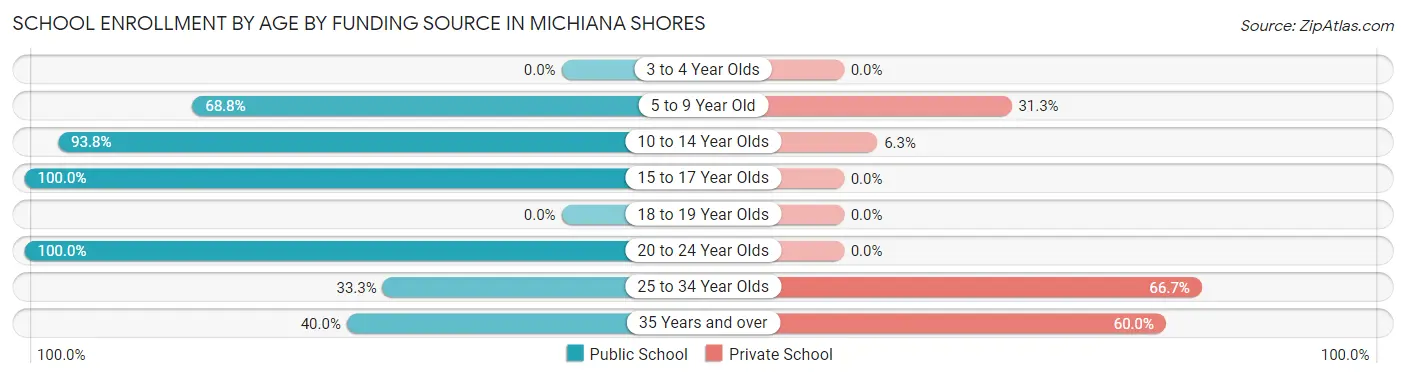
| Age Bracket | Public School | Private School |
| 3 to 4 Year Olds | 0 (0.0%) | 0 (0.0%) |
| 5 to 9 Year Old | 11 (68.8%) | 5 (31.2%) |
| 10 to 14 Year Olds | 15 (93.8%) | 1 (6.2%) |
| 15 to 17 Year Olds | 11 (100.0%) | 0 (0.0%) |
| 18 to 19 Year Olds | 0 (0.0%) | 0 (0.0%) |
| 20 to 24 Year Olds | 20 (100.0%) | 0 (0.0%) |
| 25 to 34 Year Olds | 1 (33.3%) | 2 (66.7%) |
| 35 Years and over | 2 (40.0%) | 3 (60.0%) |
| Total | 60 (84.5%) | 11 (15.5%) |
Educational Attainment by Field of Study in Michiana Shores
Business (37 | 18.1%), social sciences (34 | 16.7%), education (28 | 13.7%), liberal arts & history (16 | 7.8%), and physical & health sciences (15 | 7.3%) are the most common fields of study among 204 individuals in Michiana Shores who have obtained a bachelor's degree or higher.
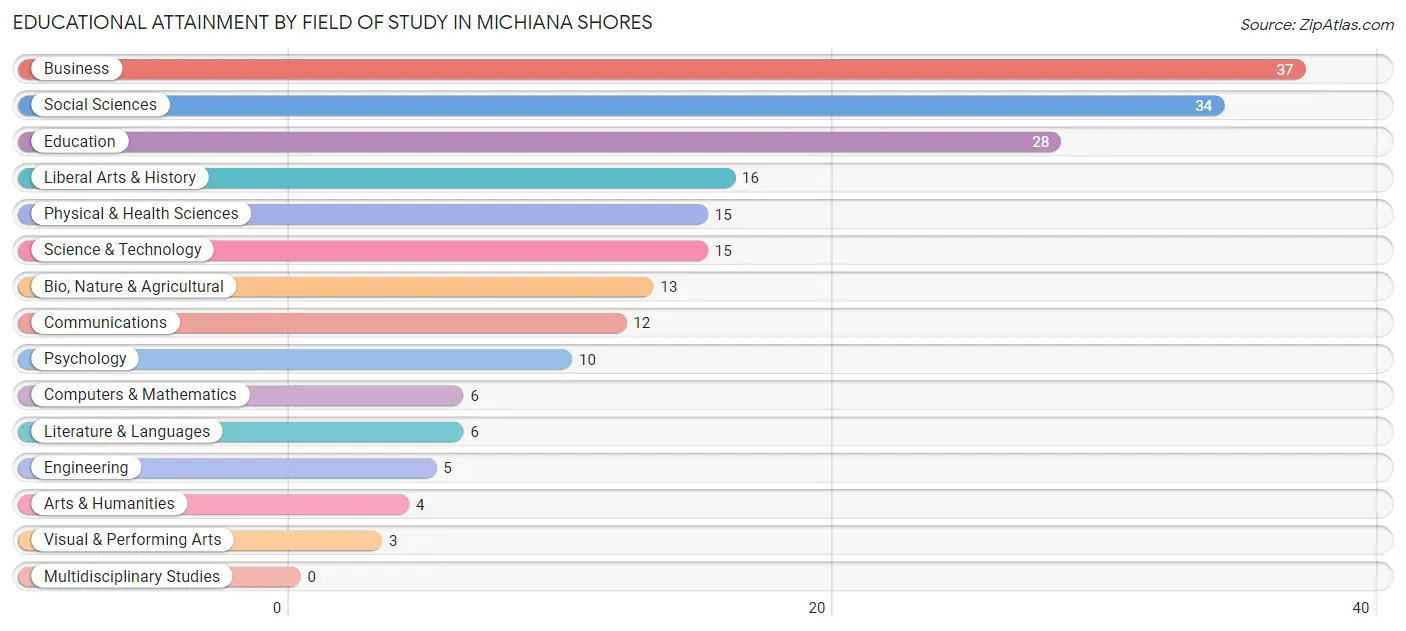
| Field of Study | # Graduates | % Graduates |
| Computers & Mathematics | 6 | 2.9% |
| Bio, Nature & Agricultural | 13 | 6.4% |
| Physical & Health Sciences | 15 | 7.3% |
| Psychology | 10 | 4.9% |
| Social Sciences | 34 | 16.7% |
| Engineering | 5 | 2.5% |
| Multidisciplinary Studies | 0 | 0.0% |
| Science & Technology | 15 | 7.3% |
| Business | 37 | 18.1% |
| Education | 28 | 13.7% |
| Literature & Languages | 6 | 2.9% |
| Liberal Arts & History | 16 | 7.8% |
| Visual & Performing Arts | 3 | 1.5% |
| Communications | 12 | 5.9% |
| Arts & Humanities | 4 | 2.0% |
| Total | 204 | 100.0% |
Transportation & Commute in Michiana Shores
Vehicle Availability by Sex in Michiana Shores
The most prevalent vehicle ownership categories in Michiana Shores are males with 1 vehicle (35, accounting for 34.3%) and females with 1 vehicle (29, making up 44.3%).
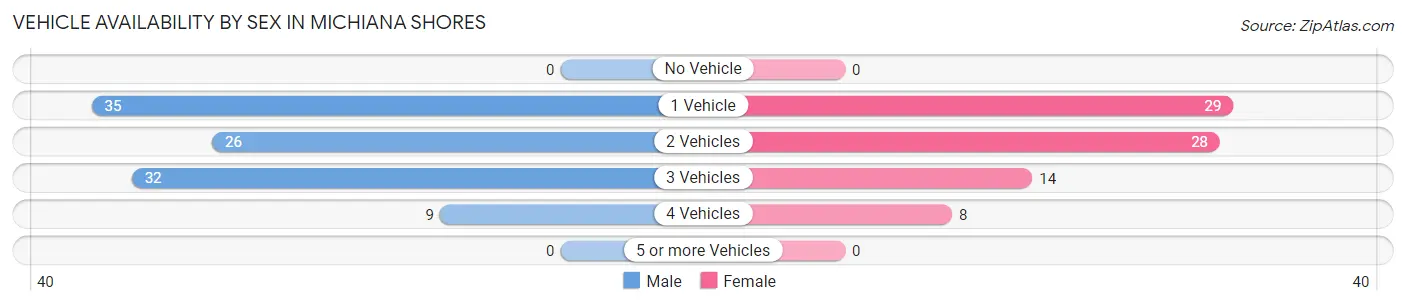
| Vehicles Available | Male | Female |
| No Vehicle | 0 (0.0%) | 0 (0.0%) |
| 1 Vehicle | 35 (34.3%) | 29 (36.7%) |
| 2 Vehicles | 26 (25.5%) | 28 (35.4%) |
| 3 Vehicles | 32 (31.4%) | 14 (17.7%) |
| 4 Vehicles | 9 (8.8%) | 8 (10.1%) |
| 5 or more Vehicles | 0 (0.0%) | 0 (0.0%) |
| Total | 102 (100.0%) | 79 (100.0%) |
Commute Time in Michiana Shores
The most frequently occuring commute durations in Michiana Shores are 45 to 59 minutes (32 commuters, 20.4%), 60 to 89 minutes (24 commuters, 15.3%), and 10 to 14 minutes (18 commuters, 11.5%).
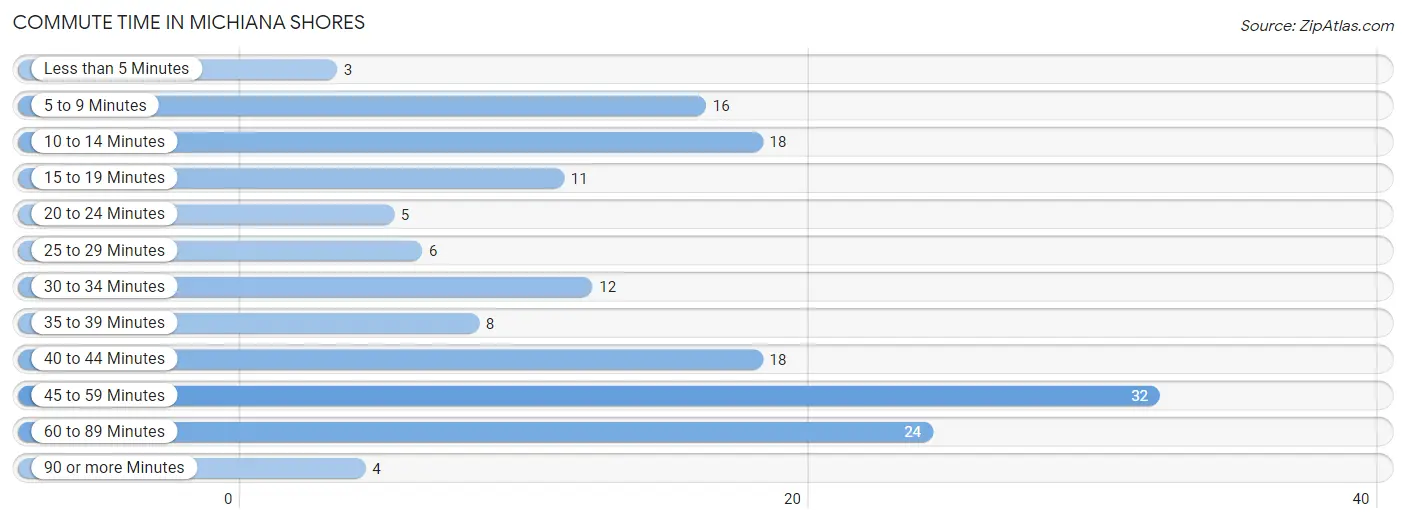
| Commute Time | # Commuters | % Commuters |
| Less than 5 Minutes | 3 | 1.9% |
| 5 to 9 Minutes | 16 | 10.2% |
| 10 to 14 Minutes | 18 | 11.5% |
| 15 to 19 Minutes | 11 | 7.0% |
| 20 to 24 Minutes | 5 | 3.2% |
| 25 to 29 Minutes | 6 | 3.8% |
| 30 to 34 Minutes | 12 | 7.6% |
| 35 to 39 Minutes | 8 | 5.1% |
| 40 to 44 Minutes | 18 | 11.5% |
| 45 to 59 Minutes | 32 | 20.4% |
| 60 to 89 Minutes | 24 | 15.3% |
| 90 or more Minutes | 4 | 2.5% |
Commute Time by Sex in Michiana Shores
The most common commute times in Michiana Shores are 45 to 59 minutes (24 commuters, 26.4%) for males and 5 to 9 minutes (14 commuters, 21.2%) for females.
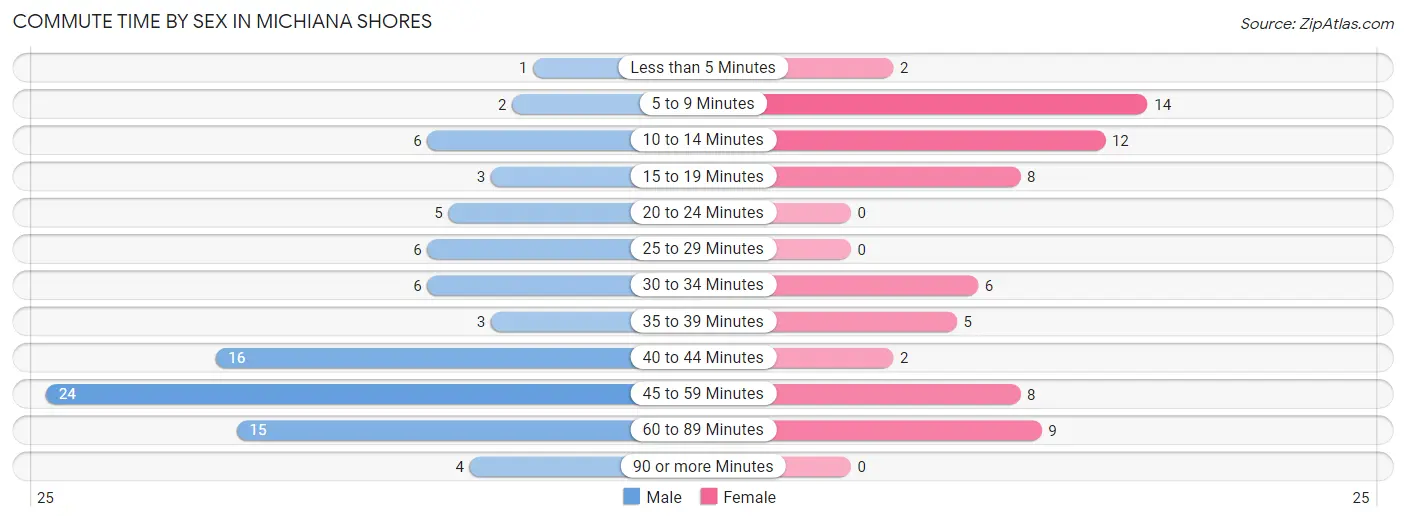
| Commute Time | Male | Female |
| Less than 5 Minutes | 1 (1.1%) | 2 (3.0%) |
| 5 to 9 Minutes | 2 (2.2%) | 14 (21.2%) |
| 10 to 14 Minutes | 6 (6.6%) | 12 (18.2%) |
| 15 to 19 Minutes | 3 (3.3%) | 8 (12.1%) |
| 20 to 24 Minutes | 5 (5.5%) | 0 (0.0%) |
| 25 to 29 Minutes | 6 (6.6%) | 0 (0.0%) |
| 30 to 34 Minutes | 6 (6.6%) | 6 (9.1%) |
| 35 to 39 Minutes | 3 (3.3%) | 5 (7.6%) |
| 40 to 44 Minutes | 16 (17.6%) | 2 (3.0%) |
| 45 to 59 Minutes | 24 (26.4%) | 8 (12.1%) |
| 60 to 89 Minutes | 15 (16.5%) | 9 (13.6%) |
| 90 or more Minutes | 4 (4.4%) | 0 (0.0%) |
Time of Departure to Work by Sex in Michiana Shores
The most frequent times of departure to work in Michiana Shores are 7:00 AM to 7:29 AM (22, 24.2%) for males and 7:30 AM to 7:59 AM (19, 28.8%) for females.
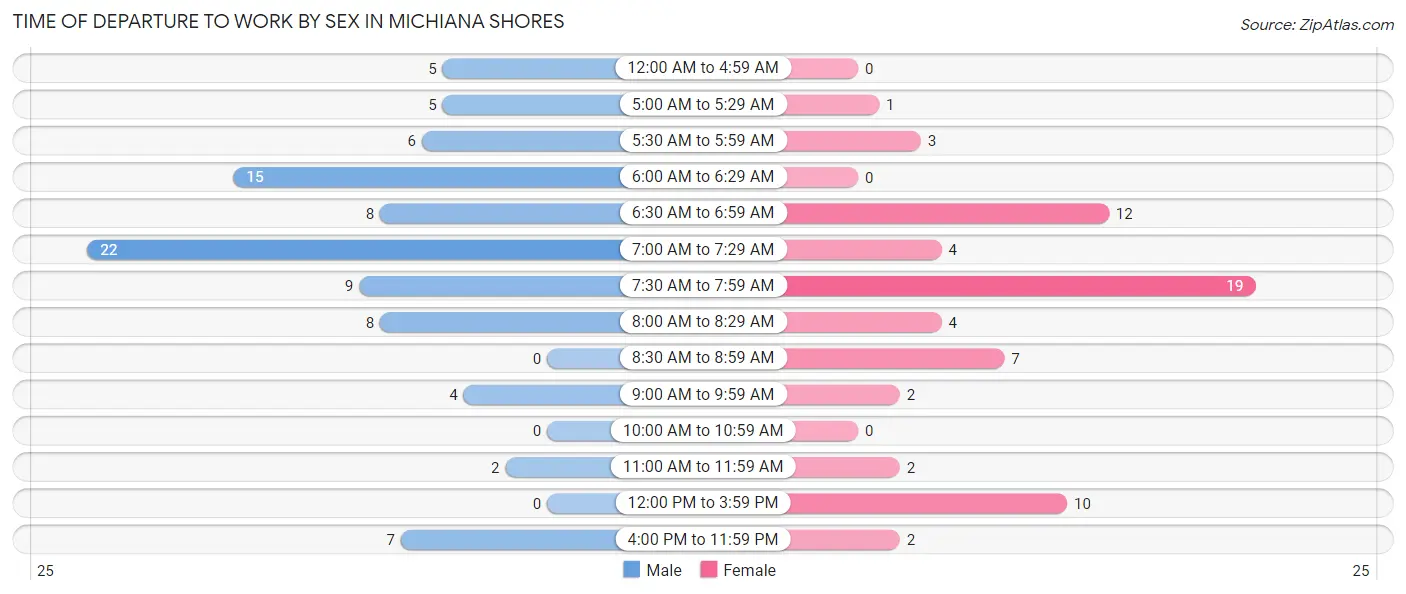
| Time of Departure | Male | Female |
| 12:00 AM to 4:59 AM | 5 (5.5%) | 0 (0.0%) |
| 5:00 AM to 5:29 AM | 5 (5.5%) | 1 (1.5%) |
| 5:30 AM to 5:59 AM | 6 (6.6%) | 3 (4.5%) |
| 6:00 AM to 6:29 AM | 15 (16.5%) | 0 (0.0%) |
| 6:30 AM to 6:59 AM | 8 (8.8%) | 12 (18.2%) |
| 7:00 AM to 7:29 AM | 22 (24.2%) | 4 (6.1%) |
| 7:30 AM to 7:59 AM | 9 (9.9%) | 19 (28.8%) |
| 8:00 AM to 8:29 AM | 8 (8.8%) | 4 (6.1%) |
| 8:30 AM to 8:59 AM | 0 (0.0%) | 7 (10.6%) |
| 9:00 AM to 9:59 AM | 4 (4.4%) | 2 (3.0%) |
| 10:00 AM to 10:59 AM | 0 (0.0%) | 0 (0.0%) |
| 11:00 AM to 11:59 AM | 2 (2.2%) | 2 (3.0%) |
| 12:00 PM to 3:59 PM | 0 (0.0%) | 10 (15.1%) |
| 4:00 PM to 11:59 PM | 7 (7.7%) | 2 (3.0%) |
| Total | 91 (100.0%) | 66 (100.0%) |
Housing Occupancy in Michiana Shores
Occupancy by Ownership in Michiana Shores
Of the total 218 dwellings in Michiana Shores, owner-occupied units account for 199 (91.3%), while renter-occupied units make up 19 (8.7%).
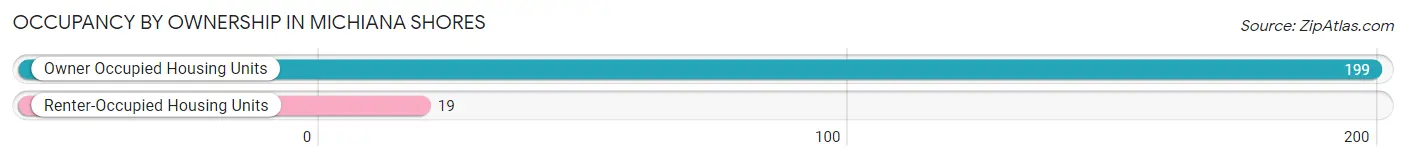
| Occupancy | # Housing Units | % Housing Units |
| Owner Occupied Housing Units | 199 | 91.3% |
| Renter-Occupied Housing Units | 19 | 8.7% |
| Total Occupied Housing Units | 218 | 100.0% |
Occupancy by Household Size in Michiana Shores
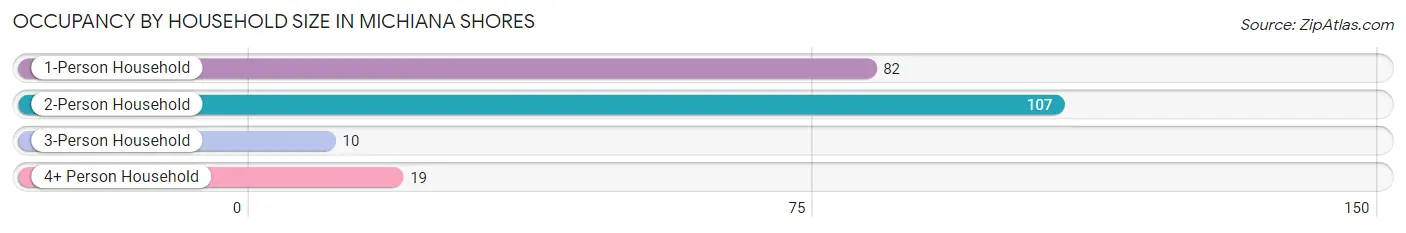
| Household Size | # Housing Units | % Housing Units |
| 1-Person Household | 82 | 37.6% |
| 2-Person Household | 107 | 49.1% |
| 3-Person Household | 10 | 4.6% |
| 4+ Person Household | 19 | 8.7% |
| Total Housing Units | 218 | 100.0% |
Occupancy by Ownership by Household Size in Michiana Shores
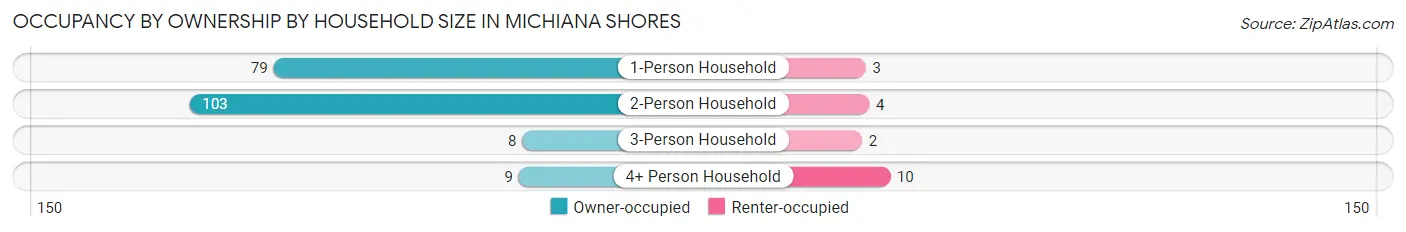
| Household Size | Owner-occupied | Renter-occupied |
| 1-Person Household | 79 (96.3%) | 3 (3.7%) |
| 2-Person Household | 103 (96.3%) | 4 (3.7%) |
| 3-Person Household | 8 (80.0%) | 2 (20.0%) |
| 4+ Person Household | 9 (47.4%) | 10 (52.6%) |
| Total Housing Units | 199 (91.3%) | 19 (8.7%) |
Occupancy by Educational Attainment in Michiana Shores
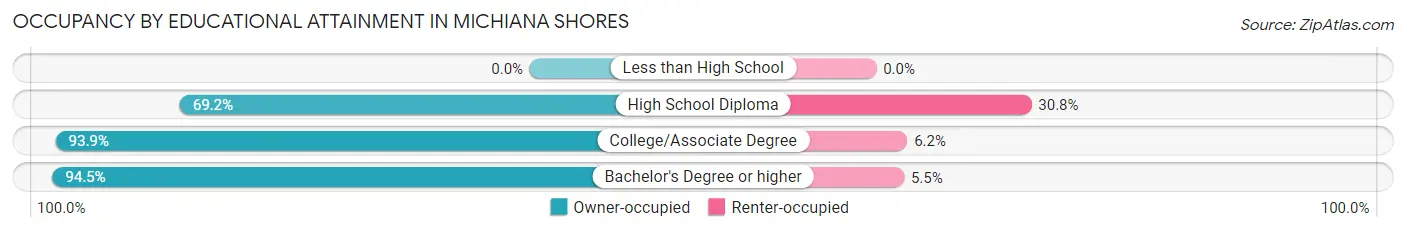
| Household Size | Owner-occupied | Renter-occupied |
| Less than High School | 0 (0.0%) | 0 (0.0%) |
| High School Diploma | 18 (69.2%) | 8 (30.8%) |
| College/Associate Degree | 61 (93.9%) | 4 (6.1%) |
| Bachelor's Degree or higher | 120 (94.5%) | 7 (5.5%) |
Occupancy by Age of Householder in Michiana Shores
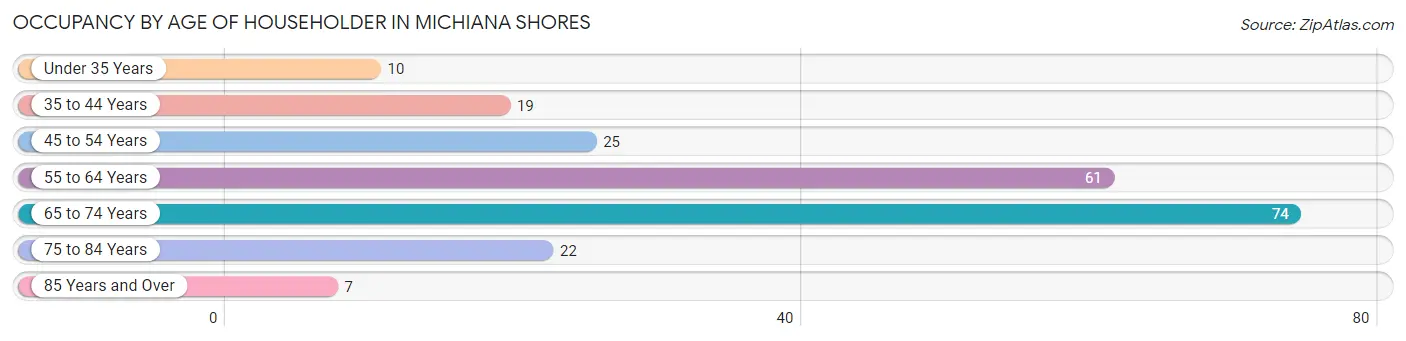
| Age Bracket | # Households | % Households |
| Under 35 Years | 10 | 4.6% |
| 35 to 44 Years | 19 | 8.7% |
| 45 to 54 Years | 25 | 11.5% |
| 55 to 64 Years | 61 | 28.0% |
| 65 to 74 Years | 74 | 33.9% |
| 75 to 84 Years | 22 | 10.1% |
| 85 Years and Over | 7 | 3.2% |
| Total | 218 | 100.0% |
Housing Finances in Michiana Shores
Median Income by Occupancy in Michiana Shores
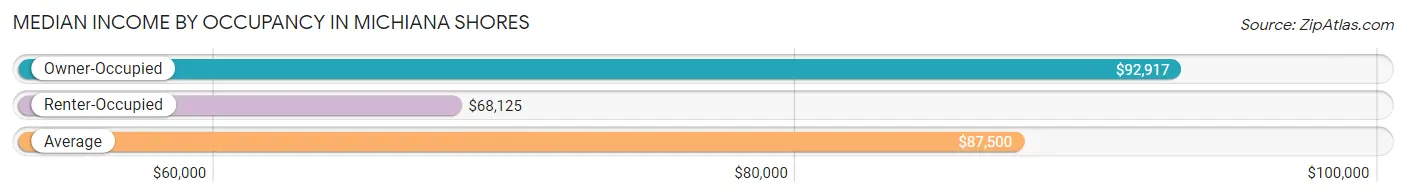
| Occupancy Type | # Households | Median Income |
| Owner-Occupied | 199 (91.3%) | $92,917 |
| Renter-Occupied | 19 (8.7%) | $68,125 |
| Average | 218 (100.0%) | $87,500 |
Occupancy by Householder Income Bracket in Michiana Shores
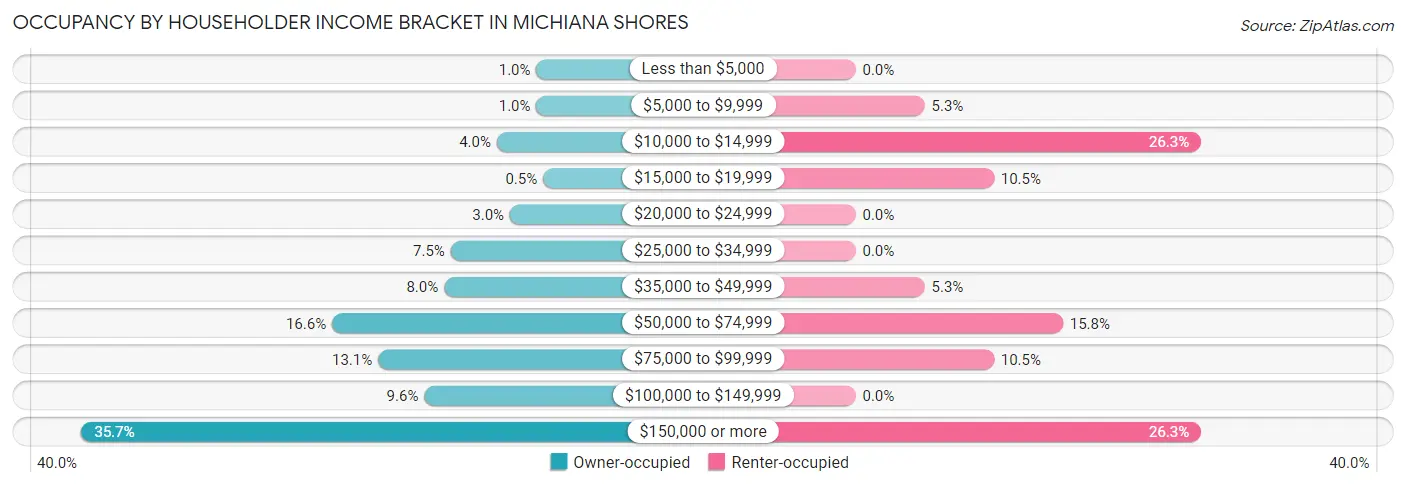
| Income Bracket | Owner-occupied | Renter-occupied |
| Less than $5,000 | 2 (1.0%) | 0 (0.0%) |
| $5,000 to $9,999 | 2 (1.0%) | 1 (5.3%) |
| $10,000 to $14,999 | 8 (4.0%) | 5 (26.3%) |
| $15,000 to $19,999 | 1 (0.5%) | 2 (10.5%) |
| $20,000 to $24,999 | 6 (3.0%) | 0 (0.0%) |
| $25,000 to $34,999 | 15 (7.5%) | 0 (0.0%) |
| $35,000 to $49,999 | 16 (8.0%) | 1 (5.3%) |
| $50,000 to $74,999 | 33 (16.6%) | 3 (15.8%) |
| $75,000 to $99,999 | 26 (13.1%) | 2 (10.5%) |
| $100,000 to $149,999 | 19 (9.6%) | 0 (0.0%) |
| $150,000 or more | 71 (35.7%) | 5 (26.3%) |
| Total | 199 (100.0%) | 19 (100.0%) |
Monthly Housing Cost Tiers in Michiana Shores
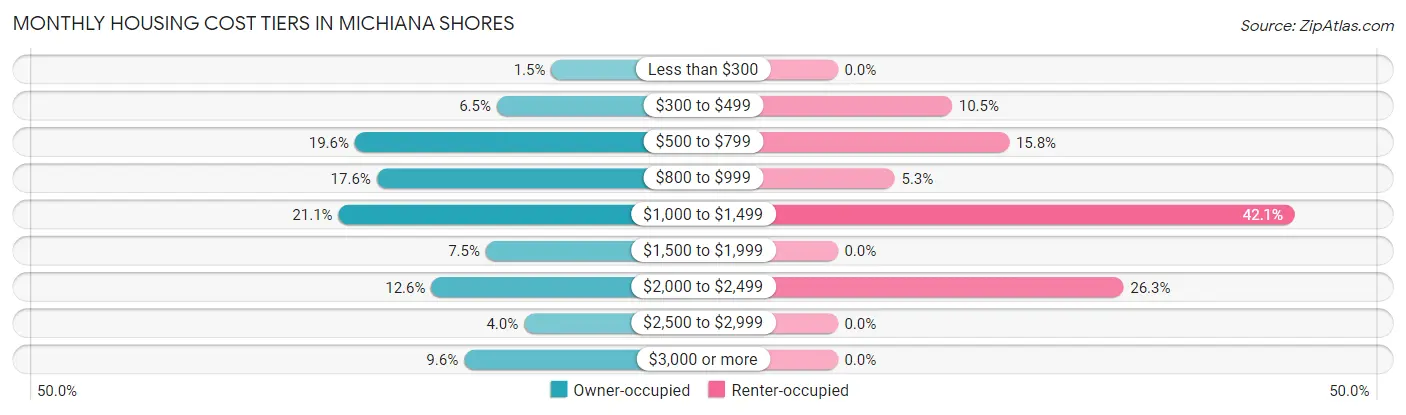
| Monthly Cost | Owner-occupied | Renter-occupied |
| Less than $300 | 3 (1.5%) | 0 (0.0%) |
| $300 to $499 | 13 (6.5%) | 2 (10.5%) |
| $500 to $799 | 39 (19.6%) | 3 (15.8%) |
| $800 to $999 | 35 (17.6%) | 1 (5.3%) |
| $1,000 to $1,499 | 42 (21.1%) | 8 (42.1%) |
| $1,500 to $1,999 | 15 (7.5%) | 0 (0.0%) |
| $2,000 to $2,499 | 25 (12.6%) | 5 (26.3%) |
| $2,500 to $2,999 | 8 (4.0%) | 0 (0.0%) |
| $3,000 or more | 19 (9.6%) | 0 (0.0%) |
| Total | 199 (100.0%) | 19 (100.0%) |
Physical Housing Characteristics in Michiana Shores
Housing Structures in Michiana Shores
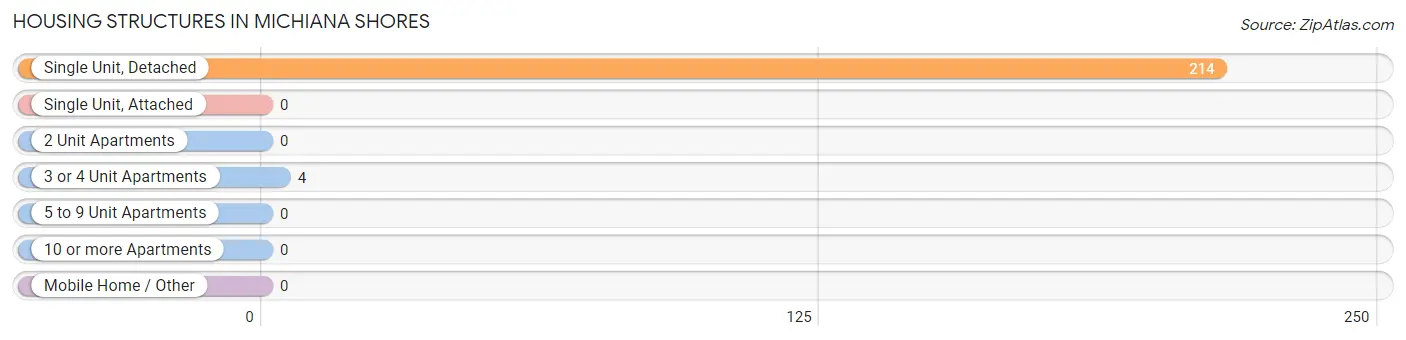
| Structure Type | # Housing Units | % Housing Units |
| Single Unit, Detached | 214 | 98.2% |
| Single Unit, Attached | 0 | 0.0% |
| 2 Unit Apartments | 0 | 0.0% |
| 3 or 4 Unit Apartments | 4 | 1.8% |
| 5 to 9 Unit Apartments | 0 | 0.0% |
| 10 or more Apartments | 0 | 0.0% |
| Mobile Home / Other | 0 | 0.0% |
| Total | 218 | 100.0% |
Housing Structures by Occupancy in Michiana Shores
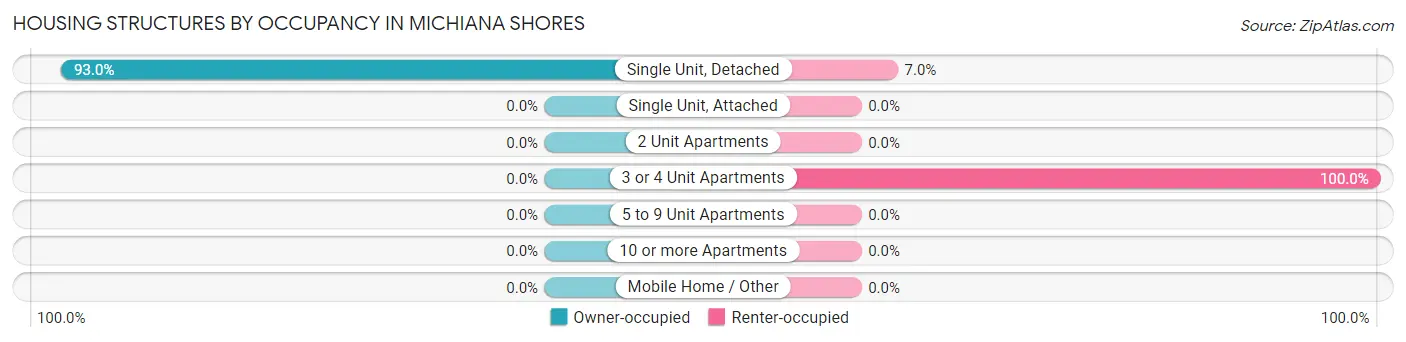
| Structure Type | Owner-occupied | Renter-occupied |
| Single Unit, Detached | 199 (93.0%) | 15 (7.0%) |
| Single Unit, Attached | 0 (0.0%) | 0 (0.0%) |
| 2 Unit Apartments | 0 (0.0%) | 0 (0.0%) |
| 3 or 4 Unit Apartments | 0 (0.0%) | 4 (100.0%) |
| 5 to 9 Unit Apartments | 0 (0.0%) | 0 (0.0%) |
| 10 or more Apartments | 0 (0.0%) | 0 (0.0%) |
| Mobile Home / Other | 0 (0.0%) | 0 (0.0%) |
| Total | 199 (91.3%) | 19 (8.7%) |
Housing Structures by Number of Rooms in Michiana Shores
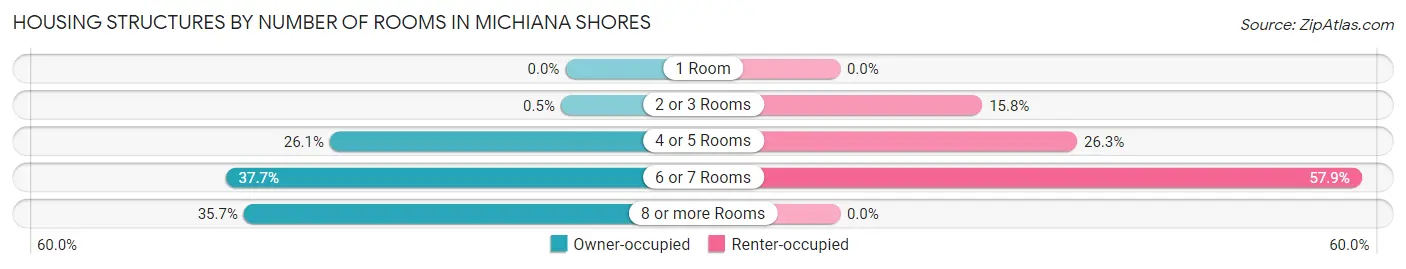
| Number of Rooms | Owner-occupied | Renter-occupied |
| 1 Room | 0 (0.0%) | 0 (0.0%) |
| 2 or 3 Rooms | 1 (0.5%) | 3 (15.8%) |
| 4 or 5 Rooms | 52 (26.1%) | 5 (26.3%) |
| 6 or 7 Rooms | 75 (37.7%) | 11 (57.9%) |
| 8 or more Rooms | 71 (35.7%) | 0 (0.0%) |
| Total | 199 (100.0%) | 19 (100.0%) |
Housing Structure by Heating Type in Michiana Shores
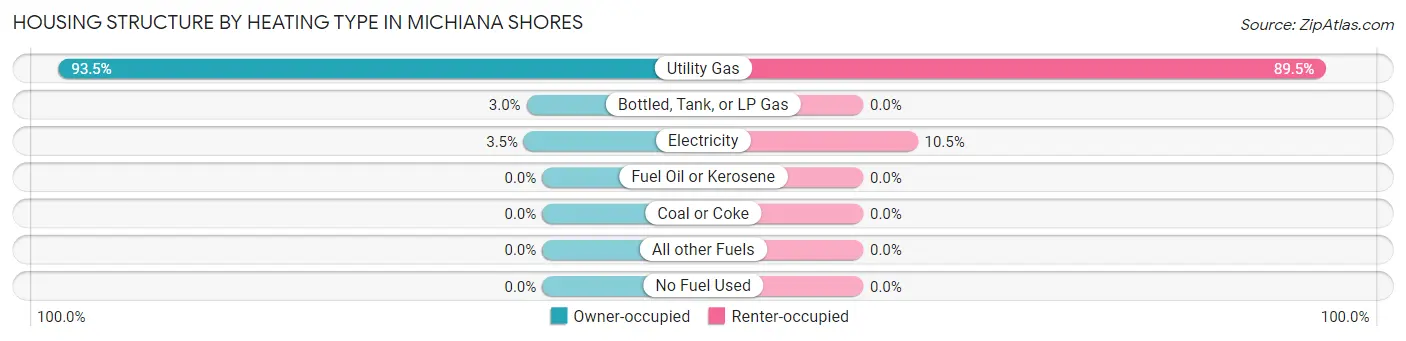
| Heating Type | Owner-occupied | Renter-occupied |
| Utility Gas | 186 (93.5%) | 17 (89.5%) |
| Bottled, Tank, or LP Gas | 6 (3.0%) | 0 (0.0%) |
| Electricity | 7 (3.5%) | 2 (10.5%) |
| Fuel Oil or Kerosene | 0 (0.0%) | 0 (0.0%) |
| Coal or Coke | 0 (0.0%) | 0 (0.0%) |
| All other Fuels | 0 (0.0%) | 0 (0.0%) |
| No Fuel Used | 0 (0.0%) | 0 (0.0%) |
| Total | 199 (100.0%) | 19 (100.0%) |
Household Vehicle Usage in Michiana Shores
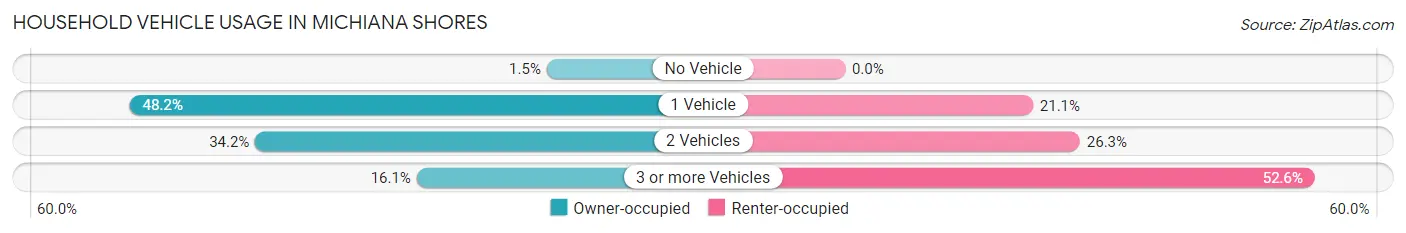
| Vehicles per Household | Owner-occupied | Renter-occupied |
| No Vehicle | 3 (1.5%) | 0 (0.0%) |
| 1 Vehicle | 96 (48.2%) | 4 (21.0%) |
| 2 Vehicles | 68 (34.2%) | 5 (26.3%) |
| 3 or more Vehicles | 32 (16.1%) | 10 (52.6%) |
| Total | 199 (100.0%) | 19 (100.0%) |
Real Estate & Mortgages in Michiana Shores
Real Estate and Mortgage Overview in Michiana Shores
| Characteristic | Without Mortgage | With Mortgage |
| Housing Units | 90 | 109 |
| Median Property Value | $413,600 | $416,700 |
| Median Household Income | $59,688 | $45 |
| Monthly Housing Costs | $686 | $19 |
| Real Estate Taxes | $4,357 | $0 |
Property Value by Mortgage Status in Michiana Shores
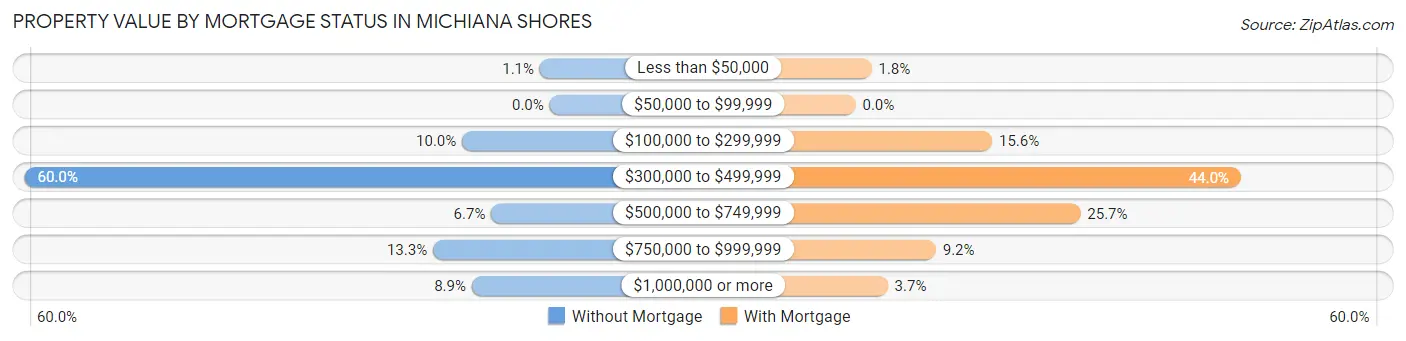
| Property Value | Without Mortgage | With Mortgage |
| Less than $50,000 | 1 (1.1%) | 2 (1.8%) |
| $50,000 to $99,999 | 0 (0.0%) | 0 (0.0%) |
| $100,000 to $299,999 | 9 (10.0%) | 17 (15.6%) |
| $300,000 to $499,999 | 54 (60.0%) | 48 (44.0%) |
| $500,000 to $749,999 | 6 (6.7%) | 28 (25.7%) |
| $750,000 to $999,999 | 12 (13.3%) | 10 (9.2%) |
| $1,000,000 or more | 8 (8.9%) | 4 (3.7%) |
| Total | 90 (100.0%) | 109 (100.0%) |
Household Income by Mortgage Status in Michiana Shores
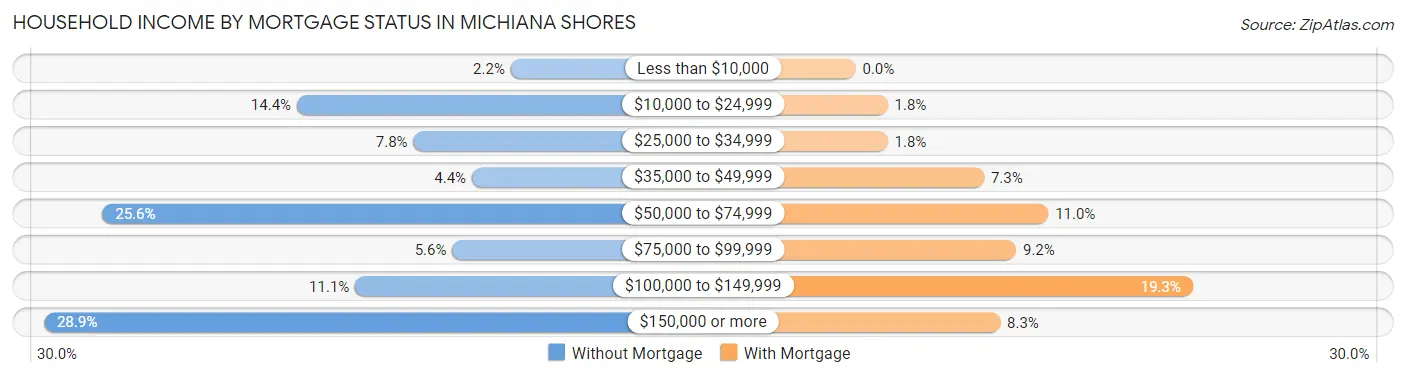
| Household Income | Without Mortgage | With Mortgage |
| Less than $10,000 | 2 (2.2%) | 0 (0.0%) |
| $10,000 to $24,999 | 13 (14.4%) | 2 (1.8%) |
| $25,000 to $34,999 | 7 (7.8%) | 2 (1.8%) |
| $35,000 to $49,999 | 4 (4.4%) | 8 (7.3%) |
| $50,000 to $74,999 | 23 (25.6%) | 12 (11.0%) |
| $75,000 to $99,999 | 5 (5.6%) | 10 (9.2%) |
| $100,000 to $149,999 | 10 (11.1%) | 21 (19.3%) |
| $150,000 or more | 26 (28.9%) | 9 (8.3%) |
| Total | 90 (100.0%) | 109 (100.0%) |
Property Value to Household Income Ratio in Michiana Shores
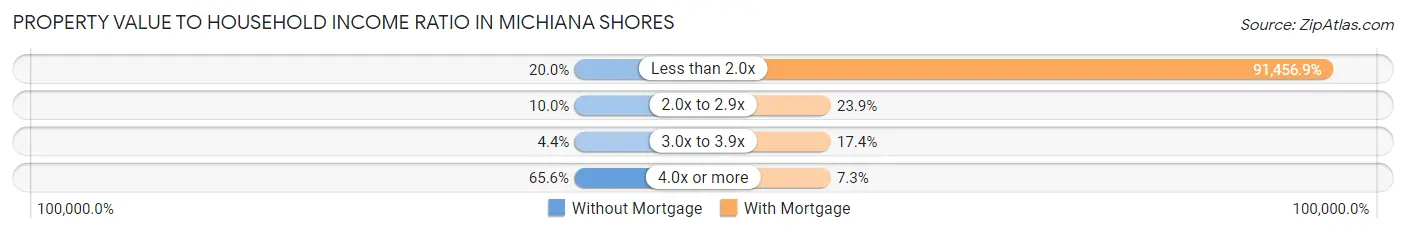
| Value-to-Income Ratio | Without Mortgage | With Mortgage |
| Less than 2.0x | 18 (20.0%) | 99,688 (91,456.9%) |
| 2.0x to 2.9x | 9 (10.0%) | 26 (23.8%) |
| 3.0x to 3.9x | 4 (4.4%) | 19 (17.4%) |
| 4.0x or more | 59 (65.6%) | 8 (7.3%) |
| Total | 90 (100.0%) | 109 (100.0%) |
Real Estate Taxes by Mortgage Status in Michiana Shores
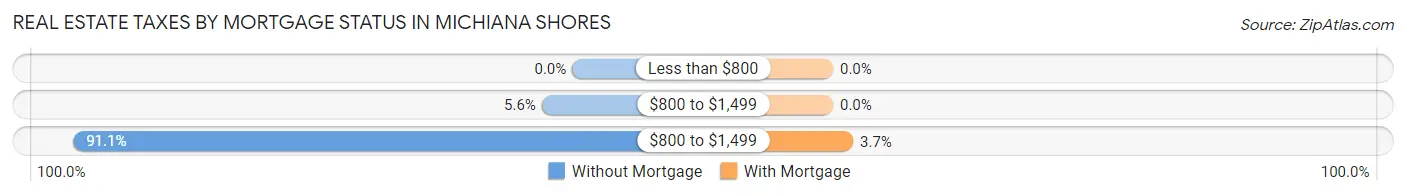
| Property Taxes | Without Mortgage | With Mortgage |
| Less than $800 | 0 (0.0%) | 0 (0.0%) |
| $800 to $1,499 | 5 (5.6%) | 0 (0.0%) |
| $800 to $1,499 | 82 (91.1%) | 4 (3.7%) |
| Total | 90 (100.0%) | 109 (100.0%) |
Health & Disability in Michiana Shores
Health Insurance Coverage by Age in Michiana Shores
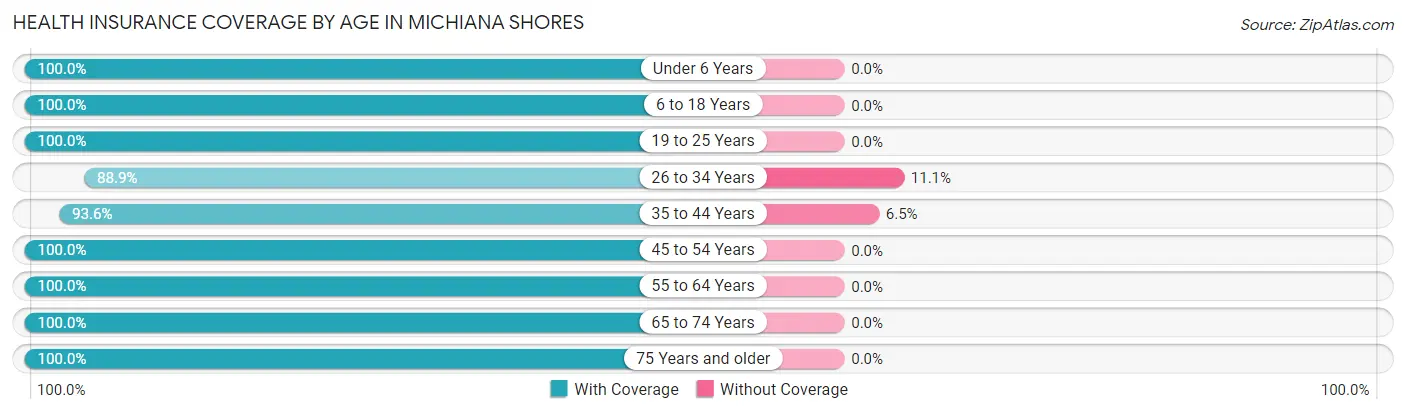
| Age Bracket | With Coverage | Without Coverage |
| Under 6 Years | 13 (100.0%) | 0 (0.0%) |
| 6 to 18 Years | 38 (100.0%) | 0 (0.0%) |
| 19 to 25 Years | 22 (100.0%) | 0 (0.0%) |
| 26 to 34 Years | 16 (88.9%) | 2 (11.1%) |
| 35 to 44 Years | 29 (93.5%) | 2 (6.5%) |
| 45 to 54 Years | 36 (100.0%) | 0 (0.0%) |
| 55 to 64 Years | 94 (100.0%) | 0 (0.0%) |
| 65 to 74 Years | 110 (100.0%) | 0 (0.0%) |
| 75 Years and older | 58 (100.0%) | 0 (0.0%) |
| Total | 416 (99.1%) | 4 (0.9%) |
Health Insurance Coverage by Citizenship Status in Michiana Shores
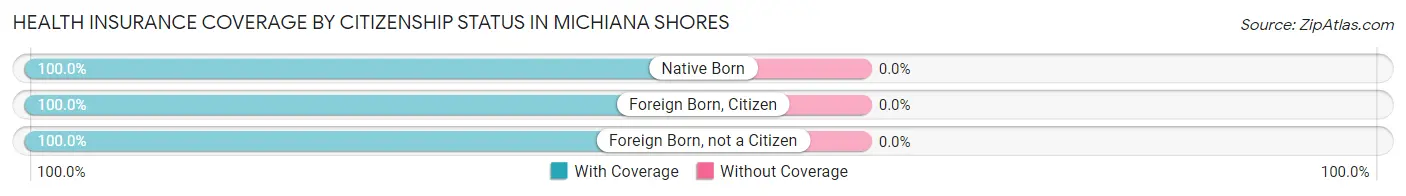
| Citizenship Status | With Coverage | Without Coverage |
| Native Born | 13 (100.0%) | 0 (0.0%) |
| Foreign Born, Citizen | 38 (100.0%) | 0 (0.0%) |
| Foreign Born, not a Citizen | 22 (100.0%) | 0 (0.0%) |
Health Insurance Coverage by Household Income in Michiana Shores
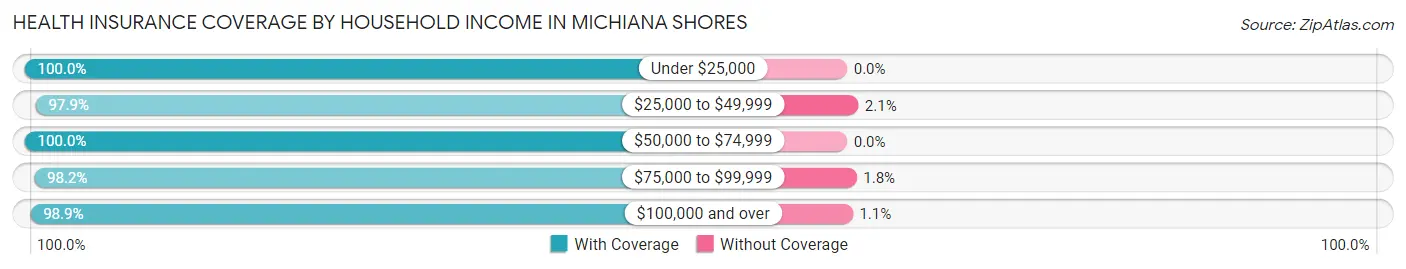
| Household Income | With Coverage | Without Coverage |
| Under $25,000 | 62 (100.0%) | 0 (0.0%) |
| $25,000 to $49,999 | 47 (97.9%) | 1 (2.1%) |
| $50,000 to $74,999 | 66 (100.0%) | 0 (0.0%) |
| $75,000 to $99,999 | 55 (98.2%) | 1 (1.8%) |
| $100,000 and over | 186 (98.9%) | 2 (1.1%) |
Public vs Private Health Insurance Coverage by Age in Michiana Shores
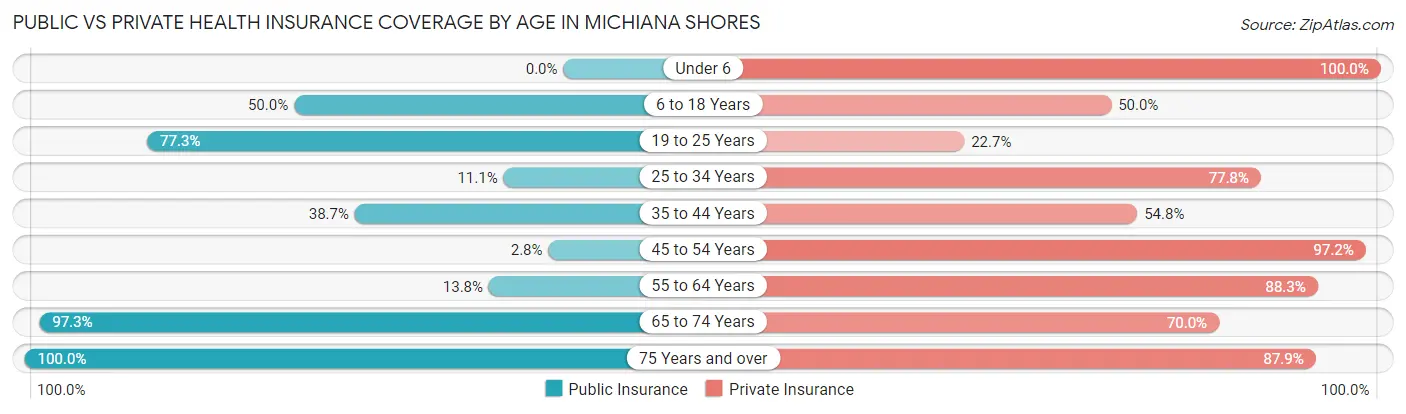
| Age Bracket | Public Insurance | Private Insurance |
| Under 6 | 0 (0.0%) | 13 (100.0%) |
| 6 to 18 Years | 19 (50.0%) | 19 (50.0%) |
| 19 to 25 Years | 17 (77.3%) | 5 (22.7%) |
| 25 to 34 Years | 2 (11.1%) | 14 (77.8%) |
| 35 to 44 Years | 12 (38.7%) | 17 (54.8%) |
| 45 to 54 Years | 1 (2.8%) | 35 (97.2%) |
| 55 to 64 Years | 13 (13.8%) | 83 (88.3%) |
| 65 to 74 Years | 107 (97.3%) | 77 (70.0%) |
| 75 Years and over | 58 (100.0%) | 51 (87.9%) |
| Total | 229 (54.5%) | 314 (74.8%) |
Disability Status by Sex by Age in Michiana Shores
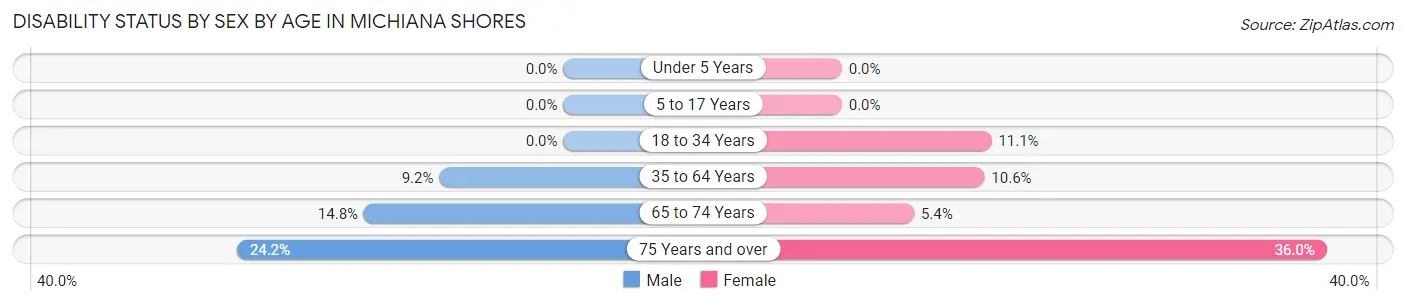
| Age Bracket | Male | Female |
| Under 5 Years | 0 (0.0%) | 0 (0.0%) |
| 5 to 17 Years | 0 (0.0%) | 0 (0.0%) |
| 18 to 34 Years | 0 (0.0%) | 1 (11.1%) |
| 35 to 64 Years | 7 (9.2%) | 9 (10.6%) |
| 65 to 74 Years | 8 (14.8%) | 3 (5.4%) |
| 75 Years and over | 8 (24.2%) | 9 (36.0%) |
Disability Class by Sex by Age in Michiana Shores
Disability Class: Hearing Difficulty
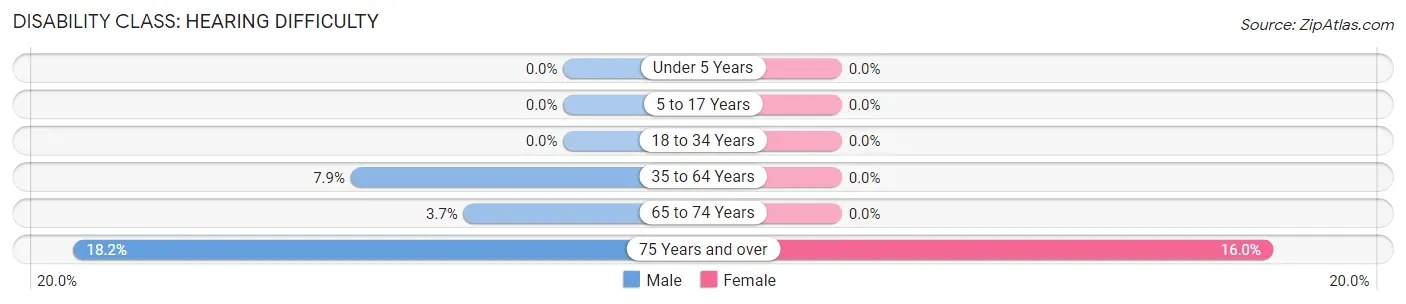
| Age Bracket | Male | Female |
| Under 5 Years | 0 (0.0%) | 0 (0.0%) |
| 5 to 17 Years | 0 (0.0%) | 0 (0.0%) |
| 18 to 34 Years | 0 (0.0%) | 0 (0.0%) |
| 35 to 64 Years | 6 (7.9%) | 0 (0.0%) |
| 65 to 74 Years | 2 (3.7%) | 0 (0.0%) |
| 75 Years and over | 6 (18.2%) | 4 (16.0%) |
Disability Class: Vision Difficulty
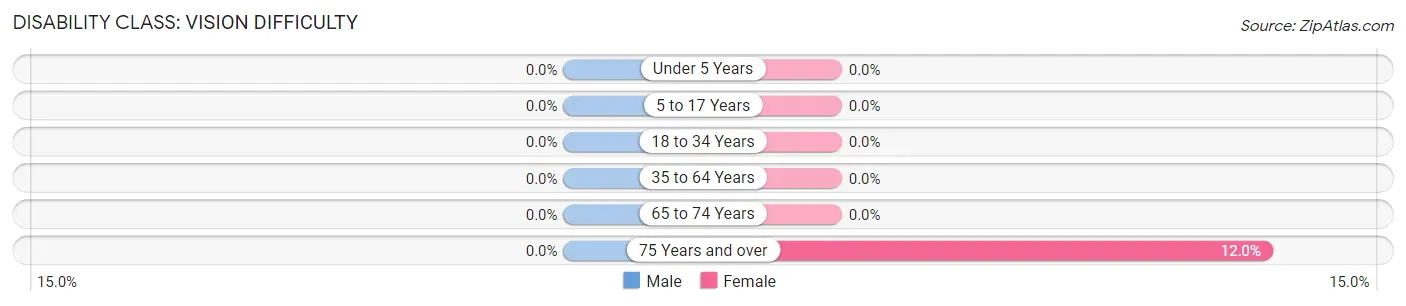
| Age Bracket | Male | Female |
| Under 5 Years | 0 (0.0%) | 0 (0.0%) |
| 5 to 17 Years | 0 (0.0%) | 0 (0.0%) |
| 18 to 34 Years | 0 (0.0%) | 0 (0.0%) |
| 35 to 64 Years | 0 (0.0%) | 0 (0.0%) |
| 65 to 74 Years | 0 (0.0%) | 0 (0.0%) |
| 75 Years and over | 0 (0.0%) | 3 (12.0%) |
Disability Class: Cognitive Difficulty
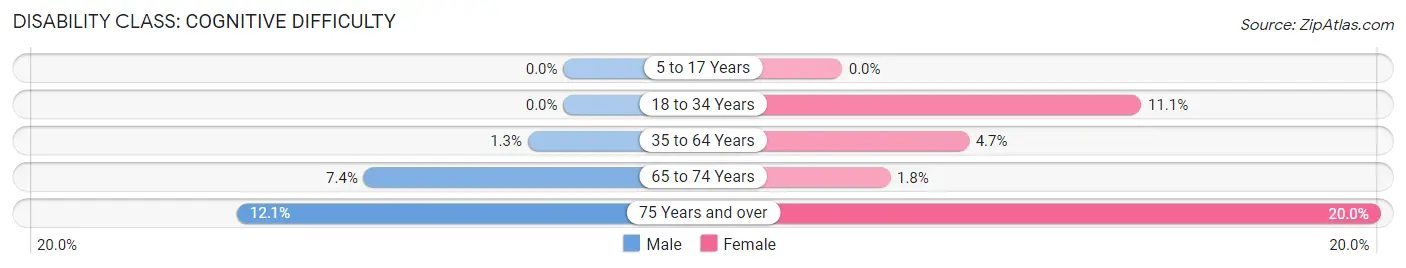
| Age Bracket | Male | Female |
| 5 to 17 Years | 0 (0.0%) | 0 (0.0%) |
| 18 to 34 Years | 0 (0.0%) | 1 (11.1%) |
| 35 to 64 Years | 1 (1.3%) | 4 (4.7%) |
| 65 to 74 Years | 4 (7.4%) | 1 (1.8%) |
| 75 Years and over | 4 (12.1%) | 5 (20.0%) |
Disability Class: Ambulatory Difficulty
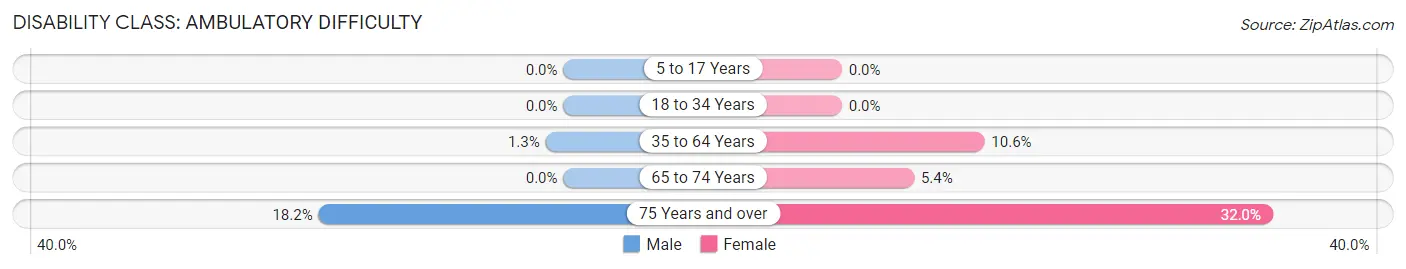
| Age Bracket | Male | Female |
| 5 to 17 Years | 0 (0.0%) | 0 (0.0%) |
| 18 to 34 Years | 0 (0.0%) | 0 (0.0%) |
| 35 to 64 Years | 1 (1.3%) | 9 (10.6%) |
| 65 to 74 Years | 0 (0.0%) | 3 (5.4%) |
| 75 Years and over | 6 (18.2%) | 8 (32.0%) |
Disability Class: Self-Care Difficulty
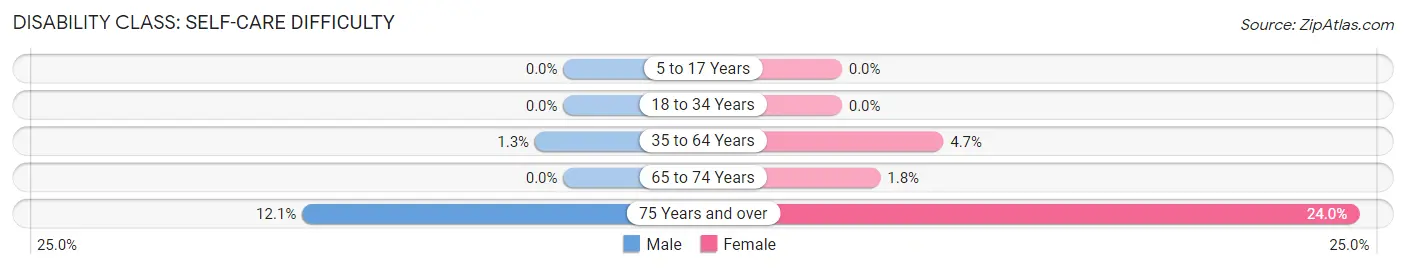
| Age Bracket | Male | Female |
| 5 to 17 Years | 0 (0.0%) | 0 (0.0%) |
| 18 to 34 Years | 0 (0.0%) | 0 (0.0%) |
| 35 to 64 Years | 1 (1.3%) | 4 (4.7%) |
| 65 to 74 Years | 0 (0.0%) | 1 (1.8%) |
| 75 Years and over | 4 (12.1%) | 6 (24.0%) |
Technology Access in Michiana Shores
Computing Device Access in Michiana Shores
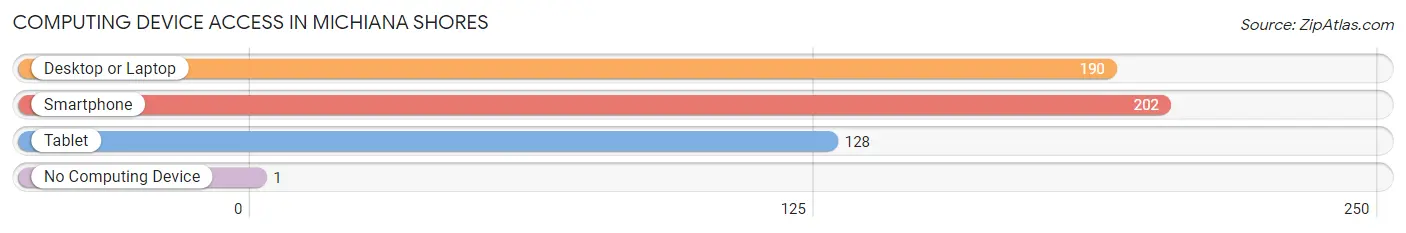
| Device Type | # Households | % Households |
| Desktop or Laptop | 190 | 87.2% |
| Smartphone | 202 | 92.7% |
| Tablet | 128 | 58.7% |
| No Computing Device | 1 | 0.5% |
| Total | 218 | 100.0% |
Internet Access in Michiana Shores
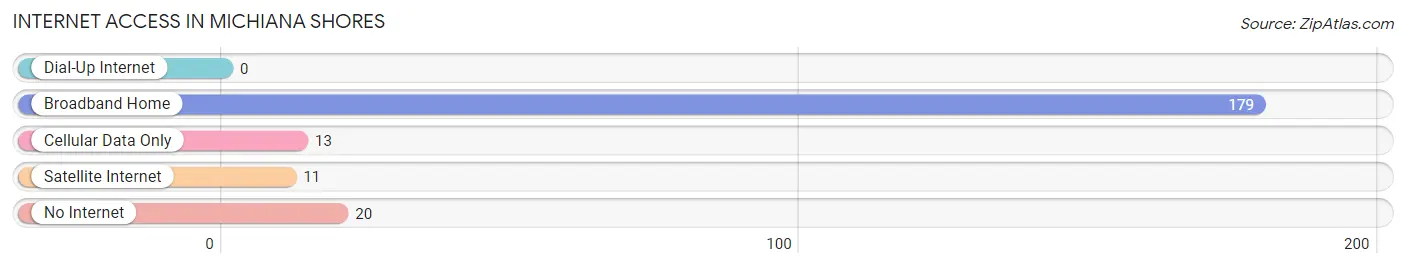
| Internet Type | # Households | % Households |
| Dial-Up Internet | 0 | 0.0% |
| Broadband Home | 179 | 82.1% |
| Cellular Data Only | 13 | 6.0% |
| Satellite Internet | 11 | 5.1% |
| No Internet | 20 | 9.2% |
| Total | 218 | 100.0% |
Michiana Shores Summary
Michiana Shores is a small town located in the northwest corner of Indiana, in LaPorte County. It is situated on the shores of Lake Michigan, and is part of the larger Michiana region, which includes parts of both Indiana and Michigan. The town has a population of just over 1,000 people, and is known for its beautiful beaches, quaint downtown area, and friendly atmosphere.
Geography
Michiana Shores is located in the northwest corner of Indiana, in LaPorte County. It is situated on the shores of Lake Michigan, and is part of the larger Michiana region, which includes parts of both Indiana and Michigan. The town is bordered by the towns of Long Beach and Beverly Shores to the north, and the towns of Michigan City and New Buffalo to the south. The town is located approximately 50 miles east of Chicago, and is easily accessible by car or train.
The town is situated on a flat plain, with the lake to the east and the Indiana Dunes National Lakeshore to the west. The town is surrounded by a variety of natural features, including forests, wetlands, and sand dunes. The town is also home to a variety of wildlife, including deer, foxes, and a variety of birds.
History
Michiana Shores was first settled in the late 1800s by a group of settlers from Michigan. The town was originally known as "Michigan City Beach," and was a popular summer destination for Chicagoans looking to escape the city. The town was officially incorporated in 1921, and the name was changed to Michiana Shores in 1925.
The town experienced a period of growth in the 1950s and 1960s, as the population increased and new businesses opened. The town was also home to a number of popular tourist attractions, including the Michiana Shores Amusement Park, which opened in 1954. The park closed in the late 1970s, but the town remains a popular destination for tourists.
Economy
The economy of Michiana Shores is largely based on tourism. The town is home to a number of popular tourist attractions, including the Indiana Dunes National Lakeshore, the Michiana Shores Amusement Park, and the Long Beach Marina. The town is also home to a number of restaurants, bars, and shops, which cater to both locals and tourists.
The town is also home to a number of businesses, including a number of small manufacturing companies. The town is also home to a number of service-based businesses, including a number of real estate agencies, law firms, and accounting firms.
Demographics
As of the 2010 census, the population of Michiana Shores was 1,072. The town is predominantly white, with a population that is 94.3% white, 1.7% African American, 0.7% Asian, and 0.3% Native American. The median household income in the town is $50,000, and the median home value is $170,000.
The town is home to a number of churches, including the First United Methodist Church, the St. John's Lutheran Church, and the St. Paul's Catholic Church. The town is also home to a number of schools, including the Michiana Shores Elementary School, the Michiana Shores Middle School, and the Michiana Shores High School.
Common Questions
What is Per Capita Income in Michiana Shores?
Per Capita income in Michiana Shores is $79,113.
What is the Median Family Income in Michiana Shores?
Median Family Income in Michiana Shores is $125,417.
What is the Median Household income in Michiana Shores?
Median Household Income in Michiana Shores is $87,500.
What is Income or Wage Gap in Michiana Shores?
Income or Wage Gap in Michiana Shores is 55.6%.
Women in Michiana Shores earn 44.4 cents for every dollar earned by a man.
What is Inequality or Gini Index in Michiana Shores?
Inequality or Gini Index in Michiana Shores is 0.56.
What is the Total Population of Michiana Shores?
Total Population of Michiana Shores is 420.
What is the Total Male Population of Michiana Shores?
Total Male Population of Michiana Shores is 211.
What is the Total Female Population of Michiana Shores?
Total Female Population of Michiana Shores is 209.
What is the Ratio of Males per 100 Females in Michiana Shores?
There are 100.96 Males per 100 Females in Michiana Shores.
What is the Ratio of Females per 100 Males in Michiana Shores?
There are 99.05 Females per 100 Males in Michiana Shores.
What is the Median Population Age in Michiana Shores?
Median Population Age in Michiana Shores is 62.2 Years.
What is the Average Family Size in Michiana Shores
Average Family Size in Michiana Shores is 2.5 People.
What is the Average Household Size in Michiana Shores
Average Household Size in Michiana Shores is 1.9 People.
How Large is the Labor Force in Michiana Shores?
There are 186 People in the Labor Forcein in Michiana Shores.
What is the Percentage of People in the Labor Force in Michiana Shores?
49.1% of People are in the Labor Force in Michiana Shores.
What is the Unemployment Rate in Michiana Shores?
Unemployment Rate in Michiana Shores is 2.7%.