Cities with the Highest Percentage of Population Employed in Mining, Quarrying, & Extraction in Indiana
RELATED REPORTS & OPTIONS
Mining, Quarrying, & Extraction
Indiana
Compare Cities
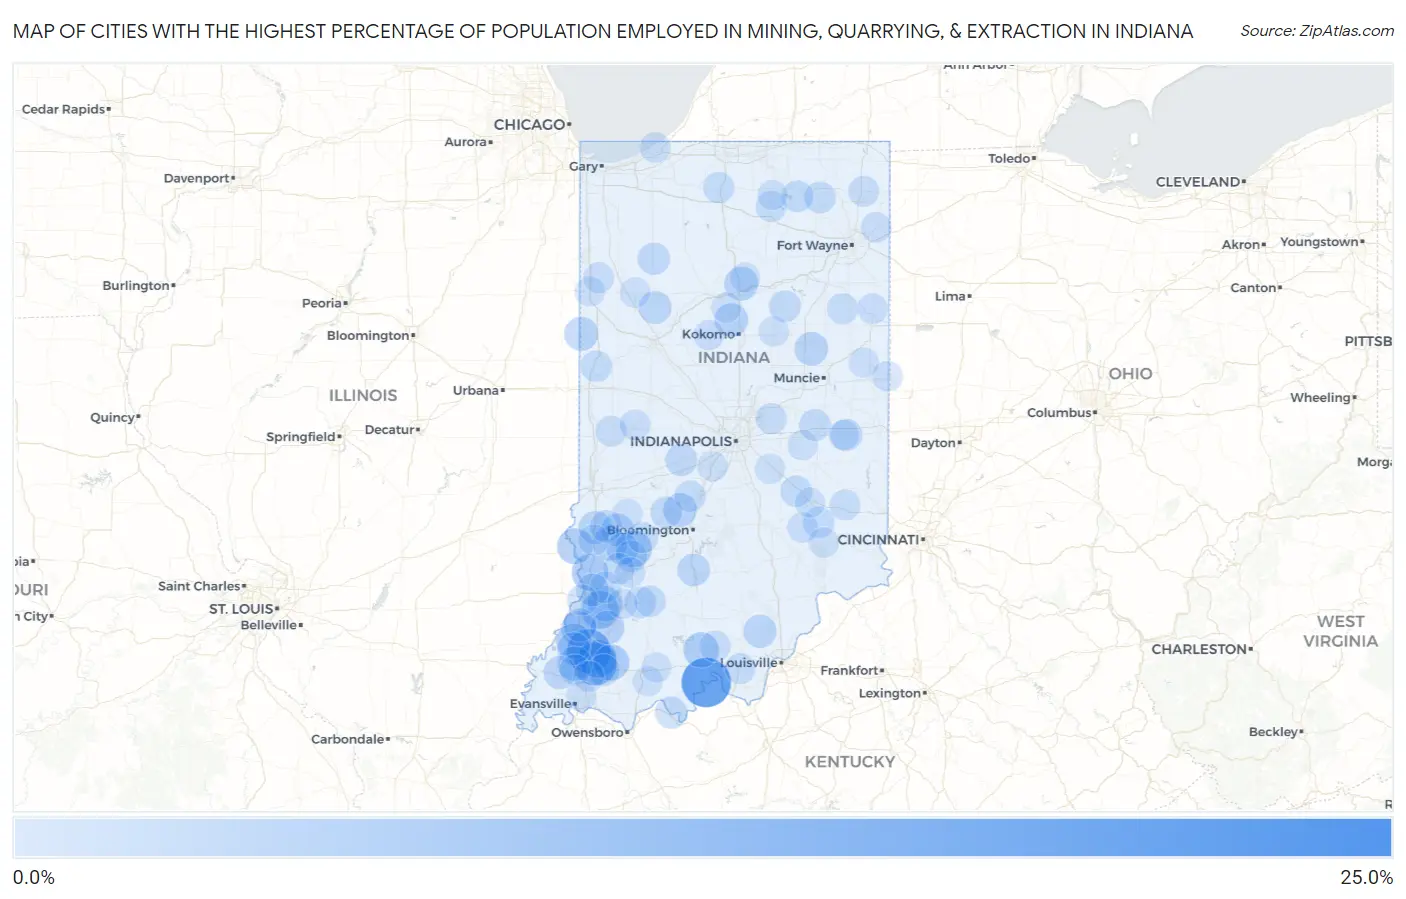
Map of Cities with the Highest Percentage of Population Employed in Mining, Quarrying, & Extraction in Indiana
0.0%
25.0%
Cities with the Highest Percentage of Population Employed in Mining, Quarrying, & Extraction in Indiana
| City | % Employed | vs State | vs National | |
| 1. | Midland | 20.3% | 0.18%(+20.1)#1 | 0.44%(+19.8)#240 |
| 2. | Ramsey | 19.3% | 0.18%(+19.1)#2 | 0.44%(+18.8)#264 |
| 3. | Otter Lake | 17.4% | 0.18%(+17.2)#3 | 0.44%(+17.0)#313 |
| 4. | Alton | 16.7% | 0.18%(+16.5)#4 | 0.44%(+16.2)#351 |
| 5. | Fairbanks | 14.8% | 0.18%(+14.7)#5 | 0.44%(+14.4)#420 |
| 6. | Francisco | 12.0% | 0.18%(+11.8)#6 | 0.44%(+11.5)#596 |
| 7. | Mackey | 11.5% | 0.18%(+11.4)#7 | 0.44%(+11.1)#631 |
| 8. | Wooster | 10.5% | 0.18%(+10.3)#8 | 0.44%(+10.0)#719 |
| 9. | Somerville | 7.2% | 0.18%(+7.03)#9 | 0.44%(+6.78)#1,110 |
| 10. | Monroe City | 6.6% | 0.18%(+6.47)#10 | 0.44%(+6.21)#1,223 |
| 11. | Young America | 6.2% | 0.18%(+6.03)#11 | 0.44%(+5.77)#1,309 |
| 12. | Oaktown | 5.8% | 0.18%(+5.63)#12 | 0.44%(+5.37)#1,390 |
| 13. | Switz City | 5.7% | 0.18%(+5.48)#13 | 0.44%(+5.22)#1,425 |
| 14. | Spurgeon | 5.3% | 0.18%(+5.08)#14 | 0.44%(+4.82)#1,530 |
| 15. | Merom | 5.1% | 0.18%(+4.90)#15 | 0.44%(+4.64)#1,585 |
| 16. | English | 4.8% | 0.18%(+4.64)#16 | 0.44%(+4.39)#1,650 |
| 17. | Wheatland | 4.7% | 0.18%(+4.53)#17 | 0.44%(+4.28)#1,692 |
| 18. | Hazleton | 4.5% | 0.18%(+4.36)#18 | 0.44%(+4.11)#1,745 |
| 19. | Patoka | 4.5% | 0.18%(+4.35)#19 | 0.44%(+4.09)#1,755 |
| 20. | Fort Branch | 4.3% | 0.18%(+4.17)#20 | 0.44%(+3.91)#1,812 |
| 21. | Underwood | 4.1% | 0.18%(+3.92)#21 | 0.44%(+3.66)#1,904 |
| 22. | Dugger | 3.9% | 0.18%(+3.71)#22 | 0.44%(+3.46)#1,988 |
| 23. | Mexico | 3.6% | 0.18%(+3.44)#23 | 0.44%(+3.19)#2,104 |
| 24. | Ambia | 3.6% | 0.18%(+3.43)#24 | 0.44%(+3.17)#2,110 |
| 25. | Galveston | 3.6% | 0.18%(+3.38)#25 | 0.44%(+3.12)#2,148 |
| 26. | Petersburg | 3.5% | 0.18%(+3.30)#26 | 0.44%(+3.05)#2,199 |
| 27. | Stinesville | 3.4% | 0.18%(+3.25)#27 | 0.44%(+2.99)#2,234 |
| 28. | Matthews | 3.4% | 0.18%(+3.22)#28 | 0.44%(+2.96)#2,253 |
| 29. | Borden | 3.0% | 0.18%(+2.85)#29 | 0.44%(+2.60)#2,468 |
| 30. | Decker | 3.0% | 0.18%(+2.85)#30 | 0.44%(+2.59)#2,475 |
| 31. | Shelburn | 2.9% | 0.18%(+2.76)#31 | 0.44%(+2.50)#2,519 |
| 32. | Princeton | 2.9% | 0.18%(+2.72)#32 | 0.44%(+2.46)#2,549 |
| 33. | Jasonville | 2.9% | 0.18%(+2.71)#33 | 0.44%(+2.45)#2,559 |
| 34. | Chalmers | 2.9% | 0.18%(+2.69)#34 | 0.44%(+2.43)#2,568 |
| 35. | Cynthiana | 2.8% | 0.18%(+2.61)#35 | 0.44%(+2.35)#2,616 |
| 36. | Bruceville | 2.7% | 0.18%(+2.47)#36 | 0.44%(+2.21)#2,734 |
| 37. | Oolitic | 2.5% | 0.18%(+2.35)#37 | 0.44%(+2.09)#2,835 |
| 38. | Hymera | 2.3% | 0.18%(+2.14)#38 | 0.44%(+1.89)#2,989 |
| 39. | Francesville | 2.3% | 0.18%(+2.13)#39 | 0.44%(+1.87)#3,009 |
| 40. | Cannelton | 2.2% | 0.18%(+2.06)#40 | 0.44%(+1.80)#3,053 |
| 41. | Stilesville | 2.2% | 0.18%(+2.02)#41 | 0.44%(+1.77)#3,083 |
| 42. | Mount Auburn | 2.1% | 0.18%(+1.95)#42 | 0.44%(+1.69)#3,153 |
| 43. | Linton | 2.1% | 0.18%(+1.94)#43 | 0.44%(+1.68)#3,159 |
| 44. | Spencer | 2.0% | 0.18%(+1.83)#44 | 0.44%(+1.57)#3,252 |
| 45. | Greensboro | 1.9% | 0.18%(+1.74)#45 | 0.44%(+1.48)#3,337 |
| 46. | Albion | 1.9% | 0.18%(+1.70)#46 | 0.44%(+1.44)#3,385 |
| 47. | La Fontaine | 1.9% | 0.18%(+1.68)#47 | 0.44%(+1.42)#3,399 |
| 48. | Lynnville | 1.8% | 0.18%(+1.67)#48 | 0.44%(+1.41)#3,415 |
| 49. | St Paul | 1.8% | 0.18%(+1.65)#49 | 0.44%(+1.40)#3,423 |
| 50. | Cannelburg | 1.8% | 0.18%(+1.64)#50 | 0.44%(+1.38)#3,444 |
| 51. | Cromwell | 1.8% | 0.18%(+1.61)#51 | 0.44%(+1.35)#3,475 |
| 52. | Lyons | 1.8% | 0.18%(+1.59)#52 | 0.44%(+1.34)#3,486 |
| 53. | Loogootee | 1.7% | 0.18%(+1.52)#53 | 0.44%(+1.26)#3,556 |
| 54. | West Lebanon | 1.7% | 0.18%(+1.47)#54 | 0.44%(+1.22)#3,617 |
| 55. | Paragon | 1.7% | 0.18%(+1.47)#55 | 0.44%(+1.21)#3,626 |
| 56. | Millhousen | 1.6% | 0.18%(+1.43)#56 | 0.44%(+1.17)#3,684 |
| 57. | Bicknell | 1.6% | 0.18%(+1.42)#57 | 0.44%(+1.16)#3,700 |
| 58. | Sandborn | 1.6% | 0.18%(+1.40)#58 | 0.44%(+1.14)#3,719 |
| 59. | La Paz | 1.6% | 0.18%(+1.39)#59 | 0.44%(+1.13)#3,729 |
| 60. | Worthington | 1.5% | 0.18%(+1.29)#60 | 0.44%(+1.03)#3,866 |
| 61. | Leesburg | 1.5% | 0.18%(+1.27)#61 | 0.44%(+1.01)#3,880 |
| 62. | Marengo | 1.4% | 0.18%(+1.18)#62 | 0.44%(+0.926)#3,998 |
| 63. | Haubstadt | 1.4% | 0.18%(+1.18)#63 | 0.44%(+0.923)#4,000 |
| 64. | Fortville | 1.4% | 0.18%(+1.18)#64 | 0.44%(+0.923)#4,002 |
| 65. | Bloomingdale | 1.4% | 0.18%(+1.18)#65 | 0.44%(+0.920)#4,005 |
| 66. | Waterloo | 1.3% | 0.18%(+1.13)#66 | 0.44%(+0.869)#4,072 |
| 67. | Vincennes | 1.3% | 0.18%(+1.08)#67 | 0.44%(+0.821)#4,135 |
| 68. | Oldenburg | 1.2% | 0.18%(+1.02)#68 | 0.44%(+0.761)#4,250 |
| 69. | Enchanted Hills | 1.2% | 0.18%(+1.02)#69 | 0.44%(+0.760)#4,252 |
| 70. | Sullivan | 1.2% | 0.18%(+0.989)#70 | 0.44%(+0.731)#4,294 |
| 71. | Poneto | 1.2% | 0.18%(+0.980)#71 | 0.44%(+0.722)#4,302 |
| 72. | Corydon | 1.1% | 0.18%(+0.965)#72 | 0.44%(+0.707)#4,327 |
| 73. | Elberfeld | 1.1% | 0.18%(+0.964)#73 | 0.44%(+0.706)#4,328 |
| 74. | Waveland | 1.1% | 0.18%(+0.910)#74 | 0.44%(+0.653)#4,417 |
| 75. | Pottawattamie Park | 1.1% | 0.18%(+0.898)#75 | 0.44%(+0.641)#4,428 |
| 76. | Brook | 1.1% | 0.18%(+0.883)#76 | 0.44%(+0.626)#4,447 |
| 77. | Westport | 1.0% | 0.18%(+0.848)#77 | 0.44%(+0.591)#4,504 |
| 78. | Harlan | 1.0% | 0.18%(+0.827)#78 | 0.44%(+0.570)#4,547 |
| 79. | Berne | 0.97% | 0.18%(+0.789)#79 | 0.44%(+0.531)#4,620 |
| 80. | Burlington | 0.96% | 0.18%(+0.773)#80 | 0.44%(+0.515)#4,659 |
| 81. | Union City | 0.85% | 0.18%(+0.667)#81 | 0.44%(+0.410)#4,835 |
| 82. | Elnora | 0.81% | 0.18%(+0.627)#82 | 0.44%(+0.369)#4,917 |
| 83. | Wolcott | 0.77% | 0.18%(+0.585)#83 | 0.44%(+0.327)#5,009 |
| 84. | Walton | 0.76% | 0.18%(+0.575)#84 | 0.44%(+0.317)#5,034 |
| 85. | Swayzee | 0.75% | 0.18%(+0.564)#85 | 0.44%(+0.306)#5,055 |
| 86. | Carthage | 0.74% | 0.18%(+0.558)#86 | 0.44%(+0.300)#5,071 |
| 87. | Denver | 0.71% | 0.18%(+0.529)#87 | 0.44%(+0.271)#5,161 |
| 88. | Ridgeville | 0.71% | 0.18%(+0.529)#88 | 0.44%(+0.271)#5,162 |
| 89. | Santa Claus | 0.71% | 0.18%(+0.524)#89 | 0.44%(+0.266)#5,181 |
| 90. | Washington | 0.70% | 0.18%(+0.522)#90 | 0.44%(+0.265)#5,190 |
| 91. | Fairland | 0.70% | 0.18%(+0.519)#91 | 0.44%(+0.261)#5,198 |
| 92. | Mooresville | 0.70% | 0.18%(+0.519)#92 | 0.44%(+0.261)#5,199 |
| 93. | Kentland | 0.69% | 0.18%(+0.510)#93 | 0.44%(+0.252)#5,222 |
| 94. | Holton | 0.69% | 0.18%(+0.509)#94 | 0.44%(+0.252)#5,225 |
| 95. | Dublin | 0.69% | 0.18%(+0.509)#95 | 0.44%(+0.251)#5,229 |
| 96. | Clay City | 0.68% | 0.18%(+0.498)#96 | 0.44%(+0.240)#5,254 |
| 97. | Greensburg | 0.65% | 0.18%(+0.472)#97 | 0.44%(+0.214)#5,310 |
| 98. | Melody Hill | 0.63% | 0.18%(+0.451)#98 | 0.44%(+0.194)#5,375 |
| 99. | Milford | 0.62% | 0.18%(+0.438)#99 | 0.44%(+0.180)#5,418 |
| 100. | Ferdinand | 0.62% | 0.18%(+0.433)#100 | 0.44%(+0.175)#5,436 |
Common Questions
What are the Top 10 Cities with the Highest Percentage of Population Employed in Mining, Quarrying, & Extraction in Indiana?
Top 10 Cities with the Highest Percentage of Population Employed in Mining, Quarrying, & Extraction in Indiana are:
#1
16.7%
#2
12.0%
#3
11.5%
#4
7.2%
#5
6.6%
#6
5.8%
#7
5.7%
#8
5.3%
#9
5.1%
#10
4.8%
What city has the Highest Percentage of Population Employed in Mining, Quarrying, & Extraction in Indiana?
Alton has the Highest Percentage of Population Employed in Mining, Quarrying, & Extraction in Indiana with 16.7%.
What is the Percentage of Population Employed in Mining, Quarrying, & Extraction in the State of Indiana?
Percentage of Population Employed in Mining, Quarrying, & Extraction in Indiana is 0.18%.
What is the Percentage of Population Employed in Mining, Quarrying, & Extraction in the United States?
Percentage of Population Employed in Mining, Quarrying, & Extraction in the United States is 0.44%.