Zip Codes with the Highest Percentage of Population Employed in Food Preparation & Serving in Hammond, IN
RELATED REPORTS & OPTIONS
Food Preparation & Serving
Hammond
Compare Zip Codes
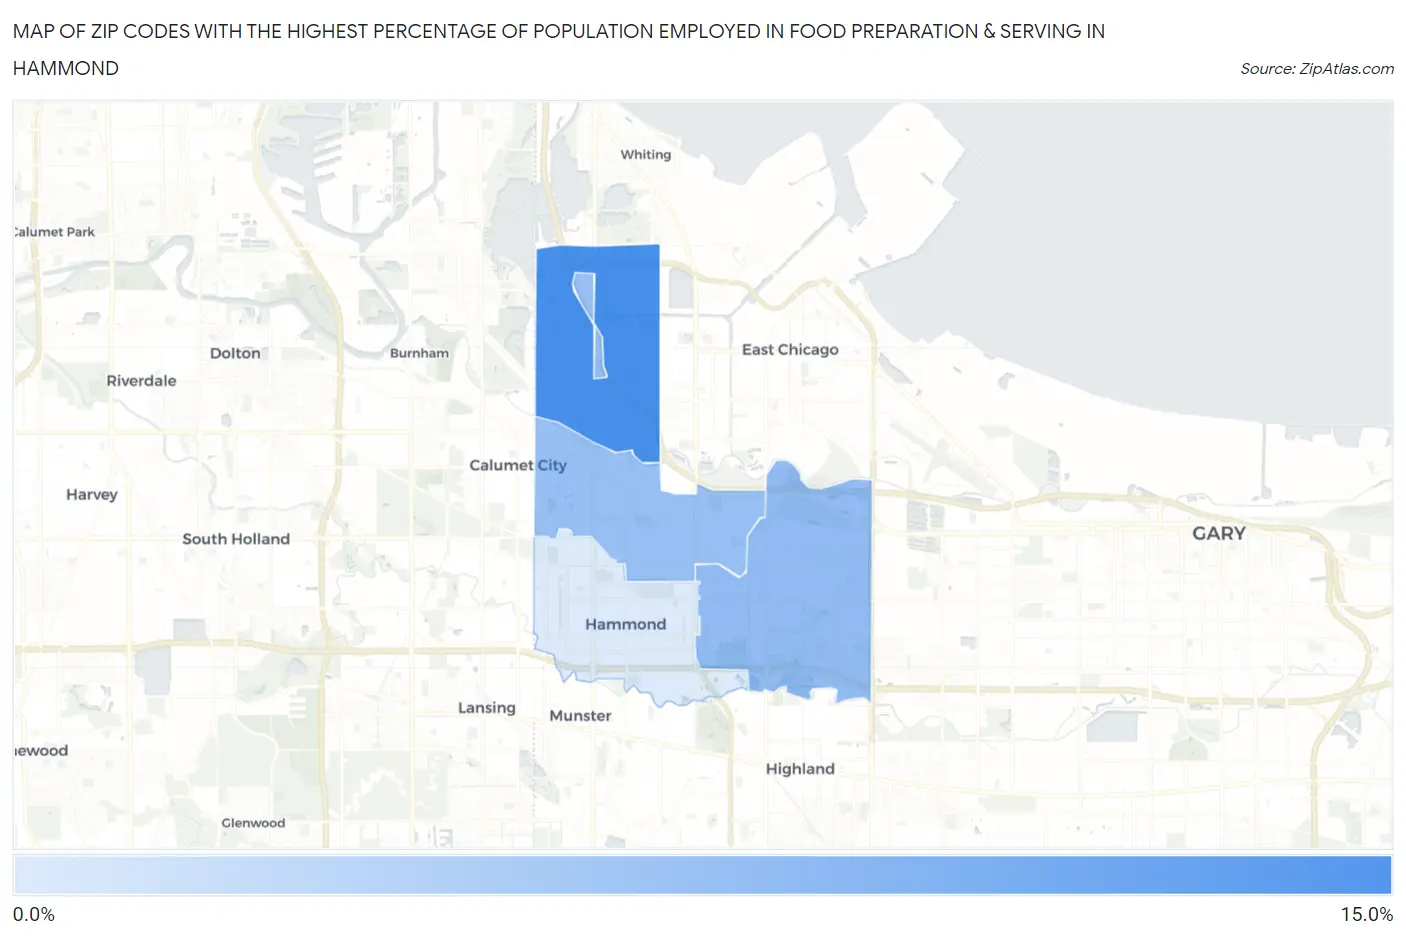
Map of Zip Codes with the Highest Percentage of Population Employed in Food Preparation & Serving in Hammond
4.9%
11.8%
Zip Codes with the Highest Percentage of Population Employed in Food Preparation & Serving in Hammond, IN
| Zip Code | % Employed | vs State | vs National | |
| 1. | 46327 | 11.8% | 5.3%(+6.53)#29 | 5.3%(+6.56)#1,719 |
| 2. | 46323 | 8.4% | 5.3%(+3.08)#94 | 5.3%(+3.10)#4,187 |
| 3. | 46320 | 8.0% | 5.3%(+2.69)#107 | 5.3%(+2.72)#4,715 |
| 4. | 46324 | 4.9% | 5.3%(-0.410)#336 | 5.3%(-0.382)#13,328 |
1
Common Questions
What are the Top 3 Zip Codes with the Highest Percentage of Population Employed in Food Preparation & Serving in Hammond, IN?
Top 3 Zip Codes with the Highest Percentage of Population Employed in Food Preparation & Serving in Hammond, IN are:
What zip code has the Highest Percentage of Population Employed in Food Preparation & Serving in Hammond, IN?
46327 has the Highest Percentage of Population Employed in Food Preparation & Serving in Hammond, IN with 11.8%.
What is the Percentage of Population Employed in Food Preparation & Serving in Hammond, IN?
Percentage of Population Employed in Food Preparation & Serving in Hammond is 7.2%.
What is the Percentage of Population Employed in Food Preparation & Serving in Indiana?
Percentage of Population Employed in Food Preparation & Serving in Indiana is 5.3%.
What is the Percentage of Population Employed in Food Preparation & Serving in the United States?
Percentage of Population Employed in Food Preparation & Serving in the United States is 5.3%.