Zip Codes with the Highest Percentage of Population Employed in Food Preparation & Serving in Anderson, IN
RELATED REPORTS & OPTIONS
Food Preparation & Serving
Anderson
Compare Zip Codes
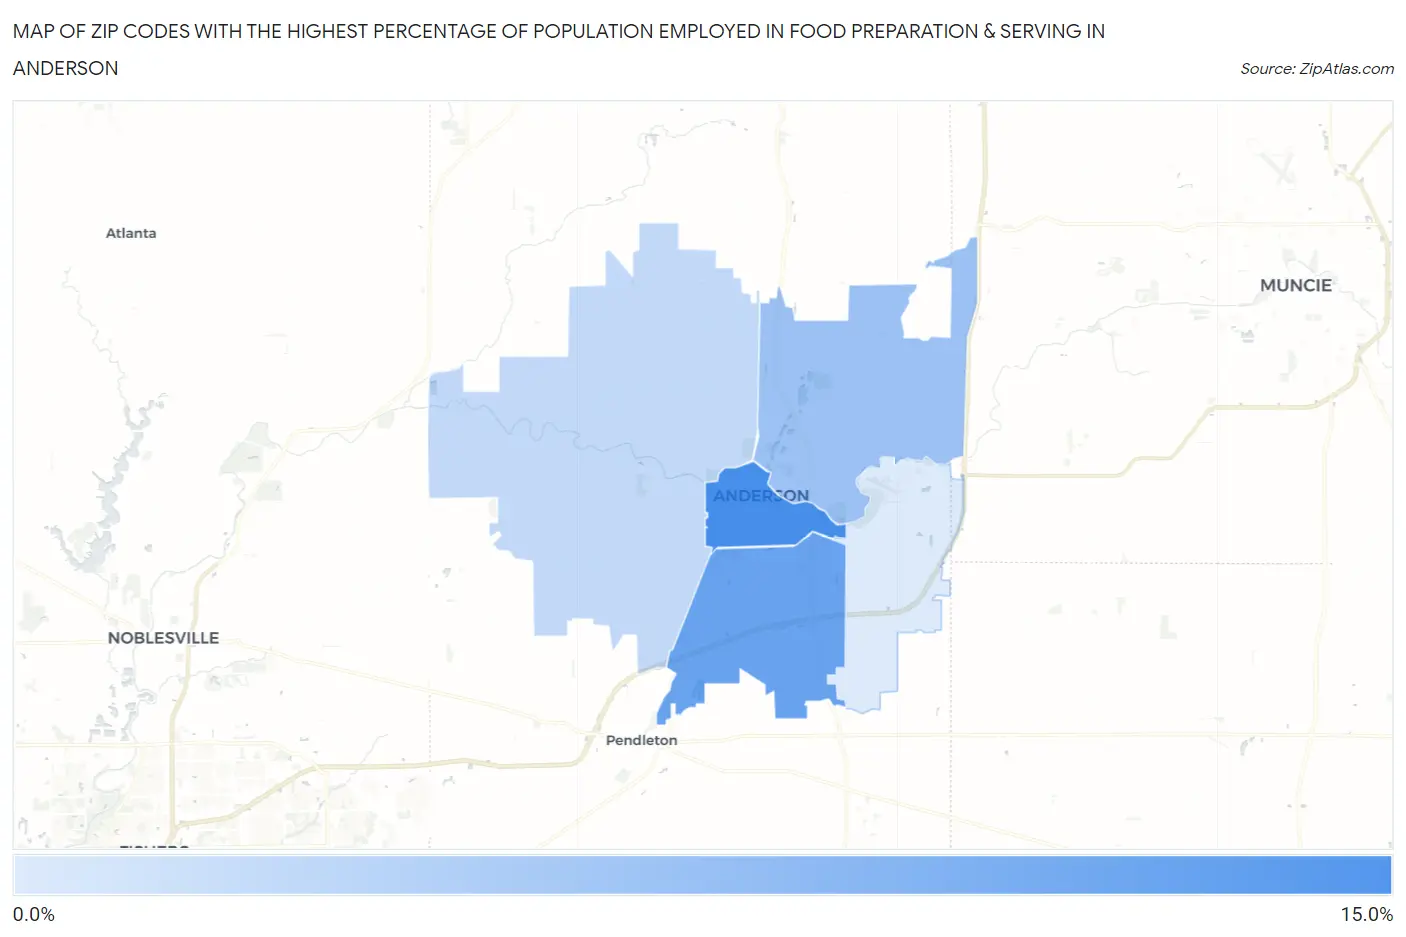
Map of Zip Codes with the Highest Percentage of Population Employed in Food Preparation & Serving in Anderson
1.8%
12.1%
Zip Codes with the Highest Percentage of Population Employed in Food Preparation & Serving in Anderson, IN
| Zip Code | % Employed | vs State | vs National | |
| 1. | 46016 | 12.1% | 5.3%(+6.76)#27 | 5.3%(+6.79)#1,638 |
| 2. | 46013 | 9.8% | 5.3%(+4.45)#61 | 5.3%(+4.48)#2,828 |
| 3. | 46012 | 6.1% | 5.3%(+0.755)#225 | 5.3%(+0.783)#9,116 |
| 4. | 46011 | 3.7% | 5.3%(-1.64)#467 | 5.3%(-1.62)#18,487 |
| 5. | 46017 | 1.8% | 5.3%(-3.50)#633 | 5.3%(-3.47)#25,241 |
1
Common Questions
What are the Top 3 Zip Codes with the Highest Percentage of Population Employed in Food Preparation & Serving in Anderson, IN?
Top 3 Zip Codes with the Highest Percentage of Population Employed in Food Preparation & Serving in Anderson, IN are:
What zip code has the Highest Percentage of Population Employed in Food Preparation & Serving in Anderson, IN?
46016 has the Highest Percentage of Population Employed in Food Preparation & Serving in Anderson, IN with 12.1%.
What is the Percentage of Population Employed in Food Preparation & Serving in Anderson, IN?
Percentage of Population Employed in Food Preparation & Serving in Anderson is 9.0%.
What is the Percentage of Population Employed in Food Preparation & Serving in Indiana?
Percentage of Population Employed in Food Preparation & Serving in Indiana is 5.3%.
What is the Percentage of Population Employed in Food Preparation & Serving in the United States?
Percentage of Population Employed in Food Preparation & Serving in the United States is 5.3%.