Zip Codes with the Highest Percentage of Population Employed in Food Preparation & Serving in Terre Haute, IN
RELATED REPORTS & OPTIONS
Food Preparation & Serving
Terre Haute
Compare Zip Codes
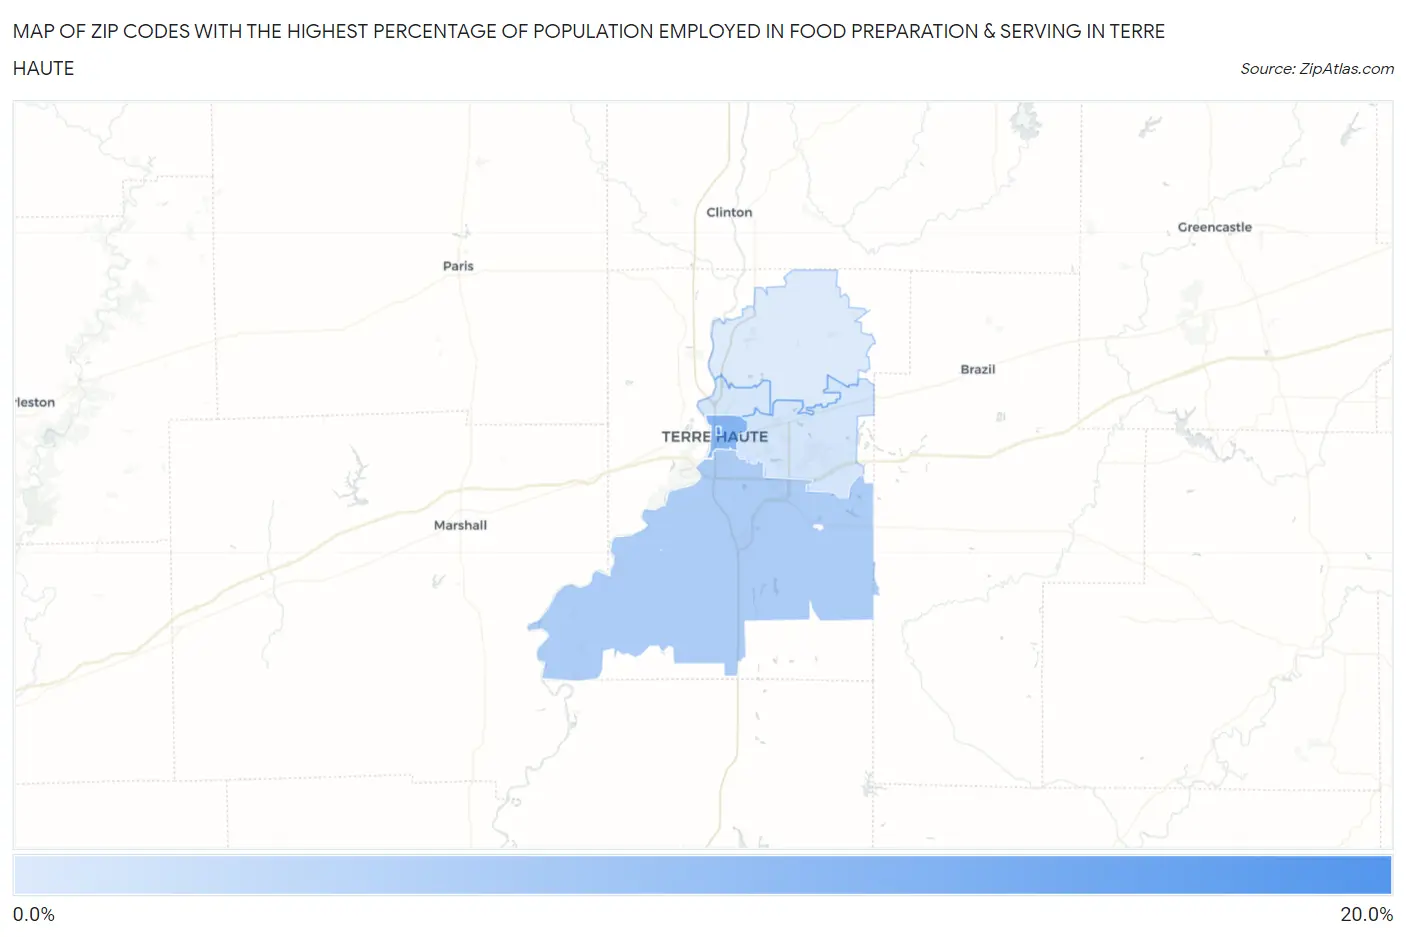
Map of Zip Codes with the Highest Percentage of Population Employed in Food Preparation & Serving in Terre Haute
3.5%
16.8%
Zip Codes with the Highest Percentage of Population Employed in Food Preparation & Serving in Terre Haute, IN
| Zip Code | % Employed | vs State | vs National | |
| 1. | 47809 | 16.8% | 5.3%(+11.5)#13 | 5.3%(+11.5)#761 |
| 2. | 47807 | 11.2% | 5.3%(+5.88)#39 | 5.3%(+5.91)#1,962 |
| 3. | 47802 | 7.7% | 5.3%(+2.37)#119 | 5.3%(+2.39)#5,243 |
| 4. | 47803 | 4.2% | 5.3%(-1.09)#409 | 5.3%(-1.06)#16,195 |
| 5. | 47804 | 4.1% | 5.3%(-1.17)#412 | 5.3%(-1.14)#16,524 |
| 6. | 47805 | 3.5% | 5.3%(-1.79)#486 | 5.3%(-1.76)#19,108 |
1
Common Questions
What are the Top 5 Zip Codes with the Highest Percentage of Population Employed in Food Preparation & Serving in Terre Haute, IN?
Top 5 Zip Codes with the Highest Percentage of Population Employed in Food Preparation & Serving in Terre Haute, IN are:
What zip code has the Highest Percentage of Population Employed in Food Preparation & Serving in Terre Haute, IN?
47809 has the Highest Percentage of Population Employed in Food Preparation & Serving in Terre Haute, IN with 16.8%.
What is the Percentage of Population Employed in Food Preparation & Serving in Terre Haute, IN?
Percentage of Population Employed in Food Preparation & Serving in Terre Haute is 7.5%.
What is the Percentage of Population Employed in Food Preparation & Serving in Indiana?
Percentage of Population Employed in Food Preparation & Serving in Indiana is 5.3%.
What is the Percentage of Population Employed in Food Preparation & Serving in the United States?
Percentage of Population Employed in Food Preparation & Serving in the United States is 5.3%.