Fowler, IN Map & Demographics
Fowler Map
Fowler Overview
$27,488
PER CAPITA INCOME
$62,530
AVG FAMILY INCOME
$49,495
AVG HOUSEHOLD INCOME
17.5%
WAGE / INCOME GAP [ % ]
82.5¢/ $1
WAGE / INCOME GAP [ $ ]
$11,934
FAMILY INCOME DEFICIT
0.42
INEQUALITY / GINI INDEX
2,207
TOTAL POPULATION
1,032
MALE POPULATION
1,175
FEMALE POPULATION
87.83
MALES / 100 FEMALES
113.86
FEMALES / 100 MALES
41.5
MEDIAN AGE
3.2
AVG FAMILY SIZE
2.3
AVG HOUSEHOLD SIZE
1,074
LABOR FORCE [ PEOPLE ]
60.8%
PERCENT IN LABOR FORCE
2.4%
UNEMPLOYMENT RATE
Fowler Zip Codes
Fowler Area Codes
Income in Fowler
Income Overview in Fowler
Per Capita Income in Fowler is $27,488, while median incomes of families and households are $62,530 and $49,495 respectively.
| Characteristic | Number | Measure |
| Per Capita Income | 2,207 | $27,488 |
| Median Family Income | 535 | $62,530 |
| Mean Family Income | 535 | $84,997 |
| Median Household Income | 935 | $49,495 |
| Mean Household Income | 935 | $66,035 |
| Income Deficit | 535 | $11,934 |
| Wage / Income Gap (%) | 2,207 | 17.47% |
| Wage / Income Gap ($) | 2,207 | 82.53¢ per $1 |
| Gini / Inequality Index | 2,207 | 0.42 |
Earnings by Sex in Fowler
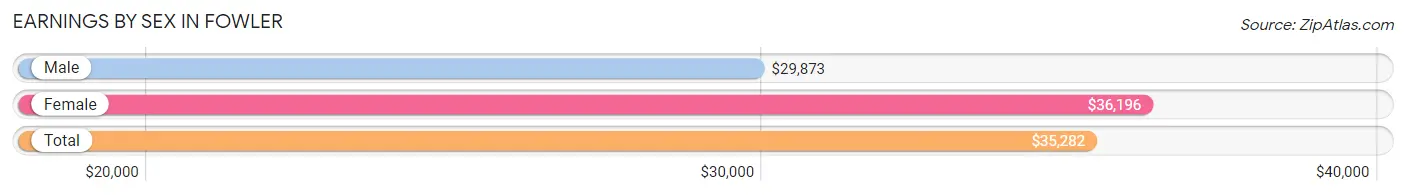
Average Earnings in Fowler are $35,282, $29,873 for men and $36,196 for women, a difference of 17.5%.
| Sex | Number | Average Earnings |
| Male | 642 (54.5%) | $29,873 |
| Female | 536 (45.5%) | $36,196 |
| Total | 1,178 (100.0%) | $35,282 |
Earnings by Sex by Income Bracket in Fowler
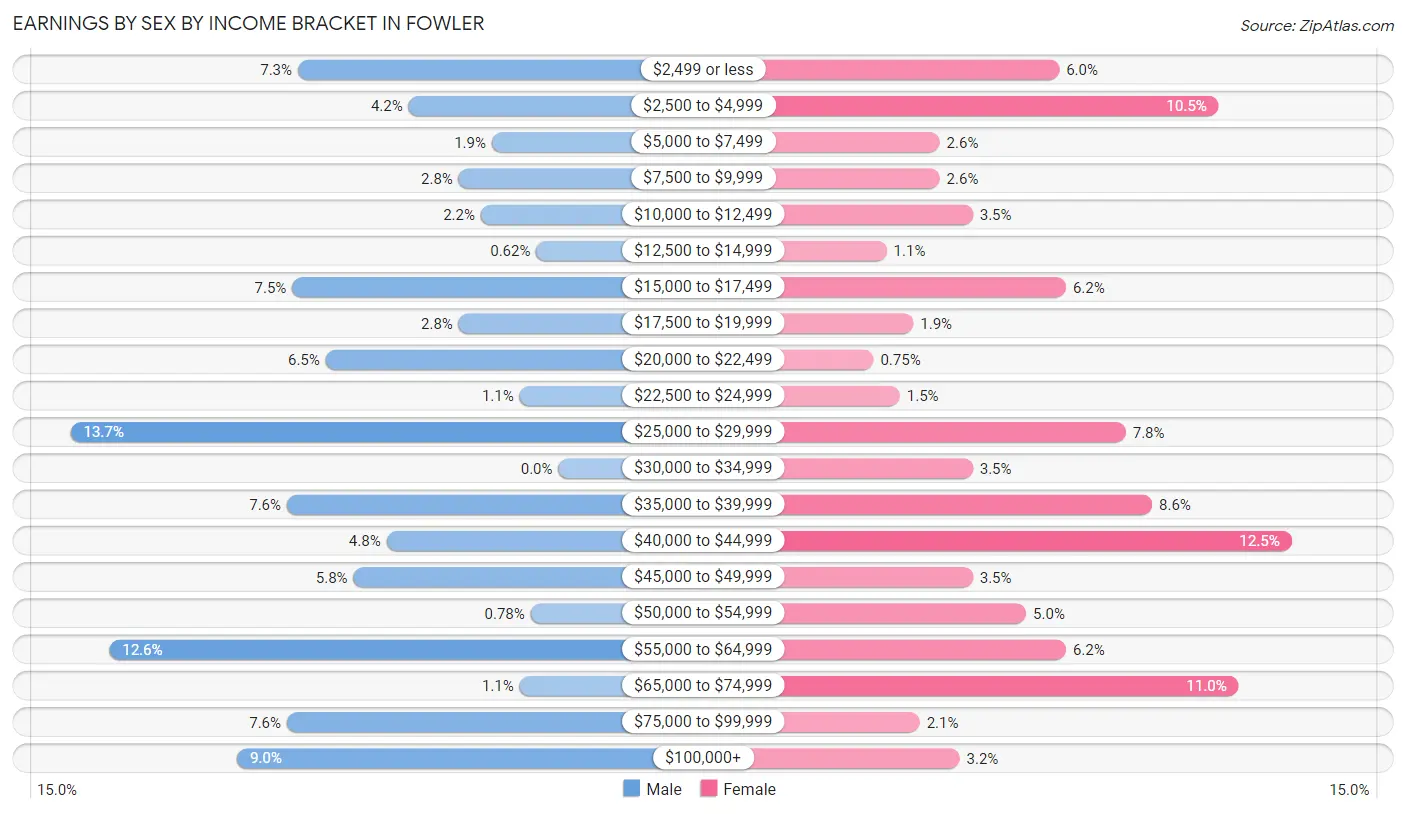
The most common earnings brackets in Fowler are $25,000 to $29,999 for men (88 | 13.7%) and $40,000 to $44,999 for women (67 | 12.5%).
| Income | Male | Female |
| $2,499 or less | 47 (7.3%) | 32 (6.0%) |
| $2,500 to $4,999 | 27 (4.2%) | 56 (10.4%) |
| $5,000 to $7,499 | 12 (1.9%) | 14 (2.6%) |
| $7,500 to $9,999 | 18 (2.8%) | 14 (2.6%) |
| $10,000 to $12,499 | 14 (2.2%) | 19 (3.5%) |
| $12,500 to $14,999 | 4 (0.6%) | 6 (1.1%) |
| $15,000 to $17,499 | 48 (7.5%) | 33 (6.2%) |
| $17,500 to $19,999 | 18 (2.8%) | 10 (1.9%) |
| $20,000 to $22,499 | 42 (6.5%) | 4 (0.7%) |
| $22,500 to $24,999 | 7 (1.1%) | 8 (1.5%) |
| $25,000 to $29,999 | 88 (13.7%) | 42 (7.8%) |
| $30,000 to $34,999 | 0 (0.0%) | 19 (3.5%) |
| $35,000 to $39,999 | 49 (7.6%) | 46 (8.6%) |
| $40,000 to $44,999 | 31 (4.8%) | 67 (12.5%) |
| $45,000 to $49,999 | 37 (5.8%) | 19 (3.5%) |
| $50,000 to $54,999 | 5 (0.8%) | 27 (5.0%) |
| $55,000 to $64,999 | 81 (12.6%) | 33 (6.2%) |
| $65,000 to $74,999 | 7 (1.1%) | 59 (11.0%) |
| $75,000 to $99,999 | 49 (7.6%) | 11 (2.1%) |
| $100,000+ | 58 (9.0%) | 17 (3.2%) |
| Total | 642 (100.0%) | 536 (100.0%) |
Earnings by Sex by Educational Attainment in Fowler
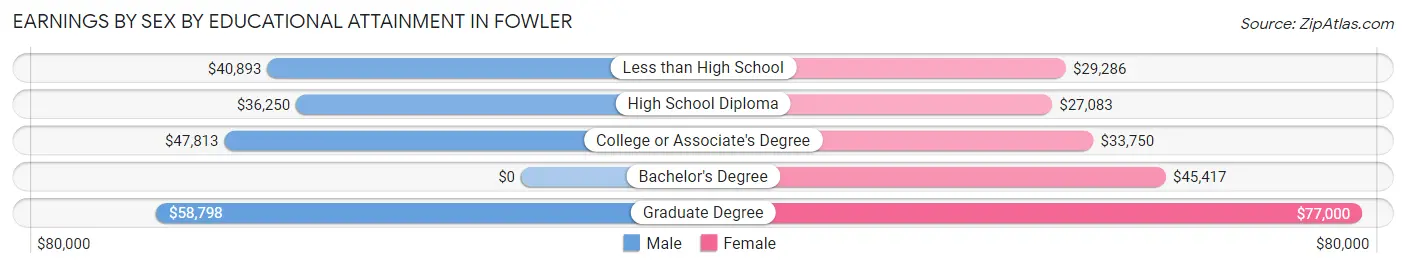
Average earnings in Fowler are $40,192 for men and $37,554 for women, a difference of 6.6%. Men with an educational attainment of graduate degree enjoy the highest average annual earnings of $58,798, while those with high school diploma education earn the least with $36,250. Women with an educational attainment of graduate degree earn the most with the average annual earnings of $77,000, while those with high school diploma education have the smallest earnings of $27,083.
| Educational Attainment | Male Income | Female Income |
| Less than High School | $40,893 | $29,286 |
| High School Diploma | $36,250 | $27,083 |
| College or Associate's Degree | $47,813 | $33,750 |
| Bachelor's Degree | - | - |
| Graduate Degree | $58,798 | $77,000 |
| Total | $40,192 | $37,554 |
Family Income in Fowler
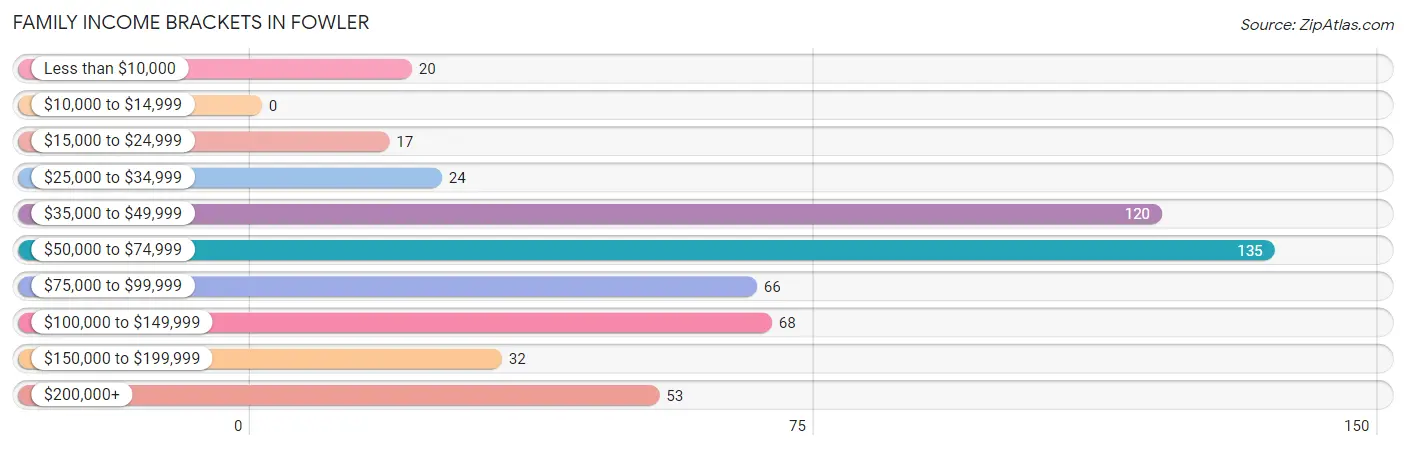
Family Income Brackets in Fowler
According to the Fowler family income data, there are 135 families falling into the $50,000 to $74,999 income range, which is the most common income bracket and makes up 25.2% of all families.
| Income Bracket | # Families | % Families |
| Less than $10,000 | 20 | 3.7% |
| $10,000 to $14,999 | 0 | 0.0% |
| $15,000 to $24,999 | 17 | 3.2% |
| $25,000 to $34,999 | 24 | 4.5% |
| $35,000 to $49,999 | 120 | 22.4% |
| $50,000 to $74,999 | 135 | 25.2% |
| $75,000 to $99,999 | 66 | 12.3% |
| $100,000 to $149,999 | 68 | 12.7% |
| $150,000 to $199,999 | 32 | 6.0% |
| $200,000+ | 53 | 9.9% |
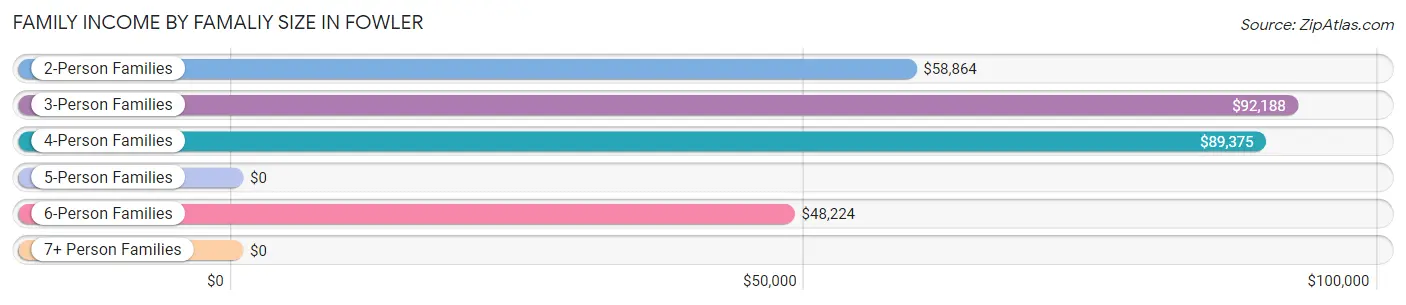
Family Income by Famaliy Size in Fowler
3-person families (65 | 12.1%) account for the highest median family income in Fowler with $92,188 per family, while 3-person families (65 | 12.1%) have the highest median income of $30,729 per family member.
| Income Bracket | # Families | Median Income |
| 2-Person Families | 268 (50.1%) | $58,864 |
| 3-Person Families | 65 (12.1%) | $92,188 |
| 4-Person Families | 87 (16.3%) | $89,375 |
| 5-Person Families | 84 (15.7%) | $0 |
| 6-Person Families | 31 (5.8%) | $48,224 |
| 7+ Person Families | 0 (0.0%) | $0 |
| Total | 535 (100.0%) | $62,530 |
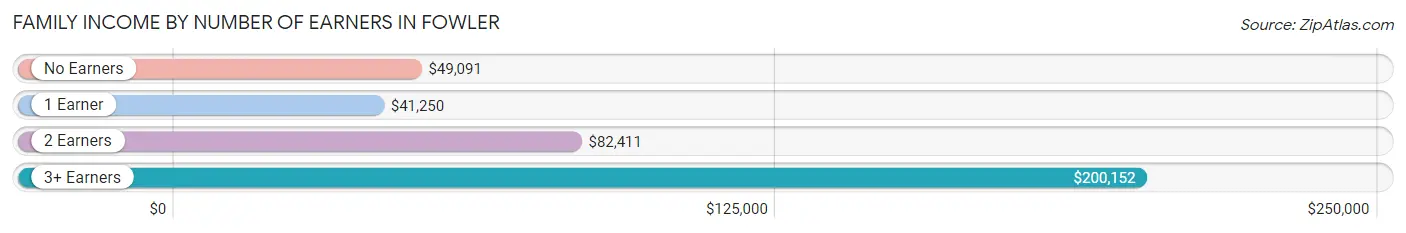
Family Income by Number of Earners in Fowler
The median family income in Fowler is $62,530, with families comprising 3+ earners (89) having the highest median family income of $200,152, while families with 1 earner (211) have the lowest median family income of $41,250, accounting for 16.6% and 39.4% of families, respectively.
| Number of Earners | # Families | Median Income |
| No Earners | 20 (3.7%) | $49,091 |
| 1 Earner | 211 (39.4%) | $41,250 |
| 2 Earners | 215 (40.2%) | $82,411 |
| 3+ Earners | 89 (16.6%) | $200,152 |
| Total | 535 (100.0%) | $62,530 |
Household Income in Fowler
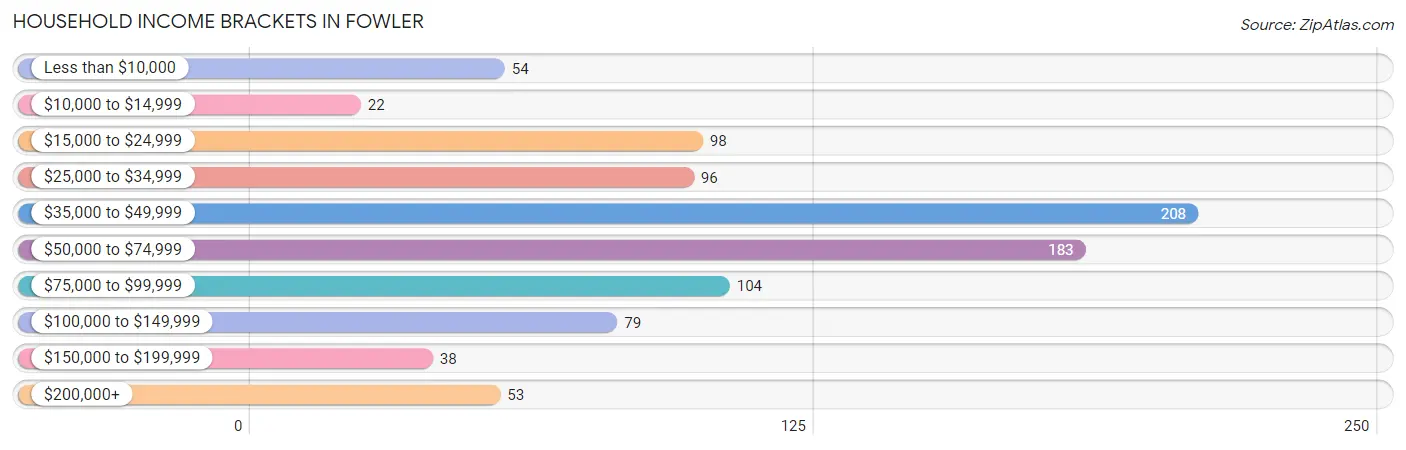
Household Income Brackets in Fowler
With 208 households falling in the category, the $35,000 to $49,999 income range is the most frequent in Fowler, accounting for 22.3% of all households. In contrast, only 22 households (2.4%) fall into the $10,000 to $14,999 income bracket, making it the least populous group.
| Income Bracket | # Households | % Households |
| Less than $10,000 | 54 | 5.8% |
| $10,000 to $14,999 | 22 | 2.4% |
| $15,000 to $24,999 | 98 | 10.5% |
| $25,000 to $34,999 | 96 | 10.3% |
| $35,000 to $49,999 | 208 | 22.2% |
| $50,000 to $74,999 | 183 | 19.6% |
| $75,000 to $99,999 | 104 | 11.1% |
| $100,000 to $149,999 | 79 | 8.4% |
| $150,000 to $199,999 | 38 | 4.1% |
| $200,000+ | 53 | 5.7% |
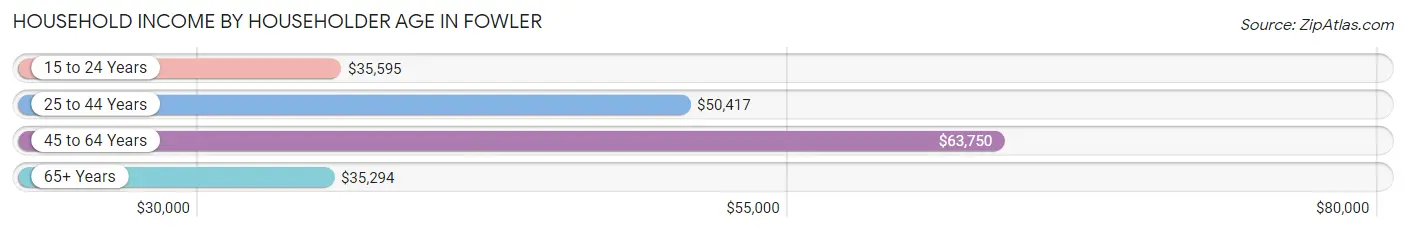
Household Income by Householder Age in Fowler
The median household income in Fowler is $49,495, with the highest median household income of $63,750 found in the 45 to 64 years age bracket for the primary householder. A total of 326 households (34.9%) fall into this category. Meanwhile, the 65+ years age bracket for the primary householder has the lowest median household income of $35,294, with 302 households (32.3%) in this group.
| Income Bracket | # Households | Median Income |
| 15 to 24 Years | 38 (4.1%) | $35,595 |
| 25 to 44 Years | 269 (28.8%) | $50,417 |
| 45 to 64 Years | 326 (34.9%) | $63,750 |
| 65+ Years | 302 (32.3%) | $35,294 |
| Total | 935 (100.0%) | $49,495 |
Poverty in Fowler
Income Below Poverty by Sex and Age in Fowler
With 7.9% poverty level for males and 12.1% for females among the residents of Fowler, under 5 year old males and under 5 year old females are the most vulnerable to poverty, with 22 males (32.4%) and 23 females (25.8%) in their respective age groups living below the poverty level.
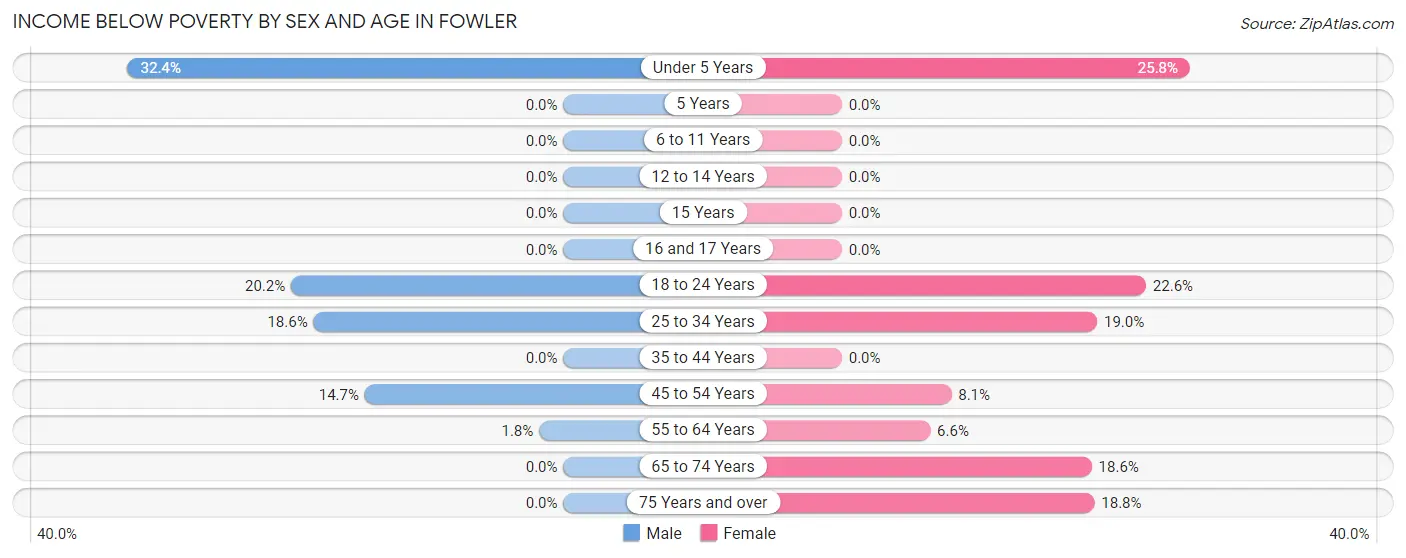
| Age Bracket | Male | Female |
| Under 5 Years | 22 (32.4%) | 23 (25.8%) |
| 5 Years | 0 (0.0%) | 0 (0.0%) |
| 6 to 11 Years | 0 (0.0%) | 0 (0.0%) |
| 12 to 14 Years | 0 (0.0%) | 0 (0.0%) |
| 15 Years | 0 (0.0%) | 0 (0.0%) |
| 16 and 17 Years | 0 (0.0%) | 0 (0.0%) |
| 18 to 24 Years | 18 (20.2%) | 14 (22.6%) |
| 25 to 34 Years | 23 (18.5%) | 29 (19.0%) |
| 35 to 44 Years | 0 (0.0%) | 0 (0.0%) |
| 45 to 54 Years | 14 (14.7%) | 10 (8.1%) |
| 55 to 64 Years | 2 (1.8%) | 12 (6.6%) |
| 65 to 74 Years | 0 (0.0%) | 23 (18.5%) |
| 75 Years and over | 0 (0.0%) | 27 (18.8%) |
| Total | 79 (7.9%) | 138 (12.1%) |
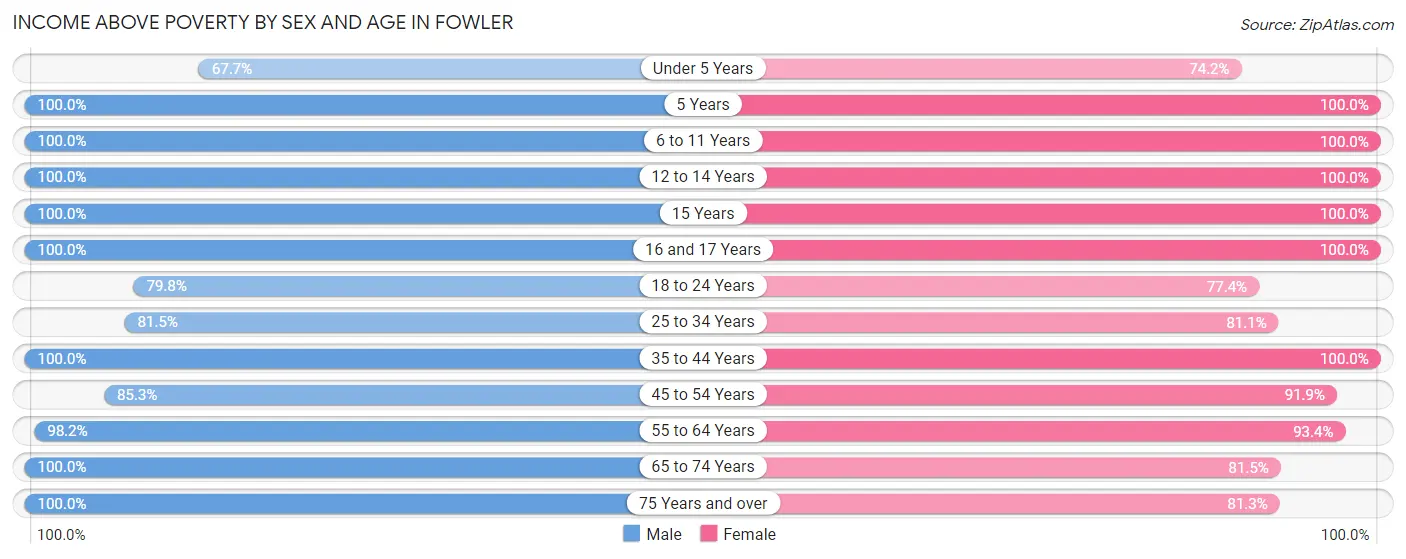
Income Above Poverty by Sex and Age in Fowler
According to the poverty statistics in Fowler, males aged 5 years and females aged 5 years are the age groups that are most secure financially, with 100.0% of males and 100.0% of females in these age groups living above the poverty line.
| Age Bracket | Male | Female |
| Under 5 Years | 46 (67.6%) | 66 (74.2%) |
| 5 Years | 8 (100.0%) | 6 (100.0%) |
| 6 to 11 Years | 50 (100.0%) | 124 (100.0%) |
| 12 to 14 Years | 58 (100.0%) | 11 (100.0%) |
| 15 Years | 18 (100.0%) | 8 (100.0%) |
| 16 and 17 Years | 42 (100.0%) | 14 (100.0%) |
| 18 to 24 Years | 71 (79.8%) | 48 (77.4%) |
| 25 to 34 Years | 101 (81.5%) | 124 (81.0%) |
| 35 to 44 Years | 171 (100.0%) | 99 (100.0%) |
| 45 to 54 Years | 81 (85.3%) | 113 (91.9%) |
| 55 to 64 Years | 109 (98.2%) | 171 (93.4%) |
| 65 to 74 Years | 122 (100.0%) | 101 (81.5%) |
| 75 Years and over | 40 (100.0%) | 117 (81.2%) |
| Total | 917 (92.1%) | 1,002 (87.9%) |
Income Below Poverty Among Married-Couple Families in Fowler
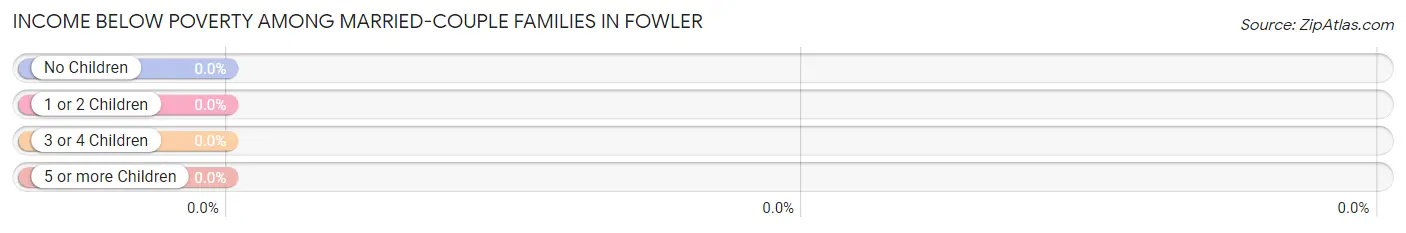
| Children | Above Poverty | Below Poverty |
| No Children | 223 (100.0%) | 0 (0.0%) |
| 1 or 2 Children | 115 (100.0%) | 0 (0.0%) |
| 3 or 4 Children | 54 (100.0%) | 0 (0.0%) |
| 5 or more Children | 0 (0.0%) | 0 (0.0%) |
| Total | 392 (100.0%) | 0 (0.0%) |
Income Below Poverty Among Single-Parent Households in Fowler
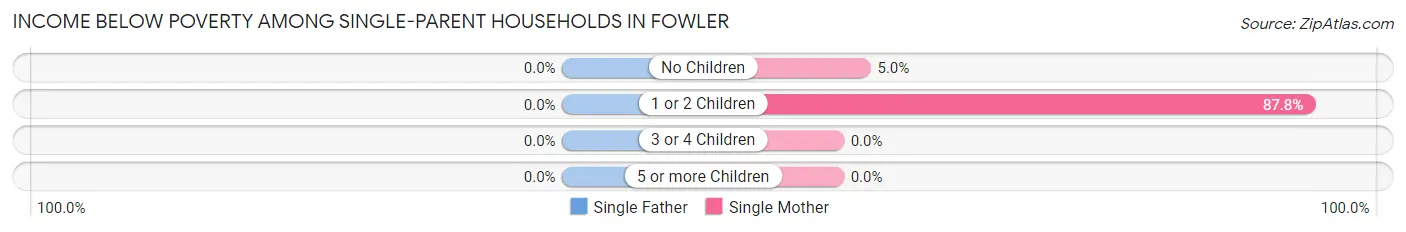
| Children | Single Father | Single Mother |
| No Children | 0 (0.0%) | 2 (5.0%) |
| 1 or 2 Children | 0 (0.0%) | 36 (87.8%) |
| 3 or 4 Children | 0 (0.0%) | 0 (0.0%) |
| 5 or more Children | 0 (0.0%) | 0 (0.0%) |
| Total | 0 (0.0%) | 38 (38.0%) |
Income Below Poverty Among Married-Couple vs Single-Parent Households in Fowler
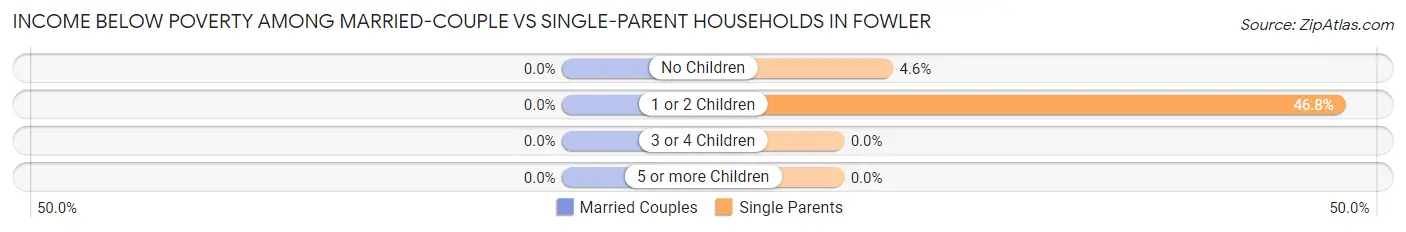
| Children | Married-Couple Families | Single-Parent Households |
| No Children | 0 (0.0%) | 2 (4.5%) |
| 1 or 2 Children | 0 (0.0%) | 36 (46.8%) |
| 3 or 4 Children | 0 (0.0%) | 0 (0.0%) |
| 5 or more Children | 0 (0.0%) | 0 (0.0%) |
| Total | 0 (0.0%) | 38 (26.6%) |
Race in Fowler
The most populous races in Fowler are White / Caucasian (2,140 | 97.0%), Hispanic or Latino (50 | 2.3%), and Two or more Races (48 | 2.2%).
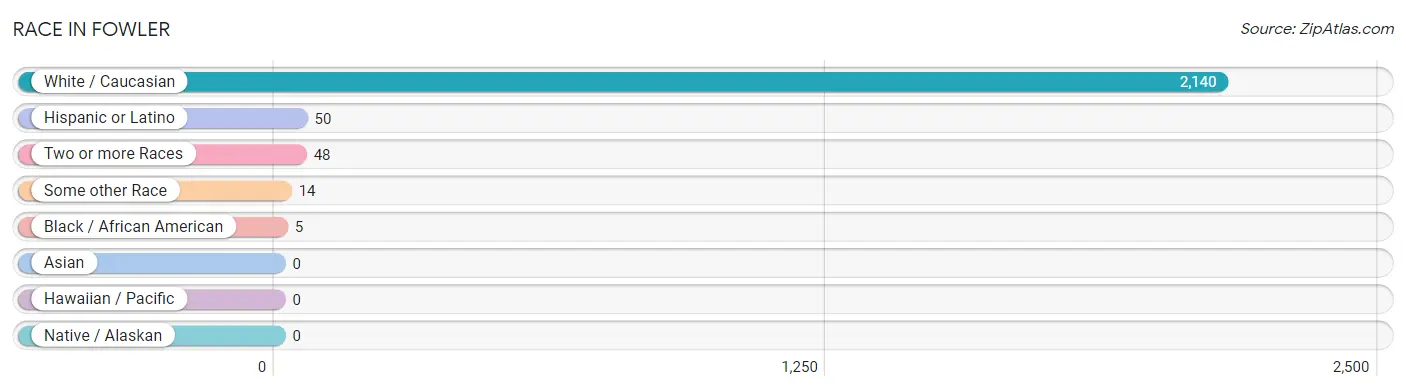
| Race | # Population | % Population |
| Asian | 0 | 0.0% |
| Black / African American | 5 | 0.2% |
| Hawaiian / Pacific | 0 | 0.0% |
| Hispanic or Latino | 50 | 2.3% |
| Native / Alaskan | 0 | 0.0% |
| White / Caucasian | 2,140 | 97.0% |
| Two or more Races | 48 | 2.2% |
| Some other Race | 14 | 0.6% |
| Total | 2,207 | 100.0% |
Ancestry in Fowler
The most populous ancestries reported in Fowler are German (576 | 26.1%), Irish (367 | 16.6%), English (119 | 5.4%), American (93 | 4.2%), and Italian (53 | 2.4%), together accounting for 54.7% of all Fowler residents.
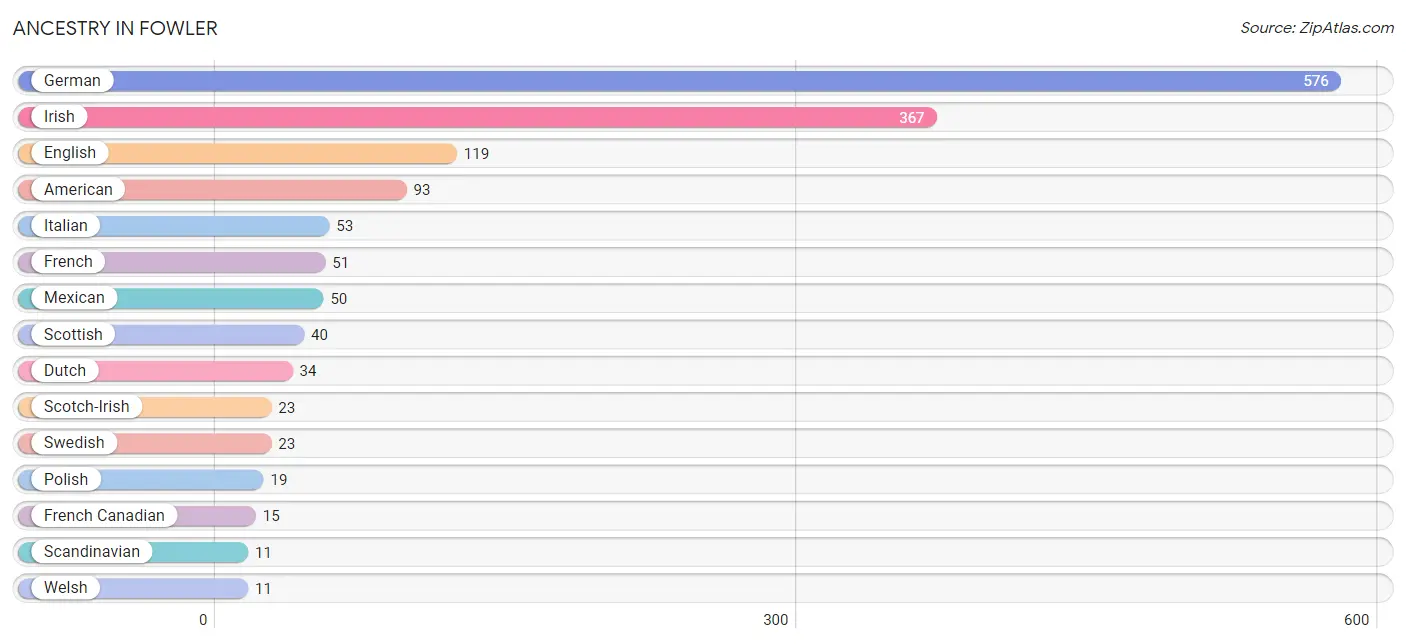
| Ancestry | # Population | % Population |
| American | 93 | 4.2% |
| British | 10 | 0.4% |
| Canadian | 3 | 0.1% |
| Choctaw | 3 | 0.1% |
| Croatian | 2 | 0.1% |
| Czech | 7 | 0.3% |
| Czechoslovakian | 4 | 0.2% |
| Dutch | 34 | 1.5% |
| Eastern European | 10 | 0.4% |
| English | 119 | 5.4% |
| European | 9 | 0.4% |
| French | 51 | 2.3% |
| French Canadian | 15 | 0.7% |
| German | 576 | 26.1% |
| Hungarian | 4 | 0.2% |
| Irish | 367 | 16.6% |
| Italian | 53 | 2.4% |
| Mexican | 50 | 2.3% |
| Norwegian | 4 | 0.2% |
| Polish | 19 | 0.9% |
| Scandinavian | 11 | 0.5% |
| Scotch-Irish | 23 | 1.0% |
| Scottish | 40 | 1.8% |
| Sioux | 3 | 0.1% |
| Swedish | 23 | 1.0% |
| Swiss | 1 | 0.1% |
| Welsh | 11 | 0.5% | View All 27 Rows |
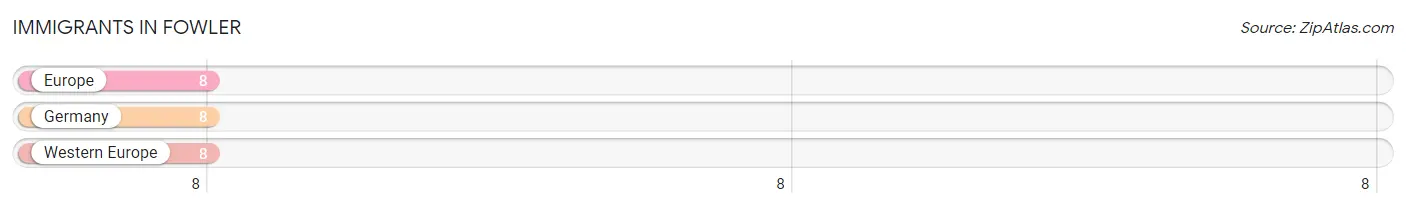
Immigrants in Fowler
The most numerous immigrant groups reported in Fowler came from Europe (8 | 0.4%), Germany (8 | 0.4%), and Western Europe (8 | 0.4%), together accounting for 1.1% of all Fowler residents.
| Immigration Origin | # Population | % Population |
| Europe | 8 | 0.4% |
| Germany | 8 | 0.4% |
| Western Europe | 8 | 0.4% | View All 3 Rows |
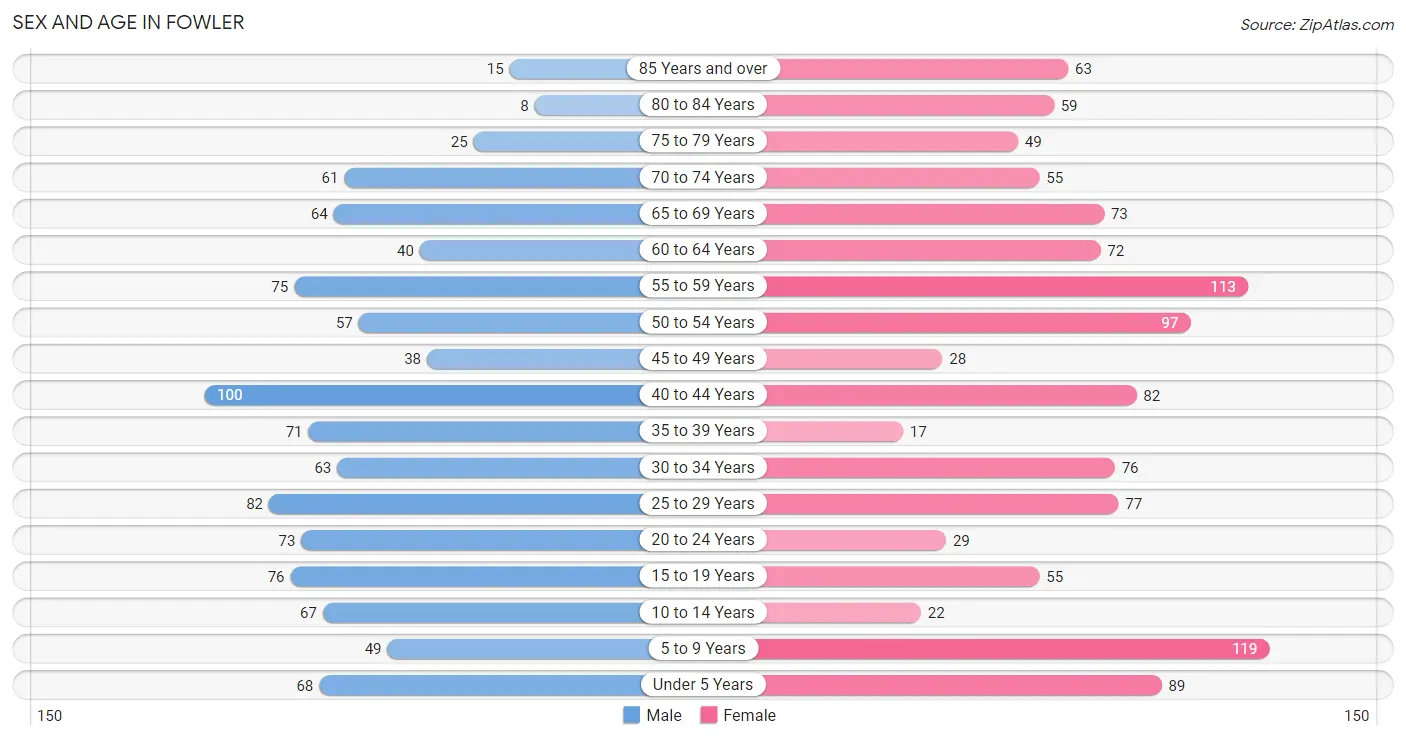
Sex and Age in Fowler
Sex and Age in Fowler
The most populous age groups in Fowler are 40 to 44 Years (100 | 9.7%) for men and 5 to 9 Years (119 | 10.1%) for women.
| Age Bracket | Male | Female |
| Under 5 Years | 68 (6.6%) | 89 (7.6%) |
| 5 to 9 Years | 49 (4.8%) | 119 (10.1%) |
| 10 to 14 Years | 67 (6.5%) | 22 (1.9%) |
| 15 to 19 Years | 76 (7.4%) | 55 (4.7%) |
| 20 to 24 Years | 73 (7.1%) | 29 (2.5%) |
| 25 to 29 Years | 82 (8.0%) | 77 (6.6%) |
| 30 to 34 Years | 63 (6.1%) | 76 (6.5%) |
| 35 to 39 Years | 71 (6.9%) | 17 (1.5%) |
| 40 to 44 Years | 100 (9.7%) | 82 (7.0%) |
| 45 to 49 Years | 38 (3.7%) | 28 (2.4%) |
| 50 to 54 Years | 57 (5.5%) | 97 (8.3%) |
| 55 to 59 Years | 75 (7.3%) | 113 (9.6%) |
| 60 to 64 Years | 40 (3.9%) | 72 (6.1%) |
| 65 to 69 Years | 64 (6.2%) | 73 (6.2%) |
| 70 to 74 Years | 61 (5.9%) | 55 (4.7%) |
| 75 to 79 Years | 25 (2.4%) | 49 (4.2%) |
| 80 to 84 Years | 8 (0.8%) | 59 (5.0%) |
| 85 Years and over | 15 (1.5%) | 63 (5.4%) |
| Total | 1,032 (100.0%) | 1,175 (100.0%) |
Families and Households in Fowler
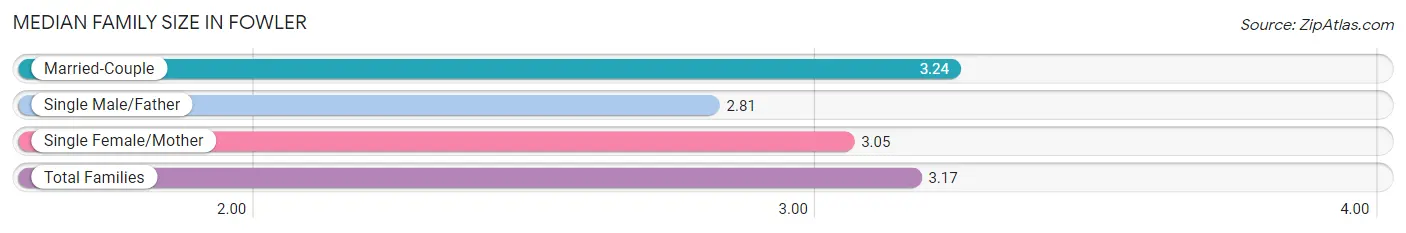
Median Family Size in Fowler
The median family size in Fowler is 3.17 persons per family, with married-couple families (392 | 73.3%) accounting for the largest median family size of 3.24 persons per family. On the other hand, single male/father families (43 | 8.0%) represent the smallest median family size with 2.81 persons per family.
| Family Type | # Families | Family Size |
| Married-Couple | 392 (73.3%) | 3.24 |
| Single Male/Father | 43 (8.0%) | 2.81 |
| Single Female/Mother | 100 (18.7%) | 3.05 |
| Total Families | 535 (100.0%) | 3.17 |
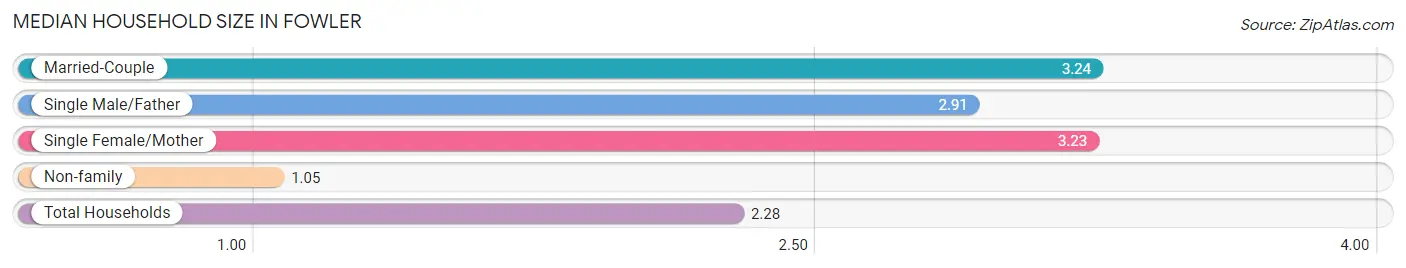
Median Household Size in Fowler
The median household size in Fowler is 2.28 persons per household, with married-couple households (392 | 41.9%) accounting for the largest median household size of 3.24 persons per household. non-family households (400 | 42.8%) represent the smallest median household size with 1.05 persons per household.
| Household Type | # Households | Household Size |
| Married-Couple | 392 (41.9%) | 3.24 |
| Single Male/Father | 43 (4.6%) | 2.91 |
| Single Female/Mother | 100 (10.7%) | 3.23 |
| Non-family | 400 (42.8%) | 1.05 |
| Total Households | 935 (100.0%) | 2.28 |
Household Size by Marriage Status in Fowler
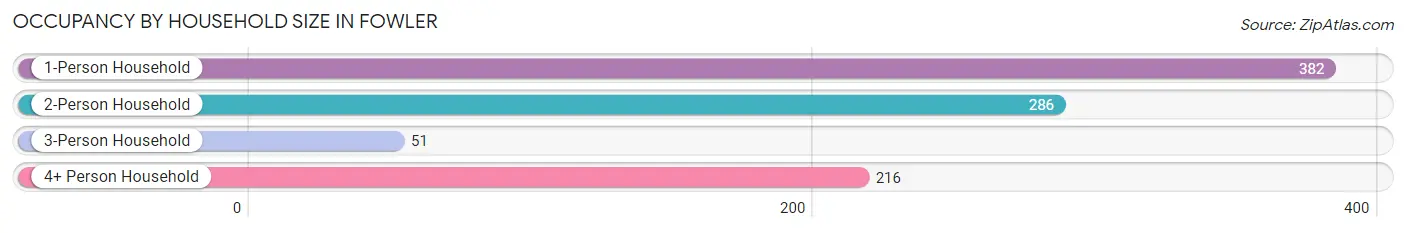
Out of a total of 935 households in Fowler, 535 (57.2%) are family households, while 400 (42.8%) are nonfamily households. The most numerous type of family households are 2-person households, comprising 268, and the most common type of nonfamily households are 1-person households, comprising 382.
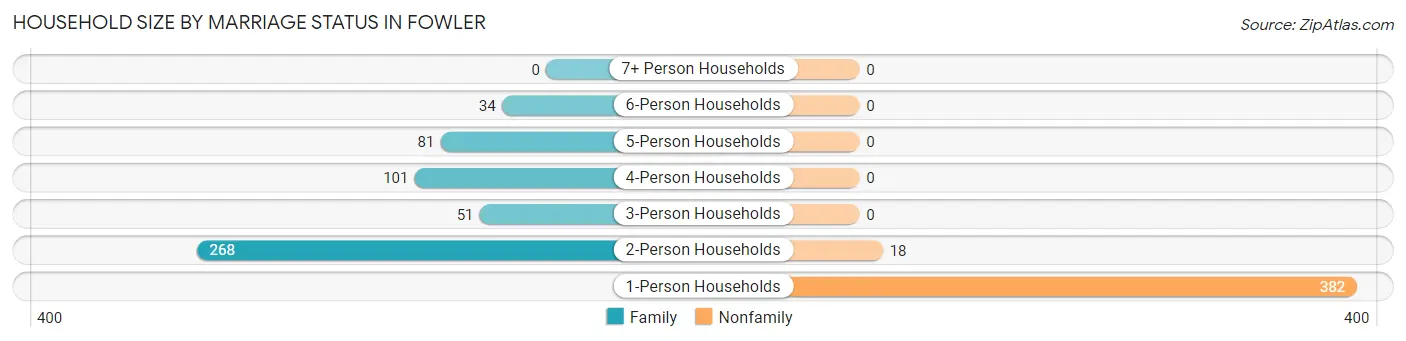
| Household Size | Family Households | Nonfamily Households |
| 1-Person Households | - | 382 (40.9%) |
| 2-Person Households | 268 (28.7%) | 18 (1.9%) |
| 3-Person Households | 51 (5.4%) | 0 (0.0%) |
| 4-Person Households | 101 (10.8%) | 0 (0.0%) |
| 5-Person Households | 81 (8.7%) | 0 (0.0%) |
| 6-Person Households | 34 (3.6%) | 0 (0.0%) |
| 7+ Person Households | 0 (0.0%) | 0 (0.0%) |
| Total | 535 (57.2%) | 400 (42.8%) |
Female Fertility in Fowler
Fertility by Age in Fowler
Average fertility rate in Fowler is 97.0 births per 1,000 women. Women in the age bracket of 20 to 34 years have the highest fertility rate with 187.0 births per 1,000 women. Women in the age bracket of 20 to 34 years acount for 91.9% of all women with births.
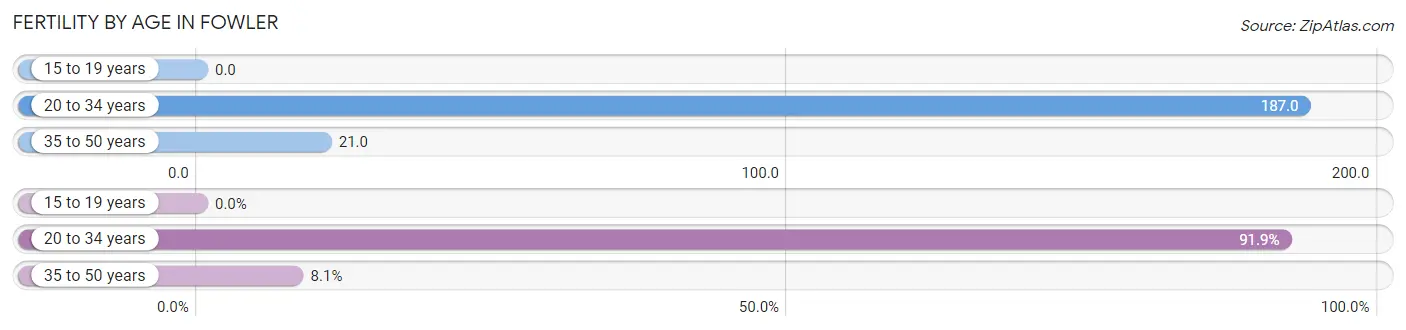
| Age Bracket | Women with Births | Births / 1,000 Women |
| 15 to 19 years | 0 (0.0%) | 0.0 |
| 20 to 34 years | 34 (91.9%) | 187.0 |
| 35 to 50 years | 3 (8.1%) | 21.0 |
| Total | 37 (100.0%) | 97.0 |
Fertility by Age by Marriage Status in Fowler
43.2% of women with births (37) in Fowler are married. The highest percentage of unmarried women with births falls into 20 to 34 years age bracket with 61.8% of them unmarried at the time of birth, while the lowest percentage of unmarried women with births belong to 35 to 50 years age bracket with 0.0% of them unmarried.
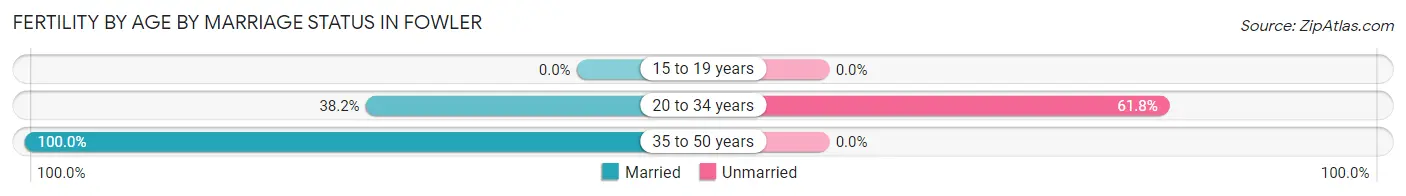
| Age Bracket | Married | Unmarried |
| 15 to 19 years | 0 (0.0%) | 0 (0.0%) |
| 20 to 34 years | 13 (38.2%) | 21 (61.8%) |
| 35 to 50 years | 3 (100.0%) | 0 (0.0%) |
| Total | 16 (43.2%) | 21 (56.8%) |
Fertility by Education in Fowler
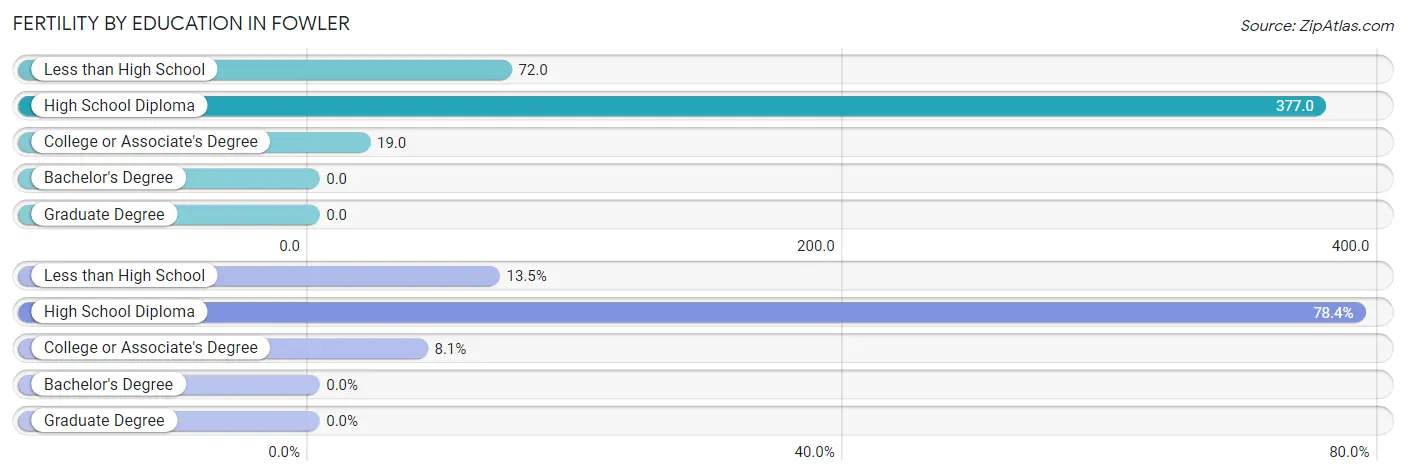
| Educational Attainment | Women with Births | Births / 1,000 Women |
| Less than High School | 5 (13.5%) | 72.0 |
| High School Diploma | 29 (78.4%) | 377.0 |
| College or Associate's Degree | 3 (8.1%) | 19.0 |
| Bachelor's Degree | 0 (0.0%) | 0.0 |
| Graduate Degree | 0 (0.0%) | 0.0 |
| Total | 37 (100.0%) | 97.0 |
Fertility by Education by Marriage Status in Fowler
56.8% of women with births in Fowler are unmarried. Women with the educational attainment of less than high school are most likely to be married with 100.0% of them married at childbirth, while women with the educational attainment of high school diploma are least likely to be married with 72.4% of them unmarried at childbirth.
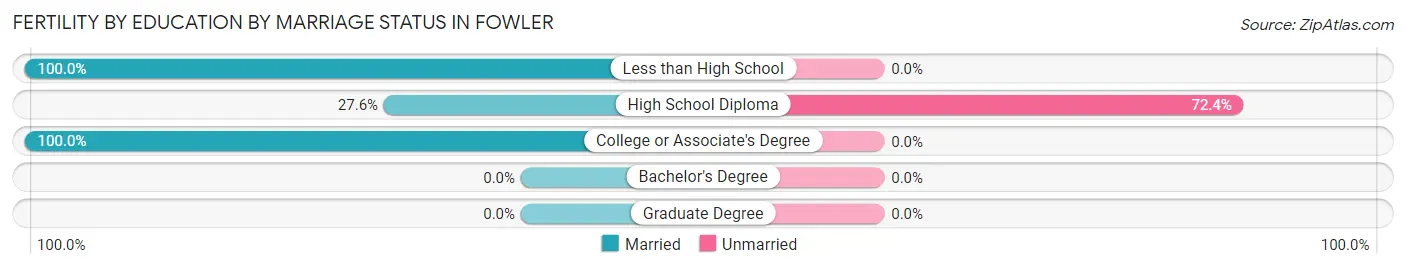
| Educational Attainment | Married | Unmarried |
| Less than High School | 5 (100.0%) | 0 (0.0%) |
| High School Diploma | 8 (27.6%) | 21 (72.4%) |
| College or Associate's Degree | 3 (100.0%) | 0 (0.0%) |
| Bachelor's Degree | 0 (0.0%) | 0 (0.0%) |
| Graduate Degree | 0 (0.0%) | 0 (0.0%) |
| Total | 16 (43.2%) | 21 (56.8%) |
Employment Characteristics in Fowler
Employment by Class of Employer in Fowler
Among the 972 employed individuals in Fowler, private company employees (684 | 70.4%), state government employees (103 | 10.6%), and local government employees (91 | 9.4%) make up the most common classes of employment.
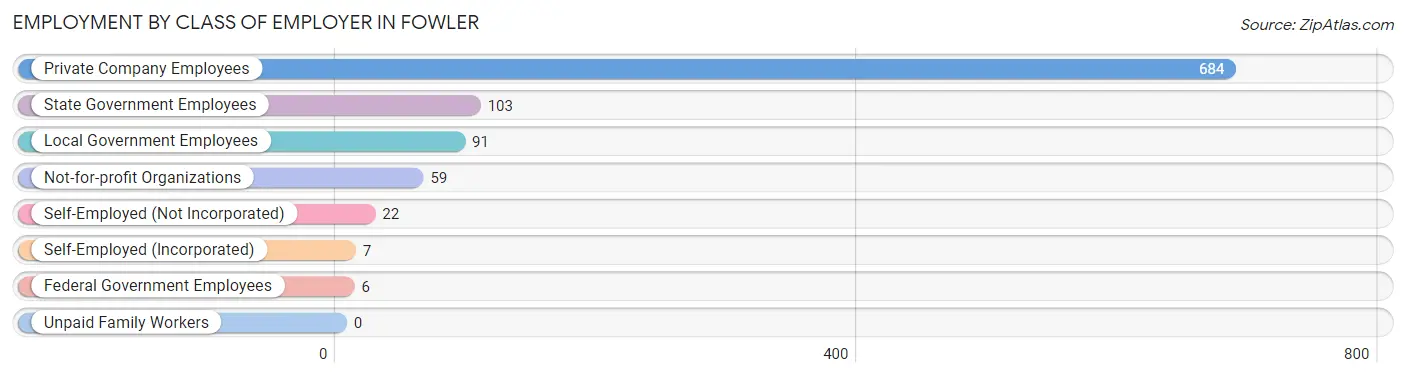
| Employer Class | # Employees | % Employees |
| Private Company Employees | 684 | 70.4% |
| Self-Employed (Incorporated) | 7 | 0.7% |
| Self-Employed (Not Incorporated) | 22 | 2.3% |
| Not-for-profit Organizations | 59 | 6.1% |
| Local Government Employees | 91 | 9.4% |
| State Government Employees | 103 | 10.6% |
| Federal Government Employees | 6 | 0.6% |
| Unpaid Family Workers | 0 | 0.0% |
| Total | 972 | 100.0% |
Employment Status by Age in Fowler
According to the labor force statistics for Fowler, out of the total population over 16 years of age (1,767), 60.8% or 1,074 individuals are in the labor force, with 2.4% or 26 of them unemployed. The age group with the highest labor force participation rate is 20 to 24 years, with 94.1% or 96 individuals in the labor force. Within the labor force, the 30 to 34 years age range has the highest percentage of unemployed individuals, with 19.2% or 14 of them being unemployed.
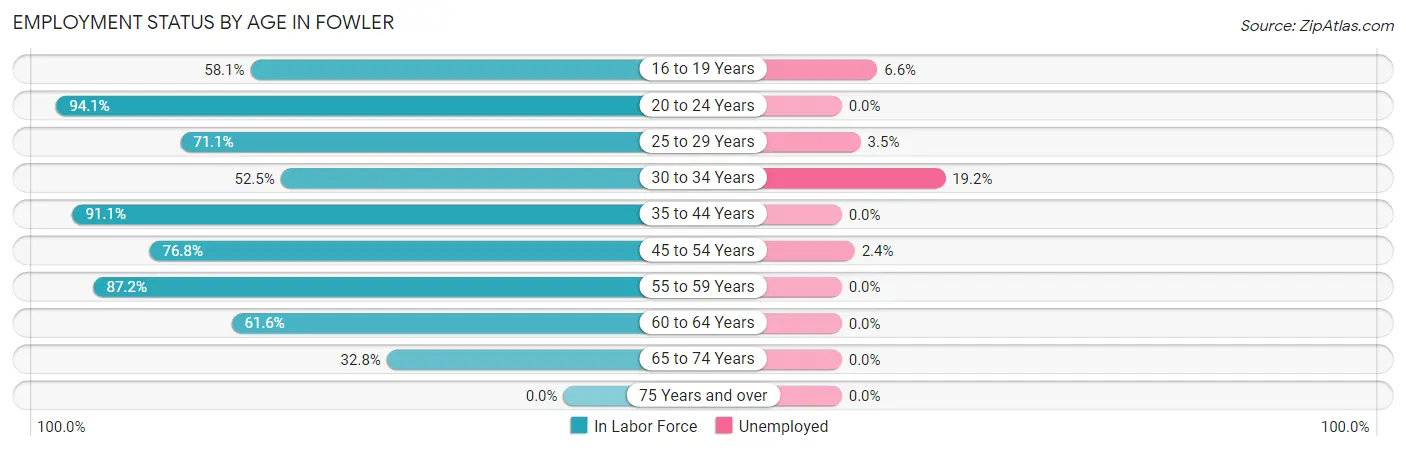
| Age Bracket | In Labor Force | Unemployed |
| 16 to 19 Years | 61 (58.1%) | 4 (6.6%) |
| 20 to 24 Years | 96 (94.1%) | 0 (0.0%) |
| 25 to 29 Years | 113 (71.1%) | 4 (3.5%) |
| 30 to 34 Years | 73 (52.5%) | 14 (19.2%) |
| 35 to 44 Years | 246 (91.1%) | 0 (0.0%) |
| 45 to 54 Years | 169 (76.8%) | 4 (2.4%) |
| 55 to 59 Years | 164 (87.2%) | 0 (0.0%) |
| 60 to 64 Years | 69 (61.6%) | 0 (0.0%) |
| 65 to 74 Years | 83 (32.8%) | 0 (0.0%) |
| 75 Years and over | 0 (0.0%) | 0 (0.0%) |
| Total | 1,074 (60.8%) | 26 (2.4%) |
Employment Status by Educational Attainment in Fowler
According to labor force statistics for Fowler, 76.7% of individuals (834) out of the total population between 25 and 64 years of age (1,088) are in the labor force, with 2.6% or 22 of them being unemployed. The group with the highest labor force participation rate are those with the educational attainment of bachelor's degree or higher, with 94.4% or 269 individuals in the labor force. Within the labor force, individuals with less than high school education have the highest percentage of unemployment, with 18.2% or 10 of them being unemployed.
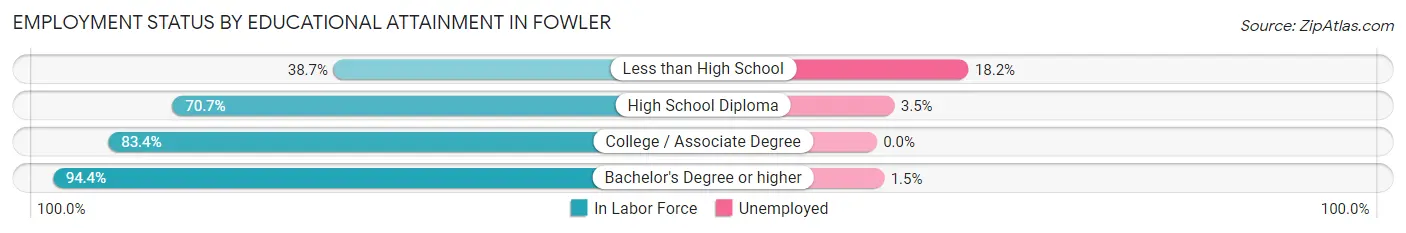
| Educational Attainment | In Labor Force | Unemployed |
| Less than High School | 55 (38.7%) | 26 (18.2%) |
| High School Diploma | 229 (70.7%) | 11 (3.5%) |
| College / Associate Degree | 281 (83.4%) | 0 (0.0%) |
| Bachelor's Degree or higher | 269 (94.4%) | 4 (1.5%) |
| Total | 834 (76.7%) | 28 (2.6%) |
Employment Occupations by Sex in Fowler
Management, Business, Science and Arts Occupations
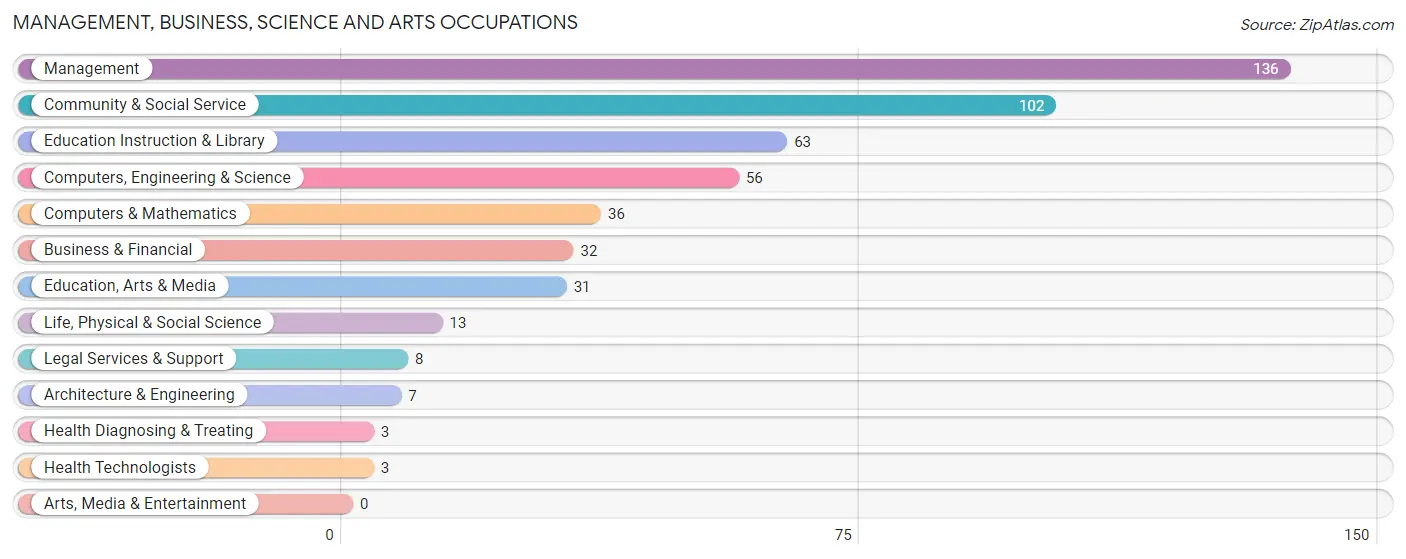
The most common Management, Business, Science and Arts occupations in Fowler are Management (136 | 13.0%), Community & Social Service (102 | 9.7%), Education Instruction & Library (63 | 6.0%), Computers, Engineering & Science (56 | 5.3%), and Computers & Mathematics (36 | 3.4%).
Management, Business, Science and Arts Occupations by Sex
Within the Management, Business, Science and Arts occupations in Fowler, the most male-oriented occupations are Computers & Mathematics (100.0%), Architecture & Engineering (100.0%), and Legal Services & Support (100.0%), while the most female-oriented occupations are Health Diagnosing & Treating (100.0%), Health Technologists (100.0%), and Education, Arts & Media (90.3%).
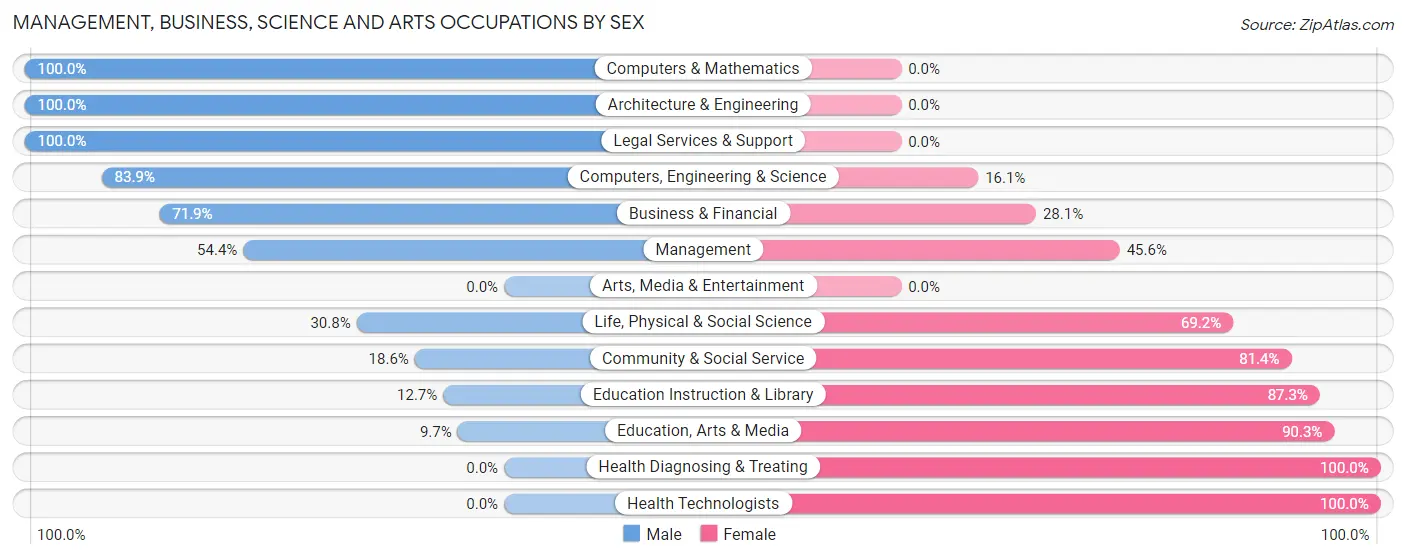
| Occupation | Male | Female |
| Management | 74 (54.4%) | 62 (45.6%) |
| Business & Financial | 23 (71.9%) | 9 (28.1%) |
| Computers, Engineering & Science | 47 (83.9%) | 9 (16.1%) |
| Computers & Mathematics | 36 (100.0%) | 0 (0.0%) |
| Architecture & Engineering | 7 (100.0%) | 0 (0.0%) |
| Life, Physical & Social Science | 4 (30.8%) | 9 (69.2%) |
| Community & Social Service | 19 (18.6%) | 83 (81.4%) |
| Education, Arts & Media | 3 (9.7%) | 28 (90.3%) |
| Legal Services & Support | 8 (100.0%) | 0 (0.0%) |
| Education Instruction & Library | 8 (12.7%) | 55 (87.3%) |
| Arts, Media & Entertainment | 0 (0.0%) | 0 (0.0%) |
| Health Diagnosing & Treating | 0 (0.0%) | 3 (100.0%) |
| Health Technologists | 0 (0.0%) | 3 (100.0%) |
| Total (Category) | 163 (49.5%) | 166 (50.5%) |
| Total (Overall) | 525 (50.1%) | 523 (49.9%) |
Services Occupations
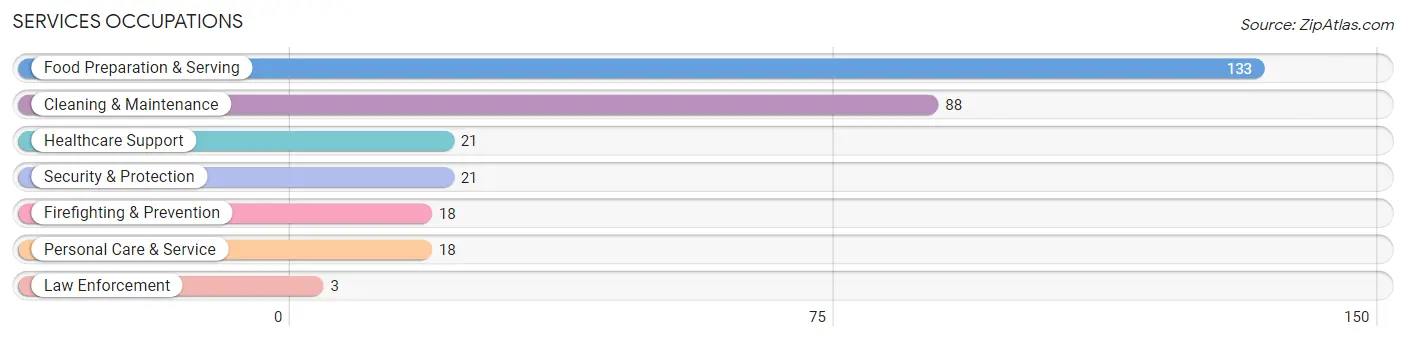
The most common Services occupations in Fowler are Food Preparation & Serving (133 | 12.7%), Cleaning & Maintenance (88 | 8.4%), Healthcare Support (21 | 2.0%), Security & Protection (21 | 2.0%), and Firefighting & Prevention (18 | 1.7%).
Services Occupations by Sex
Within the Services occupations in Fowler, the most male-oriented occupations are Security & Protection (100.0%), Firefighting & Prevention (100.0%), and Law Enforcement (100.0%), while the most female-oriented occupations are Healthcare Support (100.0%), Personal Care & Service (100.0%), and Food Preparation & Serving (75.9%).
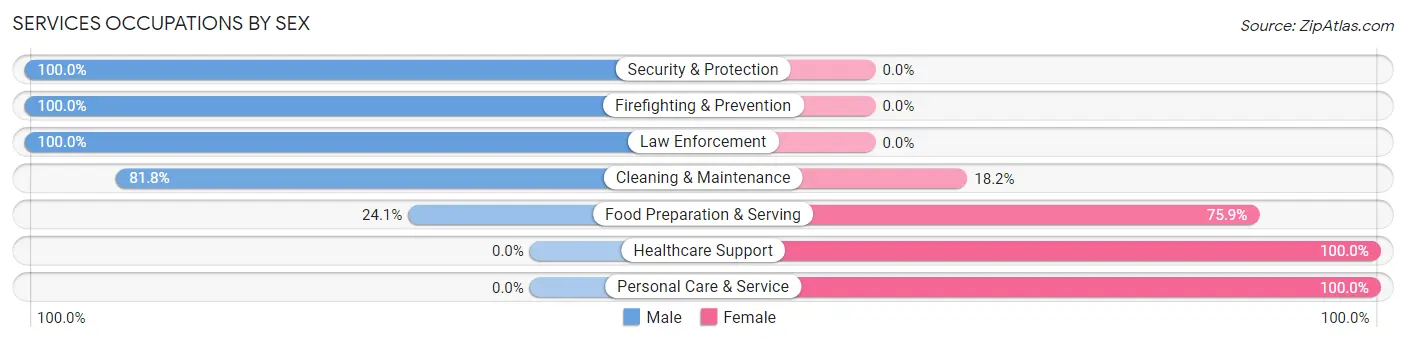
| Occupation | Male | Female |
| Healthcare Support | 0 (0.0%) | 21 (100.0%) |
| Security & Protection | 21 (100.0%) | 0 (0.0%) |
| Firefighting & Prevention | 18 (100.0%) | 0 (0.0%) |
| Law Enforcement | 3 (100.0%) | 0 (0.0%) |
| Food Preparation & Serving | 32 (24.1%) | 101 (75.9%) |
| Cleaning & Maintenance | 72 (81.8%) | 16 (18.2%) |
| Personal Care & Service | 0 (0.0%) | 18 (100.0%) |
| Total (Category) | 125 (44.5%) | 156 (55.5%) |
| Total (Overall) | 525 (50.1%) | 523 (49.9%) |
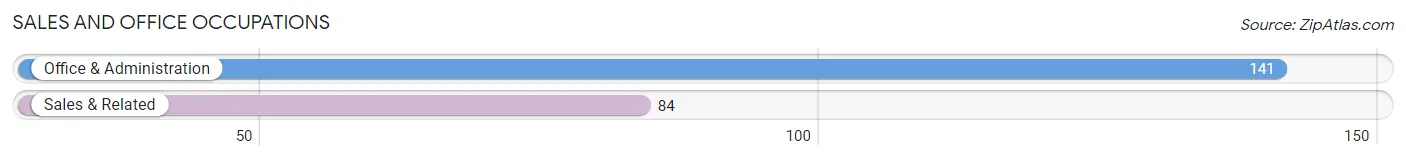
Sales and Office Occupations
The most common Sales and Office occupations in Fowler are Office & Administration (141 | 13.5%), and Sales & Related (84 | 8.0%).
Sales and Office Occupations by Sex
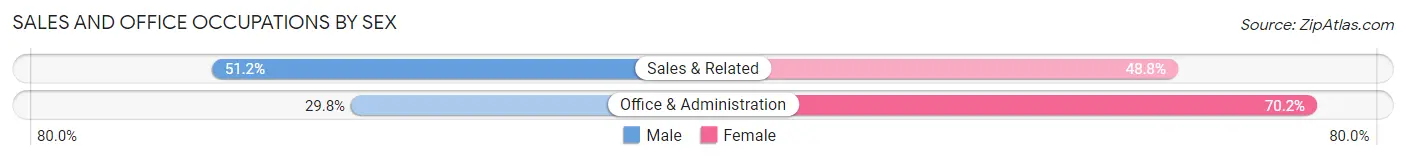
| Occupation | Male | Female |
| Sales & Related | 43 (51.2%) | 41 (48.8%) |
| Office & Administration | 42 (29.8%) | 99 (70.2%) |
| Total (Category) | 85 (37.8%) | 140 (62.2%) |
| Total (Overall) | 525 (50.1%) | 523 (49.9%) |
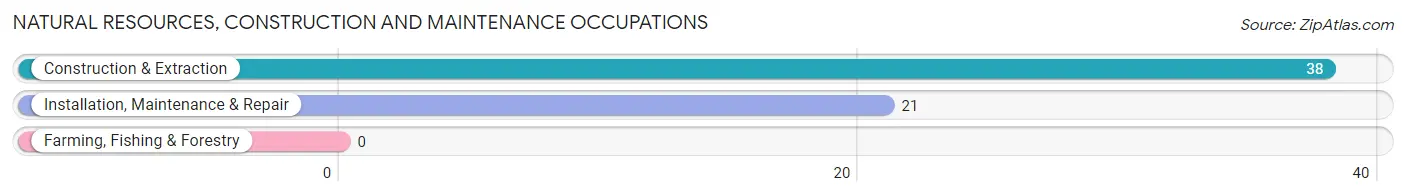
Natural Resources, Construction and Maintenance Occupations
The most common Natural Resources, Construction and Maintenance occupations in Fowler are Construction & Extraction (38 | 3.6%), and Installation, Maintenance & Repair (21 | 2.0%).
Natural Resources, Construction and Maintenance Occupations by Sex
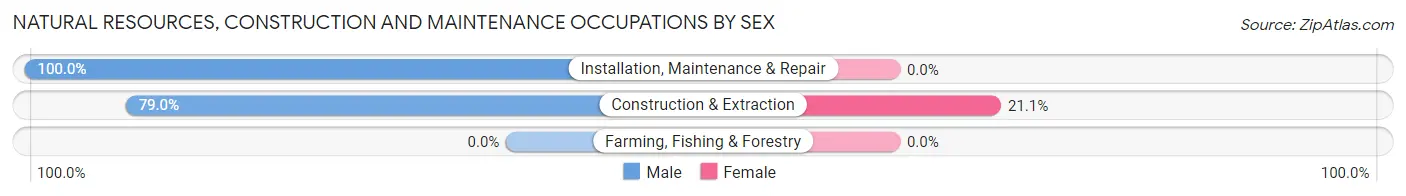
| Occupation | Male | Female |
| Farming, Fishing & Forestry | 0 (0.0%) | 0 (0.0%) |
| Construction & Extraction | 30 (78.9%) | 8 (21.0%) |
| Installation, Maintenance & Repair | 21 (100.0%) | 0 (0.0%) |
| Total (Category) | 51 (86.4%) | 8 (13.6%) |
| Total (Overall) | 525 (50.1%) | 523 (49.9%) |
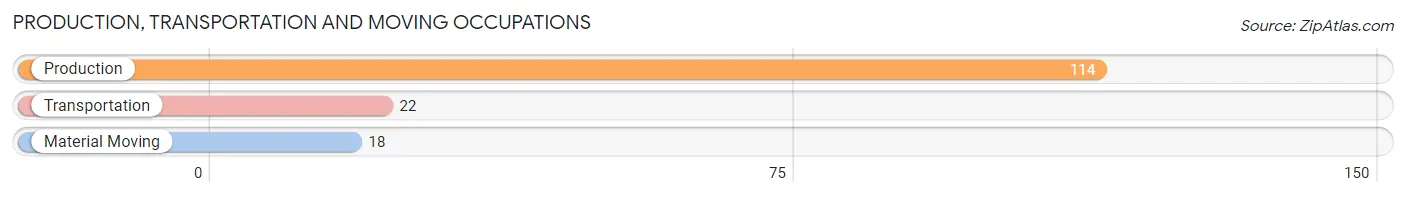
Production, Transportation and Moving Occupations
The most common Production, Transportation and Moving occupations in Fowler are Production (114 | 10.9%), Transportation (22 | 2.1%), and Material Moving (18 | 1.7%).
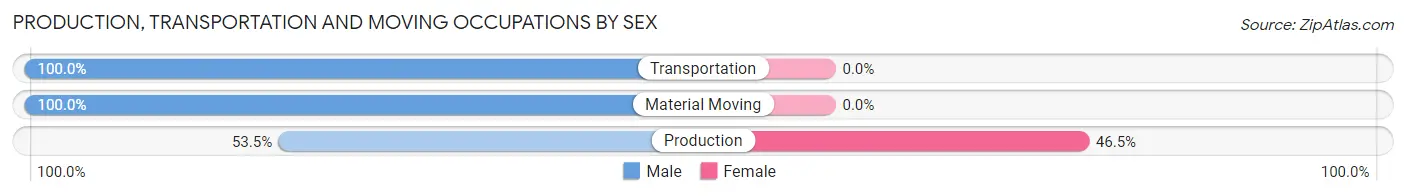
Production, Transportation and Moving Occupations by Sex
| Occupation | Male | Female |
| Production | 61 (53.5%) | 53 (46.5%) |
| Transportation | 22 (100.0%) | 0 (0.0%) |
| Material Moving | 18 (100.0%) | 0 (0.0%) |
| Total (Category) | 101 (65.6%) | 53 (34.4%) |
| Total (Overall) | 525 (50.1%) | 523 (49.9%) |
Employment Industries by Sex in Fowler
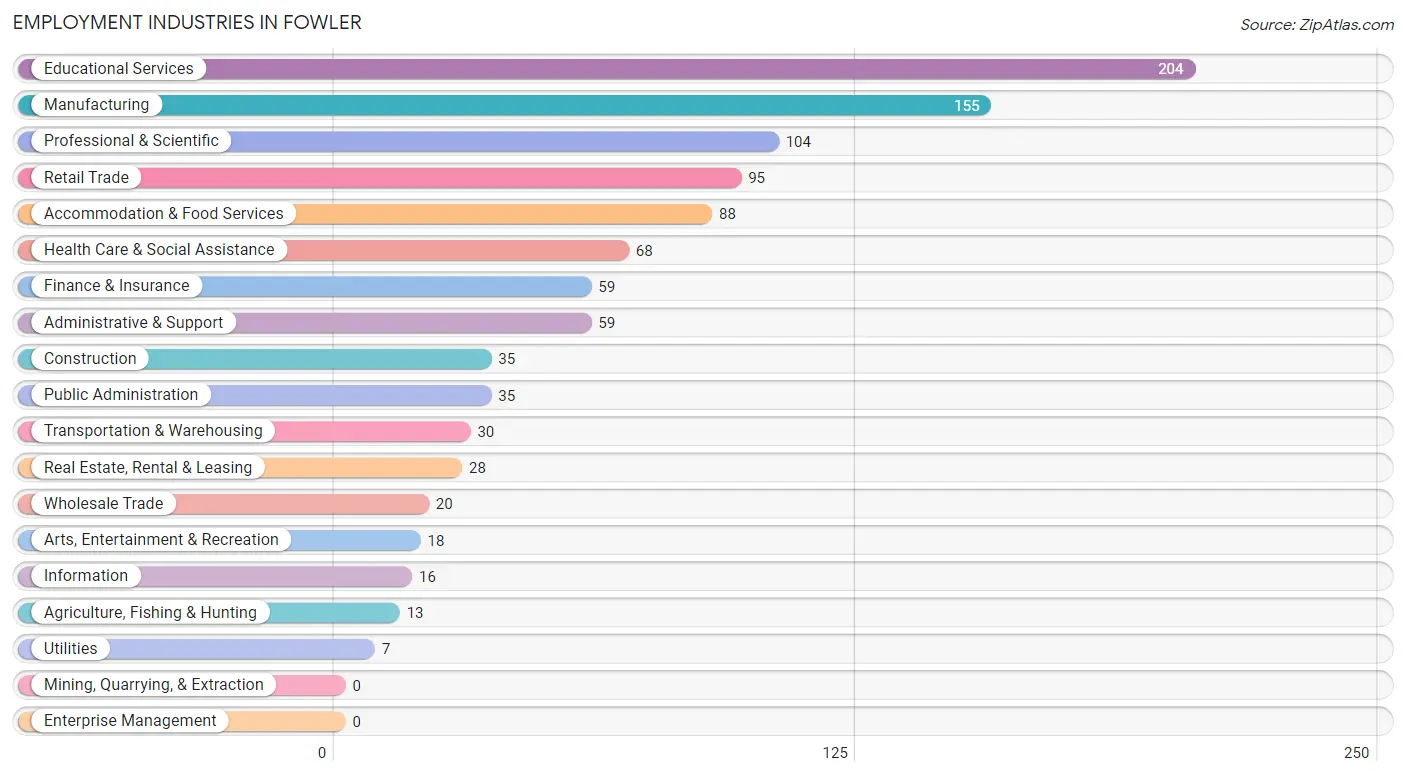
Employment Industries in Fowler
The major employment industries in Fowler include Educational Services (204 | 19.5%), Manufacturing (155 | 14.8%), Professional & Scientific (104 | 9.9%), Retail Trade (95 | 9.1%), and Accommodation & Food Services (88 | 8.4%).
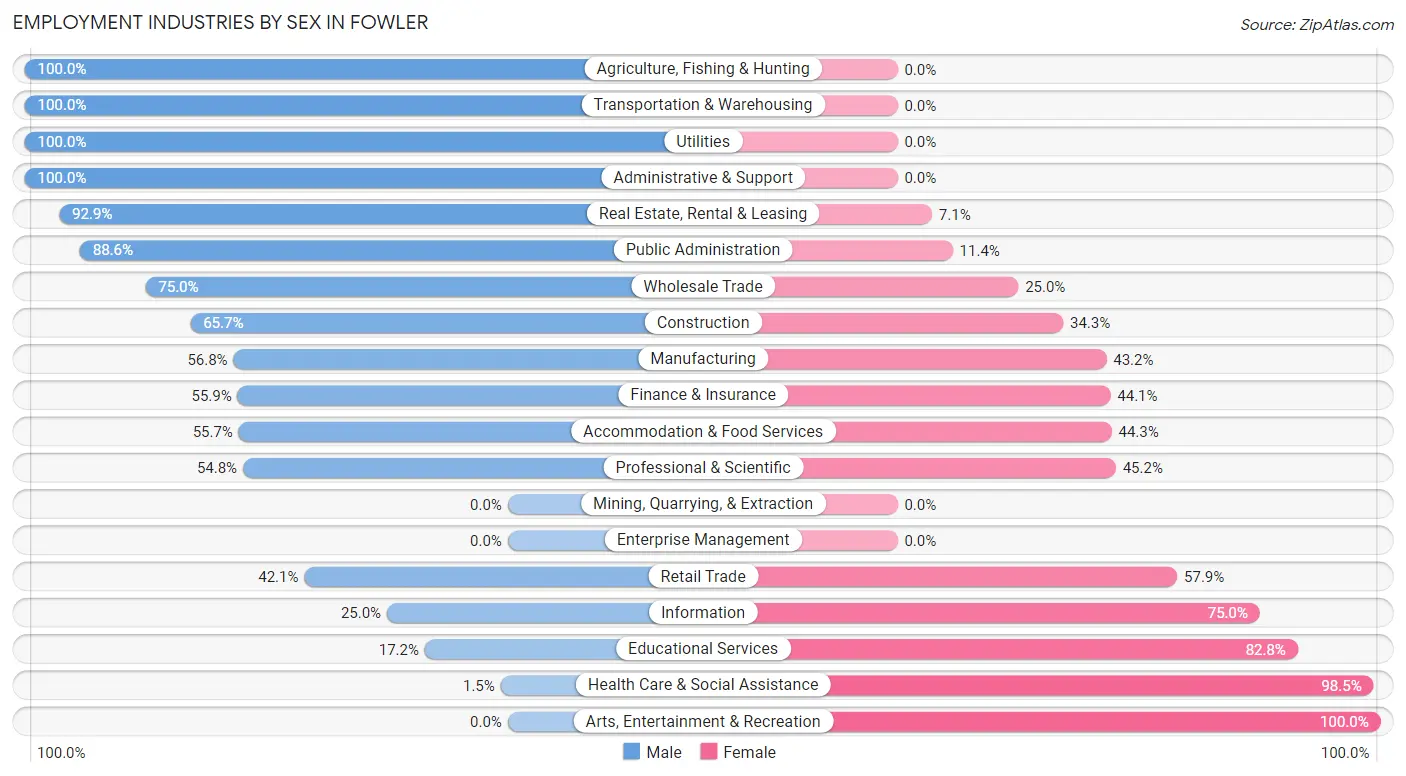
Employment Industries by Sex in Fowler
The Fowler industries that see more men than women are Agriculture, Fishing & Hunting (100.0%), Transportation & Warehousing (100.0%), and Utilities (100.0%), whereas the industries that tend to have a higher number of women are Arts, Entertainment & Recreation (100.0%), Health Care & Social Assistance (98.5%), and Educational Services (82.8%).
| Industry | Male | Female |
| Agriculture, Fishing & Hunting | 13 (100.0%) | 0 (0.0%) |
| Mining, Quarrying, & Extraction | 0 (0.0%) | 0 (0.0%) |
| Construction | 23 (65.7%) | 12 (34.3%) |
| Manufacturing | 88 (56.8%) | 67 (43.2%) |
| Wholesale Trade | 15 (75.0%) | 5 (25.0%) |
| Retail Trade | 40 (42.1%) | 55 (57.9%) |
| Transportation & Warehousing | 30 (100.0%) | 0 (0.0%) |
| Utilities | 7 (100.0%) | 0 (0.0%) |
| Information | 4 (25.0%) | 12 (75.0%) |
| Finance & Insurance | 33 (55.9%) | 26 (44.1%) |
| Real Estate, Rental & Leasing | 26 (92.9%) | 2 (7.1%) |
| Professional & Scientific | 57 (54.8%) | 47 (45.2%) |
| Enterprise Management | 0 (0.0%) | 0 (0.0%) |
| Administrative & Support | 59 (100.0%) | 0 (0.0%) |
| Educational Services | 35 (17.2%) | 169 (82.8%) |
| Health Care & Social Assistance | 1 (1.5%) | 67 (98.5%) |
| Arts, Entertainment & Recreation | 0 (0.0%) | 18 (100.0%) |
| Accommodation & Food Services | 49 (55.7%) | 39 (44.3%) |
| Public Administration | 31 (88.6%) | 4 (11.4%) |
| Total | 525 (50.1%) | 523 (49.9%) |
Education in Fowler
School Enrollment in Fowler
The most common levels of schooling among the 430 students in Fowler are elementary school (129 | 30.0%), high school (86 | 20.0%), and middle school (64 | 14.9%).
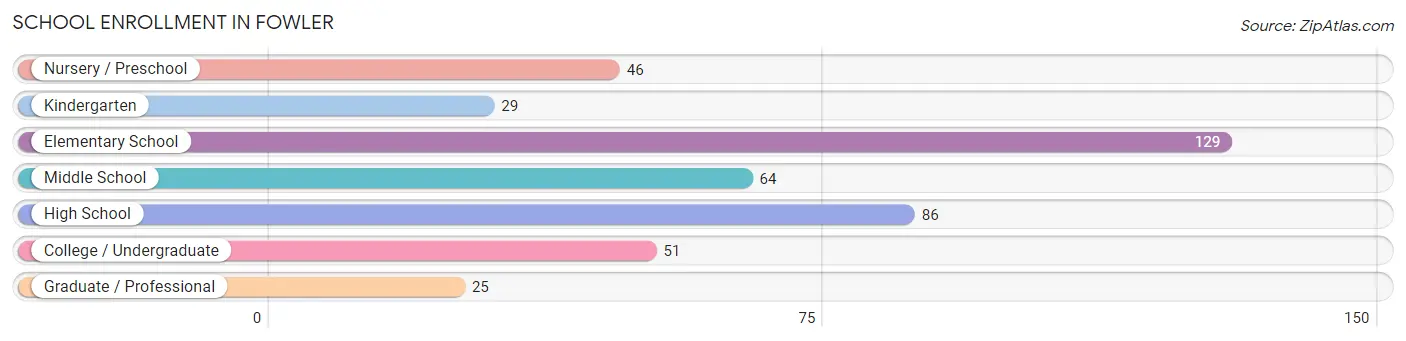
| School Level | # Students | % Students |
| Nursery / Preschool | 46 | 10.7% |
| Kindergarten | 29 | 6.7% |
| Elementary School | 129 | 30.0% |
| Middle School | 64 | 14.9% |
| High School | 86 | 20.0% |
| College / Undergraduate | 51 | 11.9% |
| Graduate / Professional | 25 | 5.8% |
| Total | 430 | 100.0% |
School Enrollment by Age by Funding Source in Fowler
Out of a total of 430 students who are enrolled in schools in Fowler, 118 (27.4%) attend a private institution, while the remaining 312 (72.6%) are enrolled in public schools. The age group of 3 to 4 year olds has the highest likelihood of being enrolled in private schools, with 37 (92.5% in the age bracket) enrolled. Conversely, the age group of 10 to 14 year olds has the lowest likelihood of being enrolled in a private school, with 84 (100.0% in the age bracket) attending a public institution.
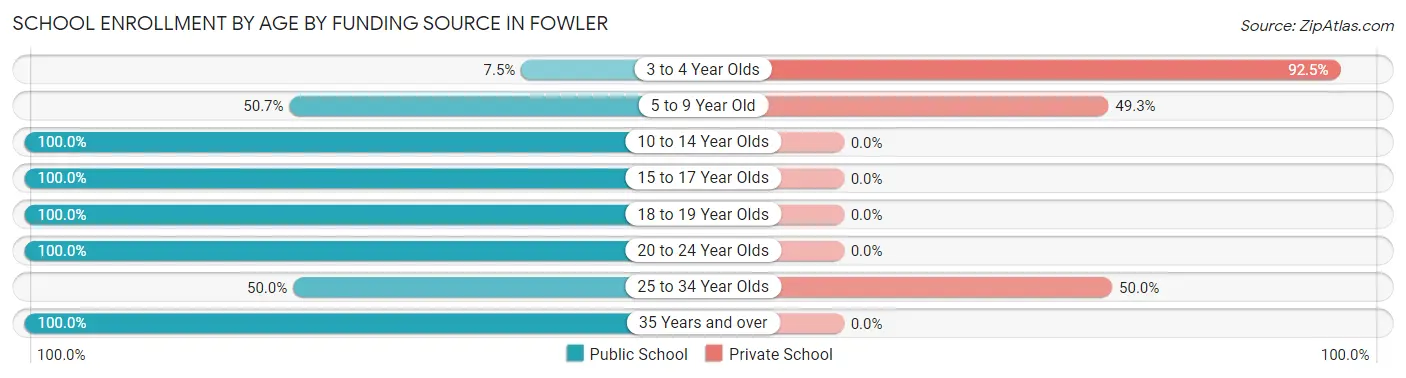
| Age Bracket | Public School | Private School |
| 3 to 4 Year Olds | 3 (7.5%) | 37 (92.5%) |
| 5 to 9 Year Old | 73 (50.7%) | 71 (49.3%) |
| 10 to 14 Year Olds | 84 (100.0%) | 0 (0.0%) |
| 15 to 17 Year Olds | 82 (100.0%) | 0 (0.0%) |
| 18 to 19 Year Olds | 44 (100.0%) | 0 (0.0%) |
| 20 to 24 Year Olds | 6 (100.0%) | 0 (0.0%) |
| 25 to 34 Year Olds | 10 (50.0%) | 10 (50.0%) |
| 35 Years and over | 10 (100.0%) | 0 (0.0%) |
| Total | 312 (72.6%) | 118 (27.4%) |
Educational Attainment by Field of Study in Fowler
Business (111 | 29.4%), education (67 | 17.7%), liberal arts & history (45 | 11.9%), computers & mathematics (40 | 10.6%), and social sciences (34 | 9.0%) are the most common fields of study among 378 individuals in Fowler who have obtained a bachelor's degree or higher.
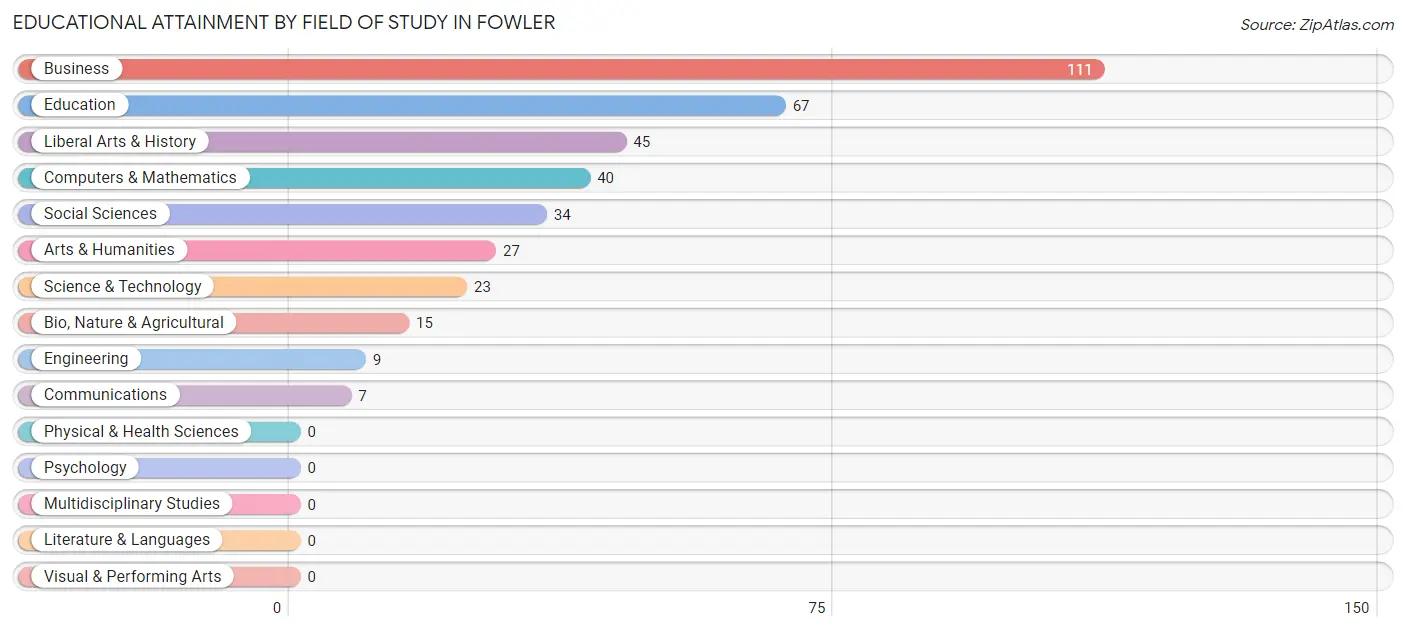
| Field of Study | # Graduates | % Graduates |
| Computers & Mathematics | 40 | 10.6% |
| Bio, Nature & Agricultural | 15 | 4.0% |
| Physical & Health Sciences | 0 | 0.0% |
| Psychology | 0 | 0.0% |
| Social Sciences | 34 | 9.0% |
| Engineering | 9 | 2.4% |
| Multidisciplinary Studies | 0 | 0.0% |
| Science & Technology | 23 | 6.1% |
| Business | 111 | 29.4% |
| Education | 67 | 17.7% |
| Literature & Languages | 0 | 0.0% |
| Liberal Arts & History | 45 | 11.9% |
| Visual & Performing Arts | 0 | 0.0% |
| Communications | 7 | 1.8% |
| Arts & Humanities | 27 | 7.1% |
| Total | 378 | 100.0% |
Transportation & Commute in Fowler
Vehicle Availability by Sex in Fowler
The most prevalent vehicle ownership categories in Fowler are males with 2 vehicles (174, accounting for 35.2%) and females with 2 vehicles (149, making up 36.4%).
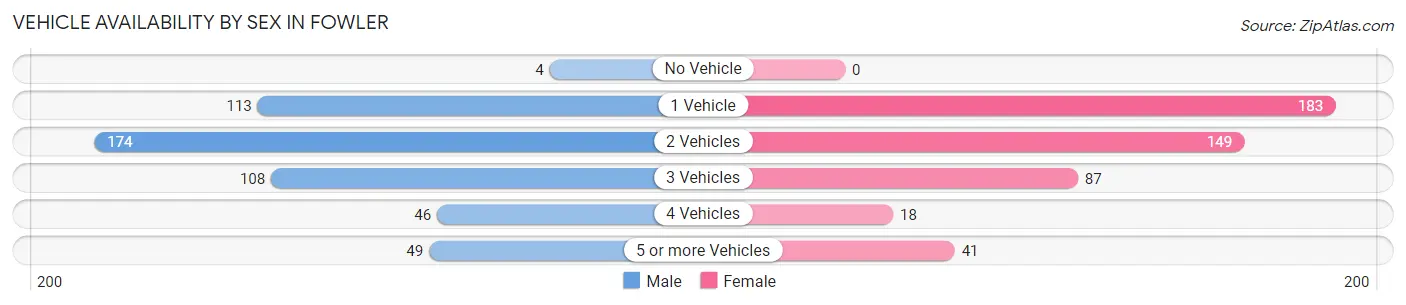
| Vehicles Available | Male | Female |
| No Vehicle | 4 (0.8%) | 0 (0.0%) |
| 1 Vehicle | 113 (22.9%) | 183 (38.3%) |
| 2 Vehicles | 174 (35.2%) | 149 (31.2%) |
| 3 Vehicles | 108 (21.9%) | 87 (18.2%) |
| 4 Vehicles | 46 (9.3%) | 18 (3.8%) |
| 5 or more Vehicles | 49 (9.9%) | 41 (8.6%) |
| Total | 494 (100.0%) | 478 (100.0%) |
Commute Time in Fowler
The most frequently occuring commute durations in Fowler are 45 to 59 minutes (173 commuters, 18.8%), 5 to 9 minutes (164 commuters, 17.8%), and less than 5 minutes (103 commuters, 11.2%).
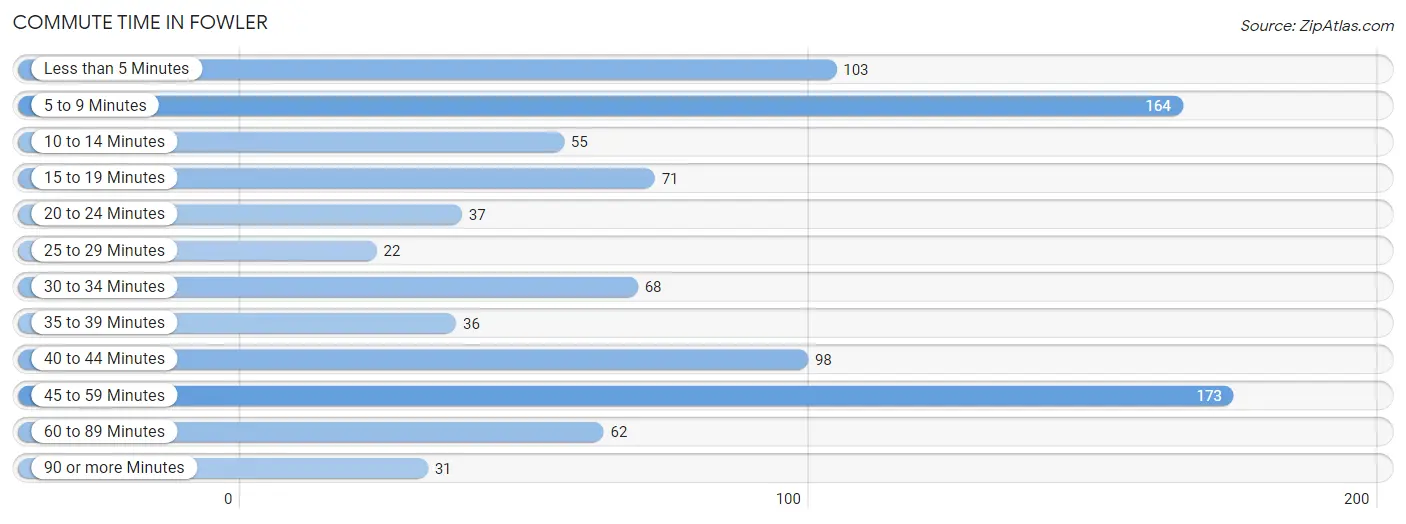
| Commute Time | # Commuters | % Commuters |
| Less than 5 Minutes | 103 | 11.2% |
| 5 to 9 Minutes | 164 | 17.8% |
| 10 to 14 Minutes | 55 | 6.0% |
| 15 to 19 Minutes | 71 | 7.7% |
| 20 to 24 Minutes | 37 | 4.0% |
| 25 to 29 Minutes | 22 | 2.4% |
| 30 to 34 Minutes | 68 | 7.4% |
| 35 to 39 Minutes | 36 | 3.9% |
| 40 to 44 Minutes | 98 | 10.6% |
| 45 to 59 Minutes | 173 | 18.8% |
| 60 to 89 Minutes | 62 | 6.7% |
| 90 or more Minutes | 31 | 3.4% |
Commute Time by Sex in Fowler
The most common commute times in Fowler are 45 to 59 minutes (80 commuters, 17.3%) for males and 45 to 59 minutes (93 commuters, 20.3%) for females.
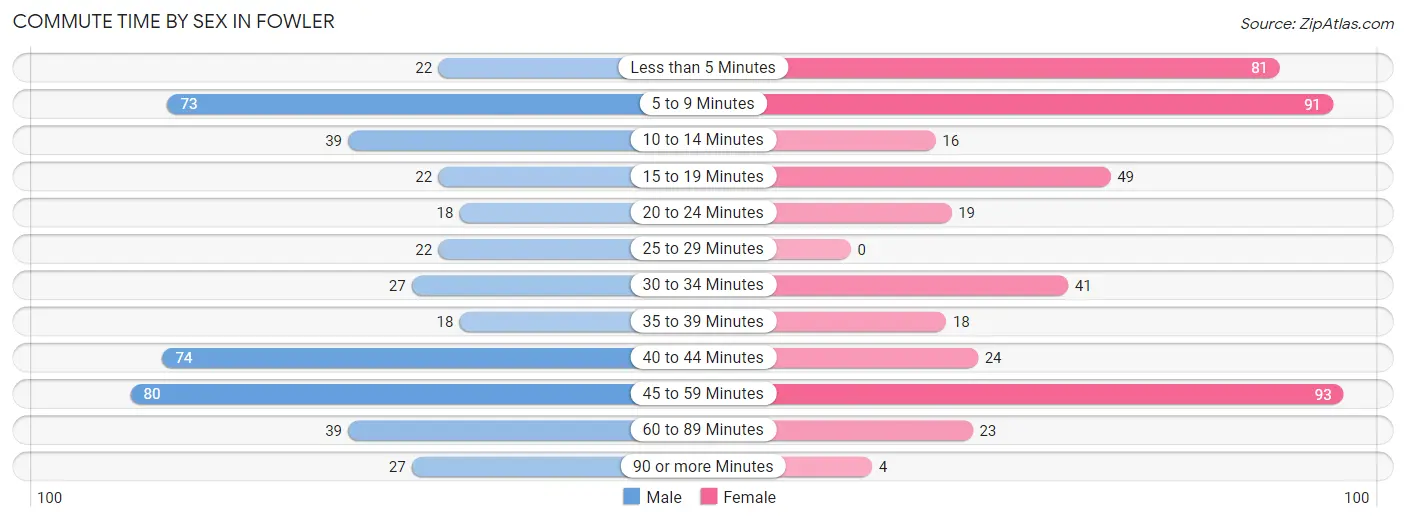
| Commute Time | Male | Female |
| Less than 5 Minutes | 22 (4.8%) | 81 (17.6%) |
| 5 to 9 Minutes | 73 (15.8%) | 91 (19.8%) |
| 10 to 14 Minutes | 39 (8.5%) | 16 (3.5%) |
| 15 to 19 Minutes | 22 (4.8%) | 49 (10.7%) |
| 20 to 24 Minutes | 18 (3.9%) | 19 (4.1%) |
| 25 to 29 Minutes | 22 (4.8%) | 0 (0.0%) |
| 30 to 34 Minutes | 27 (5.9%) | 41 (8.9%) |
| 35 to 39 Minutes | 18 (3.9%) | 18 (3.9%) |
| 40 to 44 Minutes | 74 (16.1%) | 24 (5.2%) |
| 45 to 59 Minutes | 80 (17.3%) | 93 (20.3%) |
| 60 to 89 Minutes | 39 (8.5%) | 23 (5.0%) |
| 90 or more Minutes | 27 (5.9%) | 4 (0.9%) |
Time of Departure to Work by Sex in Fowler
The most frequent times of departure to work in Fowler are 12:00 PM to 3:59 PM (85, 18.4%) for males and 7:00 AM to 7:29 AM (77, 16.8%) for females.
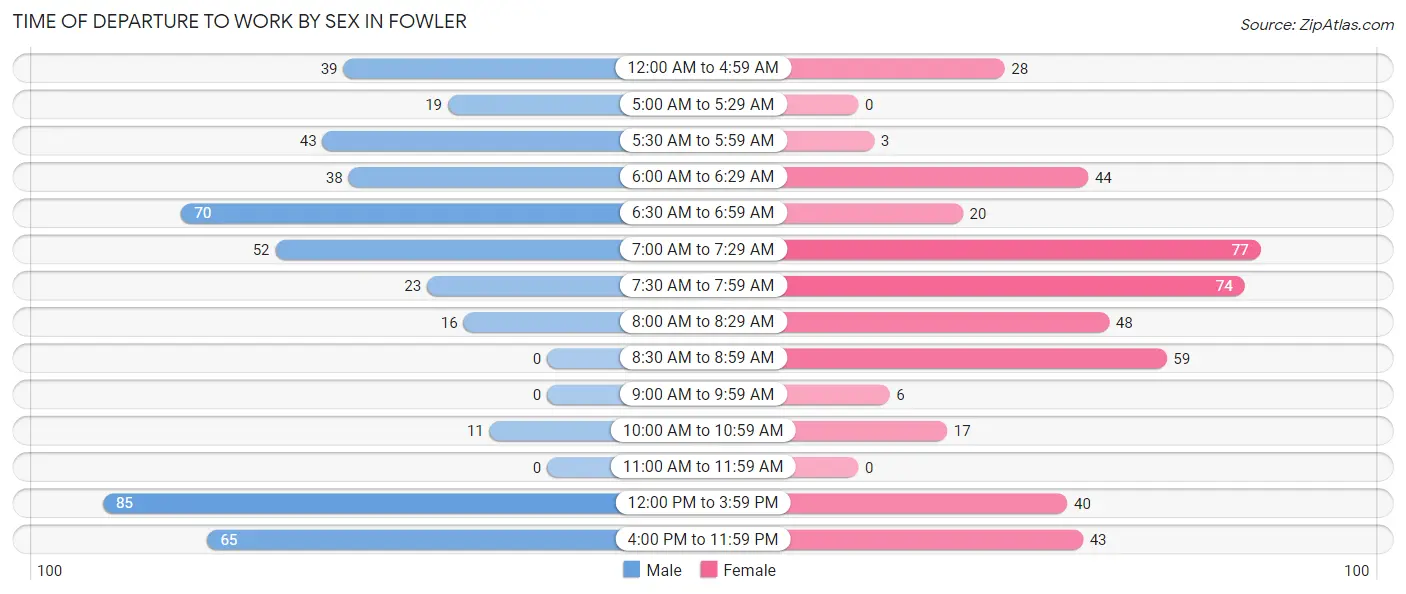
| Time of Departure | Male | Female |
| 12:00 AM to 4:59 AM | 39 (8.5%) | 28 (6.1%) |
| 5:00 AM to 5:29 AM | 19 (4.1%) | 0 (0.0%) |
| 5:30 AM to 5:59 AM | 43 (9.3%) | 3 (0.6%) |
| 6:00 AM to 6:29 AM | 38 (8.2%) | 44 (9.6%) |
| 6:30 AM to 6:59 AM | 70 (15.2%) | 20 (4.4%) |
| 7:00 AM to 7:29 AM | 52 (11.3%) | 77 (16.8%) |
| 7:30 AM to 7:59 AM | 23 (5.0%) | 74 (16.1%) |
| 8:00 AM to 8:29 AM | 16 (3.5%) | 48 (10.5%) |
| 8:30 AM to 8:59 AM | 0 (0.0%) | 59 (12.9%) |
| 9:00 AM to 9:59 AM | 0 (0.0%) | 6 (1.3%) |
| 10:00 AM to 10:59 AM | 11 (2.4%) | 17 (3.7%) |
| 11:00 AM to 11:59 AM | 0 (0.0%) | 0 (0.0%) |
| 12:00 PM to 3:59 PM | 85 (18.4%) | 40 (8.7%) |
| 4:00 PM to 11:59 PM | 65 (14.1%) | 43 (9.4%) |
| Total | 461 (100.0%) | 459 (100.0%) |
Housing Occupancy in Fowler
Occupancy by Ownership in Fowler
Of the total 935 dwellings in Fowler, owner-occupied units account for 699 (74.8%), while renter-occupied units make up 236 (25.2%).
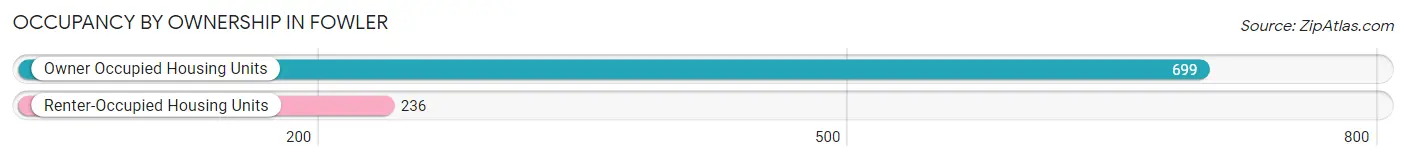
| Occupancy | # Housing Units | % Housing Units |
| Owner Occupied Housing Units | 699 | 74.8% |
| Renter-Occupied Housing Units | 236 | 25.2% |
| Total Occupied Housing Units | 935 | 100.0% |
Occupancy by Household Size in Fowler
| Household Size | # Housing Units | % Housing Units |
| 1-Person Household | 382 | 40.9% |
| 2-Person Household | 286 | 30.6% |
| 3-Person Household | 51 | 5.4% |
| 4+ Person Household | 216 | 23.1% |
| Total Housing Units | 935 | 100.0% |
Occupancy by Ownership by Household Size in Fowler
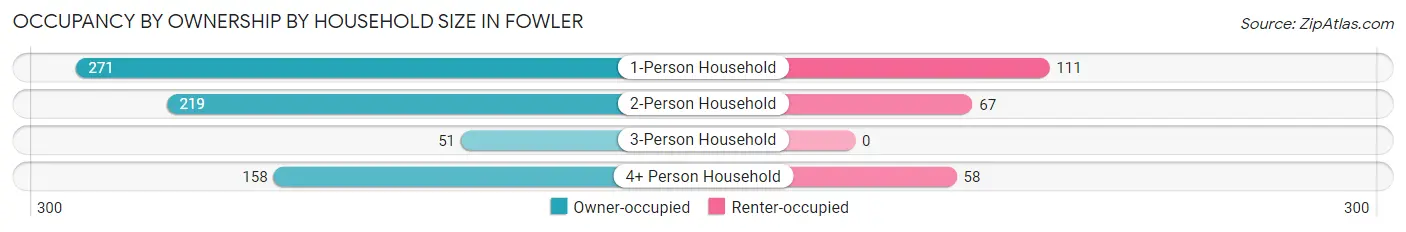
| Household Size | Owner-occupied | Renter-occupied |
| 1-Person Household | 271 (70.9%) | 111 (29.1%) |
| 2-Person Household | 219 (76.6%) | 67 (23.4%) |
| 3-Person Household | 51 (100.0%) | 0 (0.0%) |
| 4+ Person Household | 158 (73.2%) | 58 (26.9%) |
| Total Housing Units | 699 (74.8%) | 236 (25.2%) |
Occupancy by Educational Attainment in Fowler
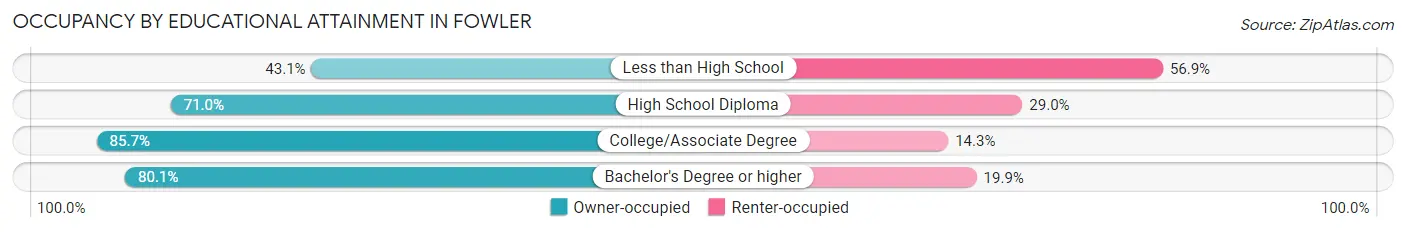
| Household Size | Owner-occupied | Renter-occupied |
| Less than High School | 44 (43.1%) | 58 (56.9%) |
| High School Diploma | 218 (71.0%) | 89 (29.0%) |
| College/Associate Degree | 240 (85.7%) | 40 (14.3%) |
| Bachelor's Degree or higher | 197 (80.1%) | 49 (19.9%) |
Occupancy by Age of Householder in Fowler
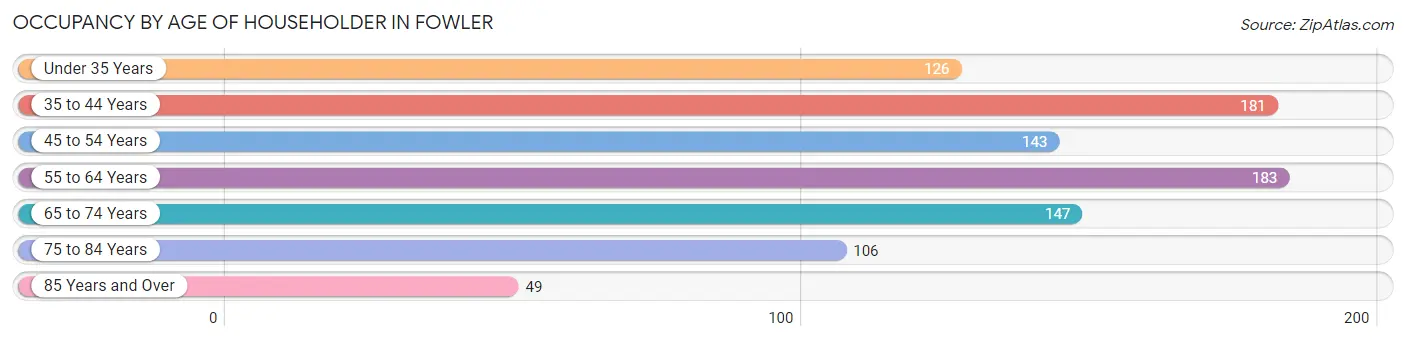
| Age Bracket | # Households | % Households |
| Under 35 Years | 126 | 13.5% |
| 35 to 44 Years | 181 | 19.4% |
| 45 to 54 Years | 143 | 15.3% |
| 55 to 64 Years | 183 | 19.6% |
| 65 to 74 Years | 147 | 15.7% |
| 75 to 84 Years | 106 | 11.3% |
| 85 Years and Over | 49 | 5.2% |
| Total | 935 | 100.0% |
Housing Finances in Fowler
Median Income by Occupancy in Fowler
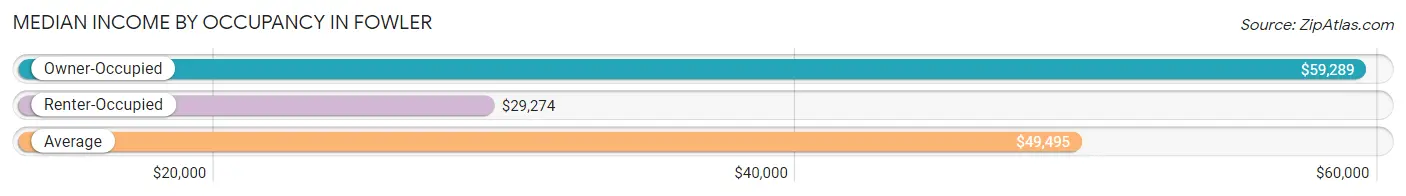
| Occupancy Type | # Households | Median Income |
| Owner-Occupied | 699 (74.8%) | $59,289 |
| Renter-Occupied | 236 (25.2%) | $29,274 |
| Average | 935 (100.0%) | $49,495 |
Occupancy by Householder Income Bracket in Fowler
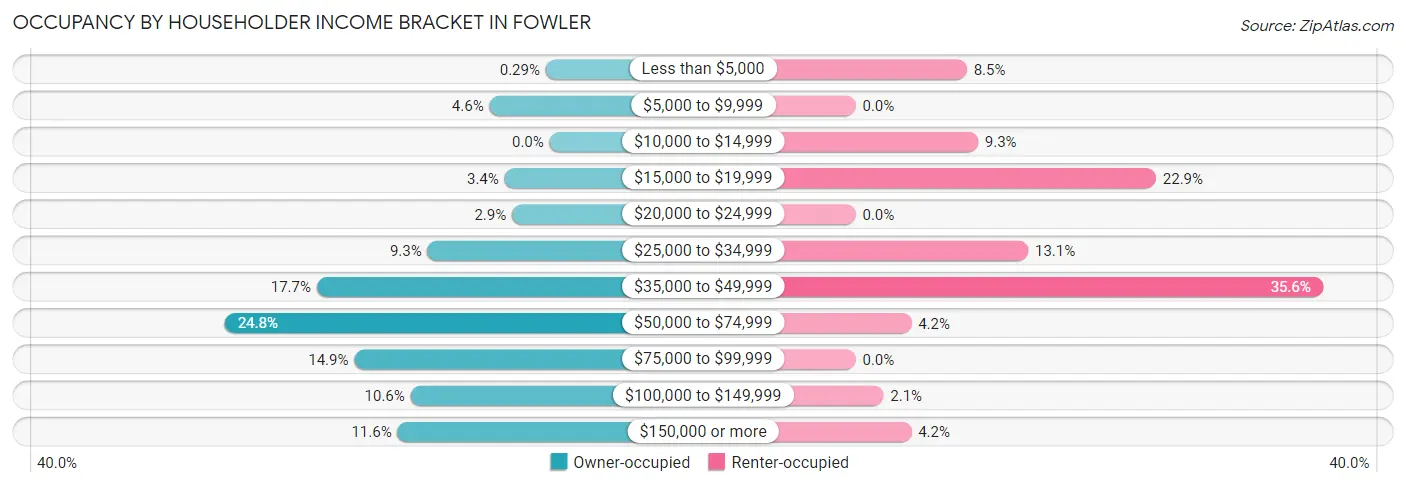
| Income Bracket | Owner-occupied | Renter-occupied |
| Less than $5,000 | 2 (0.3%) | 20 (8.5%) |
| $5,000 to $9,999 | 32 (4.6%) | 0 (0.0%) |
| $10,000 to $14,999 | 0 (0.0%) | 22 (9.3%) |
| $15,000 to $19,999 | 24 (3.4%) | 54 (22.9%) |
| $20,000 to $24,999 | 20 (2.9%) | 0 (0.0%) |
| $25,000 to $34,999 | 65 (9.3%) | 31 (13.1%) |
| $35,000 to $49,999 | 124 (17.7%) | 84 (35.6%) |
| $50,000 to $74,999 | 173 (24.7%) | 10 (4.2%) |
| $75,000 to $99,999 | 104 (14.9%) | 0 (0.0%) |
| $100,000 to $149,999 | 74 (10.6%) | 5 (2.1%) |
| $150,000 or more | 81 (11.6%) | 10 (4.2%) |
| Total | 699 (100.0%) | 236 (100.0%) |
Monthly Housing Cost Tiers in Fowler
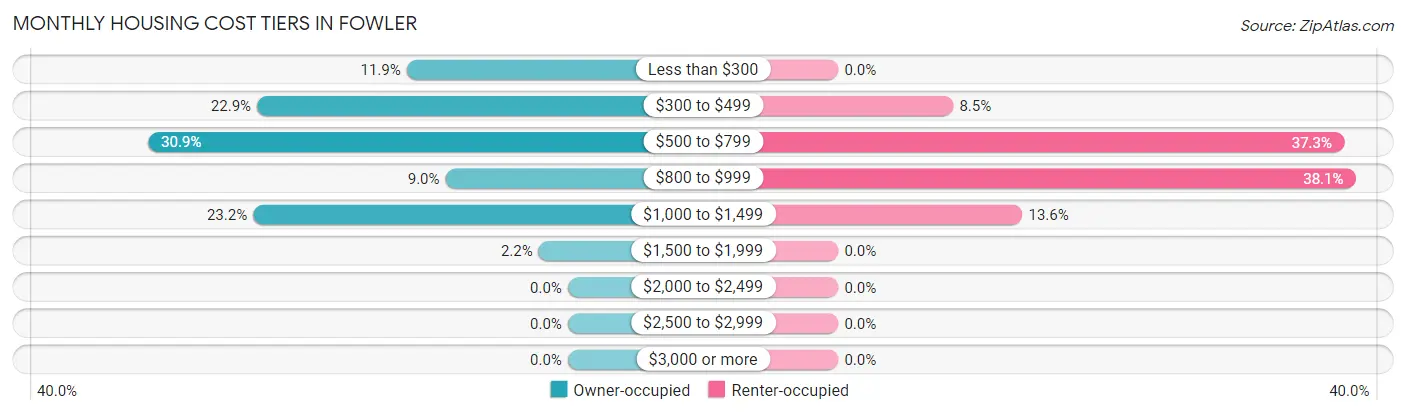
| Monthly Cost | Owner-occupied | Renter-occupied |
| Less than $300 | 83 (11.9%) | 0 (0.0%) |
| $300 to $499 | 160 (22.9%) | 20 (8.5%) |
| $500 to $799 | 216 (30.9%) | 88 (37.3%) |
| $800 to $999 | 63 (9.0%) | 90 (38.1%) |
| $1,000 to $1,499 | 162 (23.2%) | 32 (13.6%) |
| $1,500 to $1,999 | 15 (2.1%) | 0 (0.0%) |
| $2,000 to $2,499 | 0 (0.0%) | 0 (0.0%) |
| $2,500 to $2,999 | 0 (0.0%) | 0 (0.0%) |
| $3,000 or more | 0 (0.0%) | 0 (0.0%) |
| Total | 699 (100.0%) | 236 (100.0%) |
Physical Housing Characteristics in Fowler
Housing Structures in Fowler
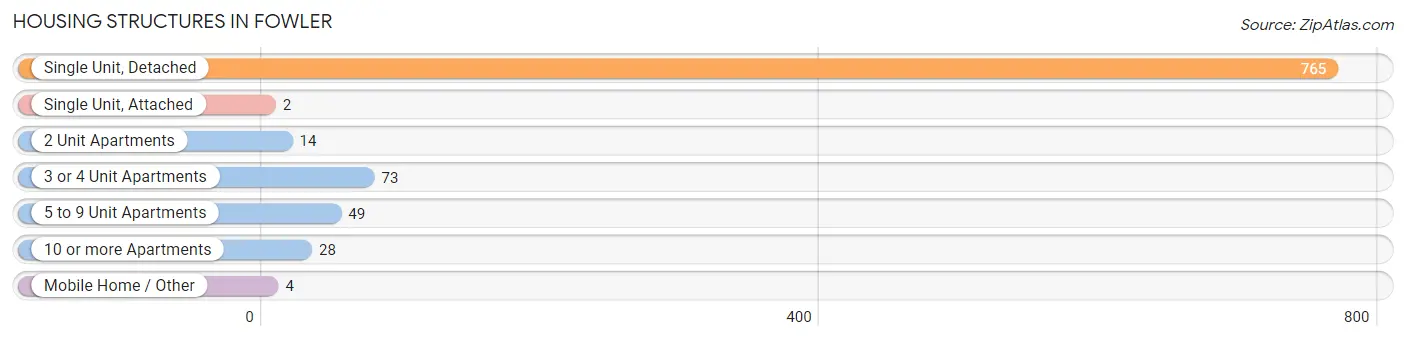
| Structure Type | # Housing Units | % Housing Units |
| Single Unit, Detached | 765 | 81.8% |
| Single Unit, Attached | 2 | 0.2% |
| 2 Unit Apartments | 14 | 1.5% |
| 3 or 4 Unit Apartments | 73 | 7.8% |
| 5 to 9 Unit Apartments | 49 | 5.2% |
| 10 or more Apartments | 28 | 3.0% |
| Mobile Home / Other | 4 | 0.4% |
| Total | 935 | 100.0% |
Housing Structures by Occupancy in Fowler
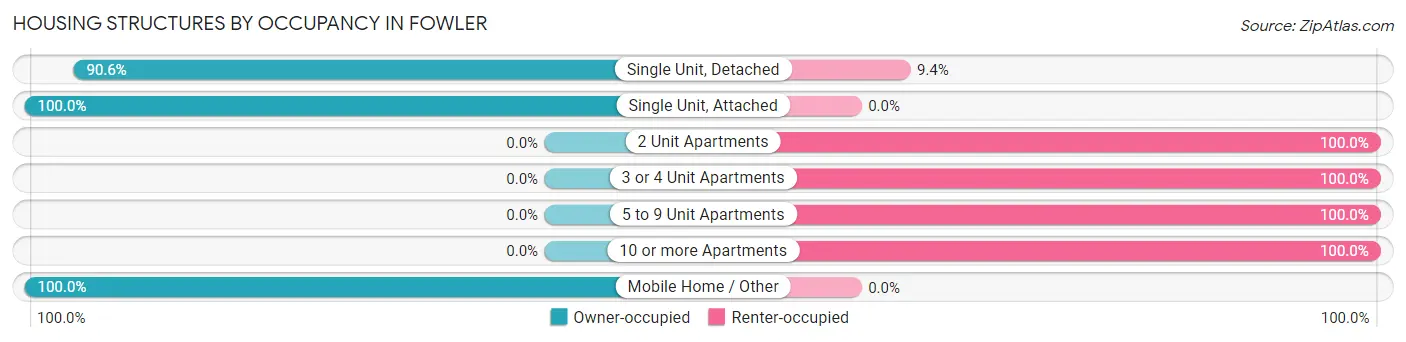
| Structure Type | Owner-occupied | Renter-occupied |
| Single Unit, Detached | 693 (90.6%) | 72 (9.4%) |
| Single Unit, Attached | 2 (100.0%) | 0 (0.0%) |
| 2 Unit Apartments | 0 (0.0%) | 14 (100.0%) |
| 3 or 4 Unit Apartments | 0 (0.0%) | 73 (100.0%) |
| 5 to 9 Unit Apartments | 0 (0.0%) | 49 (100.0%) |
| 10 or more Apartments | 0 (0.0%) | 28 (100.0%) |
| Mobile Home / Other | 4 (100.0%) | 0 (0.0%) |
| Total | 699 (74.8%) | 236 (25.2%) |
Housing Structures by Number of Rooms in Fowler
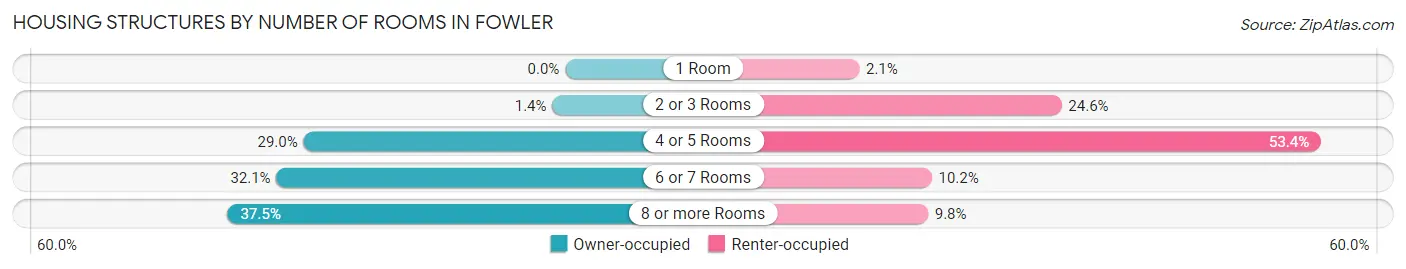
| Number of Rooms | Owner-occupied | Renter-occupied |
| 1 Room | 0 (0.0%) | 5 (2.1%) |
| 2 or 3 Rooms | 10 (1.4%) | 58 (24.6%) |
| 4 or 5 Rooms | 203 (29.0%) | 126 (53.4%) |
| 6 or 7 Rooms | 224 (32.1%) | 24 (10.2%) |
| 8 or more Rooms | 262 (37.5%) | 23 (9.8%) |
| Total | 699 (100.0%) | 236 (100.0%) |
Housing Structure by Heating Type in Fowler
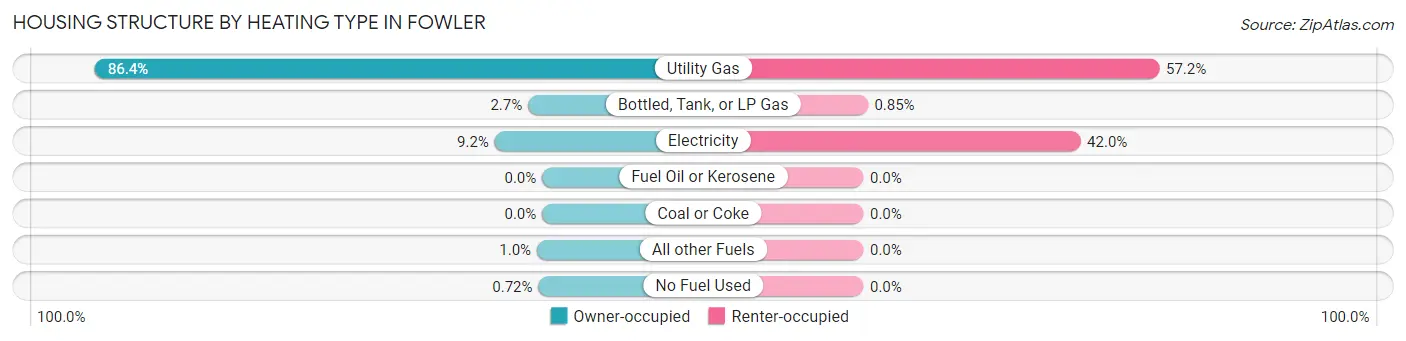
| Heating Type | Owner-occupied | Renter-occupied |
| Utility Gas | 604 (86.4%) | 135 (57.2%) |
| Bottled, Tank, or LP Gas | 19 (2.7%) | 2 (0.9%) |
| Electricity | 64 (9.2%) | 99 (41.9%) |
| Fuel Oil or Kerosene | 0 (0.0%) | 0 (0.0%) |
| Coal or Coke | 0 (0.0%) | 0 (0.0%) |
| All other Fuels | 7 (1.0%) | 0 (0.0%) |
| No Fuel Used | 5 (0.7%) | 0 (0.0%) |
| Total | 699 (100.0%) | 236 (100.0%) |
Household Vehicle Usage in Fowler
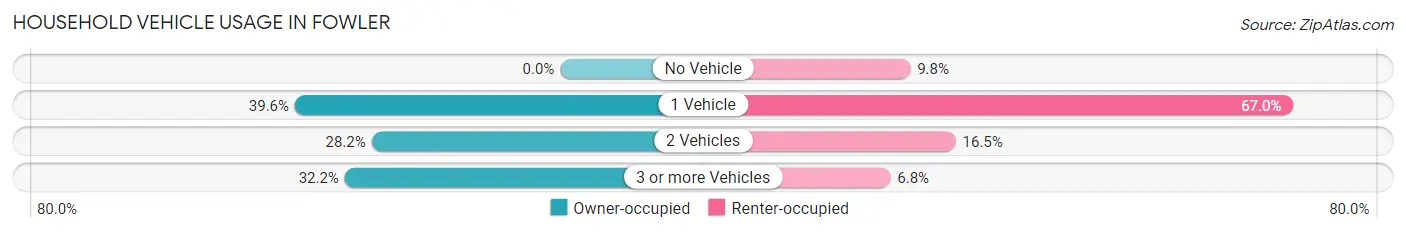
| Vehicles per Household | Owner-occupied | Renter-occupied |
| No Vehicle | 0 (0.0%) | 23 (9.8%) |
| 1 Vehicle | 277 (39.6%) | 158 (66.9%) |
| 2 Vehicles | 197 (28.2%) | 39 (16.5%) |
| 3 or more Vehicles | 225 (32.2%) | 16 (6.8%) |
| Total | 699 (100.0%) | 236 (100.0%) |
Real Estate & Mortgages in Fowler
Real Estate and Mortgage Overview in Fowler
| Characteristic | Without Mortgage | With Mortgage |
| Housing Units | 333 | 366 |
| Median Property Value | $101,900 | $107,500 |
| Median Household Income | $49,659 | $31 |
| Monthly Housing Costs | $450 | $0 |
| Real Estate Taxes | $793 | $4 |
Property Value by Mortgage Status in Fowler
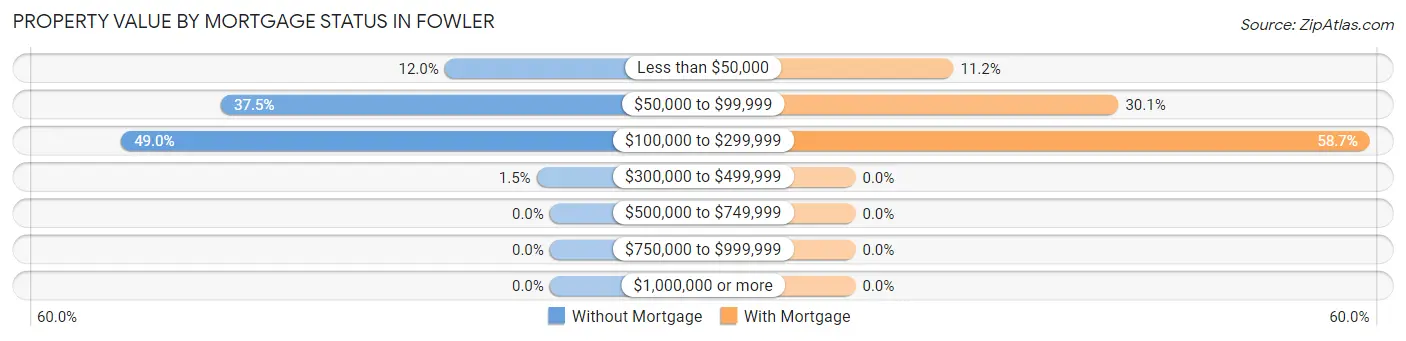
| Property Value | Without Mortgage | With Mortgage |
| Less than $50,000 | 40 (12.0%) | 41 (11.2%) |
| $50,000 to $99,999 | 125 (37.5%) | 110 (30.0%) |
| $100,000 to $299,999 | 163 (48.9%) | 215 (58.7%) |
| $300,000 to $499,999 | 5 (1.5%) | 0 (0.0%) |
| $500,000 to $749,999 | 0 (0.0%) | 0 (0.0%) |
| $750,000 to $999,999 | 0 (0.0%) | 0 (0.0%) |
| $1,000,000 or more | 0 (0.0%) | 0 (0.0%) |
| Total | 333 (100.0%) | 366 (100.0%) |
Household Income by Mortgage Status in Fowler
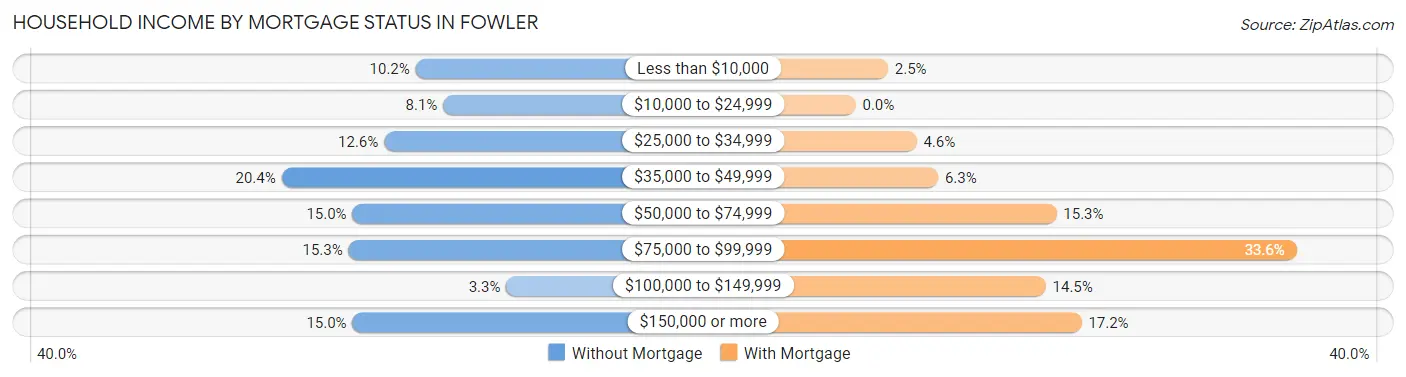
| Household Income | Without Mortgage | With Mortgage |
| Less than $10,000 | 34 (10.2%) | 9 (2.5%) |
| $10,000 to $24,999 | 27 (8.1%) | 0 (0.0%) |
| $25,000 to $34,999 | 42 (12.6%) | 17 (4.6%) |
| $35,000 to $49,999 | 68 (20.4%) | 23 (6.3%) |
| $50,000 to $74,999 | 50 (15.0%) | 56 (15.3%) |
| $75,000 to $99,999 | 51 (15.3%) | 123 (33.6%) |
| $100,000 to $149,999 | 11 (3.3%) | 53 (14.5%) |
| $150,000 or more | 50 (15.0%) | 63 (17.2%) |
| Total | 333 (100.0%) | 366 (100.0%) |
Property Value to Household Income Ratio in Fowler
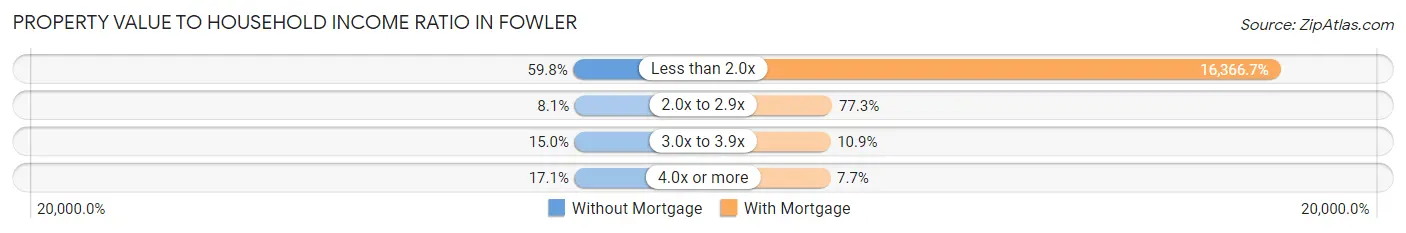
| Value-to-Income Ratio | Without Mortgage | With Mortgage |
| Less than 2.0x | 199 (59.8%) | 59,902 (16,366.7%) |
| 2.0x to 2.9x | 27 (8.1%) | 283 (77.3%) |
| 3.0x to 3.9x | 50 (15.0%) | 40 (10.9%) |
| 4.0x or more | 57 (17.1%) | 28 (7.6%) |
| Total | 333 (100.0%) | 366 (100.0%) |
Real Estate Taxes by Mortgage Status in Fowler
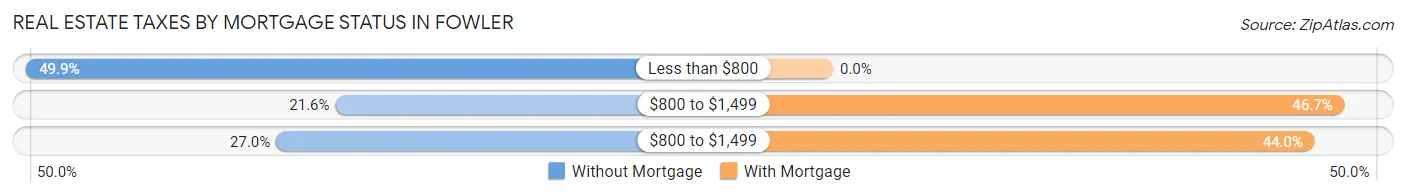
| Property Taxes | Without Mortgage | With Mortgage |
| Less than $800 | 166 (49.8%) | 0 (0.0%) |
| $800 to $1,499 | 72 (21.6%) | 171 (46.7%) |
| $800 to $1,499 | 90 (27.0%) | 161 (44.0%) |
| Total | 333 (100.0%) | 366 (100.0%) |
Health & Disability in Fowler
Health Insurance Coverage by Age in Fowler
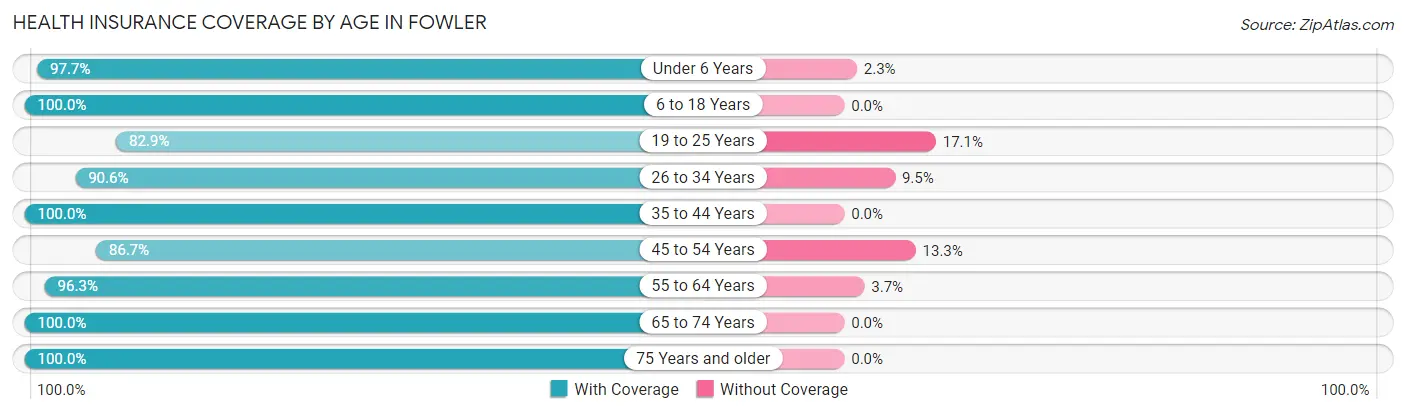
| Age Bracket | With Coverage | Without Coverage |
| Under 6 Years | 167 (97.7%) | 4 (2.3%) |
| 6 to 18 Years | 329 (100.0%) | 0 (0.0%) |
| 19 to 25 Years | 141 (82.9%) | 29 (17.1%) |
| 26 to 34 Years | 230 (90.5%) | 24 (9.5%) |
| 35 to 44 Years | 270 (100.0%) | 0 (0.0%) |
| 45 to 54 Years | 189 (86.7%) | 29 (13.3%) |
| 55 to 64 Years | 283 (96.3%) | 11 (3.7%) |
| 65 to 74 Years | 246 (100.0%) | 0 (0.0%) |
| 75 Years and older | 184 (100.0%) | 0 (0.0%) |
| Total | 2,039 (95.5%) | 97 (4.5%) |
Health Insurance Coverage by Citizenship Status in Fowler
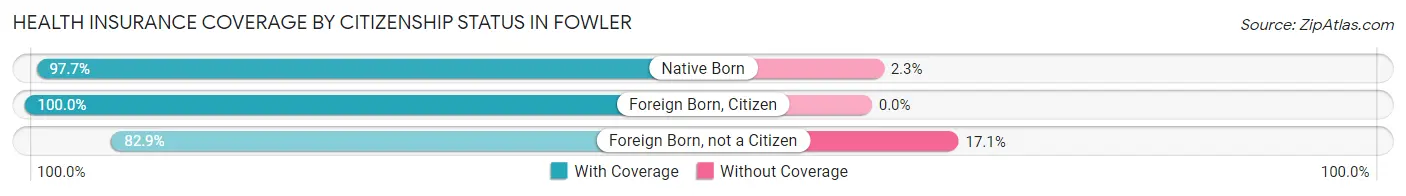
| Citizenship Status | With Coverage | Without Coverage |
| Native Born | 167 (97.7%) | 4 (2.3%) |
| Foreign Born, Citizen | 329 (100.0%) | 0 (0.0%) |
| Foreign Born, not a Citizen | 141 (82.9%) | 29 (17.1%) |
Health Insurance Coverage by Household Income in Fowler
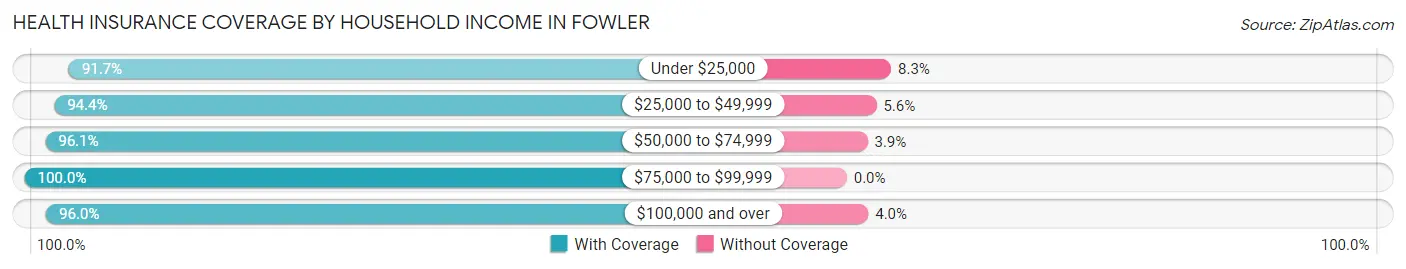
| Household Income | With Coverage | Without Coverage |
| Under $25,000 | 221 (91.7%) | 20 (8.3%) |
| $25,000 to $49,999 | 645 (94.4%) | 38 (5.6%) |
| $50,000 to $74,999 | 446 (96.1%) | 18 (3.9%) |
| $75,000 to $99,999 | 227 (100.0%) | 0 (0.0%) |
| $100,000 and over | 500 (96.0%) | 21 (4.0%) |
Public vs Private Health Insurance Coverage by Age in Fowler
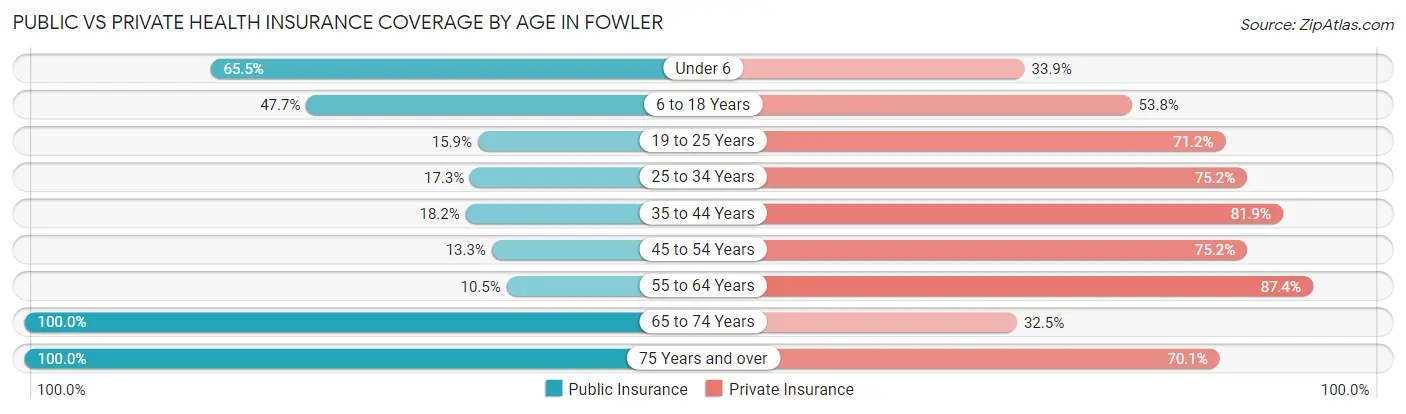
| Age Bracket | Public Insurance | Private Insurance |
| Under 6 | 112 (65.5%) | 58 (33.9%) |
| 6 to 18 Years | 157 (47.7%) | 177 (53.8%) |
| 19 to 25 Years | 27 (15.9%) | 121 (71.2%) |
| 25 to 34 Years | 44 (17.3%) | 191 (75.2%) |
| 35 to 44 Years | 49 (18.1%) | 221 (81.9%) |
| 45 to 54 Years | 29 (13.3%) | 164 (75.2%) |
| 55 to 64 Years | 31 (10.5%) | 257 (87.4%) |
| 65 to 74 Years | 246 (100.0%) | 80 (32.5%) |
| 75 Years and over | 184 (100.0%) | 129 (70.1%) |
| Total | 879 (41.1%) | 1,398 (65.4%) |
Disability Status by Sex by Age in Fowler
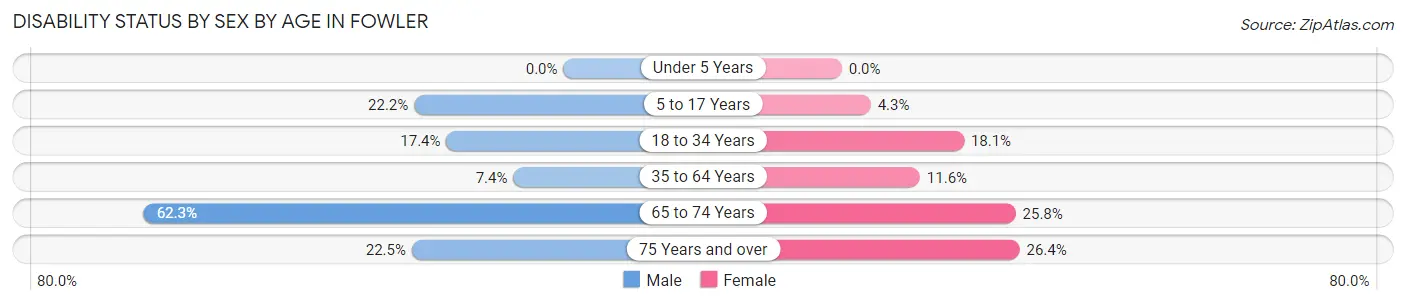
| Age Bracket | Male | Female |
| Under 5 Years | 0 (0.0%) | 0 (0.0%) |
| 5 to 17 Years | 39 (22.2%) | 7 (4.3%) |
| 18 to 34 Years | 37 (17.4%) | 39 (18.1%) |
| 35 to 64 Years | 28 (7.4%) | 47 (11.6%) |
| 65 to 74 Years | 76 (62.3%) | 32 (25.8%) |
| 75 Years and over | 9 (22.5%) | 38 (26.4%) |
Disability Class by Sex by Age in Fowler
Disability Class: Hearing Difficulty
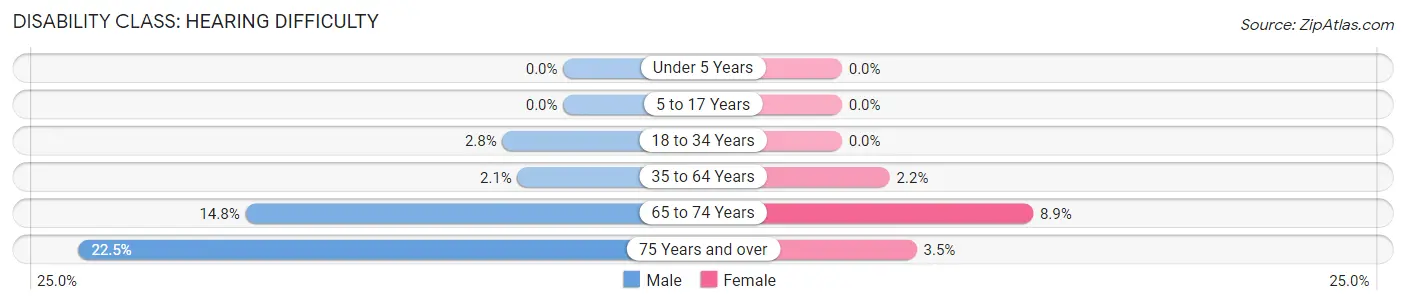
| Age Bracket | Male | Female |
| Under 5 Years | 0 (0.0%) | 0 (0.0%) |
| 5 to 17 Years | 0 (0.0%) | 0 (0.0%) |
| 18 to 34 Years | 6 (2.8%) | 0 (0.0%) |
| 35 to 64 Years | 8 (2.1%) | 9 (2.2%) |
| 65 to 74 Years | 18 (14.7%) | 11 (8.9%) |
| 75 Years and over | 9 (22.5%) | 5 (3.5%) |
Disability Class: Vision Difficulty
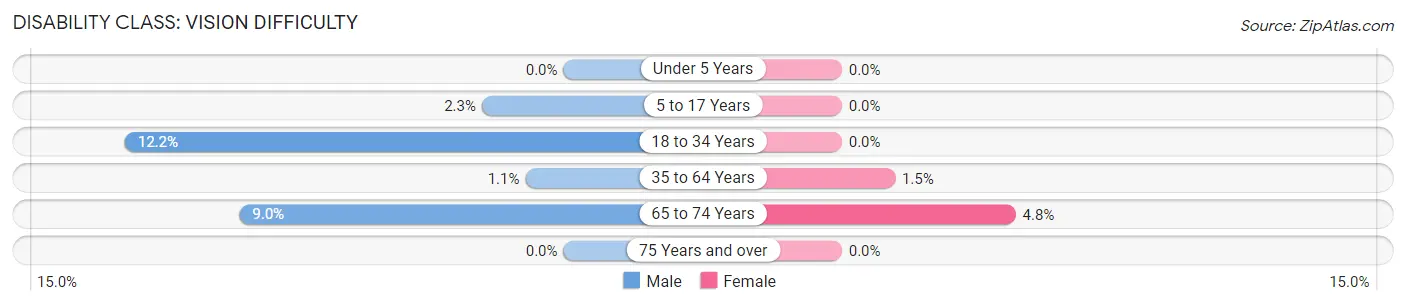
| Age Bracket | Male | Female |
| Under 5 Years | 0 (0.0%) | 0 (0.0%) |
| 5 to 17 Years | 4 (2.3%) | 0 (0.0%) |
| 18 to 34 Years | 26 (12.2%) | 0 (0.0%) |
| 35 to 64 Years | 4 (1.1%) | 6 (1.5%) |
| 65 to 74 Years | 11 (9.0%) | 6 (4.8%) |
| 75 Years and over | 0 (0.0%) | 0 (0.0%) |
Disability Class: Cognitive Difficulty
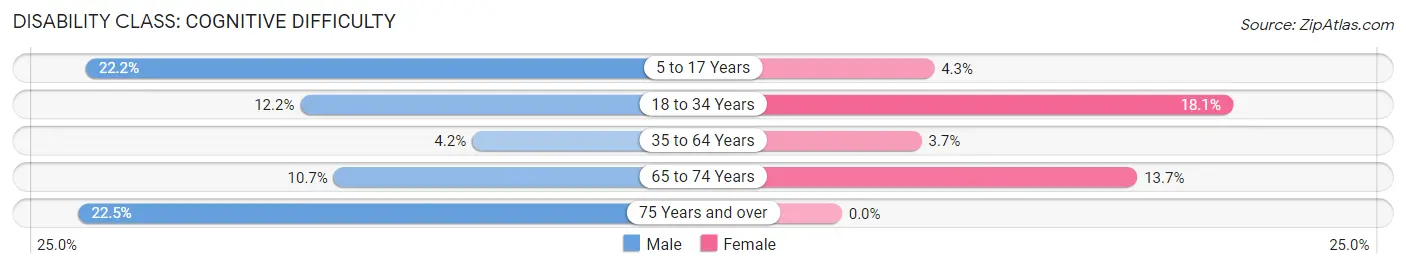
| Age Bracket | Male | Female |
| 5 to 17 Years | 39 (22.2%) | 7 (4.3%) |
| 18 to 34 Years | 26 (12.2%) | 39 (18.1%) |
| 35 to 64 Years | 16 (4.2%) | 15 (3.7%) |
| 65 to 74 Years | 13 (10.7%) | 17 (13.7%) |
| 75 Years and over | 9 (22.5%) | 0 (0.0%) |
Disability Class: Ambulatory Difficulty
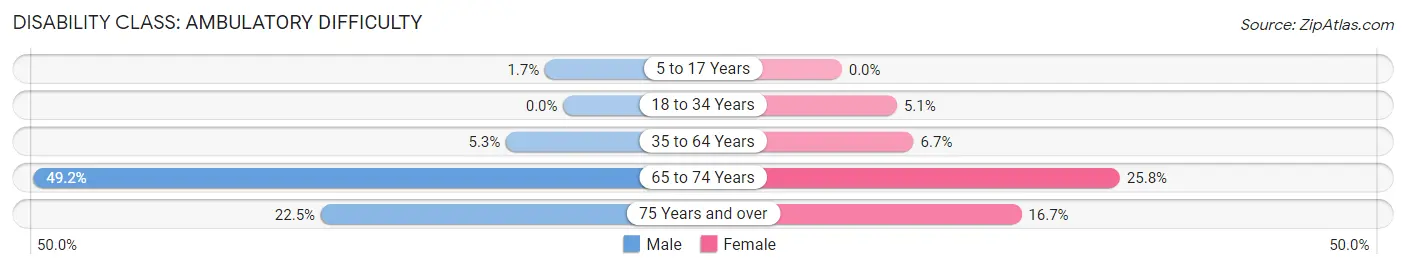
| Age Bracket | Male | Female |
| 5 to 17 Years | 3 (1.7%) | 0 (0.0%) |
| 18 to 34 Years | 0 (0.0%) | 11 (5.1%) |
| 35 to 64 Years | 20 (5.3%) | 27 (6.7%) |
| 65 to 74 Years | 60 (49.2%) | 32 (25.8%) |
| 75 Years and over | 9 (22.5%) | 24 (16.7%) |
Disability Class: Self-Care Difficulty
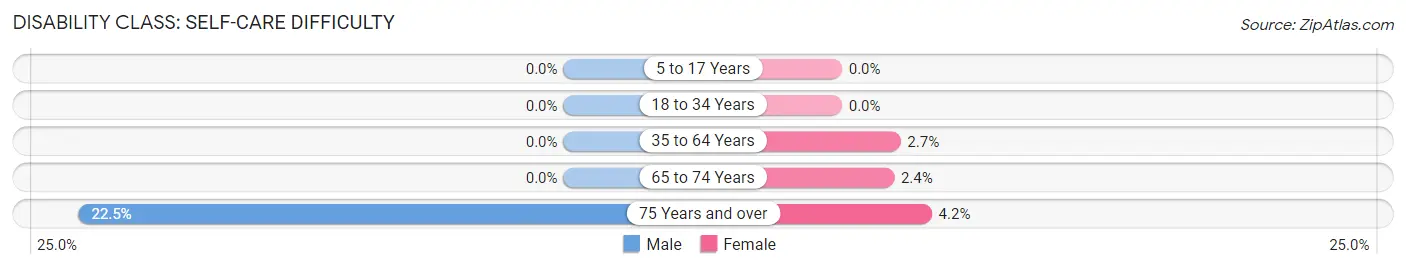
| Age Bracket | Male | Female |
| 5 to 17 Years | 0 (0.0%) | 0 (0.0%) |
| 18 to 34 Years | 0 (0.0%) | 0 (0.0%) |
| 35 to 64 Years | 0 (0.0%) | 11 (2.7%) |
| 65 to 74 Years | 0 (0.0%) | 3 (2.4%) |
| 75 Years and over | 9 (22.5%) | 6 (4.2%) |
Technology Access in Fowler
Computing Device Access in Fowler
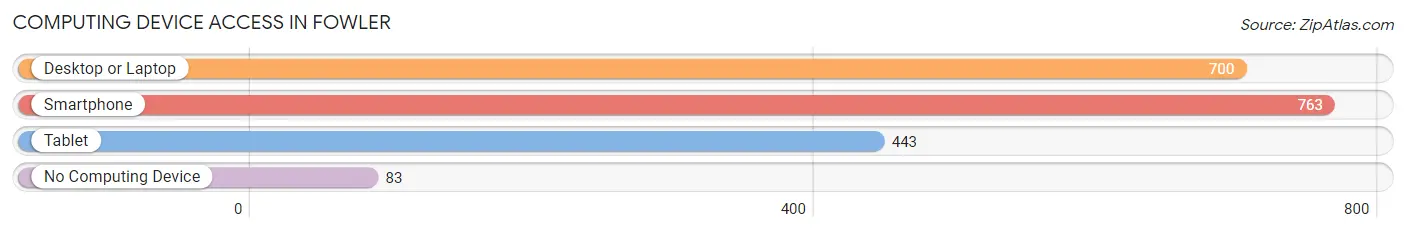
| Device Type | # Households | % Households |
| Desktop or Laptop | 700 | 74.9% |
| Smartphone | 763 | 81.6% |
| Tablet | 443 | 47.4% |
| No Computing Device | 83 | 8.9% |
| Total | 935 | 100.0% |
Internet Access in Fowler
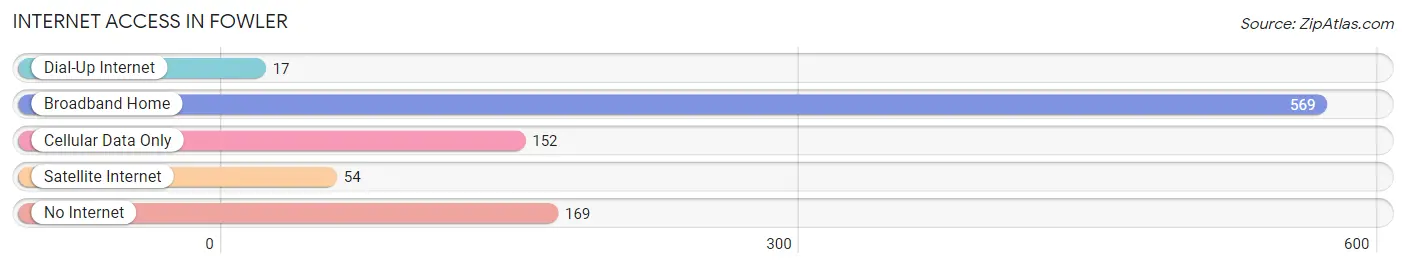
| Internet Type | # Households | % Households |
| Dial-Up Internet | 17 | 1.8% |
| Broadband Home | 569 | 60.9% |
| Cellular Data Only | 152 | 16.3% |
| Satellite Internet | 54 | 5.8% |
| No Internet | 169 | 18.1% |
| Total | 935 | 100.0% |
Fowler Summary
Fowler is a small town located in Benton County, Indiana. It is situated in the northwestern part of the state, approximately 40 miles north of Lafayette and 25 miles south of Logansport. The town was founded in 1851 and has a population of approximately 2,500 people.
History
Fowler was founded in 1851 by a group of settlers from Ohio. The town was named after one of the settlers, John Fowler. The town was originally a farming community, but it soon developed into a small industrial center. The first industry in Fowler was a sawmill, which was built in 1853. This was followed by a gristmill, a woolen mill, and a brickyard.
In the late 19th century, Fowler became a major center for the production of agricultural implements. The town was home to several factories, including the Fowler Plow Company, the Fowler Wagon Works, and the Fowler Harvester Company. These companies employed hundreds of people and helped to make Fowler a prosperous town.
Geography
Fowler is located in the northwestern part of Indiana, approximately 40 miles north of Lafayette and 25 miles south of Logansport. The town is situated in Benton County, which is part of the Tippecanoe River Valley. The town is surrounded by rolling hills and farmland. The Tippecanoe River runs through the town, providing a source of recreation for the residents.
Economy
Fowler’s economy is largely based on agriculture and manufacturing. The town is home to several factories, including the Fowler Plow Company, the Fowler Wagon Works, and the Fowler Harvester Company. These companies employ hundreds of people and help to make Fowler a prosperous town.
In addition to manufacturing, Fowler is also home to several small businesses. These include restaurants, retail stores, and service providers. The town also has a small airport, which serves as a hub for private and commercial flights.
Demographics
As of the 2010 census, Fowler had a population of 2,500 people. The racial makeup of the town was 95.2% White, 0.8% African American, 0.4% Native American, 0.4% Asian, 0.2% Pacific Islander, and 2.8% from other races. The median household income was $41,250, and the median family income was $50,000.
Fowler is a small town with a rich history and a strong sense of community. The town is home to several factories and businesses, and it is a popular destination for tourists and outdoor enthusiasts. The town is also home to a diverse population, with a variety of cultures and backgrounds.
Common Questions
What is Per Capita Income in Fowler?
Per Capita income in Fowler is $27,488.
What is the Median Family Income in Fowler?
Median Family Income in Fowler is $62,530.
What is the Median Household income in Fowler?
Median Household Income in Fowler is $49,495.
What is Income or Wage Gap in Fowler?
Income or Wage Gap in Fowler is 17.5%.
Women in Fowler earn 82.5 cents for every dollar earned by a man.
What is Family Income Deficit in Fowler?
Family Income Deficit in Fowler is $11,934.
Families that are below poverty line in Fowler earn $11,934 less on average than the poverty threshold level.
What is Inequality or Gini Index in Fowler?
Inequality or Gini Index in Fowler is 0.42.
What is the Total Population of Fowler?
Total Population of Fowler is 2,207.
What is the Total Male Population of Fowler?
Total Male Population of Fowler is 1,032.
What is the Total Female Population of Fowler?
Total Female Population of Fowler is 1,175.
What is the Ratio of Males per 100 Females in Fowler?
There are 87.83 Males per 100 Females in Fowler.
What is the Ratio of Females per 100 Males in Fowler?
There are 113.86 Females per 100 Males in Fowler.
What is the Median Population Age in Fowler?
Median Population Age in Fowler is 41.5 Years.
What is the Average Family Size in Fowler
Average Family Size in Fowler is 3.2 People.
What is the Average Household Size in Fowler
Average Household Size in Fowler is 2.3 People.
How Large is the Labor Force in Fowler?
There are 1,074 People in the Labor Forcein in Fowler.
What is the Percentage of People in the Labor Force in Fowler?
60.8% of People are in the Labor Force in Fowler.
What is the Unemployment Rate in Fowler?
Unemployment Rate in Fowler is 2.4%.