Aurora, IN Map & Demographics
Aurora Map
Aurora Overview
$25,508
PER CAPITA INCOME
$52,778
AVG FAMILY INCOME
$44,636
AVG HOUSEHOLD INCOME
38.2%
WAGE / INCOME GAP [ % ]
61.8¢/ $1
WAGE / INCOME GAP [ $ ]
0.44
INEQUALITY / GINI INDEX
3,301
TOTAL POPULATION
1,701
MALE POPULATION
1,600
FEMALE POPULATION
106.31
MALES / 100 FEMALES
94.06
FEMALES / 100 MALES
44.0
MEDIAN AGE
2.7
AVG FAMILY SIZE
2.2
AVG HOUSEHOLD SIZE
1,869
LABOR FORCE [ PEOPLE ]
68.1%
PERCENT IN LABOR FORCE
4.1%
UNEMPLOYMENT RATE
Aurora Zip Codes
Aurora Area Codes
Income in Aurora
Income Overview in Aurora
Per Capita Income in Aurora is $25,508, while median incomes of families and households are $52,778 and $44,636 respectively.
| Characteristic | Number | Measure |
| Per Capita Income | 3,301 | $25,508 |
| Median Family Income | 832 | $52,778 |
| Mean Family Income | 832 | $65,475 |
| Median Household Income | 1,529 | $44,636 |
| Mean Household Income | 1,529 | $56,954 |
| Income Deficit | 832 | $0 |
| Wage / Income Gap (%) | 3,301 | 38.23% |
| Wage / Income Gap ($) | 3,301 | 61.77¢ per $1 |
| Gini / Inequality Index | 3,301 | 0.44 |
Earnings by Sex in Aurora
Average Earnings in Aurora are $30,846, $40,543 for men and $25,045 for women, a difference of 38.2%.
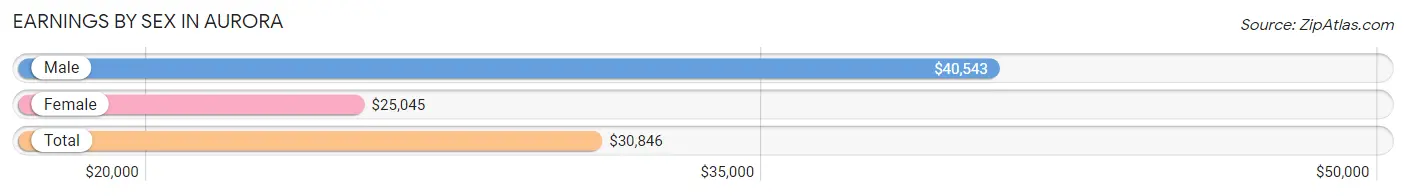
| Sex | Number | Average Earnings |
| Male | 1,080 (57.5%) | $40,543 |
| Female | 799 (42.5%) | $25,045 |
| Total | 1,879 (100.0%) | $30,846 |
Earnings by Sex by Income Bracket in Aurora
The most common earnings brackets in Aurora are $17,500 to $19,999 for men (154 | 14.3%) and $25,000 to $29,999 for women (87 | 10.9%).
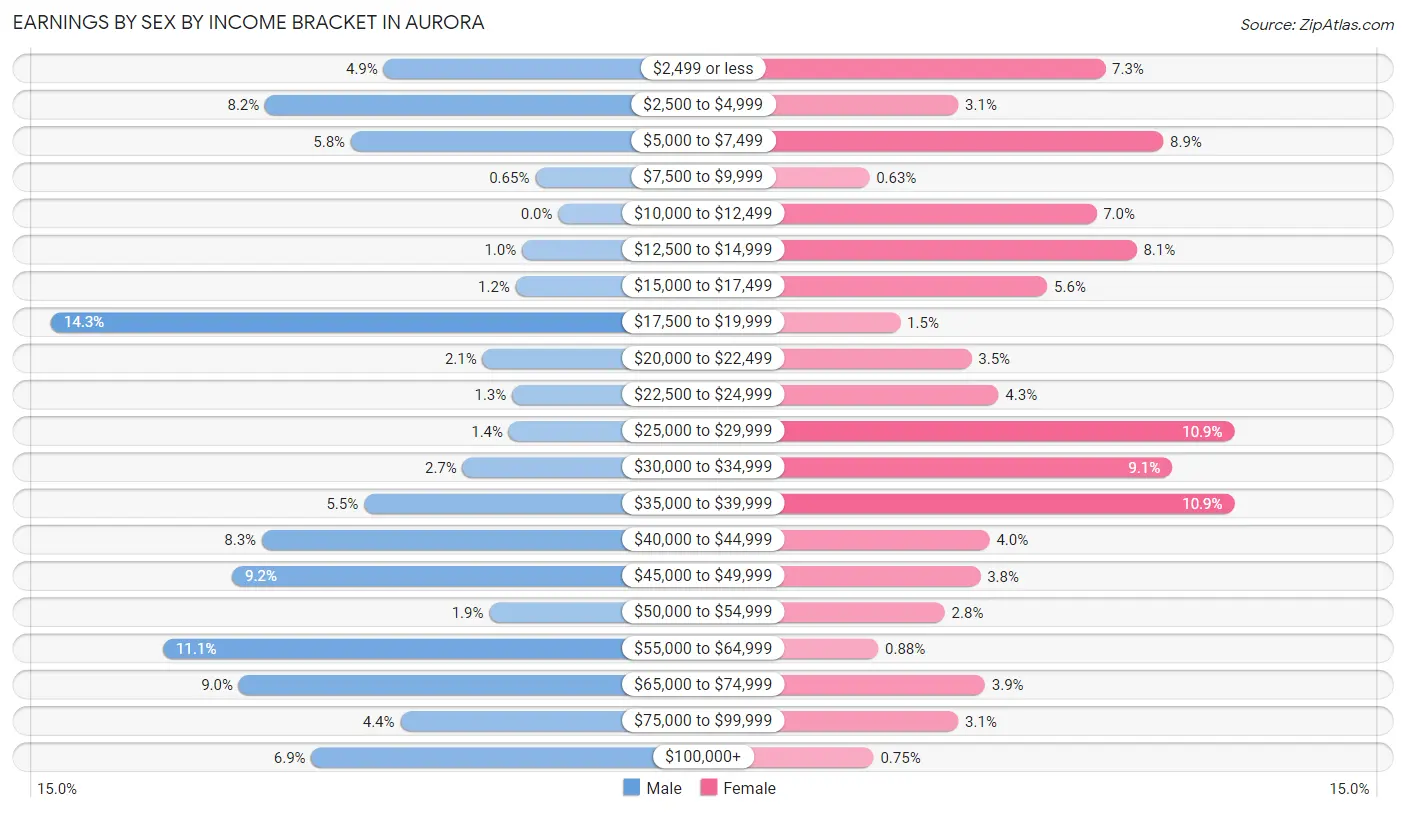
| Income | Male | Female |
| $2,499 or less | 53 (4.9%) | 58 (7.3%) |
| $2,500 to $4,999 | 89 (8.2%) | 25 (3.1%) |
| $5,000 to $7,499 | 63 (5.8%) | 71 (8.9%) |
| $7,500 to $9,999 | 7 (0.6%) | 5 (0.6%) |
| $10,000 to $12,499 | 0 (0.0%) | 56 (7.0%) |
| $12,500 to $14,999 | 11 (1.0%) | 65 (8.1%) |
| $15,000 to $17,499 | 13 (1.2%) | 45 (5.6%) |
| $17,500 to $19,999 | 154 (14.3%) | 12 (1.5%) |
| $20,000 to $22,499 | 23 (2.1%) | 28 (3.5%) |
| $22,500 to $24,999 | 14 (1.3%) | 34 (4.3%) |
| $25,000 to $29,999 | 15 (1.4%) | 87 (10.9%) |
| $30,000 to $34,999 | 29 (2.7%) | 73 (9.1%) |
| $35,000 to $39,999 | 59 (5.5%) | 87 (10.9%) |
| $40,000 to $44,999 | 90 (8.3%) | 32 (4.0%) |
| $45,000 to $49,999 | 99 (9.2%) | 30 (3.7%) |
| $50,000 to $54,999 | 21 (1.9%) | 22 (2.8%) |
| $55,000 to $64,999 | 120 (11.1%) | 7 (0.9%) |
| $65,000 to $74,999 | 97 (9.0%) | 31 (3.9%) |
| $75,000 to $99,999 | 48 (4.4%) | 25 (3.1%) |
| $100,000+ | 75 (6.9%) | 6 (0.7%) |
| Total | 1,080 (100.0%) | 799 (100.0%) |
Earnings by Sex by Educational Attainment in Aurora
Average earnings in Aurora are $43,693 for men and $28,534 for women, a difference of 34.7%. Men with an educational attainment of bachelor's degree enjoy the highest average annual earnings of $77,969, while those with high school diploma education earn the least with $33,611. Women with an educational attainment of bachelor's degree earn the most with the average annual earnings of $52,625, while those with less than high school education have the smallest earnings of $23,947.
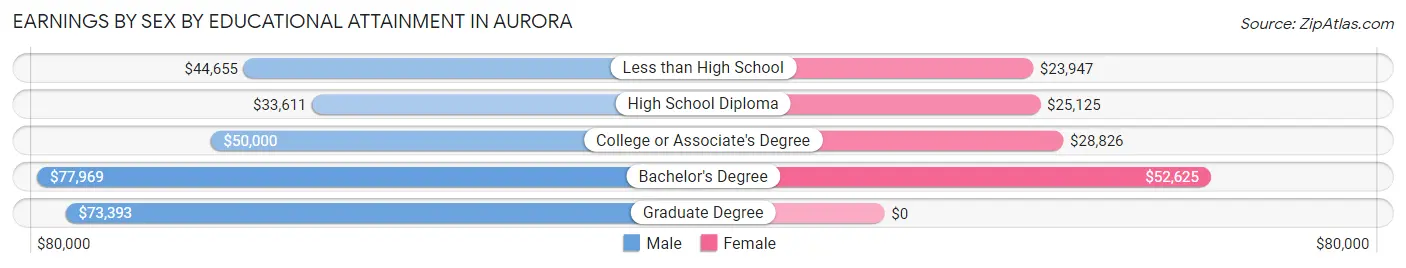
| Educational Attainment | Male Income | Female Income |
| Less than High School | $44,655 | $23,947 |
| High School Diploma | $33,611 | $25,125 |
| College or Associate's Degree | $50,000 | $28,826 |
| Bachelor's Degree | $77,969 | $52,625 |
| Graduate Degree | $73,393 | $0 |
| Total | $43,693 | $28,534 |
Family Income in Aurora
Family Income Brackets in Aurora
According to the Aurora family income data, there are 233 families falling into the $35,000 to $49,999 income range, which is the most common income bracket and makes up 28.0% of all families. Conversely, the $200,000+ income bracket is the least frequent group with only 13 families (1.6%) belonging to this category.
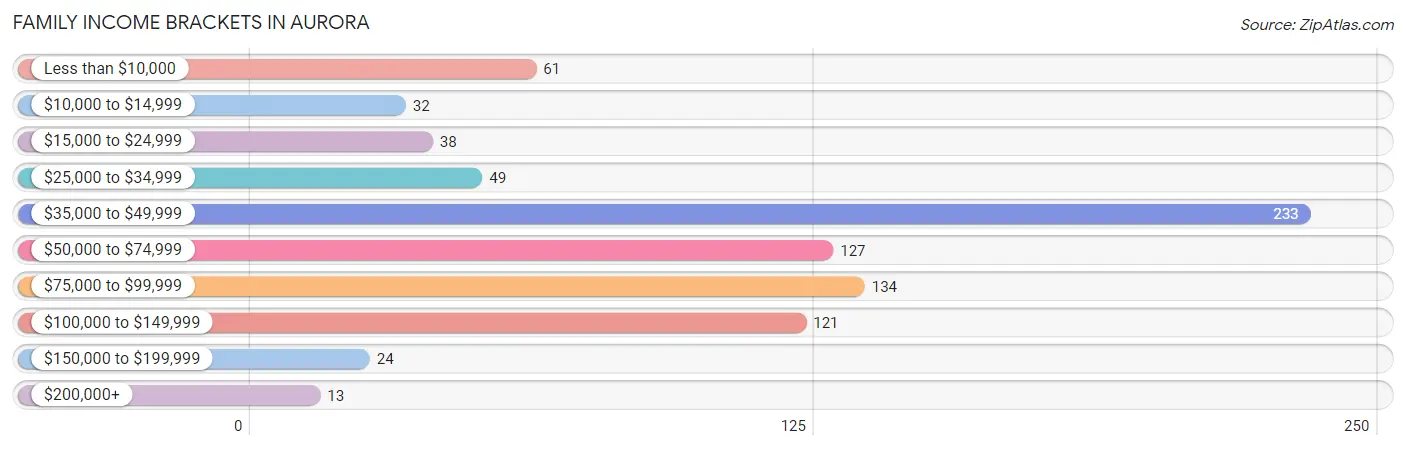
| Income Bracket | # Families | % Families |
| Less than $10,000 | 61 | 7.3% |
| $10,000 to $14,999 | 32 | 3.8% |
| $15,000 to $24,999 | 38 | 4.6% |
| $25,000 to $34,999 | 49 | 5.9% |
| $35,000 to $49,999 | 233 | 28.0% |
| $50,000 to $74,999 | 127 | 15.3% |
| $75,000 to $99,999 | 134 | 16.1% |
| $100,000 to $149,999 | 121 | 14.5% |
| $150,000 to $199,999 | 24 | 2.9% |
| $200,000+ | 13 | 1.6% |
Family Income by Famaliy Size in Aurora
6-person families (85 | 10.2%) account for the highest median family income in Aurora with $105,387 per family, while 4-person families (63 | 7.6%) have the highest median income of $22,131 per family member.
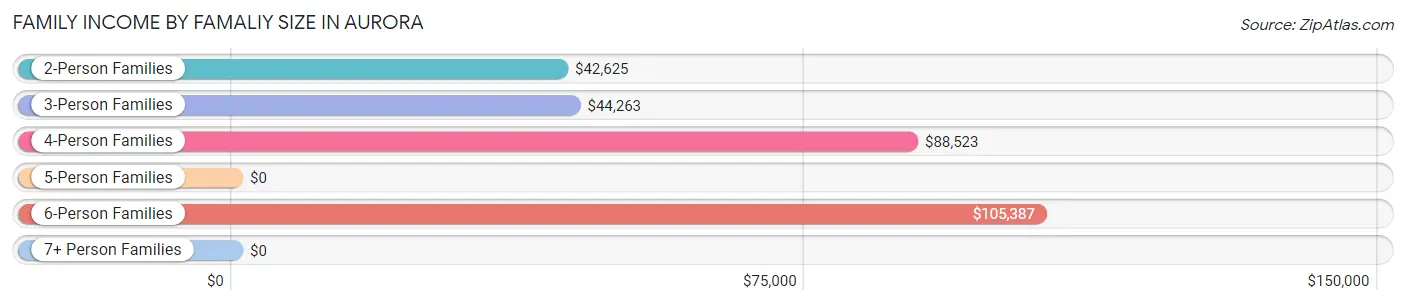
| Income Bracket | # Families | Median Income |
| 2-Person Families | 446 (53.6%) | $42,625 |
| 3-Person Families | 225 (27.0%) | $44,263 |
| 4-Person Families | 63 (7.6%) | $88,523 |
| 5-Person Families | 5 (0.6%) | $0 |
| 6-Person Families | 85 (10.2%) | $105,387 |
| 7+ Person Families | 8 (1.0%) | $0 |
| Total | 832 (100.0%) | $52,778 |
Family Income by Number of Earners in Aurora
The median family income in Aurora is $52,778, with families comprising 3+ earners (52) having the highest median family income of $138,500, while families with no earners (82) have the lowest median family income of $2,499, accounting for 6.2% and 9.9% of families, respectively.
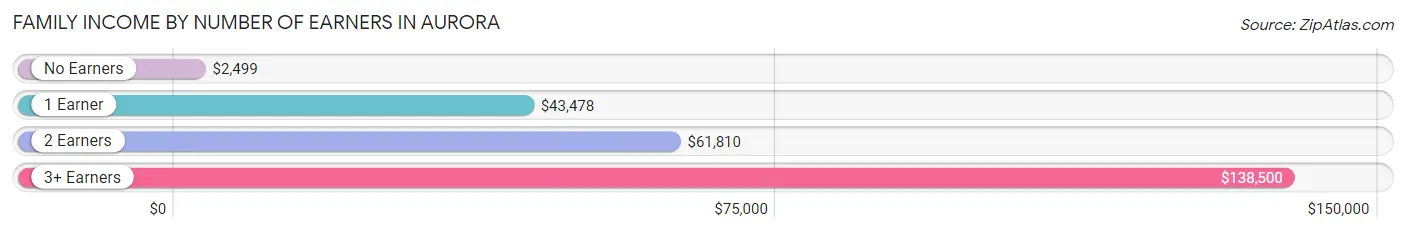
| Number of Earners | # Families | Median Income |
| No Earners | 82 (9.9%) | $2,499 |
| 1 Earner | 254 (30.5%) | $43,478 |
| 2 Earners | 444 (53.4%) | $61,810 |
| 3+ Earners | 52 (6.2%) | $138,500 |
| Total | 832 (100.0%) | $52,778 |
Household Income in Aurora
Household Income Brackets in Aurora
With 355 households falling in the category, the $35,000 to $49,999 income range is the most frequent in Aurora, accounting for 23.2% of all households. In contrast, only 24 households (1.6%) fall into the $200,000+ income bracket, making it the least populous group.
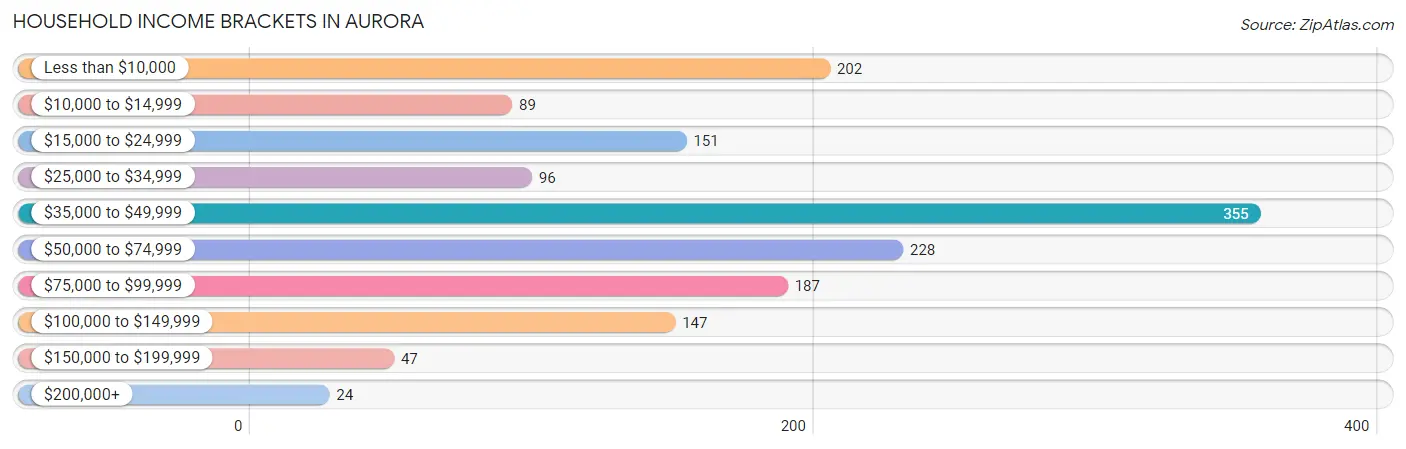
| Income Bracket | # Households | % Households |
| Less than $10,000 | 202 | 13.2% |
| $10,000 to $14,999 | 89 | 5.8% |
| $15,000 to $24,999 | 151 | 9.9% |
| $25,000 to $34,999 | 96 | 6.3% |
| $35,000 to $49,999 | 355 | 23.2% |
| $50,000 to $74,999 | 228 | 14.9% |
| $75,000 to $99,999 | 187 | 12.2% |
| $100,000 to $149,999 | 147 | 9.6% |
| $150,000 to $199,999 | 47 | 3.1% |
| $200,000+ | 24 | 1.6% |
Household Income by Householder Age in Aurora
The median household income in Aurora is $44,636, with the highest median household income of $49,120 found in the 25 to 44 years age bracket for the primary householder. A total of 481 households (31.5%) fall into this category. Meanwhile, the 15 to 24 years age bracket for the primary householder has the lowest median household income of $0, with 29 households (1.9%) in this group.
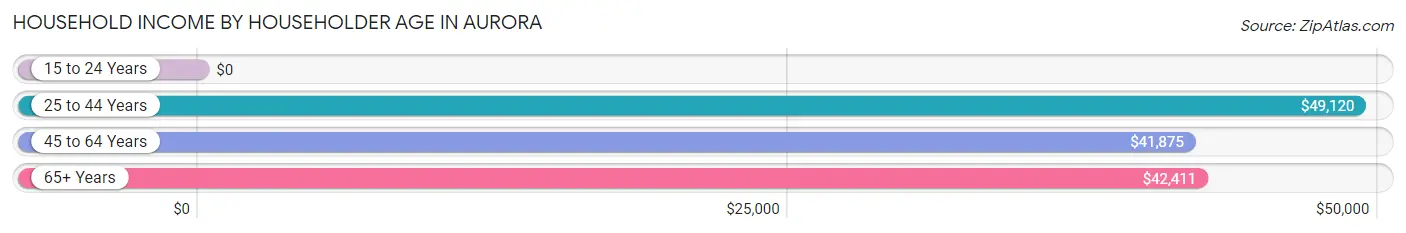
| Income Bracket | # Households | Median Income |
| 15 to 24 Years | 29 (1.9%) | $0 |
| 25 to 44 Years | 481 (31.5%) | $49,120 |
| 45 to 64 Years | 710 (46.4%) | $41,875 |
| 65+ Years | 309 (20.2%) | $42,411 |
| Total | 1,529 (100.0%) | $44,636 |
Poverty in Aurora
Income Below Poverty by Sex and Age in Aurora
With 16.7% poverty level for males and 27.7% for females among the residents of Aurora, 16 and 17 year old males and under 5 year old females are the most vulnerable to poverty, with 37 males (63.8%) and 39 females (88.6%) in their respective age groups living below the poverty level.
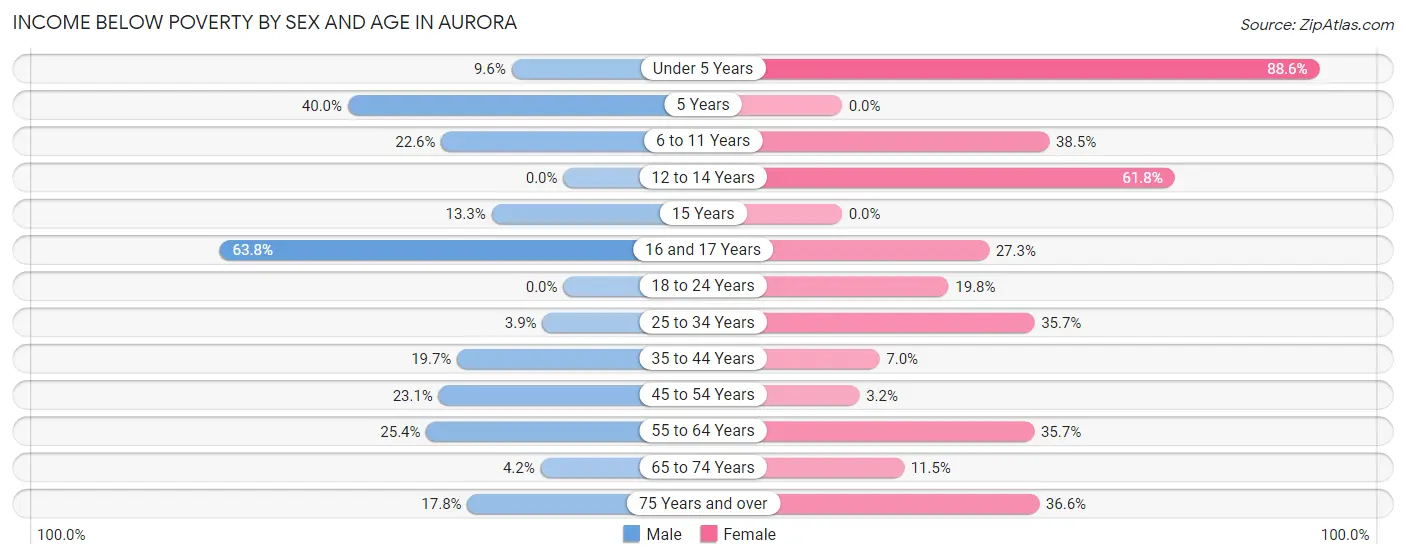
| Age Bracket | Male | Female |
| Under 5 Years | 5 (9.6%) | 39 (88.6%) |
| 5 Years | 12 (40.0%) | 0 (0.0%) |
| 6 to 11 Years | 12 (22.6%) | 40 (38.5%) |
| 12 to 14 Years | 0 (0.0%) | 42 (61.8%) |
| 15 Years | 6 (13.3%) | 0 (0.0%) |
| 16 and 17 Years | 37 (63.8%) | 12 (27.3%) |
| 18 to 24 Years | 0 (0.0%) | 18 (19.8%) |
| 25 to 34 Years | 8 (3.9%) | 85 (35.7%) |
| 35 to 44 Years | 26 (19.7%) | 14 (7.0%) |
| 45 to 54 Years | 56 (23.1%) | 6 (3.2%) |
| 55 to 64 Years | 103 (25.4%) | 122 (35.7%) |
| 65 to 74 Years | 6 (4.2%) | 10 (11.5%) |
| 75 Years and over | 13 (17.8%) | 45 (36.6%) |
| Total | 284 (16.7%) | 433 (27.7%) |
Income Above Poverty by Sex and Age in Aurora
According to the poverty statistics in Aurora, males aged 12 to 14 years and females aged 15 years are the age groups that are most secure financially, with 100.0% of males and 100.0% of females in these age groups living above the poverty line.
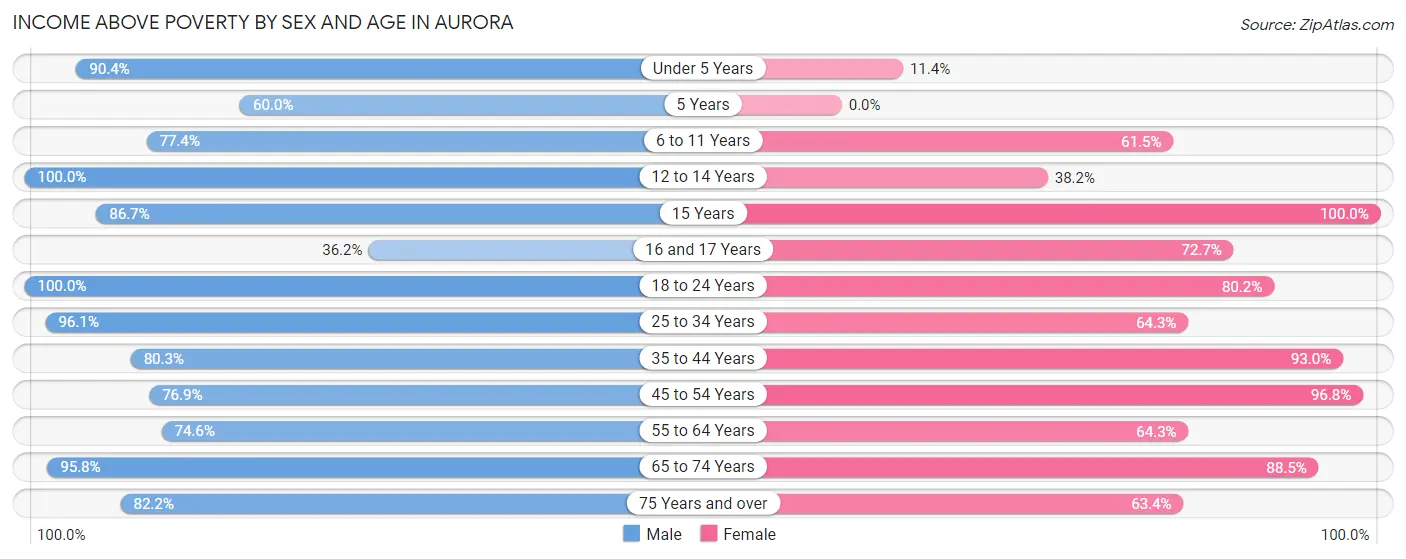
| Age Bracket | Male | Female |
| Under 5 Years | 47 (90.4%) | 5 (11.4%) |
| 5 Years | 18 (60.0%) | 0 (0.0%) |
| 6 to 11 Years | 41 (77.4%) | 64 (61.5%) |
| 12 to 14 Years | 87 (100.0%) | 26 (38.2%) |
| 15 Years | 39 (86.7%) | 35 (100.0%) |
| 16 and 17 Years | 21 (36.2%) | 32 (72.7%) |
| 18 to 24 Years | 176 (100.0%) | 73 (80.2%) |
| 25 to 34 Years | 198 (96.1%) | 153 (64.3%) |
| 35 to 44 Years | 106 (80.3%) | 187 (93.0%) |
| 45 to 54 Years | 186 (76.9%) | 179 (96.8%) |
| 55 to 64 Years | 302 (74.6%) | 220 (64.3%) |
| 65 to 74 Years | 136 (95.8%) | 77 (88.5%) |
| 75 Years and over | 60 (82.2%) | 78 (63.4%) |
| Total | 1,417 (83.3%) | 1,129 (72.3%) |
Income Below Poverty Among Married-Couple Families in Aurora
The poverty statistics for married-couple families in Aurora show that 1.1% or 6 of the total 523 families live below the poverty line. Families with 1 or 2 children have the highest poverty rate of 4.6%, comprising of 6 families. On the other hand, families with no children have the lowest poverty rate of 0.0%, which includes 0 families.
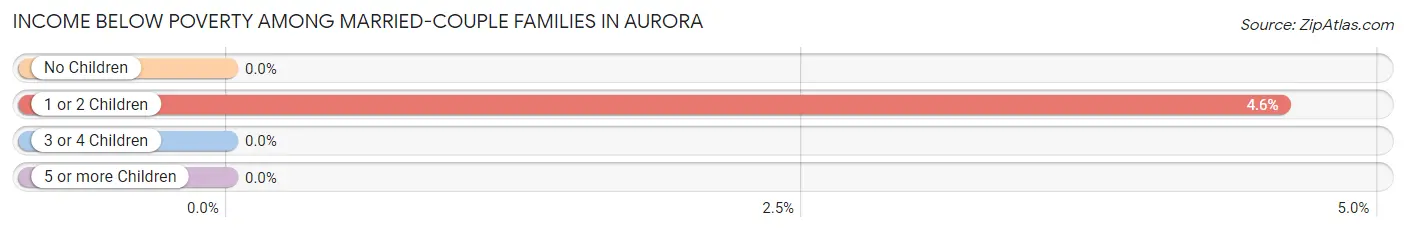
| Children | Above Poverty | Below Poverty |
| No Children | 348 (100.0%) | 0 (0.0%) |
| 1 or 2 Children | 125 (95.4%) | 6 (4.6%) |
| 3 or 4 Children | 36 (100.0%) | 0 (0.0%) |
| 5 or more Children | 8 (100.0%) | 0 (0.0%) |
| Total | 517 (98.9%) | 6 (1.1%) |
Income Below Poverty Among Single-Parent Households in Aurora
According to the poverty data in Aurora, 34.2% or 51 single-father households and 49.4% or 79 single-mother households are living below the poverty line. Among single-father households, those with 3 or 4 children have the highest poverty rate, with 8 households (100.0%) experiencing poverty. Likewise, among single-mother households, those with 3 or 4 children have the highest poverty rate, with 5 households (100.0%) falling below the poverty line.
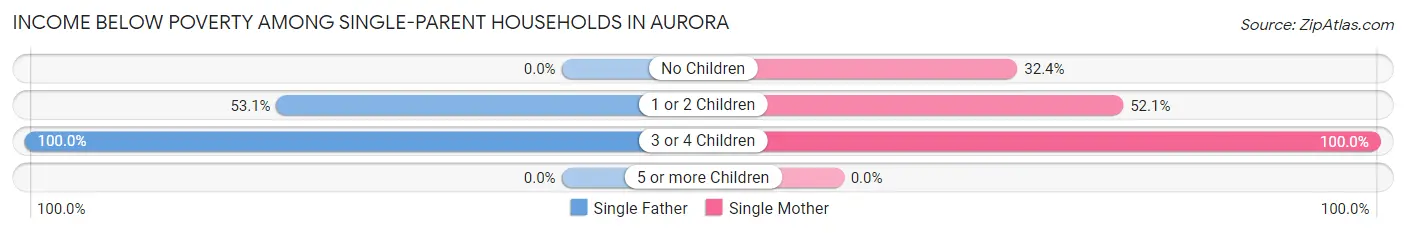
| Children | Single Father | Single Mother |
| No Children | 0 (0.0%) | 11 (32.4%) |
| 1 or 2 Children | 43 (53.1%) | 63 (52.1%) |
| 3 or 4 Children | 8 (100.0%) | 5 (100.0%) |
| 5 or more Children | 0 (0.0%) | 0 (0.0%) |
| Total | 51 (34.2%) | 79 (49.4%) |
Income Below Poverty Among Married-Couple vs Single-Parent Households in Aurora
The poverty data for Aurora shows that 6 of the married-couple family households (1.1%) and 130 of the single-parent households (42.1%) are living below the poverty level. Within the married-couple family households, those with 1 or 2 children have the highest poverty rate, with 6 households (4.6%) falling below the poverty line. Among the single-parent households, those with 3 or 4 children have the highest poverty rate, with 13 household (100.0%) living below poverty.
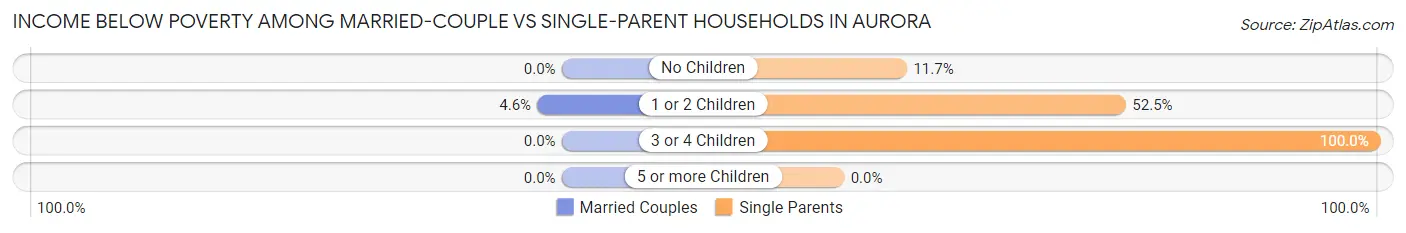
| Children | Married-Couple Families | Single-Parent Households |
| No Children | 0 (0.0%) | 11 (11.7%) |
| 1 or 2 Children | 6 (4.6%) | 106 (52.5%) |
| 3 or 4 Children | 0 (0.0%) | 13 (100.0%) |
| 5 or more Children | 0 (0.0%) | 0 (0.0%) |
| Total | 6 (1.1%) | 130 (42.1%) |
Race in Aurora
The most populous races in Aurora are White / Caucasian (2,800 | 84.8%), Two or more Races (356 | 10.8%), and Hispanic or Latino (179 | 5.4%).
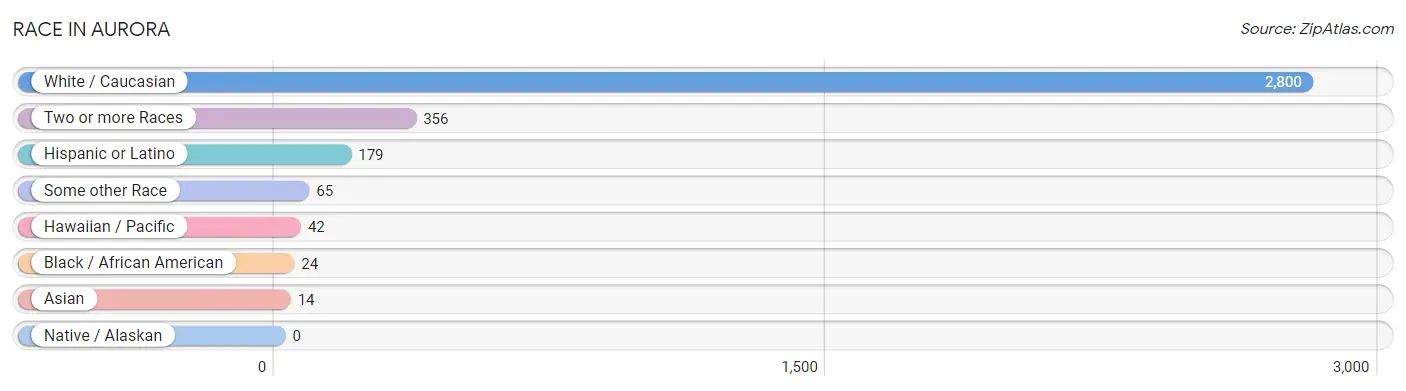
| Race | # Population | % Population |
| Asian | 14 | 0.4% |
| Black / African American | 24 | 0.7% |
| Hawaiian / Pacific | 42 | 1.3% |
| Hispanic or Latino | 179 | 5.4% |
| Native / Alaskan | 0 | 0.0% |
| White / Caucasian | 2,800 | 84.8% |
| Two or more Races | 356 | 10.8% |
| Some other Race | 65 | 2.0% |
| Total | 3,301 | 100.0% |
Ancestry in Aurora
The most populous ancestries reported in Aurora are German (921 | 27.9%), Irish (385 | 11.7%), English (312 | 9.5%), American (247 | 7.5%), and Mexican (179 | 5.4%), together accounting for 61.9% of all Aurora residents.
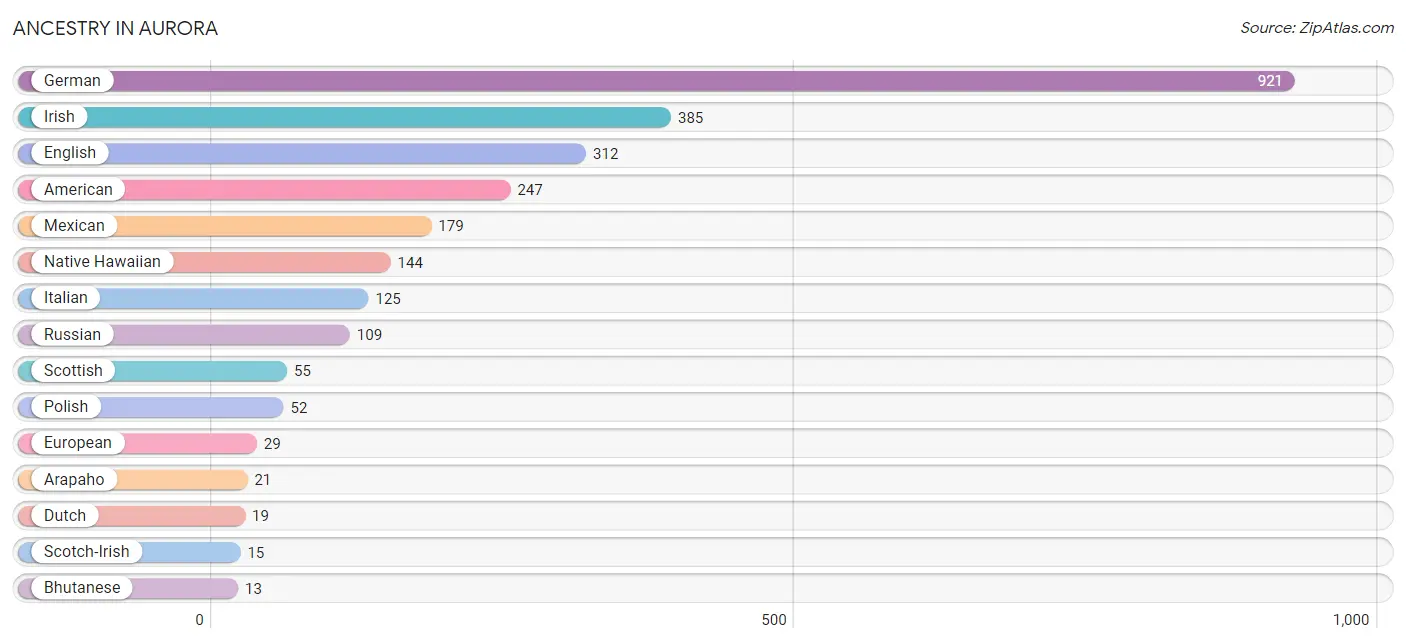
| Ancestry | # Population | % Population |
| American | 247 | 7.5% |
| Arapaho | 21 | 0.6% |
| Bhutanese | 13 | 0.4% |
| British | 11 | 0.3% |
| Cherokee | 8 | 0.2% |
| Dutch | 19 | 0.6% |
| Eastern European | 7 | 0.2% |
| English | 312 | 9.5% |
| European | 29 | 0.9% |
| French | 8 | 0.2% |
| French Canadian | 5 | 0.2% |
| German | 921 | 27.9% |
| Indonesian | 2 | 0.1% |
| Irish | 385 | 11.7% |
| Italian | 125 | 3.8% |
| Mexican | 179 | 5.4% |
| Native Hawaiian | 144 | 4.4% |
| Polish | 52 | 1.6% |
| Russian | 109 | 3.3% |
| Scotch-Irish | 15 | 0.4% |
| Scottish | 55 | 1.7% |
| Swedish | 7 | 0.2% |
| Thai | 12 | 0.4% |
| Welsh | 10 | 0.3% | View All 24 Rows |
Immigrants in Aurora
The most numerous immigrant groups reported in Aurora came from Central America (50 | 1.5%), Latin America (50 | 1.5%), Mexico (50 | 1.5%), Africa (12 | 0.4%), and South Africa (12 | 0.4%), together accounting for 5.2% of all Aurora residents.
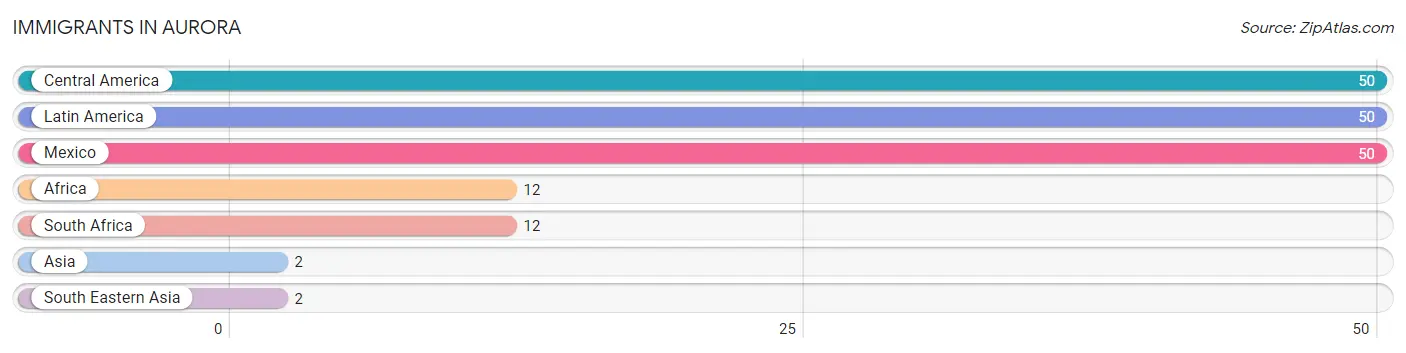
| Immigration Origin | # Population | % Population |
| Africa | 12 | 0.4% |
| Asia | 2 | 0.1% |
| Central America | 50 | 1.5% |
| Latin America | 50 | 1.5% |
| Mexico | 50 | 1.5% |
| South Africa | 12 | 0.4% |
| South Eastern Asia | 2 | 0.1% | View All 7 Rows |
Sex and Age in Aurora
Sex and Age in Aurora
The most populous age groups in Aurora are 55 to 59 Years (322 | 18.9%) for men and 60 to 64 Years (224 | 14.0%) for women.
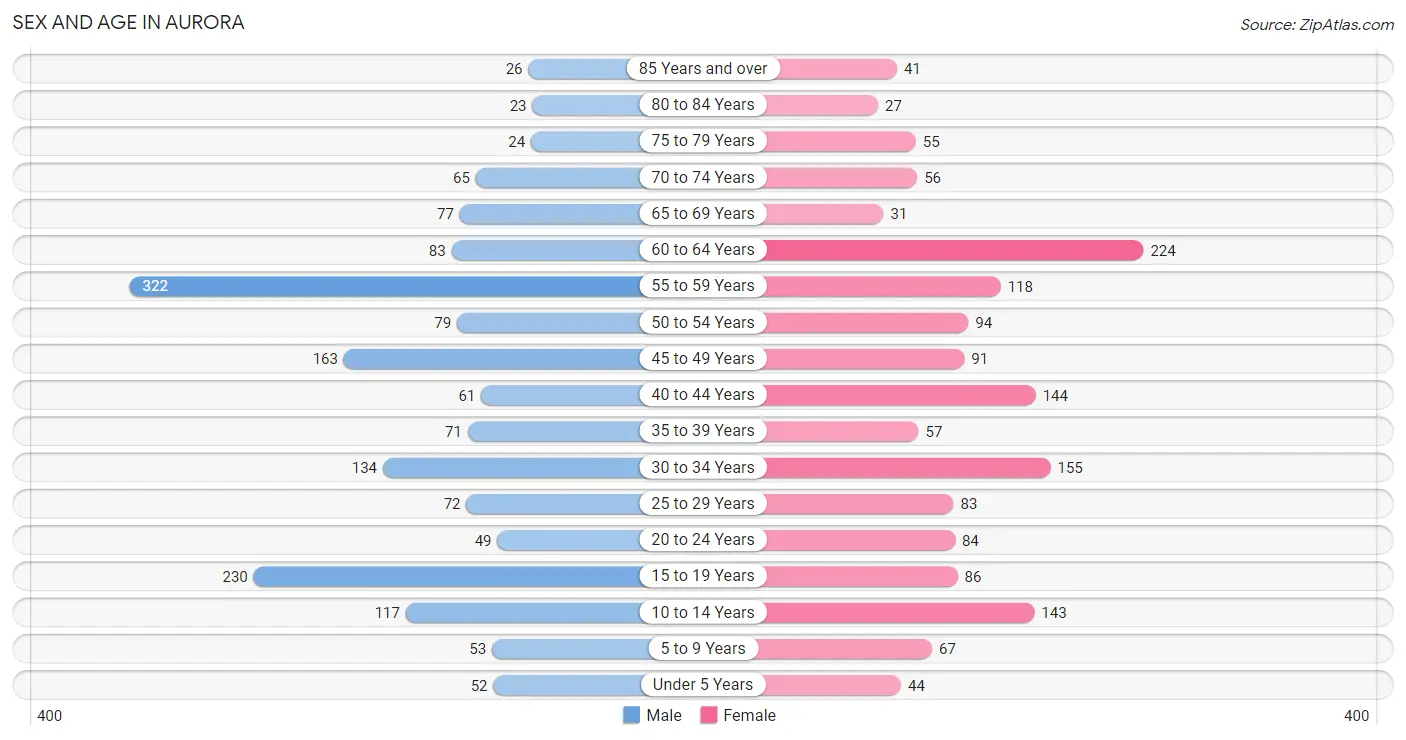
| Age Bracket | Male | Female |
| Under 5 Years | 52 (3.1%) | 44 (2.8%) |
| 5 to 9 Years | 53 (3.1%) | 67 (4.2%) |
| 10 to 14 Years | 117 (6.9%) | 143 (8.9%) |
| 15 to 19 Years | 230 (13.5%) | 86 (5.4%) |
| 20 to 24 Years | 49 (2.9%) | 84 (5.2%) |
| 25 to 29 Years | 72 (4.2%) | 83 (5.2%) |
| 30 to 34 Years | 134 (7.9%) | 155 (9.7%) |
| 35 to 39 Years | 71 (4.2%) | 57 (3.6%) |
| 40 to 44 Years | 61 (3.6%) | 144 (9.0%) |
| 45 to 49 Years | 163 (9.6%) | 91 (5.7%) |
| 50 to 54 Years | 79 (4.6%) | 94 (5.9%) |
| 55 to 59 Years | 322 (18.9%) | 118 (7.4%) |
| 60 to 64 Years | 83 (4.9%) | 224 (14.0%) |
| 65 to 69 Years | 77 (4.5%) | 31 (1.9%) |
| 70 to 74 Years | 65 (3.8%) | 56 (3.5%) |
| 75 to 79 Years | 24 (1.4%) | 55 (3.4%) |
| 80 to 84 Years | 23 (1.3%) | 27 (1.7%) |
| 85 Years and over | 26 (1.5%) | 41 (2.6%) |
| Total | 1,701 (100.0%) | 1,600 (100.0%) |
Families and Households in Aurora
Median Family Size in Aurora
The median family size in Aurora is 2.72 persons per family, with married-couple families (523 | 62.9%) accounting for the largest median family size of 2.85 persons per family. On the other hand, single male/father families (149 | 17.9%) represent the smallest median family size with 2.33 persons per family.
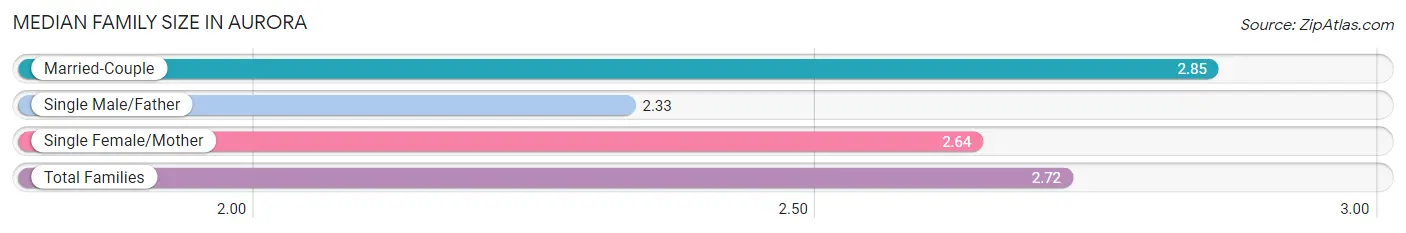
| Family Type | # Families | Family Size |
| Married-Couple | 523 (62.9%) | 2.85 |
| Single Male/Father | 149 (17.9%) | 2.33 |
| Single Female/Mother | 160 (19.2%) | 2.64 |
| Total Families | 832 (100.0%) | 2.72 |
Median Household Size in Aurora
The median household size in Aurora is 2.16 persons per household, with married-couple households (523 | 34.2%) accounting for the largest median household size of 2.87 persons per household. non-family households (697 | 45.6%) represent the smallest median household size with 1.40 persons per household.
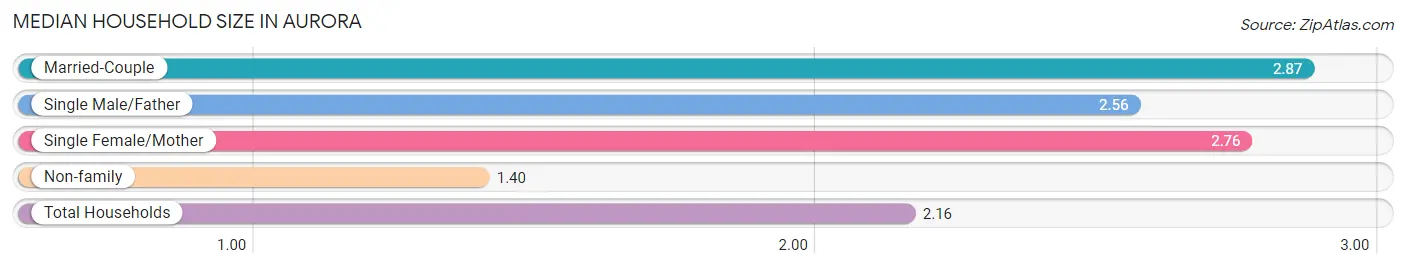
| Household Type | # Households | Household Size |
| Married-Couple | 523 (34.2%) | 2.87 |
| Single Male/Father | 149 (9.7%) | 2.56 |
| Single Female/Mother | 160 (10.5%) | 2.76 |
| Non-family | 697 (45.6%) | 1.40 |
| Total Households | 1,529 (100.0%) | 2.16 |
Household Size by Marriage Status in Aurora
Out of a total of 1,529 households in Aurora, 832 (54.4%) are family households, while 697 (45.6%) are nonfamily households. The most numerous type of family households are 2-person households, comprising 406, and the most common type of nonfamily households are 1-person households, comprising 495.
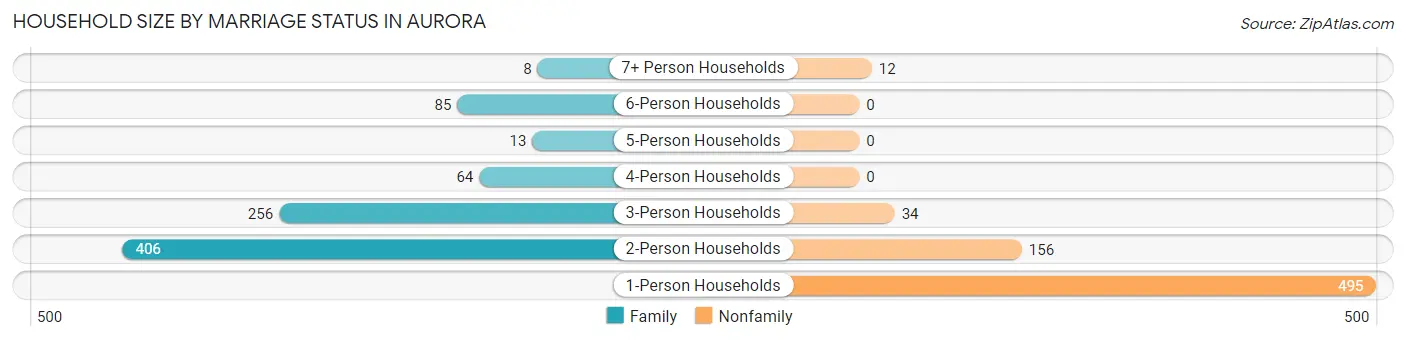
| Household Size | Family Households | Nonfamily Households |
| 1-Person Households | - | 495 (32.4%) |
| 2-Person Households | 406 (26.6%) | 156 (10.2%) |
| 3-Person Households | 256 (16.7%) | 34 (2.2%) |
| 4-Person Households | 64 (4.2%) | 0 (0.0%) |
| 5-Person Households | 13 (0.9%) | 0 (0.0%) |
| 6-Person Households | 85 (5.6%) | 0 (0.0%) |
| 7+ Person Households | 8 (0.5%) | 12 (0.8%) |
| Total | 832 (54.4%) | 697 (45.6%) |
Female Fertility in Aurora
Fertility by Age in Aurora
| Age Bracket | Women with Births | Births / 1,000 Women |
| 15 to 19 years | 0 (0.0%) | 0.0 |
| 20 to 34 years | 0 (0.0%) | 0.0 |
| 35 to 50 years | 0 (0.0%) | 0.0 |
| Total | 0 (0.0%) | 0.0 |
Fertility by Age by Marriage Status in Aurora
| Age Bracket | Married | Unmarried |
| 15 to 19 years | 0 (0.0%) | 0 (0.0%) |
| 20 to 34 years | 0 (0.0%) | 0 (0.0%) |
| 35 to 50 years | 0 (0.0%) | 0 (0.0%) |
| Total | 0 (0.0%) | 0 (0.0%) |
Fertility by Education in Aurora
| Educational Attainment | Women with Births | Births / 1,000 Women |
| Less than High School | 0 (0.0%) | 0.0 |
| High School Diploma | 0 (0.0%) | 0.0 |
| College or Associate's Degree | 0 (0.0%) | 0.0 |
| Bachelor's Degree | 0 (0.0%) | 0.0 |
| Graduate Degree | 0 (0.0%) | 0.0 |
| Total | 0 (0.0%) | 0.0 |
Fertility by Education by Marriage Status in Aurora
| Educational Attainment | Married | Unmarried |
| Less than High School | 0 (0.0%) | 0 (0.0%) |
| High School Diploma | 0 (0.0%) | 0 (0.0%) |
| College or Associate's Degree | 0 (0.0%) | 0 (0.0%) |
| Bachelor's Degree | 0 (0.0%) | 0 (0.0%) |
| Graduate Degree | 0 (0.0%) | 0 (0.0%) |
| Total | 0 (0.0%) | 0 (0.0%) |
Employment Characteristics in Aurora
Employment by Class of Employer in Aurora
Among the 1,712 employed individuals in Aurora, private company employees (1,344 | 78.5%), not-for-profit organizations (125 | 7.3%), and self-employed (incorporated) (96 | 5.6%) make up the most common classes of employment.
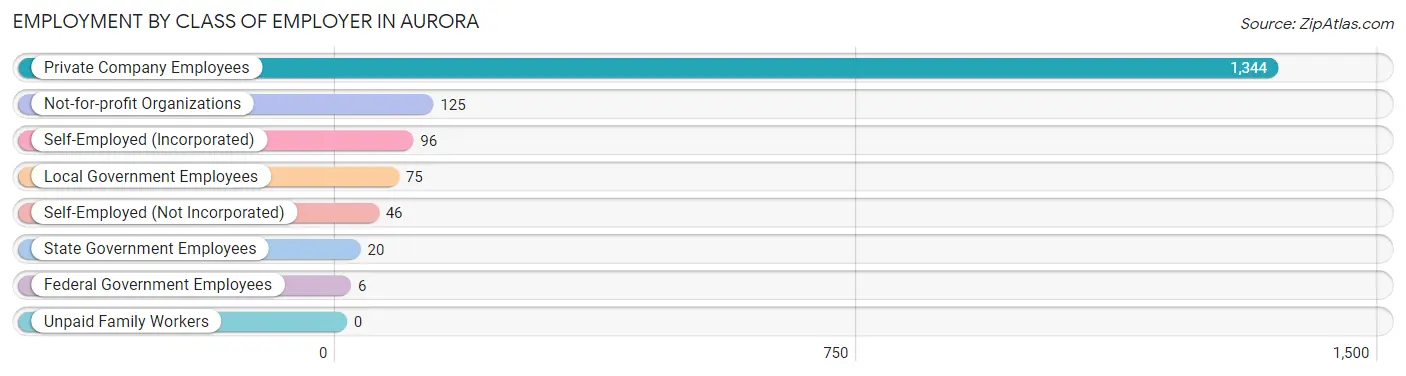
| Employer Class | # Employees | % Employees |
| Private Company Employees | 1,344 | 78.5% |
| Self-Employed (Incorporated) | 96 | 5.6% |
| Self-Employed (Not Incorporated) | 46 | 2.7% |
| Not-for-profit Organizations | 125 | 7.3% |
| Local Government Employees | 75 | 4.4% |
| State Government Employees | 20 | 1.2% |
| Federal Government Employees | 6 | 0.4% |
| Unpaid Family Workers | 0 | 0.0% |
| Total | 1,712 | 100.0% |
Employment Status by Age in Aurora
According to the labor force statistics for Aurora, out of the total population over 16 years of age (2,745), 68.1% or 1,869 individuals are in the labor force, with 4.1% or 77 of them unemployed. The age group with the highest labor force participation rate is 25 to 29 years, with 100.0% or 155 individuals in the labor force. Within the labor force, the 35 to 44 years age range has the highest percentage of unemployed individuals, with 18.5% or 50 of them being unemployed.
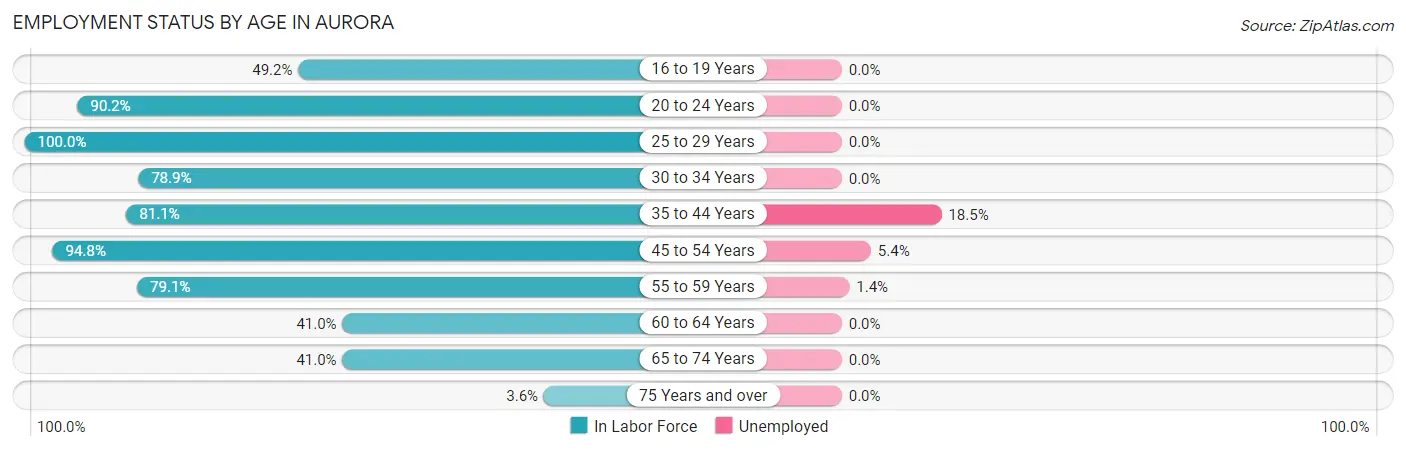
| Age Bracket | In Labor Force | Unemployed |
| 16 to 19 Years | 116 (49.2%) | 0 (0.0%) |
| 20 to 24 Years | 120 (90.2%) | 0 (0.0%) |
| 25 to 29 Years | 155 (100.0%) | 0 (0.0%) |
| 30 to 34 Years | 228 (78.9%) | 0 (0.0%) |
| 35 to 44 Years | 270 (81.1%) | 50 (18.5%) |
| 45 to 54 Years | 405 (94.8%) | 22 (5.4%) |
| 55 to 59 Years | 348 (79.1%) | 5 (1.4%) |
| 60 to 64 Years | 126 (41.0%) | 0 (0.0%) |
| 65 to 74 Years | 94 (41.0%) | 0 (0.0%) |
| 75 Years and over | 7 (3.6%) | 0 (0.0%) |
| Total | 1,869 (68.1%) | 77 (4.1%) |
Employment Status by Educational Attainment in Aurora
According to labor force statistics for Aurora, 78.5% of individuals (1,532) out of the total population between 25 and 64 years of age (1,951) are in the labor force, with 5.0% or 77 of them being unemployed. The group with the highest labor force participation rate are those with the educational attainment of bachelor's degree or higher, with 94.6% or 264 individuals in the labor force. Within the labor force, individuals with college / associate degree education have the highest percentage of unemployment, with 13.2% or 42 of them being unemployed.
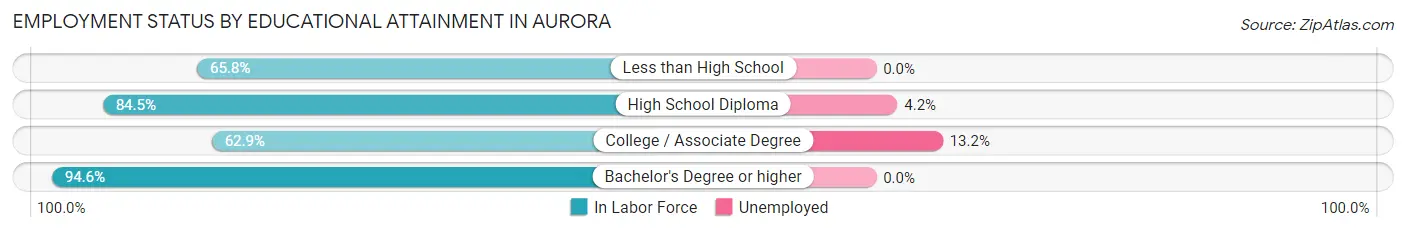
| Educational Attainment | In Labor Force | Unemployed |
| Less than High School | 127 (65.8%) | 0 (0.0%) |
| High School Diploma | 824 (84.5%) | 41 (4.2%) |
| College / Associate Degree | 317 (62.9%) | 67 (13.2%) |
| Bachelor's Degree or higher | 264 (94.6%) | 0 (0.0%) |
| Total | 1,532 (78.5%) | 98 (5.0%) |
Employment Occupations by Sex in Aurora
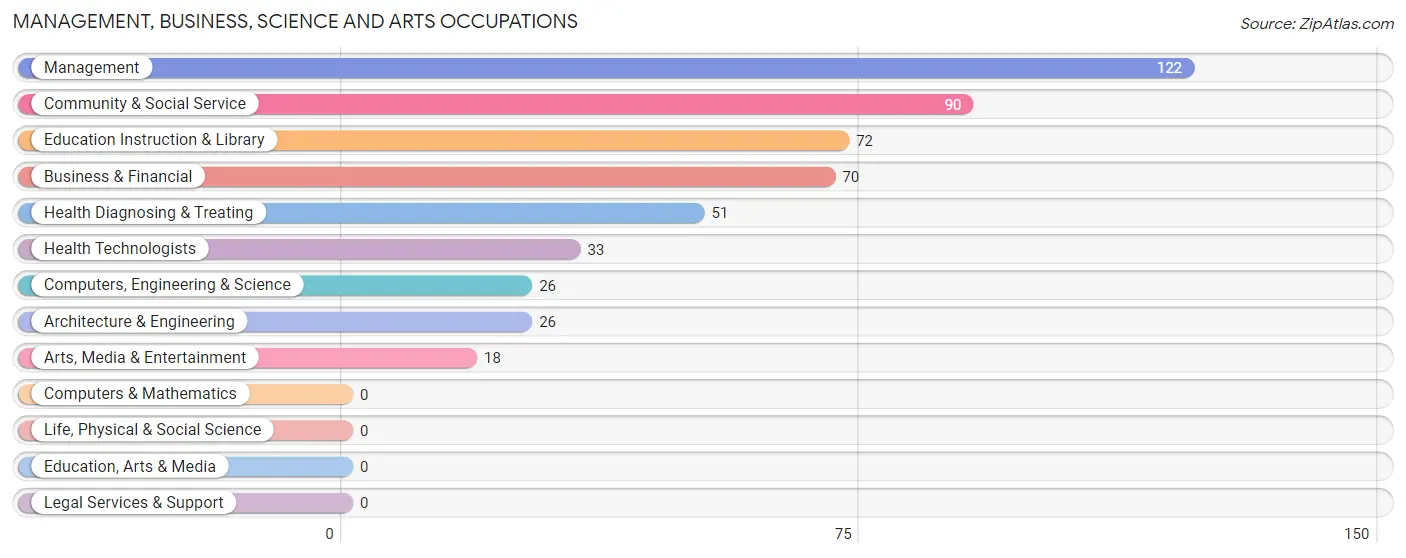
Management, Business, Science and Arts Occupations
The most common Management, Business, Science and Arts occupations in Aurora are Management (122 | 6.8%), Community & Social Service (90 | 5.0%), Education Instruction & Library (72 | 4.0%), Business & Financial (70 | 3.9%), and Health Diagnosing & Treating (51 | 2.9%).
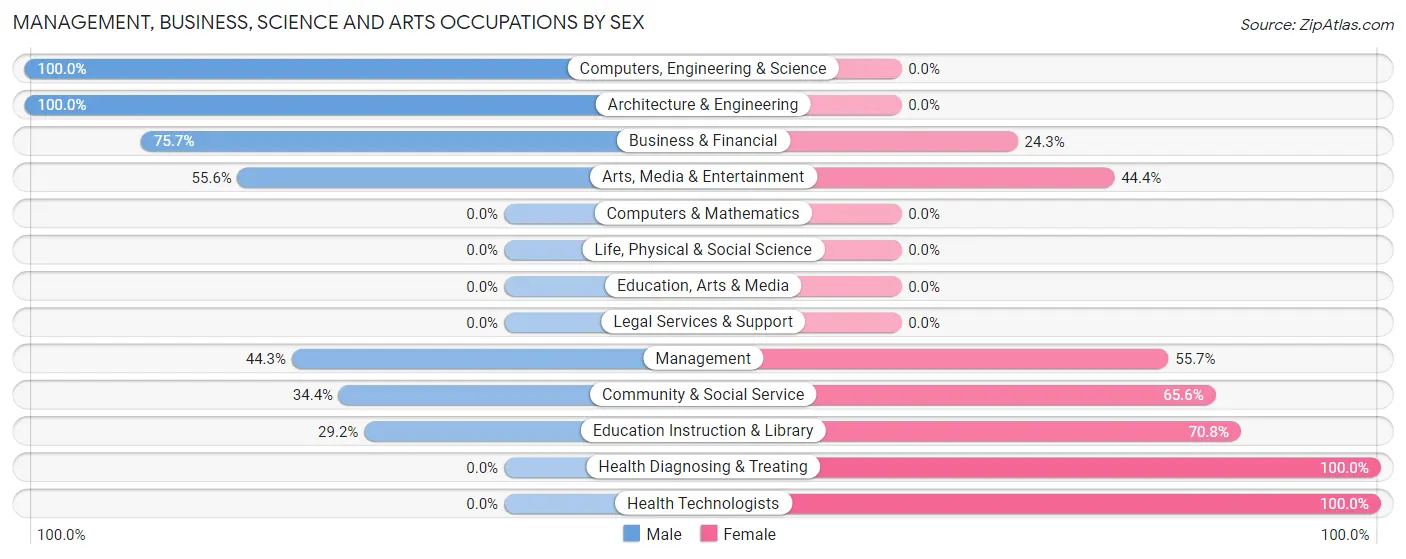
Management, Business, Science and Arts Occupations by Sex
Within the Management, Business, Science and Arts occupations in Aurora, the most male-oriented occupations are Computers, Engineering & Science (100.0%), Architecture & Engineering (100.0%), and Business & Financial (75.7%), while the most female-oriented occupations are Health Diagnosing & Treating (100.0%), Health Technologists (100.0%), and Education Instruction & Library (70.8%).
| Occupation | Male | Female |
| Management | 54 (44.3%) | 68 (55.7%) |
| Business & Financial | 53 (75.7%) | 17 (24.3%) |
| Computers, Engineering & Science | 26 (100.0%) | 0 (0.0%) |
| Computers & Mathematics | 0 (0.0%) | 0 (0.0%) |
| Architecture & Engineering | 26 (100.0%) | 0 (0.0%) |
| Life, Physical & Social Science | 0 (0.0%) | 0 (0.0%) |
| Community & Social Service | 31 (34.4%) | 59 (65.6%) |
| Education, Arts & Media | 0 (0.0%) | 0 (0.0%) |
| Legal Services & Support | 0 (0.0%) | 0 (0.0%) |
| Education Instruction & Library | 21 (29.2%) | 51 (70.8%) |
| Arts, Media & Entertainment | 10 (55.6%) | 8 (44.4%) |
| Health Diagnosing & Treating | 0 (0.0%) | 51 (100.0%) |
| Health Technologists | 0 (0.0%) | 33 (100.0%) |
| Total (Category) | 164 (45.7%) | 195 (54.3%) |
| Total (Overall) | 1,064 (59.4%) | 728 (40.6%) |
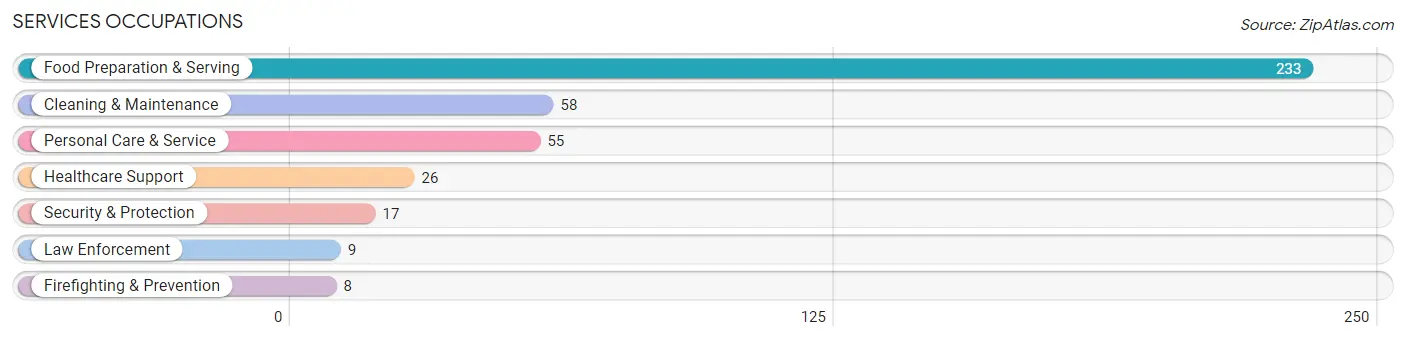
Services Occupations
The most common Services occupations in Aurora are Food Preparation & Serving (233 | 13.0%), Cleaning & Maintenance (58 | 3.2%), Personal Care & Service (55 | 3.1%), Healthcare Support (26 | 1.5%), and Security & Protection (17 | 0.9%).
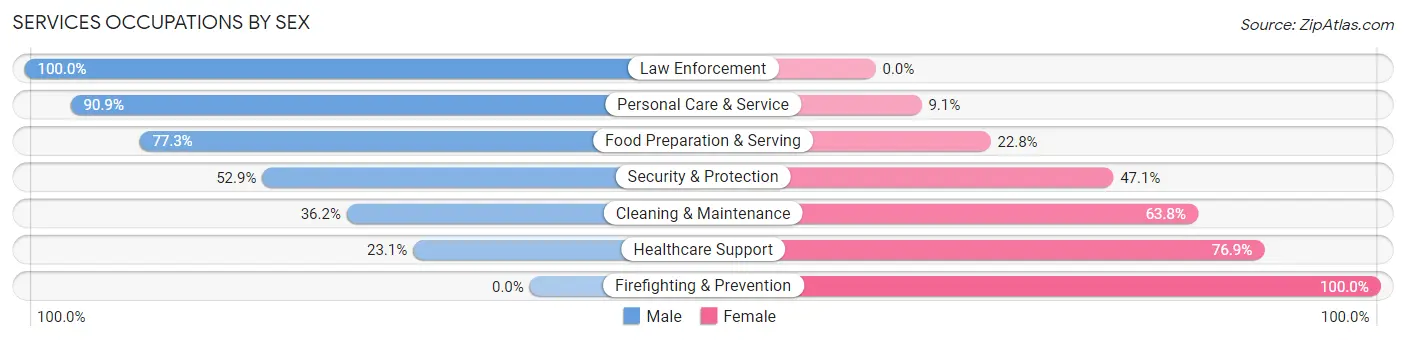
Services Occupations by Sex
Within the Services occupations in Aurora, the most male-oriented occupations are Law Enforcement (100.0%), Personal Care & Service (90.9%), and Food Preparation & Serving (77.2%), while the most female-oriented occupations are Firefighting & Prevention (100.0%), Healthcare Support (76.9%), and Cleaning & Maintenance (63.8%).
| Occupation | Male | Female |
| Healthcare Support | 6 (23.1%) | 20 (76.9%) |
| Security & Protection | 9 (52.9%) | 8 (47.1%) |
| Firefighting & Prevention | 0 (0.0%) | 8 (100.0%) |
| Law Enforcement | 9 (100.0%) | 0 (0.0%) |
| Food Preparation & Serving | 180 (77.2%) | 53 (22.8%) |
| Cleaning & Maintenance | 21 (36.2%) | 37 (63.8%) |
| Personal Care & Service | 50 (90.9%) | 5 (9.1%) |
| Total (Category) | 266 (68.4%) | 123 (31.6%) |
| Total (Overall) | 1,064 (59.4%) | 728 (40.6%) |
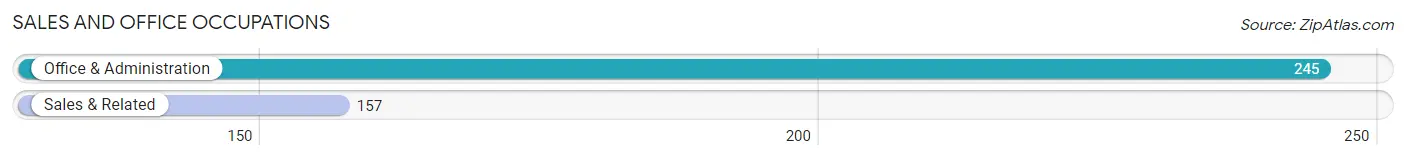
Sales and Office Occupations
The most common Sales and Office occupations in Aurora are Office & Administration (245 | 13.7%), and Sales & Related (157 | 8.8%).
Sales and Office Occupations by Sex
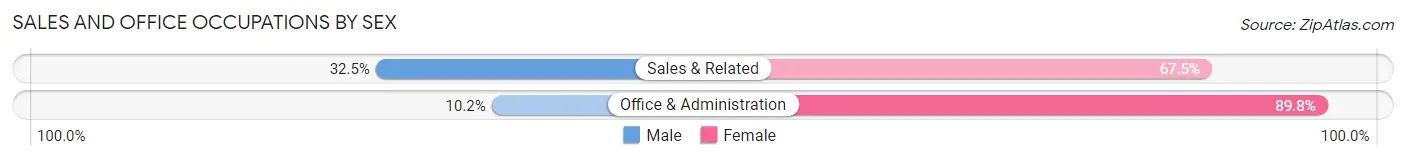
| Occupation | Male | Female |
| Sales & Related | 51 (32.5%) | 106 (67.5%) |
| Office & Administration | 25 (10.2%) | 220 (89.8%) |
| Total (Category) | 76 (18.9%) | 326 (81.1%) |
| Total (Overall) | 1,064 (59.4%) | 728 (40.6%) |
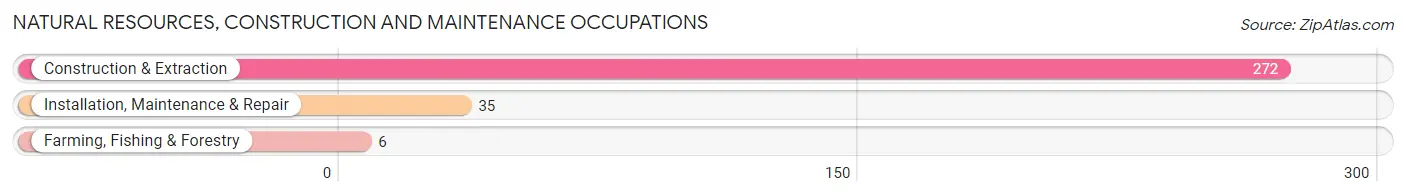
Natural Resources, Construction and Maintenance Occupations
The most common Natural Resources, Construction and Maintenance occupations in Aurora are Construction & Extraction (272 | 15.2%), Installation, Maintenance & Repair (35 | 1.9%), and Farming, Fishing & Forestry (6 | 0.3%).
Natural Resources, Construction and Maintenance Occupations by Sex
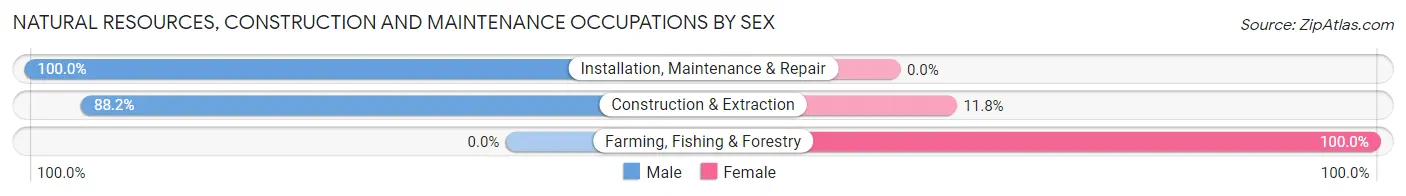
| Occupation | Male | Female |
| Farming, Fishing & Forestry | 0 (0.0%) | 6 (100.0%) |
| Construction & Extraction | 240 (88.2%) | 32 (11.8%) |
| Installation, Maintenance & Repair | 35 (100.0%) | 0 (0.0%) |
| Total (Category) | 275 (87.9%) | 38 (12.1%) |
| Total (Overall) | 1,064 (59.4%) | 728 (40.6%) |
Production, Transportation and Moving Occupations
The most common Production, Transportation and Moving occupations in Aurora are Production (163 | 9.1%), Material Moving (133 | 7.4%), and Transportation (33 | 1.8%).
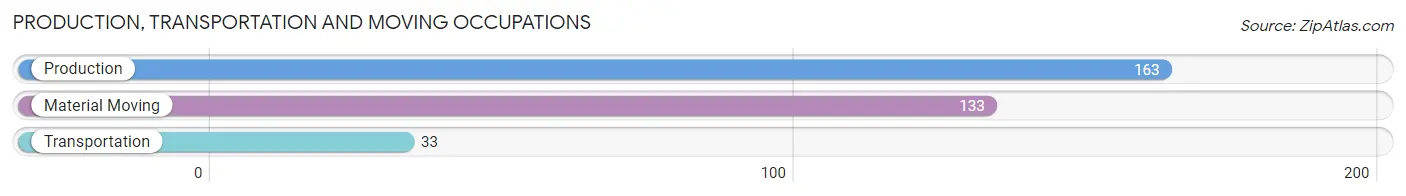
Production, Transportation and Moving Occupations by Sex
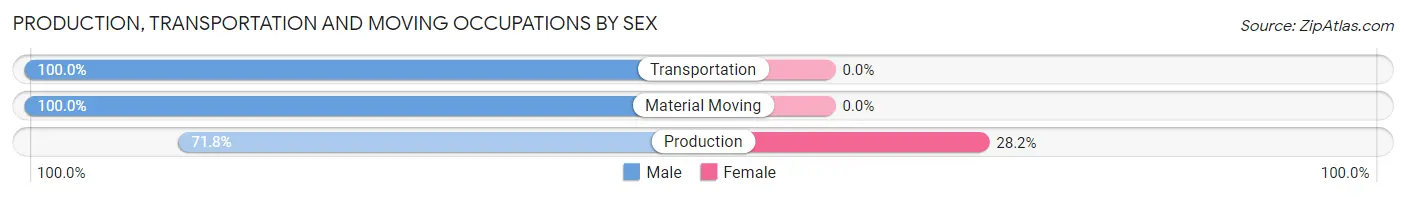
| Occupation | Male | Female |
| Production | 117 (71.8%) | 46 (28.2%) |
| Transportation | 33 (100.0%) | 0 (0.0%) |
| Material Moving | 133 (100.0%) | 0 (0.0%) |
| Total (Category) | 283 (86.0%) | 46 (14.0%) |
| Total (Overall) | 1,064 (59.4%) | 728 (40.6%) |
Employment Industries by Sex in Aurora
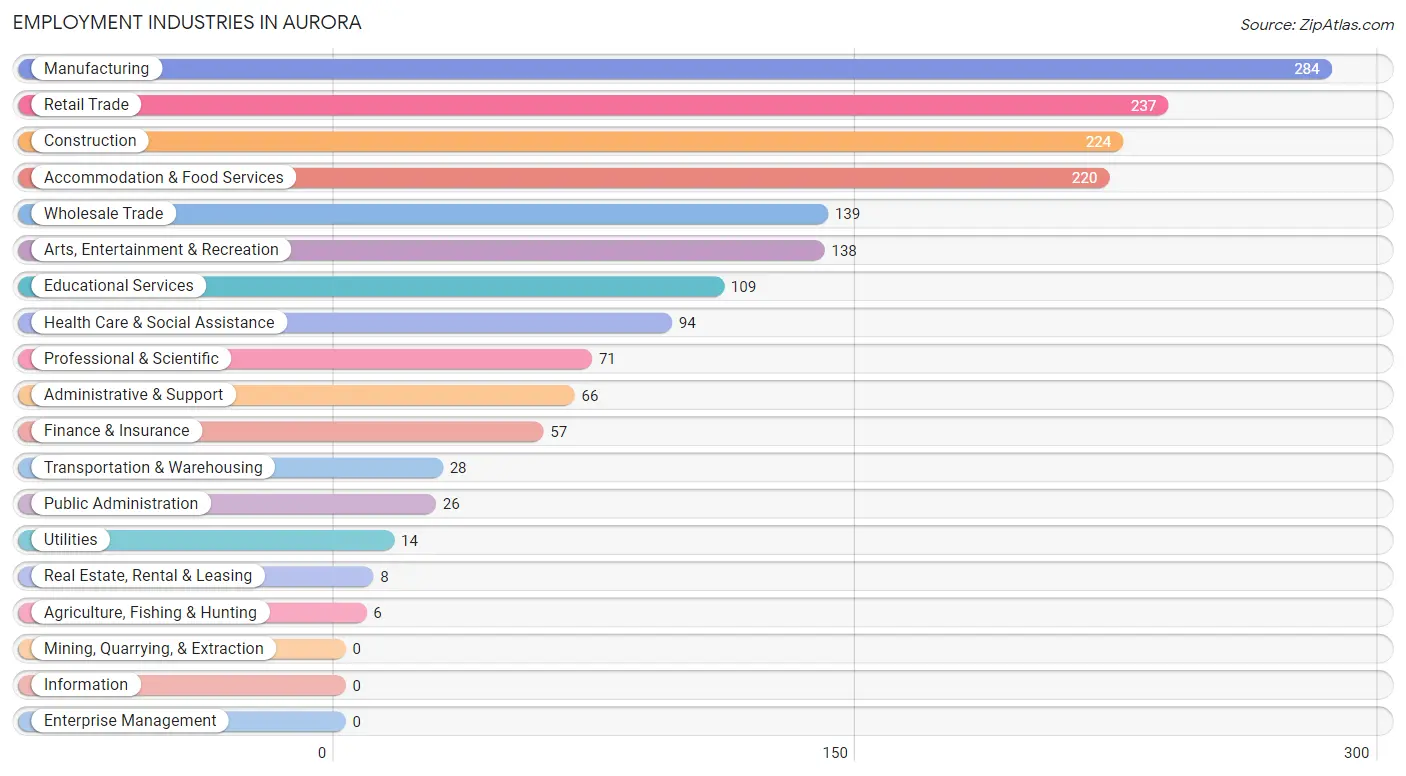
Employment Industries in Aurora
The major employment industries in Aurora include Manufacturing (284 | 15.9%), Retail Trade (237 | 13.2%), Construction (224 | 12.5%), Accommodation & Food Services (220 | 12.3%), and Wholesale Trade (139 | 7.8%).
Employment Industries by Sex in Aurora
The Aurora industries that see more men than women are Transportation & Warehousing (100.0%), Utilities (100.0%), and Wholesale Trade (86.3%), whereas the industries that tend to have a higher number of women are Agriculture, Fishing & Hunting (100.0%), Real Estate, Rental & Leasing (100.0%), and Health Care & Social Assistance (100.0%).
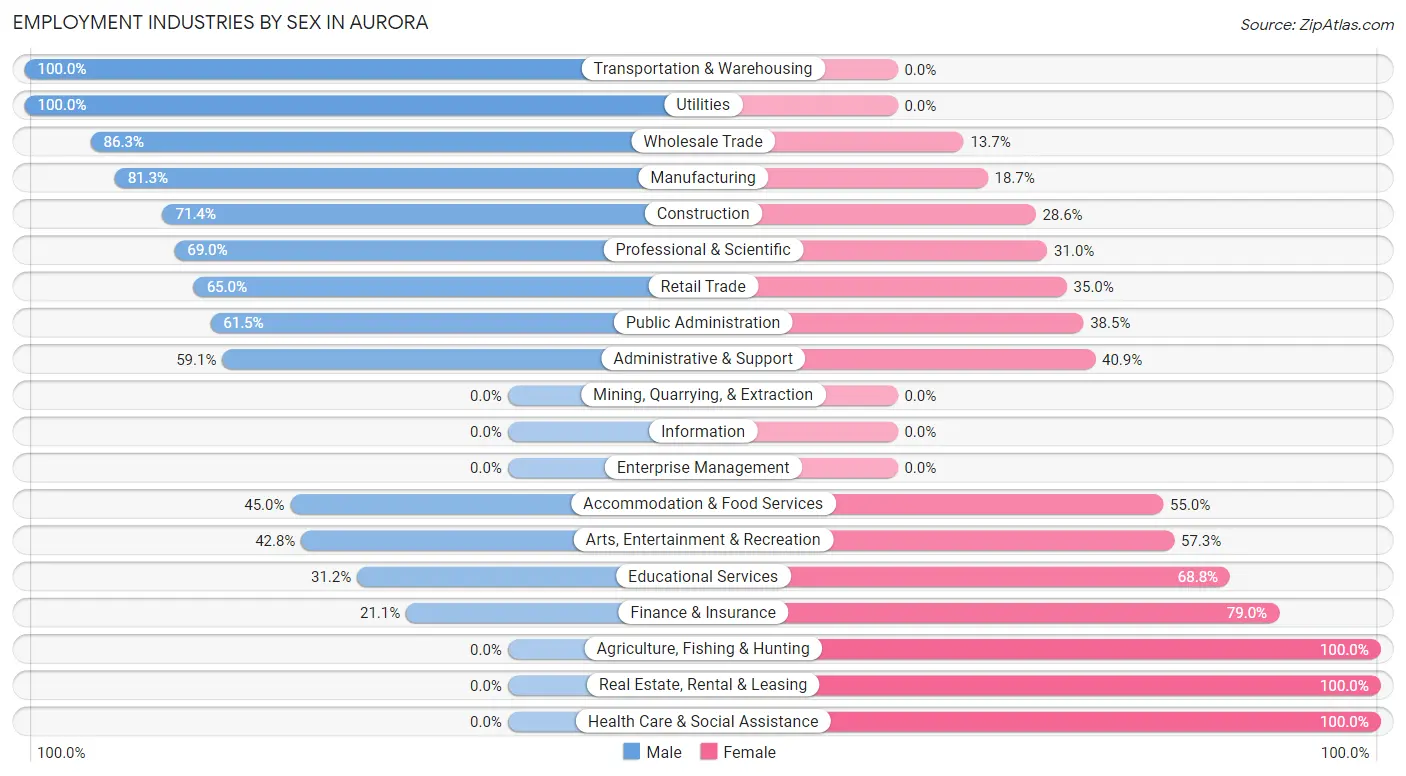
| Industry | Male | Female |
| Agriculture, Fishing & Hunting | 0 (0.0%) | 6 (100.0%) |
| Mining, Quarrying, & Extraction | 0 (0.0%) | 0 (0.0%) |
| Construction | 160 (71.4%) | 64 (28.6%) |
| Manufacturing | 231 (81.3%) | 53 (18.7%) |
| Wholesale Trade | 120 (86.3%) | 19 (13.7%) |
| Retail Trade | 154 (65.0%) | 83 (35.0%) |
| Transportation & Warehousing | 28 (100.0%) | 0 (0.0%) |
| Utilities | 14 (100.0%) | 0 (0.0%) |
| Information | 0 (0.0%) | 0 (0.0%) |
| Finance & Insurance | 12 (21.0%) | 45 (78.9%) |
| Real Estate, Rental & Leasing | 0 (0.0%) | 8 (100.0%) |
| Professional & Scientific | 49 (69.0%) | 22 (31.0%) |
| Enterprise Management | 0 (0.0%) | 0 (0.0%) |
| Administrative & Support | 39 (59.1%) | 27 (40.9%) |
| Educational Services | 34 (31.2%) | 75 (68.8%) |
| Health Care & Social Assistance | 0 (0.0%) | 94 (100.0%) |
| Arts, Entertainment & Recreation | 59 (42.7%) | 79 (57.3%) |
| Accommodation & Food Services | 99 (45.0%) | 121 (55.0%) |
| Public Administration | 16 (61.5%) | 10 (38.5%) |
| Total | 1,064 (59.4%) | 728 (40.6%) |
Education in Aurora
School Enrollment in Aurora
The most common levels of schooling among the 694 students in Aurora are high school (254 | 36.6%), middle school (202 | 29.1%), and college / undergraduate (111 | 16.0%).
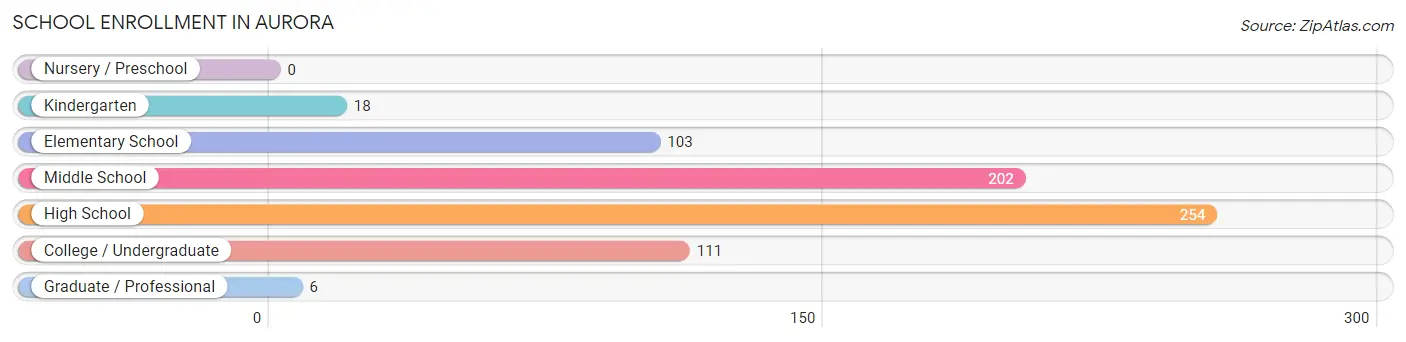
| School Level | # Students | % Students |
| Nursery / Preschool | 0 | 0.0% |
| Kindergarten | 18 | 2.6% |
| Elementary School | 103 | 14.8% |
| Middle School | 202 | 29.1% |
| High School | 254 | 36.6% |
| College / Undergraduate | 111 | 16.0% |
| Graduate / Professional | 6 | 0.9% |
| Total | 694 | 100.0% |
School Enrollment by Age by Funding Source in Aurora
Out of a total of 694 students who are enrolled in schools in Aurora, 117 (16.9%) attend a private institution, while the remaining 577 (83.1%) are enrolled in public schools. The age group of 25 to 34 year olds has the highest likelihood of being enrolled in private schools, with 14 (82.4% in the age bracket) enrolled. Conversely, the age group of 18 to 19 year olds has the lowest likelihood of being enrolled in a private school, with 63 (100.0% in the age bracket) attending a public institution.
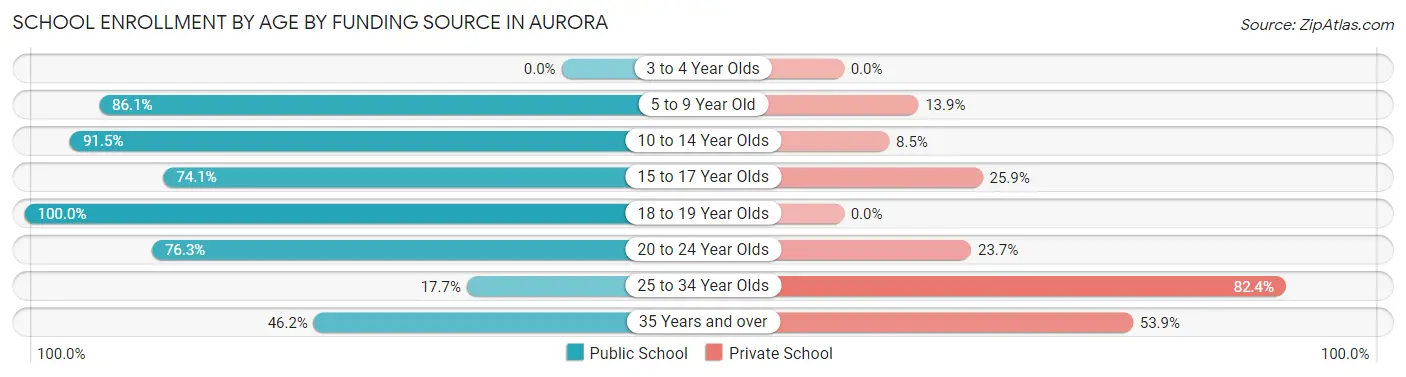
| Age Bracket | Public School | Private School |
| 3 to 4 Year Olds | 0 (0.0%) | 0 (0.0%) |
| 5 to 9 Year Old | 93 (86.1%) | 15 (13.9%) |
| 10 to 14 Year Olds | 238 (91.5%) | 22 (8.5%) |
| 15 to 17 Year Olds | 129 (74.1%) | 45 (25.9%) |
| 18 to 19 Year Olds | 63 (100.0%) | 0 (0.0%) |
| 20 to 24 Year Olds | 45 (76.3%) | 14 (23.7%) |
| 25 to 34 Year Olds | 3 (17.6%) | 14 (82.4%) |
| 35 Years and over | 6 (46.2%) | 7 (53.8%) |
| Total | 577 (83.1%) | 117 (16.9%) |
Educational Attainment by Field of Study in Aurora
Business (113 | 33.0%), education (68 | 19.9%), science & technology (39 | 11.4%), engineering (27 | 7.9%), and psychology (22 | 6.4%) are the most common fields of study among 342 individuals in Aurora who have obtained a bachelor's degree or higher.
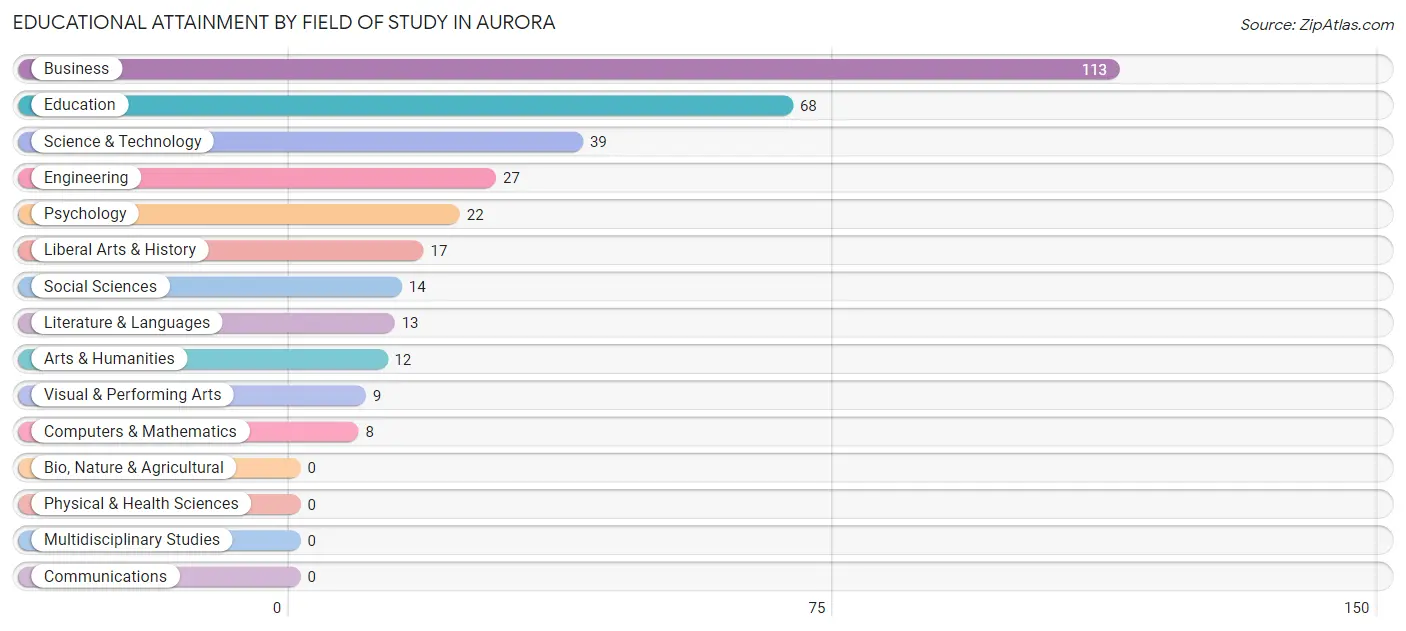
| Field of Study | # Graduates | % Graduates |
| Computers & Mathematics | 8 | 2.3% |
| Bio, Nature & Agricultural | 0 | 0.0% |
| Physical & Health Sciences | 0 | 0.0% |
| Psychology | 22 | 6.4% |
| Social Sciences | 14 | 4.1% |
| Engineering | 27 | 7.9% |
| Multidisciplinary Studies | 0 | 0.0% |
| Science & Technology | 39 | 11.4% |
| Business | 113 | 33.0% |
| Education | 68 | 19.9% |
| Literature & Languages | 13 | 3.8% |
| Liberal Arts & History | 17 | 5.0% |
| Visual & Performing Arts | 9 | 2.6% |
| Communications | 0 | 0.0% |
| Arts & Humanities | 12 | 3.5% |
| Total | 342 | 100.0% |
Transportation & Commute in Aurora
Vehicle Availability by Sex in Aurora
The most prevalent vehicle ownership categories in Aurora are males with 2 vehicles (417, accounting for 40.1%) and females with 2 vehicles (276, making up 62.0%).
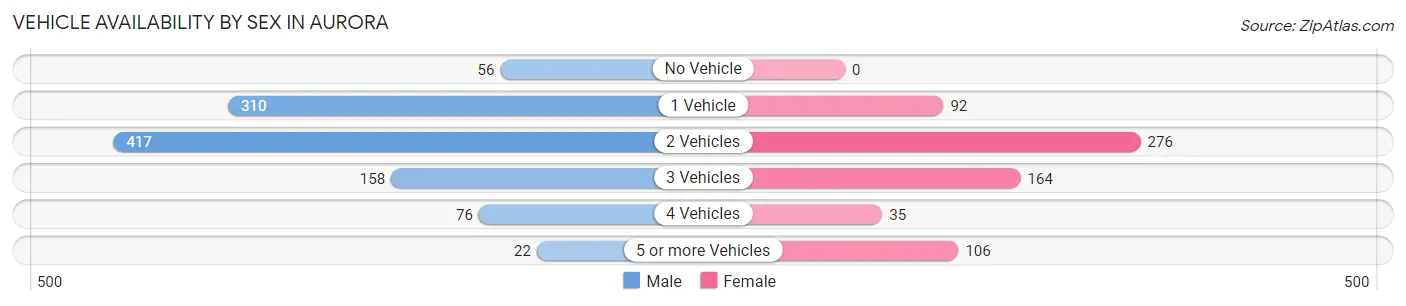
| Vehicles Available | Male | Female |
| No Vehicle | 56 (5.4%) | 0 (0.0%) |
| 1 Vehicle | 310 (29.8%) | 92 (13.7%) |
| 2 Vehicles | 417 (40.1%) | 276 (41.0%) |
| 3 Vehicles | 158 (15.2%) | 164 (24.4%) |
| 4 Vehicles | 76 (7.3%) | 35 (5.2%) |
| 5 or more Vehicles | 22 (2.1%) | 106 (15.8%) |
| Total | 1,039 (100.0%) | 673 (100.0%) |
Commute Time in Aurora
The most frequently occuring commute durations in Aurora are 5 to 9 minutes (324 commuters, 19.4%), 25 to 29 minutes (203 commuters, 12.1%), and 30 to 34 minutes (199 commuters, 11.9%).
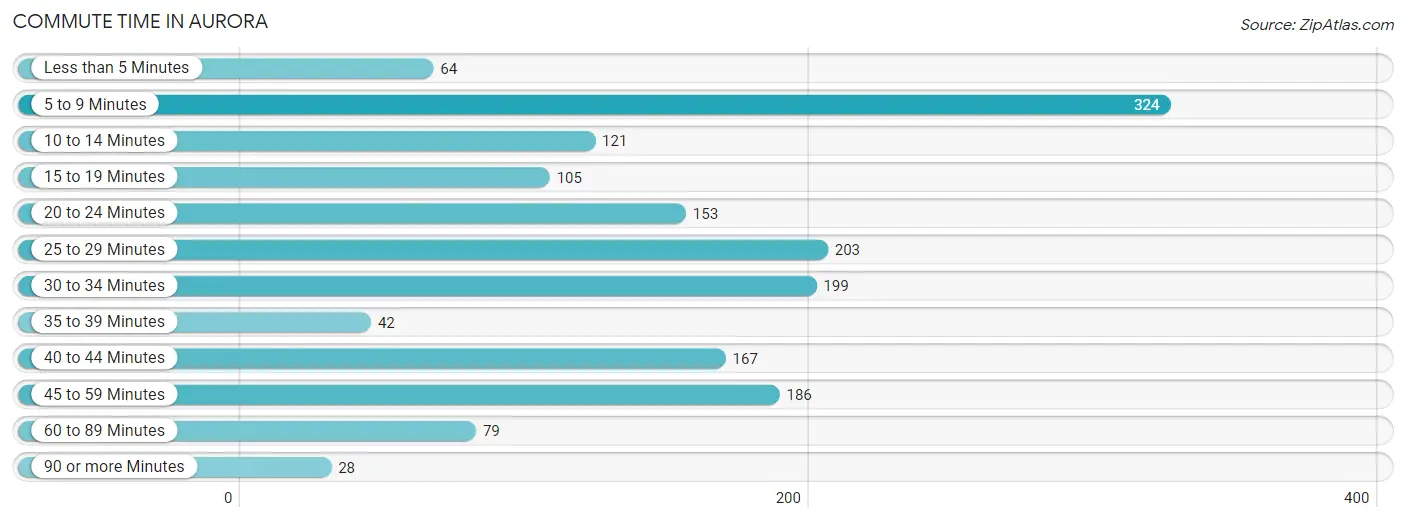
| Commute Time | # Commuters | % Commuters |
| Less than 5 Minutes | 64 | 3.8% |
| 5 to 9 Minutes | 324 | 19.4% |
| 10 to 14 Minutes | 121 | 7.2% |
| 15 to 19 Minutes | 105 | 6.3% |
| 20 to 24 Minutes | 153 | 9.2% |
| 25 to 29 Minutes | 203 | 12.1% |
| 30 to 34 Minutes | 199 | 11.9% |
| 35 to 39 Minutes | 42 | 2.5% |
| 40 to 44 Minutes | 167 | 10.0% |
| 45 to 59 Minutes | 186 | 11.1% |
| 60 to 89 Minutes | 79 | 4.7% |
| 90 or more Minutes | 28 | 1.7% |
Commute Time by Sex in Aurora
The most common commute times in Aurora are 30 to 34 minutes (182 commuters, 18.1%) for males and 5 to 9 minutes (144 commuters, 21.6%) for females.
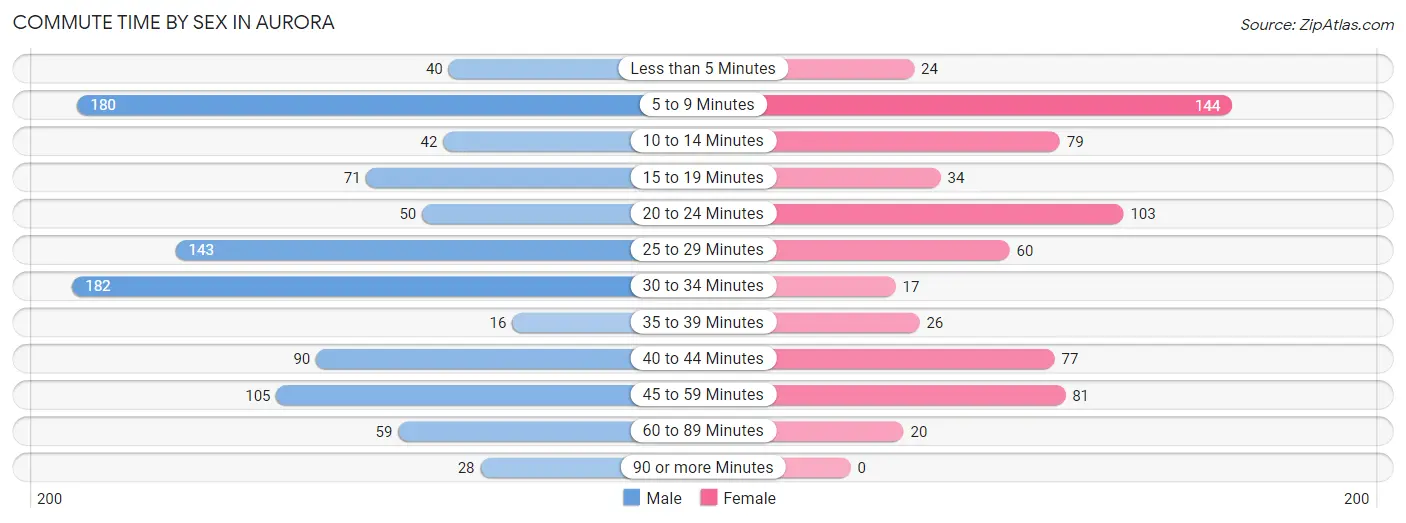
| Commute Time | Male | Female |
| Less than 5 Minutes | 40 (4.0%) | 24 (3.6%) |
| 5 to 9 Minutes | 180 (17.9%) | 144 (21.6%) |
| 10 to 14 Minutes | 42 (4.2%) | 79 (11.9%) |
| 15 to 19 Minutes | 71 (7.1%) | 34 (5.1%) |
| 20 to 24 Minutes | 50 (5.0%) | 103 (15.5%) |
| 25 to 29 Minutes | 143 (14.2%) | 60 (9.0%) |
| 30 to 34 Minutes | 182 (18.1%) | 17 (2.6%) |
| 35 to 39 Minutes | 16 (1.6%) | 26 (3.9%) |
| 40 to 44 Minutes | 90 (8.9%) | 77 (11.6%) |
| 45 to 59 Minutes | 105 (10.4%) | 81 (12.2%) |
| 60 to 89 Minutes | 59 (5.9%) | 20 (3.0%) |
| 90 or more Minutes | 28 (2.8%) | 0 (0.0%) |
Time of Departure to Work by Sex in Aurora
The most frequent times of departure to work in Aurora are 12:00 PM to 3:59 PM (200, 19.9%) for males and 7:30 AM to 7:59 AM (114, 17.1%) for females.
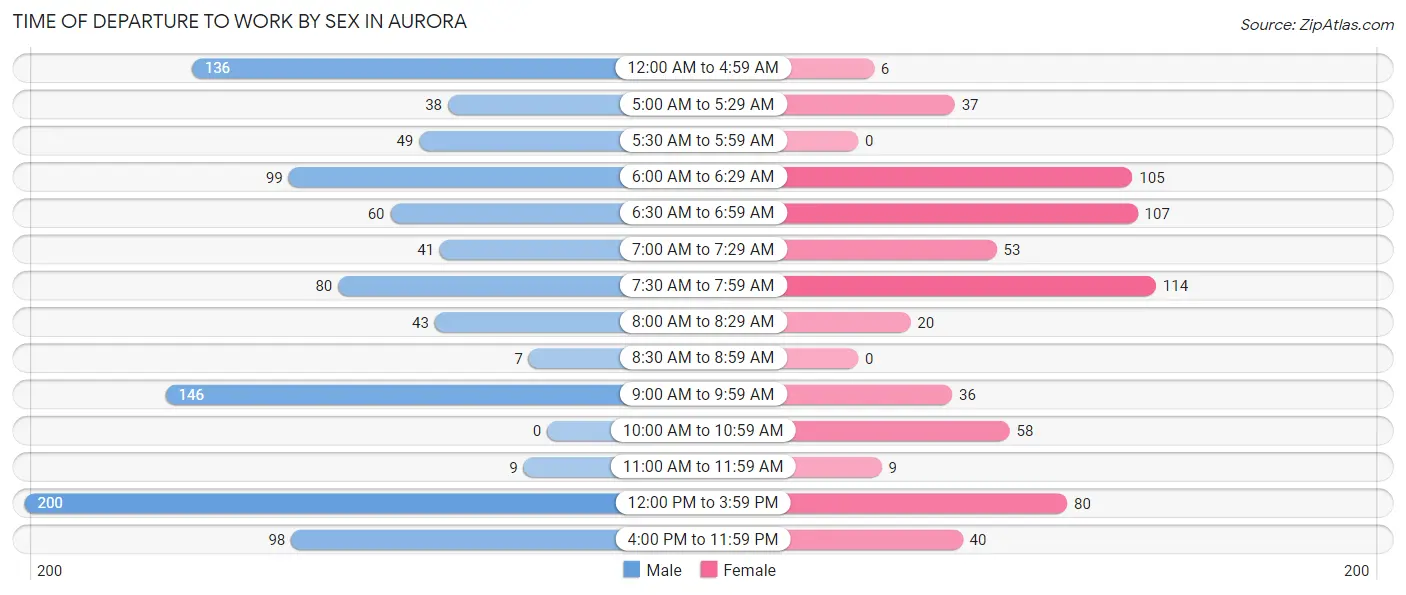
| Time of Departure | Male | Female |
| 12:00 AM to 4:59 AM | 136 (13.5%) | 6 (0.9%) |
| 5:00 AM to 5:29 AM | 38 (3.8%) | 37 (5.6%) |
| 5:30 AM to 5:59 AM | 49 (4.9%) | 0 (0.0%) |
| 6:00 AM to 6:29 AM | 99 (9.8%) | 105 (15.8%) |
| 6:30 AM to 6:59 AM | 60 (6.0%) | 107 (16.1%) |
| 7:00 AM to 7:29 AM | 41 (4.1%) | 53 (8.0%) |
| 7:30 AM to 7:59 AM | 80 (8.0%) | 114 (17.1%) |
| 8:00 AM to 8:29 AM | 43 (4.3%) | 20 (3.0%) |
| 8:30 AM to 8:59 AM | 7 (0.7%) | 0 (0.0%) |
| 9:00 AM to 9:59 AM | 146 (14.5%) | 36 (5.4%) |
| 10:00 AM to 10:59 AM | 0 (0.0%) | 58 (8.7%) |
| 11:00 AM to 11:59 AM | 9 (0.9%) | 9 (1.3%) |
| 12:00 PM to 3:59 PM | 200 (19.9%) | 80 (12.0%) |
| 4:00 PM to 11:59 PM | 98 (9.7%) | 40 (6.0%) |
| Total | 1,006 (100.0%) | 665 (100.0%) |
Housing Occupancy in Aurora
Occupancy by Ownership in Aurora
Of the total 1,529 dwellings in Aurora, owner-occupied units account for 919 (60.1%), while renter-occupied units make up 610 (39.9%).
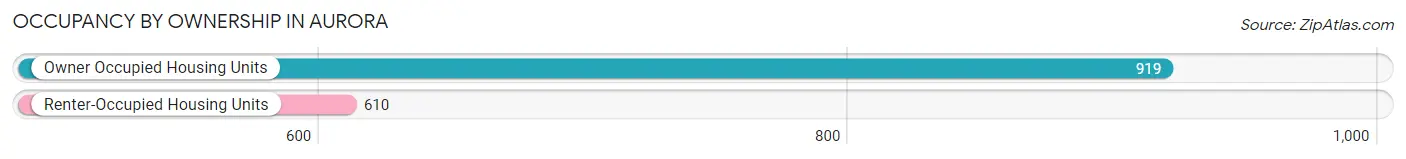
| Occupancy | # Housing Units | % Housing Units |
| Owner Occupied Housing Units | 919 | 60.1% |
| Renter-Occupied Housing Units | 610 | 39.9% |
| Total Occupied Housing Units | 1,529 | 100.0% |
Occupancy by Household Size in Aurora
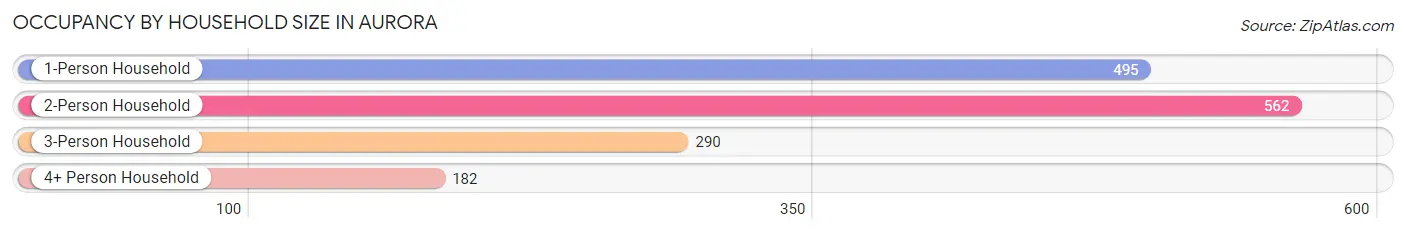
| Household Size | # Housing Units | % Housing Units |
| 1-Person Household | 495 | 32.4% |
| 2-Person Household | 562 | 36.8% |
| 3-Person Household | 290 | 19.0% |
| 4+ Person Household | 182 | 11.9% |
| Total Housing Units | 1,529 | 100.0% |
Occupancy by Ownership by Household Size in Aurora
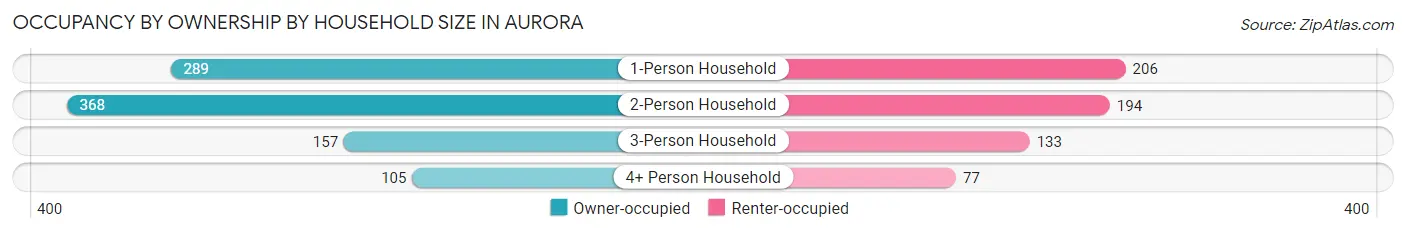
| Household Size | Owner-occupied | Renter-occupied |
| 1-Person Household | 289 (58.4%) | 206 (41.6%) |
| 2-Person Household | 368 (65.5%) | 194 (34.5%) |
| 3-Person Household | 157 (54.1%) | 133 (45.9%) |
| 4+ Person Household | 105 (57.7%) | 77 (42.3%) |
| Total Housing Units | 919 (60.1%) | 610 (39.9%) |
Occupancy by Educational Attainment in Aurora
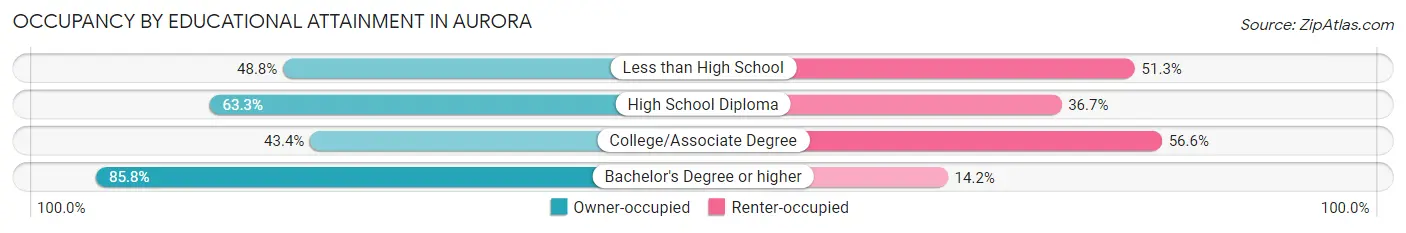
| Household Size | Owner-occupied | Renter-occupied |
| Less than High School | 78 (48.7%) | 82 (51.2%) |
| High School Diploma | 452 (63.3%) | 262 (36.7%) |
| College/Associate Degree | 177 (43.4%) | 231 (56.6%) |
| Bachelor's Degree or higher | 212 (85.8%) | 35 (14.2%) |
Occupancy by Age of Householder in Aurora
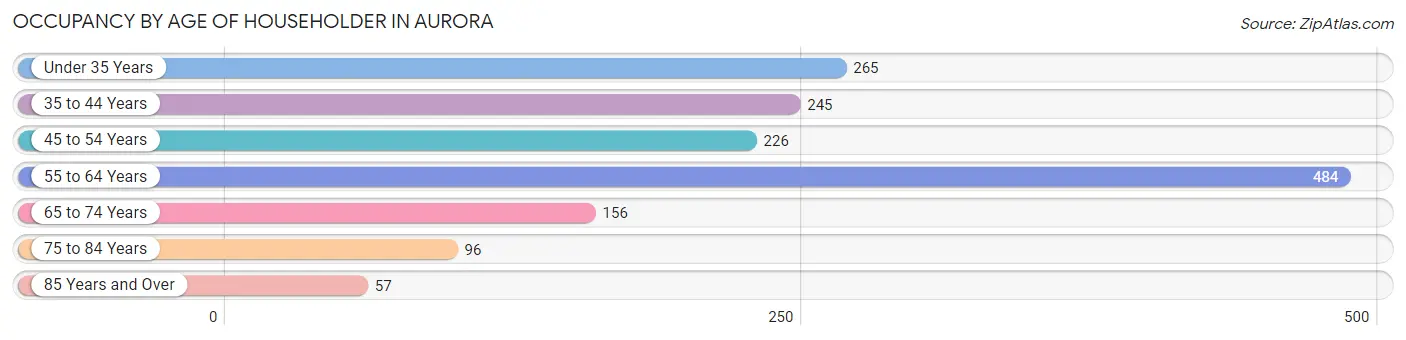
| Age Bracket | # Households | % Households |
| Under 35 Years | 265 | 17.3% |
| 35 to 44 Years | 245 | 16.0% |
| 45 to 54 Years | 226 | 14.8% |
| 55 to 64 Years | 484 | 31.7% |
| 65 to 74 Years | 156 | 10.2% |
| 75 to 84 Years | 96 | 6.3% |
| 85 Years and Over | 57 | 3.7% |
| Total | 1,529 | 100.0% |
Housing Finances in Aurora
Median Income by Occupancy in Aurora
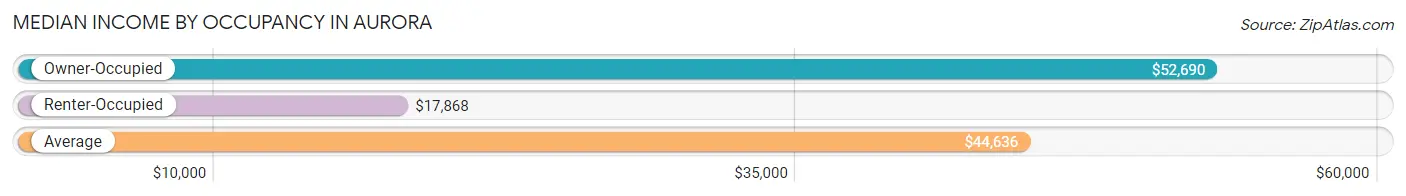
| Occupancy Type | # Households | Median Income |
| Owner-Occupied | 919 (60.1%) | $52,690 |
| Renter-Occupied | 610 (39.9%) | $17,868 |
| Average | 1,529 (100.0%) | $44,636 |
Occupancy by Householder Income Bracket in Aurora
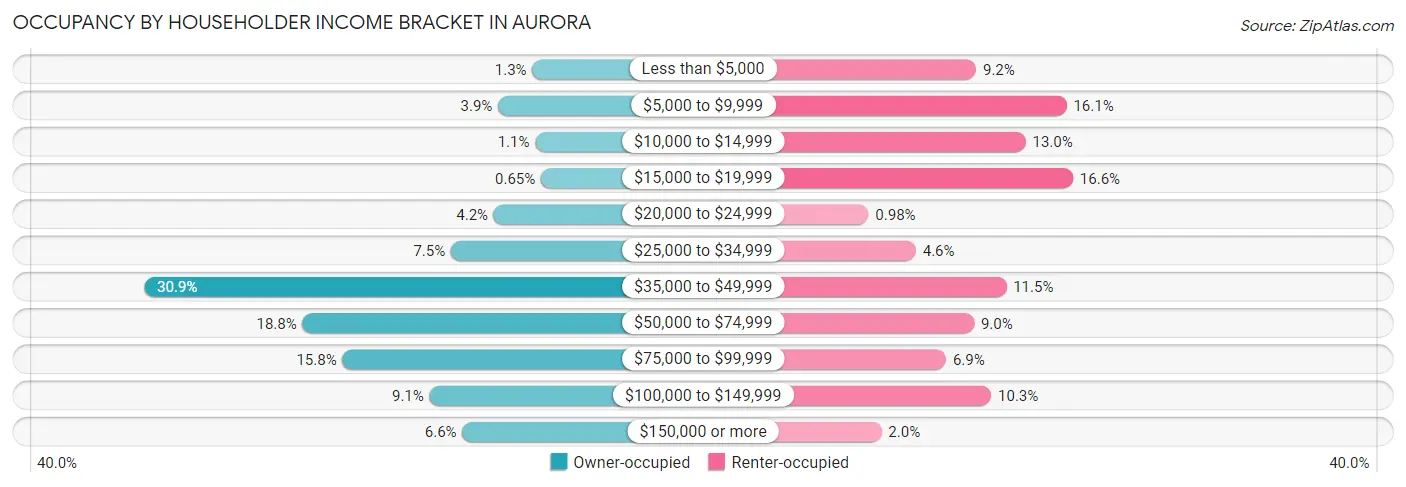
| Income Bracket | Owner-occupied | Renter-occupied |
| Less than $5,000 | 12 (1.3%) | 56 (9.2%) |
| $5,000 to $9,999 | 36 (3.9%) | 98 (16.1%) |
| $10,000 to $14,999 | 10 (1.1%) | 79 (13.0%) |
| $15,000 to $19,999 | 6 (0.6%) | 101 (16.6%) |
| $20,000 to $24,999 | 39 (4.2%) | 6 (1.0%) |
| $25,000 to $34,999 | 69 (7.5%) | 28 (4.6%) |
| $35,000 to $49,999 | 284 (30.9%) | 70 (11.5%) |
| $50,000 to $74,999 | 173 (18.8%) | 55 (9.0%) |
| $75,000 to $99,999 | 145 (15.8%) | 42 (6.9%) |
| $100,000 to $149,999 | 84 (9.1%) | 63 (10.3%) |
| $150,000 or more | 61 (6.6%) | 12 (2.0%) |
| Total | 919 (100.0%) | 610 (100.0%) |
Monthly Housing Cost Tiers in Aurora
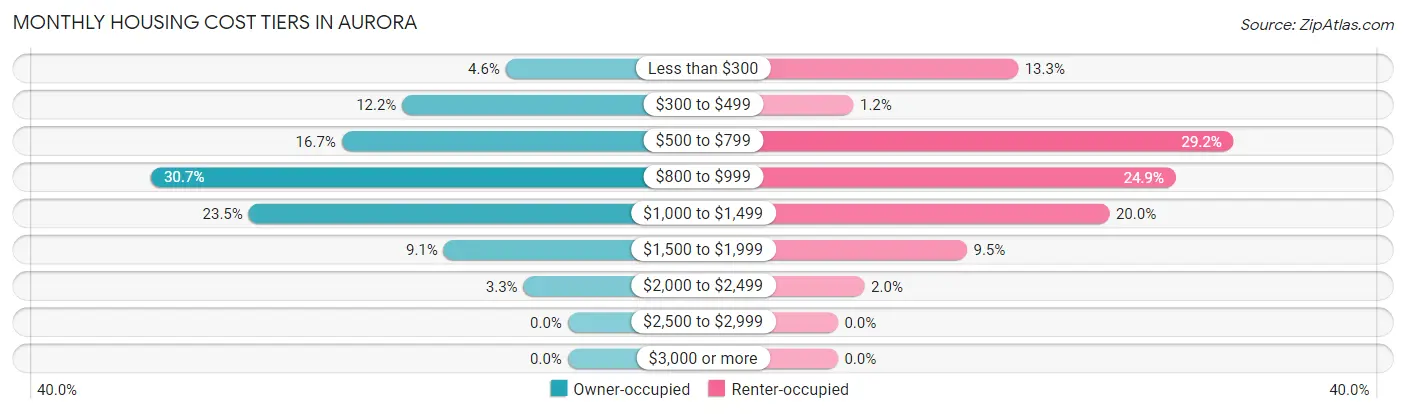
| Monthly Cost | Owner-occupied | Renter-occupied |
| Less than $300 | 42 (4.6%) | 81 (13.3%) |
| $300 to $499 | 112 (12.2%) | 7 (1.1%) |
| $500 to $799 | 153 (16.7%) | 178 (29.2%) |
| $800 to $999 | 282 (30.7%) | 152 (24.9%) |
| $1,000 to $1,499 | 216 (23.5%) | 122 (20.0%) |
| $1,500 to $1,999 | 84 (9.1%) | 58 (9.5%) |
| $2,000 to $2,499 | 30 (3.3%) | 12 (2.0%) |
| $2,500 to $2,999 | 0 (0.0%) | 0 (0.0%) |
| $3,000 or more | 0 (0.0%) | 0 (0.0%) |
| Total | 919 (100.0%) | 610 (100.0%) |
Physical Housing Characteristics in Aurora
Housing Structures in Aurora
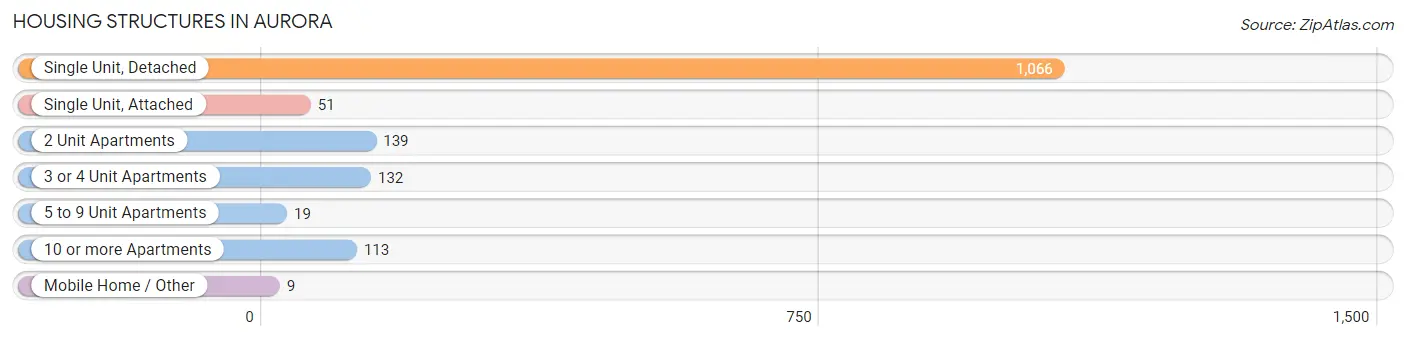
| Structure Type | # Housing Units | % Housing Units |
| Single Unit, Detached | 1,066 | 69.7% |
| Single Unit, Attached | 51 | 3.3% |
| 2 Unit Apartments | 139 | 9.1% |
| 3 or 4 Unit Apartments | 132 | 8.6% |
| 5 to 9 Unit Apartments | 19 | 1.2% |
| 10 or more Apartments | 113 | 7.4% |
| Mobile Home / Other | 9 | 0.6% |
| Total | 1,529 | 100.0% |
Housing Structures by Occupancy in Aurora
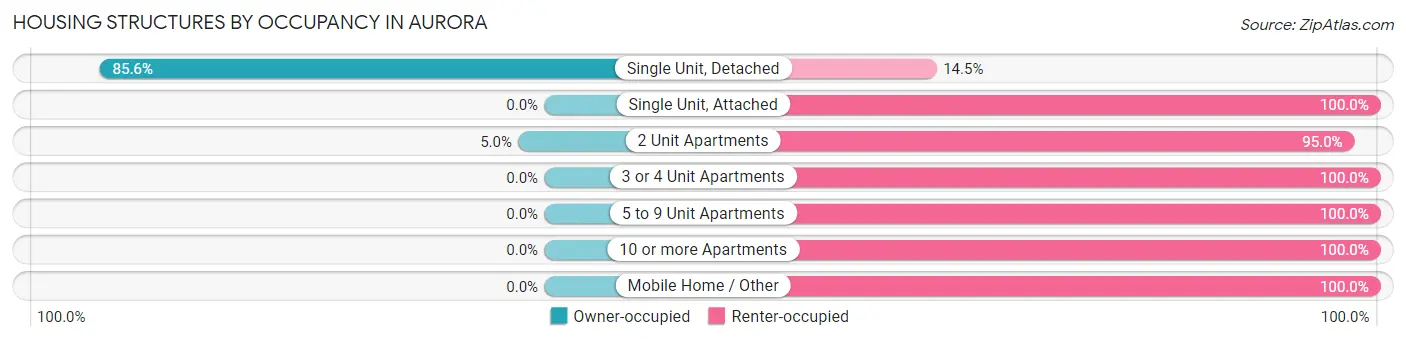
| Structure Type | Owner-occupied | Renter-occupied |
| Single Unit, Detached | 912 (85.6%) | 154 (14.4%) |
| Single Unit, Attached | 0 (0.0%) | 51 (100.0%) |
| 2 Unit Apartments | 7 (5.0%) | 132 (95.0%) |
| 3 or 4 Unit Apartments | 0 (0.0%) | 132 (100.0%) |
| 5 to 9 Unit Apartments | 0 (0.0%) | 19 (100.0%) |
| 10 or more Apartments | 0 (0.0%) | 113 (100.0%) |
| Mobile Home / Other | 0 (0.0%) | 9 (100.0%) |
| Total | 919 (60.1%) | 610 (39.9%) |
Housing Structures by Number of Rooms in Aurora
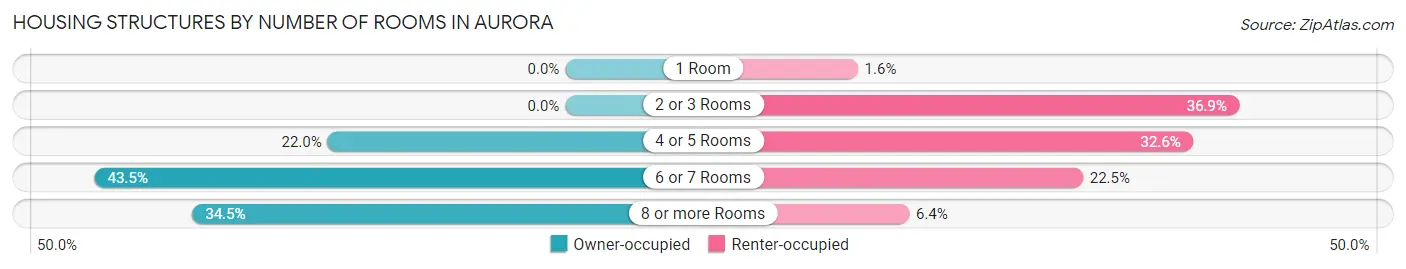
| Number of Rooms | Owner-occupied | Renter-occupied |
| 1 Room | 0 (0.0%) | 10 (1.6%) |
| 2 or 3 Rooms | 0 (0.0%) | 225 (36.9%) |
| 4 or 5 Rooms | 202 (22.0%) | 199 (32.6%) |
| 6 or 7 Rooms | 400 (43.5%) | 137 (22.5%) |
| 8 or more Rooms | 317 (34.5%) | 39 (6.4%) |
| Total | 919 (100.0%) | 610 (100.0%) |
Housing Structure by Heating Type in Aurora
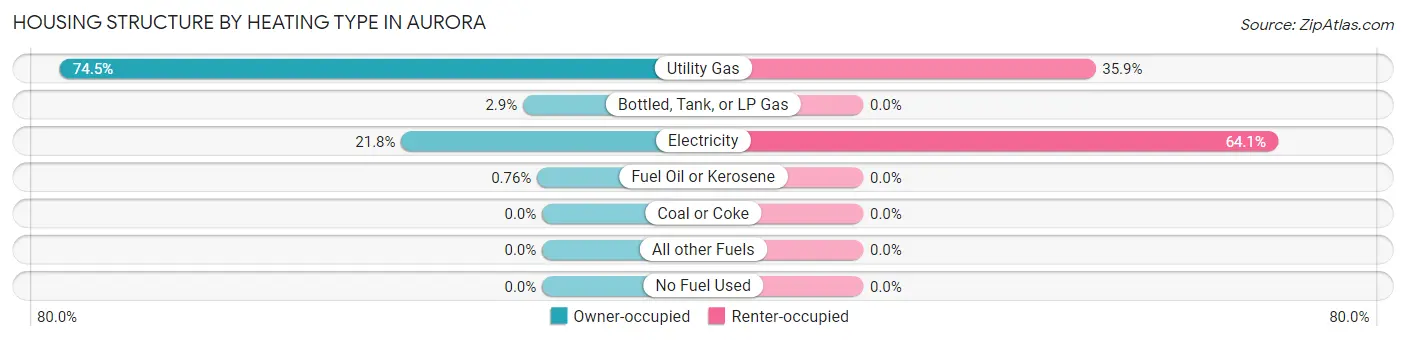
| Heating Type | Owner-occupied | Renter-occupied |
| Utility Gas | 685 (74.5%) | 219 (35.9%) |
| Bottled, Tank, or LP Gas | 27 (2.9%) | 0 (0.0%) |
| Electricity | 200 (21.8%) | 391 (64.1%) |
| Fuel Oil or Kerosene | 7 (0.8%) | 0 (0.0%) |
| Coal or Coke | 0 (0.0%) | 0 (0.0%) |
| All other Fuels | 0 (0.0%) | 0 (0.0%) |
| No Fuel Used | 0 (0.0%) | 0 (0.0%) |
| Total | 919 (100.0%) | 610 (100.0%) |
Household Vehicle Usage in Aurora
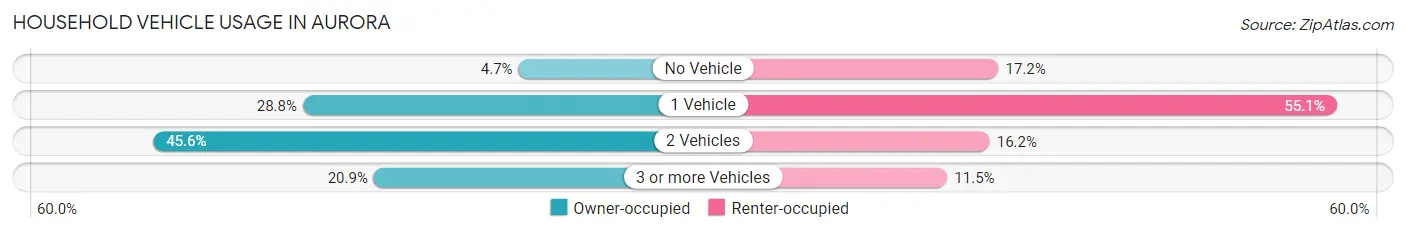
| Vehicles per Household | Owner-occupied | Renter-occupied |
| No Vehicle | 43 (4.7%) | 105 (17.2%) |
| 1 Vehicle | 265 (28.8%) | 336 (55.1%) |
| 2 Vehicles | 419 (45.6%) | 99 (16.2%) |
| 3 or more Vehicles | 192 (20.9%) | 70 (11.5%) |
| Total | 919 (100.0%) | 610 (100.0%) |
Real Estate & Mortgages in Aurora
Real Estate and Mortgage Overview in Aurora
| Characteristic | Without Mortgage | With Mortgage |
| Housing Units | 199 | 720 |
| Median Property Value | $125,300 | $113,800 |
| Median Household Income | $42,250 | $61 |
| Monthly Housing Costs | $409 | $0 |
| Real Estate Taxes | $1,000 | $9 |
Property Value by Mortgage Status in Aurora
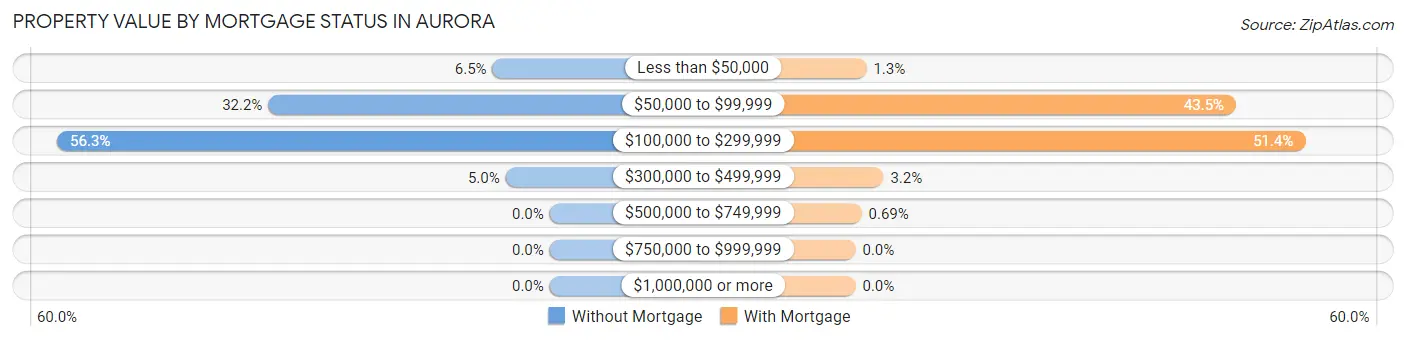
| Property Value | Without Mortgage | With Mortgage |
| Less than $50,000 | 13 (6.5%) | 9 (1.3%) |
| $50,000 to $99,999 | 64 (32.2%) | 313 (43.5%) |
| $100,000 to $299,999 | 112 (56.3%) | 370 (51.4%) |
| $300,000 to $499,999 | 10 (5.0%) | 23 (3.2%) |
| $500,000 to $749,999 | 0 (0.0%) | 5 (0.7%) |
| $750,000 to $999,999 | 0 (0.0%) | 0 (0.0%) |
| $1,000,000 or more | 0 (0.0%) | 0 (0.0%) |
| Total | 199 (100.0%) | 720 (100.0%) |
Household Income by Mortgage Status in Aurora
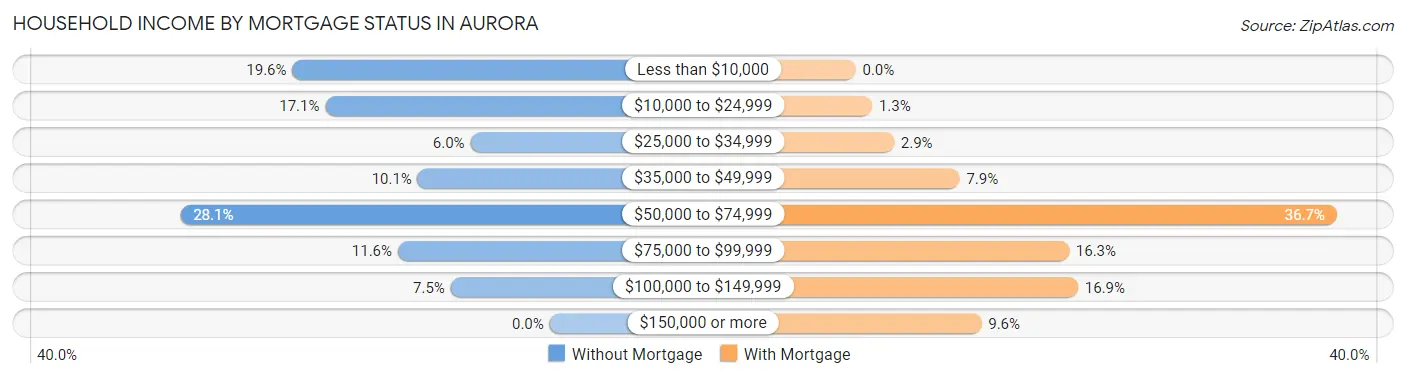
| Household Income | Without Mortgage | With Mortgage |
| Less than $10,000 | 39 (19.6%) | 0 (0.0%) |
| $10,000 to $24,999 | 34 (17.1%) | 9 (1.3%) |
| $25,000 to $34,999 | 12 (6.0%) | 21 (2.9%) |
| $35,000 to $49,999 | 20 (10.1%) | 57 (7.9%) |
| $50,000 to $74,999 | 56 (28.1%) | 264 (36.7%) |
| $75,000 to $99,999 | 23 (11.6%) | 117 (16.3%) |
| $100,000 to $149,999 | 15 (7.5%) | 122 (16.9%) |
| $150,000 or more | 0 (0.0%) | 69 (9.6%) |
| Total | 199 (100.0%) | 720 (100.0%) |
Property Value to Household Income Ratio in Aurora
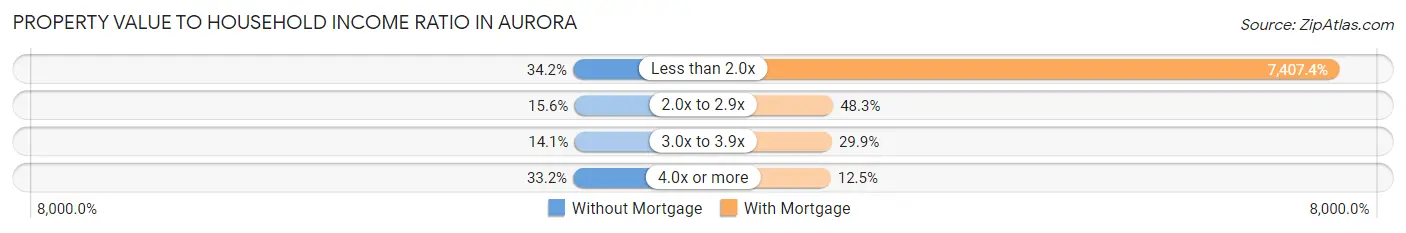
| Value-to-Income Ratio | Without Mortgage | With Mortgage |
| Less than 2.0x | 68 (34.2%) | 53,333 (7,407.4%) |
| 2.0x to 2.9x | 31 (15.6%) | 348 (48.3%) |
| 3.0x to 3.9x | 28 (14.1%) | 215 (29.9%) |
| 4.0x or more | 66 (33.2%) | 90 (12.5%) |
| Total | 199 (100.0%) | 720 (100.0%) |
Real Estate Taxes by Mortgage Status in Aurora
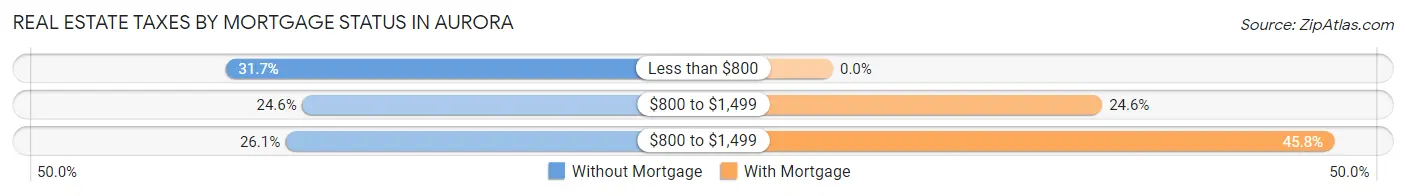
| Property Taxes | Without Mortgage | With Mortgage |
| Less than $800 | 63 (31.7%) | 0 (0.0%) |
| $800 to $1,499 | 49 (24.6%) | 177 (24.6%) |
| $800 to $1,499 | 52 (26.1%) | 330 (45.8%) |
| Total | 199 (100.0%) | 720 (100.0%) |
Health & Disability in Aurora
Health Insurance Coverage by Age in Aurora
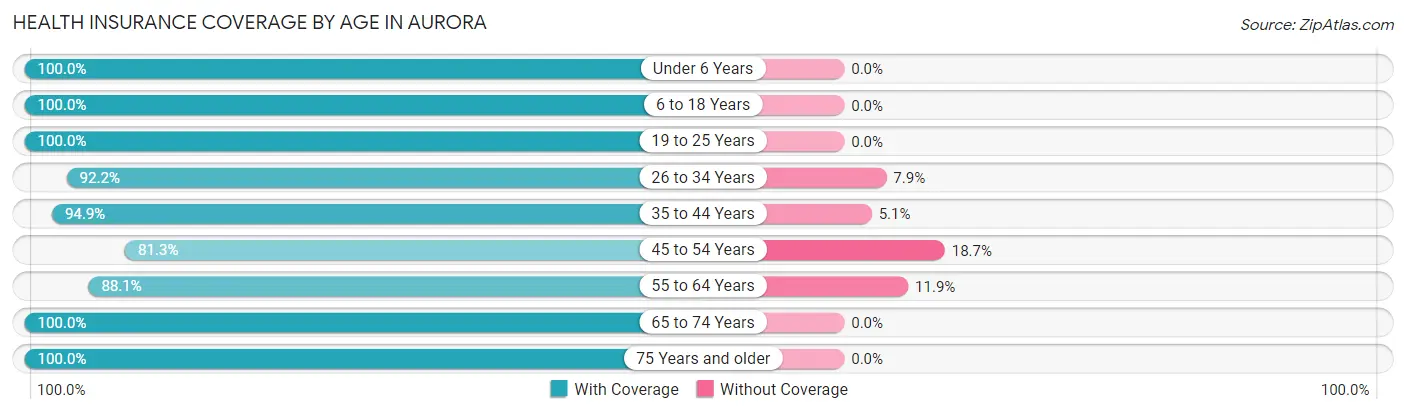
| Age Bracket | With Coverage | Without Coverage |
| Under 6 Years | 126 (100.0%) | 0 (0.0%) |
| 6 to 18 Years | 567 (100.0%) | 0 (0.0%) |
| 19 to 25 Years | 243 (100.0%) | 0 (0.0%) |
| 26 to 34 Years | 399 (92.1%) | 34 (7.9%) |
| 35 to 44 Years | 316 (94.9%) | 17 (5.1%) |
| 45 to 54 Years | 347 (81.3%) | 80 (18.7%) |
| 55 to 64 Years | 658 (88.1%) | 89 (11.9%) |
| 65 to 74 Years | 229 (100.0%) | 0 (0.0%) |
| 75 Years and older | 196 (100.0%) | 0 (0.0%) |
| Total | 3,081 (93.3%) | 220 (6.7%) |
Health Insurance Coverage by Citizenship Status in Aurora
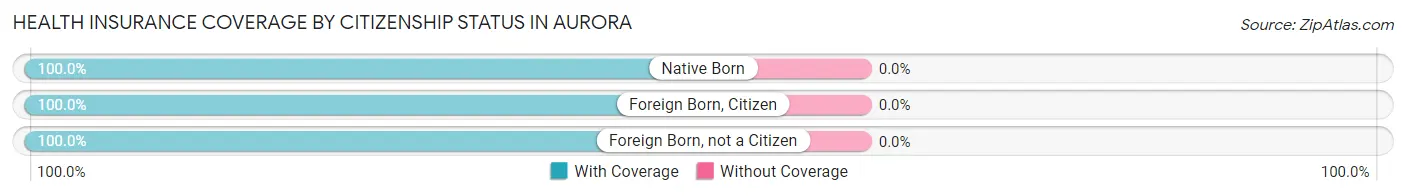
| Citizenship Status | With Coverage | Without Coverage |
| Native Born | 126 (100.0%) | 0 (0.0%) |
| Foreign Born, Citizen | 567 (100.0%) | 0 (0.0%) |
| Foreign Born, not a Citizen | 243 (100.0%) | 0 (0.0%) |
Health Insurance Coverage by Household Income in Aurora
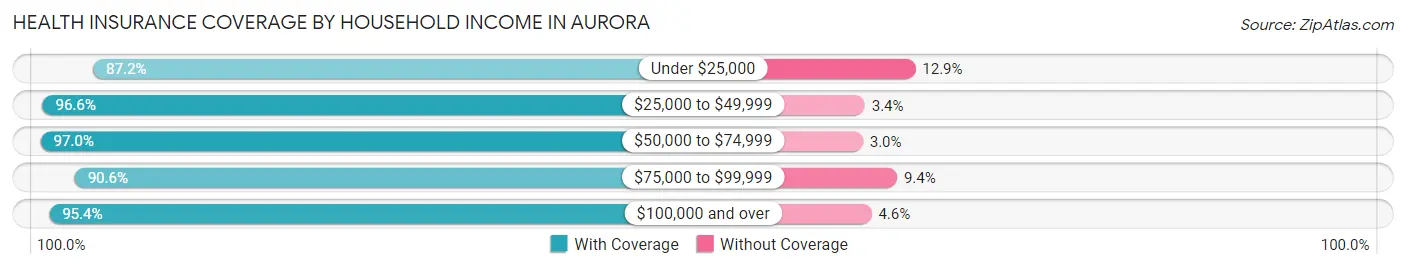
| Household Income | With Coverage | Without Coverage |
| Under $25,000 | 651 (87.2%) | 96 (12.9%) |
| $25,000 to $49,999 | 745 (96.6%) | 26 (3.4%) |
| $50,000 to $74,999 | 552 (97.0%) | 17 (3.0%) |
| $75,000 to $99,999 | 472 (90.6%) | 49 (9.4%) |
| $100,000 and over | 661 (95.4%) | 32 (4.6%) |
Public vs Private Health Insurance Coverage by Age in Aurora
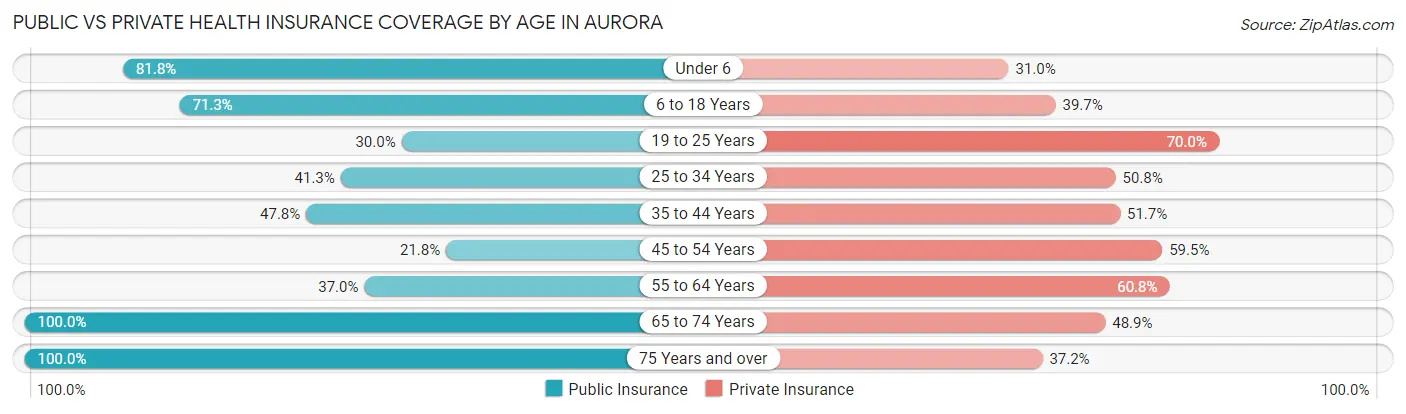
| Age Bracket | Public Insurance | Private Insurance |
| Under 6 | 103 (81.8%) | 39 (30.9%) |
| 6 to 18 Years | 404 (71.3%) | 225 (39.7%) |
| 19 to 25 Years | 73 (30.0%) | 170 (70.0%) |
| 25 to 34 Years | 179 (41.3%) | 220 (50.8%) |
| 35 to 44 Years | 159 (47.7%) | 172 (51.6%) |
| 45 to 54 Years | 93 (21.8%) | 254 (59.5%) |
| 55 to 64 Years | 276 (36.9%) | 454 (60.8%) |
| 65 to 74 Years | 229 (100.0%) | 112 (48.9%) |
| 75 Years and over | 196 (100.0%) | 73 (37.2%) |
| Total | 1,712 (51.9%) | 1,719 (52.1%) |
Disability Status by Sex by Age in Aurora
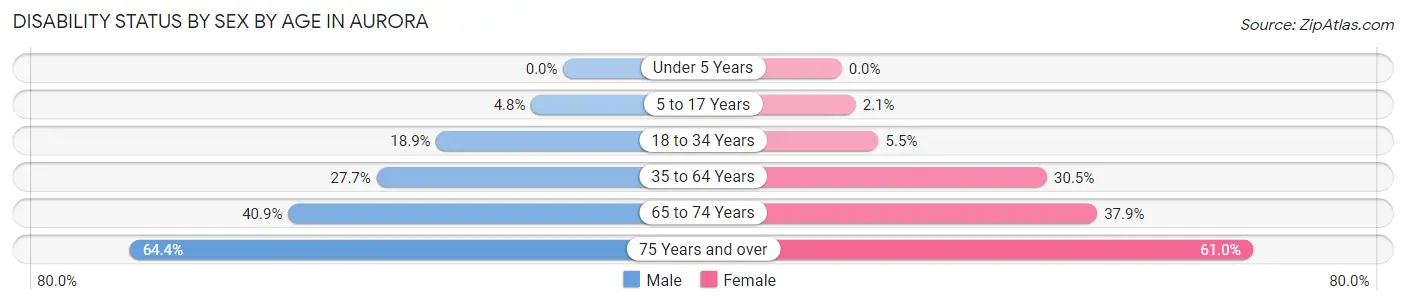
| Age Bracket | Male | Female |
| Under 5 Years | 0 (0.0%) | 0 (0.0%) |
| 5 to 17 Years | 13 (4.8%) | 6 (2.1%) |
| 18 to 34 Years | 72 (18.9%) | 18 (5.5%) |
| 35 to 64 Years | 216 (27.7%) | 222 (30.5%) |
| 65 to 74 Years | 58 (40.8%) | 33 (37.9%) |
| 75 Years and over | 47 (64.4%) | 75 (61.0%) |
Disability Class by Sex by Age in Aurora
Disability Class: Hearing Difficulty
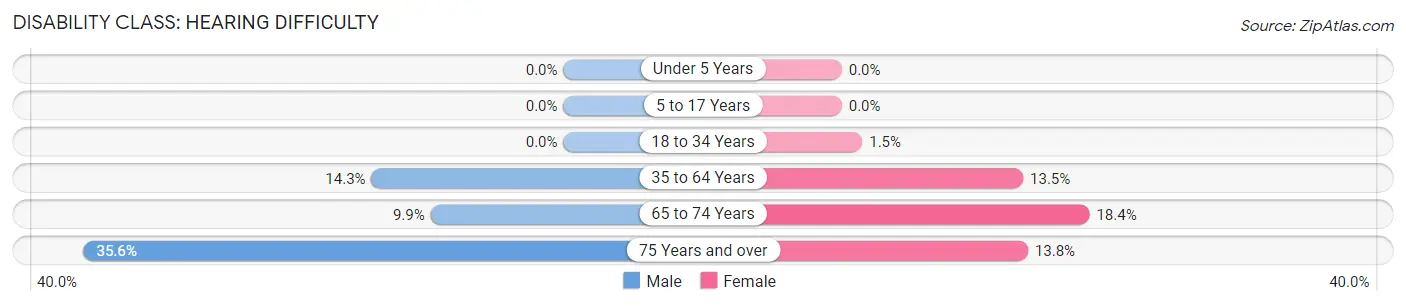
| Age Bracket | Male | Female |
| Under 5 Years | 0 (0.0%) | 0 (0.0%) |
| 5 to 17 Years | 0 (0.0%) | 0 (0.0%) |
| 18 to 34 Years | 0 (0.0%) | 5 (1.5%) |
| 35 to 64 Years | 111 (14.2%) | 98 (13.5%) |
| 65 to 74 Years | 14 (9.9%) | 16 (18.4%) |
| 75 Years and over | 26 (35.6%) | 17 (13.8%) |
Disability Class: Vision Difficulty
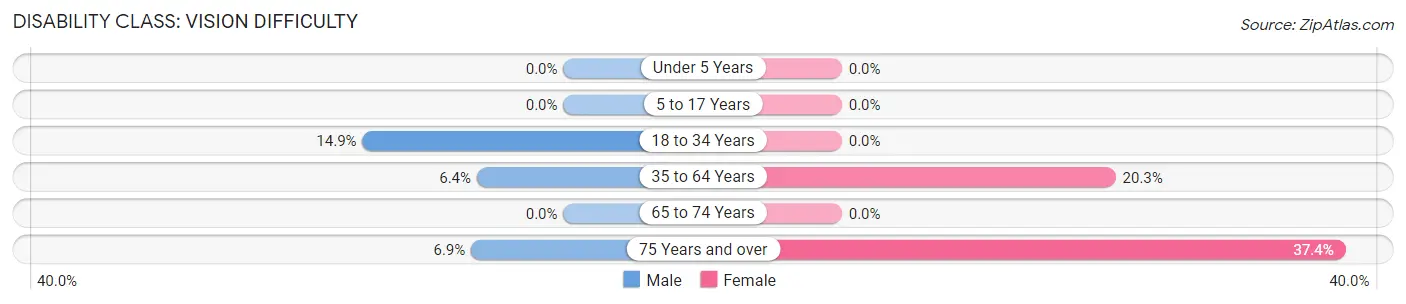
| Age Bracket | Male | Female |
| Under 5 Years | 0 (0.0%) | 0 (0.0%) |
| 5 to 17 Years | 0 (0.0%) | 0 (0.0%) |
| 18 to 34 Years | 57 (14.9%) | 0 (0.0%) |
| 35 to 64 Years | 50 (6.4%) | 148 (20.3%) |
| 65 to 74 Years | 0 (0.0%) | 0 (0.0%) |
| 75 Years and over | 5 (6.9%) | 46 (37.4%) |
Disability Class: Cognitive Difficulty
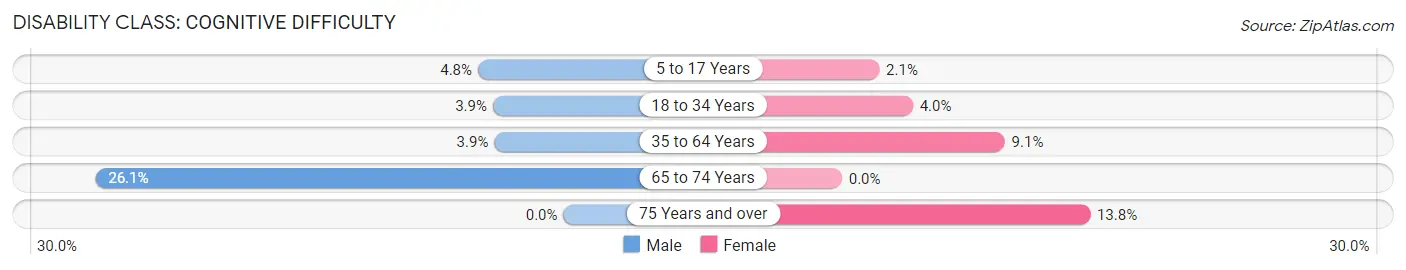
| Age Bracket | Male | Female |
| 5 to 17 Years | 13 (4.8%) | 6 (2.1%) |
| 18 to 34 Years | 15 (3.9%) | 13 (4.0%) |
| 35 to 64 Years | 30 (3.8%) | 66 (9.1%) |
| 65 to 74 Years | 37 (26.1%) | 0 (0.0%) |
| 75 Years and over | 0 (0.0%) | 17 (13.8%) |
Disability Class: Ambulatory Difficulty
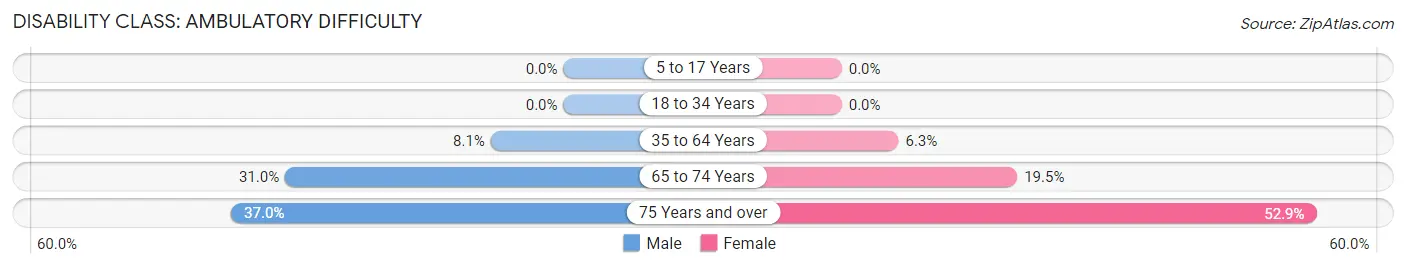
| Age Bracket | Male | Female |
| 5 to 17 Years | 0 (0.0%) | 0 (0.0%) |
| 18 to 34 Years | 0 (0.0%) | 0 (0.0%) |
| 35 to 64 Years | 63 (8.1%) | 46 (6.3%) |
| 65 to 74 Years | 44 (31.0%) | 17 (19.5%) |
| 75 Years and over | 27 (37.0%) | 65 (52.8%) |
Disability Class: Self-Care Difficulty
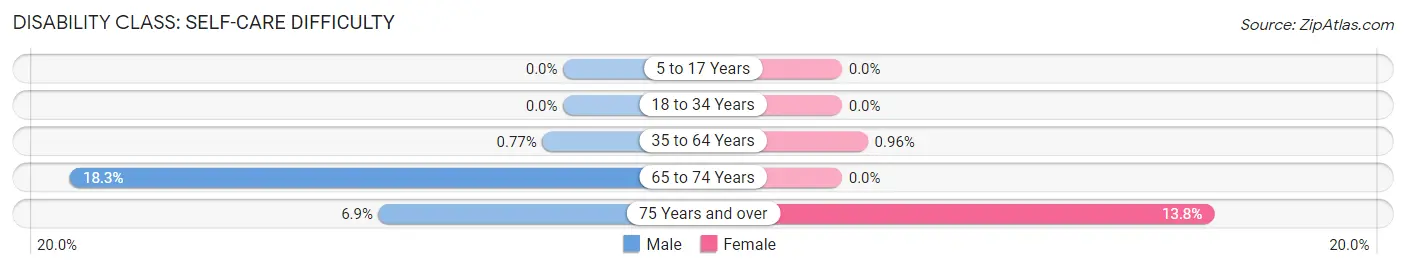
| Age Bracket | Male | Female |
| 5 to 17 Years | 0 (0.0%) | 0 (0.0%) |
| 18 to 34 Years | 0 (0.0%) | 0 (0.0%) |
| 35 to 64 Years | 6 (0.8%) | 7 (1.0%) |
| 65 to 74 Years | 26 (18.3%) | 0 (0.0%) |
| 75 Years and over | 5 (6.9%) | 17 (13.8%) |
Technology Access in Aurora
Computing Device Access in Aurora
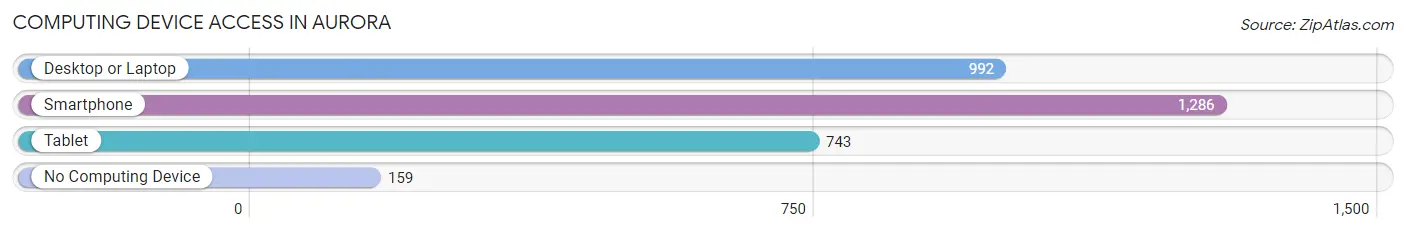
| Device Type | # Households | % Households |
| Desktop or Laptop | 992 | 64.9% |
| Smartphone | 1,286 | 84.1% |
| Tablet | 743 | 48.6% |
| No Computing Device | 159 | 10.4% |
| Total | 1,529 | 100.0% |
Internet Access in Aurora
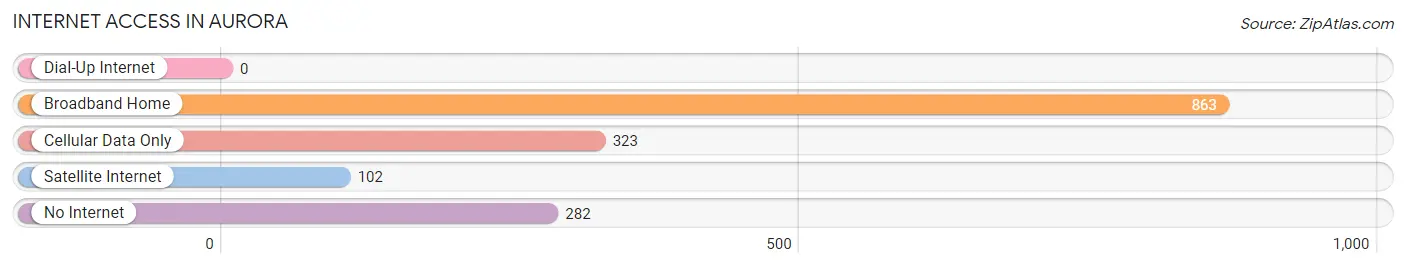
| Internet Type | # Households | % Households |
| Dial-Up Internet | 0 | 0.0% |
| Broadband Home | 863 | 56.4% |
| Cellular Data Only | 323 | 21.1% |
| Satellite Internet | 102 | 6.7% |
| No Internet | 282 | 18.4% |
| Total | 1,529 | 100.0% |
Aurora Summary
Aurora, Indiana is a small town located in Dearborn County, Indiana, United States. It is situated along the Ohio River, approximately 50 miles west of Cincinnati, Ohio. The population was estimated to be 3,845 in the year 2000.
History
Aurora was founded in 1819 by a group of settlers from North Carolina. The town was named after the Roman goddess of the dawn, Aurora. The town was originally a trading post and ferry crossing on the Ohio River. In 1844, the first bridge was built across the river, connecting Aurora to the town of Lawrenceburg, Indiana.
In 1856, the first railroad line was built through Aurora, connecting it to Cincinnati. This allowed for the growth of the town, as it became a popular stop for travelers and goods. The town was incorporated in 1867.
Geography
Aurora is located in Dearborn County, Indiana, along the Ohio River. It is situated approximately 50 miles west of Cincinnati, Ohio. The town is located in a rural area, with the nearest large city being Cincinnati. The terrain is mostly flat, with some rolling hills.
The climate in Aurora is humid continental, with hot summers and cold winters. The average temperature in the summer is around 80 degrees Fahrenheit, and the average temperature in the winter is around 30 degrees Fahrenheit.
Economy
Aurora’s economy is largely based on agriculture and manufacturing. The town is home to several large manufacturing companies, including Aurora Casket Company, Aurora Plastics, and Aurora Bearing Company.
Agriculture is also an important part of the economy. The town is home to several large farms, which produce corn, soybeans, wheat, and other crops.
Demographics
As of the year 2000, the population of Aurora was estimated to be 3,845. The racial makeup of the town was 97.3% White, 0.7% African American, 0.3% Native American, 0.3% Asian, and 1.4% from other races. The median household income was $37,917, and the median family income was $45,917.
Conclusion
Aurora, Indiana is a small town located in Dearborn County, Indiana, United States. It is situated along the Ohio River, approximately 50 miles west of Cincinnati, Ohio. The population was estimated to be 3,845 in the year 2000. The town’s economy is largely based on agriculture and manufacturing, and the racial makeup of the town is predominantly White. Aurora is a small town with a rich history and a bright future.
Common Questions
What is Per Capita Income in Aurora?
Per Capita income in Aurora is $25,508.
What is the Median Family Income in Aurora?
Median Family Income in Aurora is $52,778.
What is the Median Household income in Aurora?
Median Household Income in Aurora is $44,636.
What is Income or Wage Gap in Aurora?
Income or Wage Gap in Aurora is 38.2%.
Women in Aurora earn 61.8 cents for every dollar earned by a man.
What is Inequality or Gini Index in Aurora?
Inequality or Gini Index in Aurora is 0.44.
What is the Total Population of Aurora?
Total Population of Aurora is 3,301.
What is the Total Male Population of Aurora?
Total Male Population of Aurora is 1,701.
What is the Total Female Population of Aurora?
Total Female Population of Aurora is 1,600.
What is the Ratio of Males per 100 Females in Aurora?
There are 106.31 Males per 100 Females in Aurora.
What is the Ratio of Females per 100 Males in Aurora?
There are 94.06 Females per 100 Males in Aurora.
What is the Median Population Age in Aurora?
Median Population Age in Aurora is 44.0 Years.
What is the Average Family Size in Aurora
Average Family Size in Aurora is 2.7 People.
What is the Average Household Size in Aurora
Average Household Size in Aurora is 2.2 People.
How Large is the Labor Force in Aurora?
There are 1,869 People in the Labor Forcein in Aurora.
What is the Percentage of People in the Labor Force in Aurora?
68.1% of People are in the Labor Force in Aurora.
What is the Unemployment Rate in Aurora?
Unemployment Rate in Aurora is 4.1%.