Zip Codes with the Highest Percentage of Population Employed in Food Preparation & Serving in Gary, IN
RELATED REPORTS & OPTIONS
Food Preparation & Serving
Gary
Compare Zip Codes
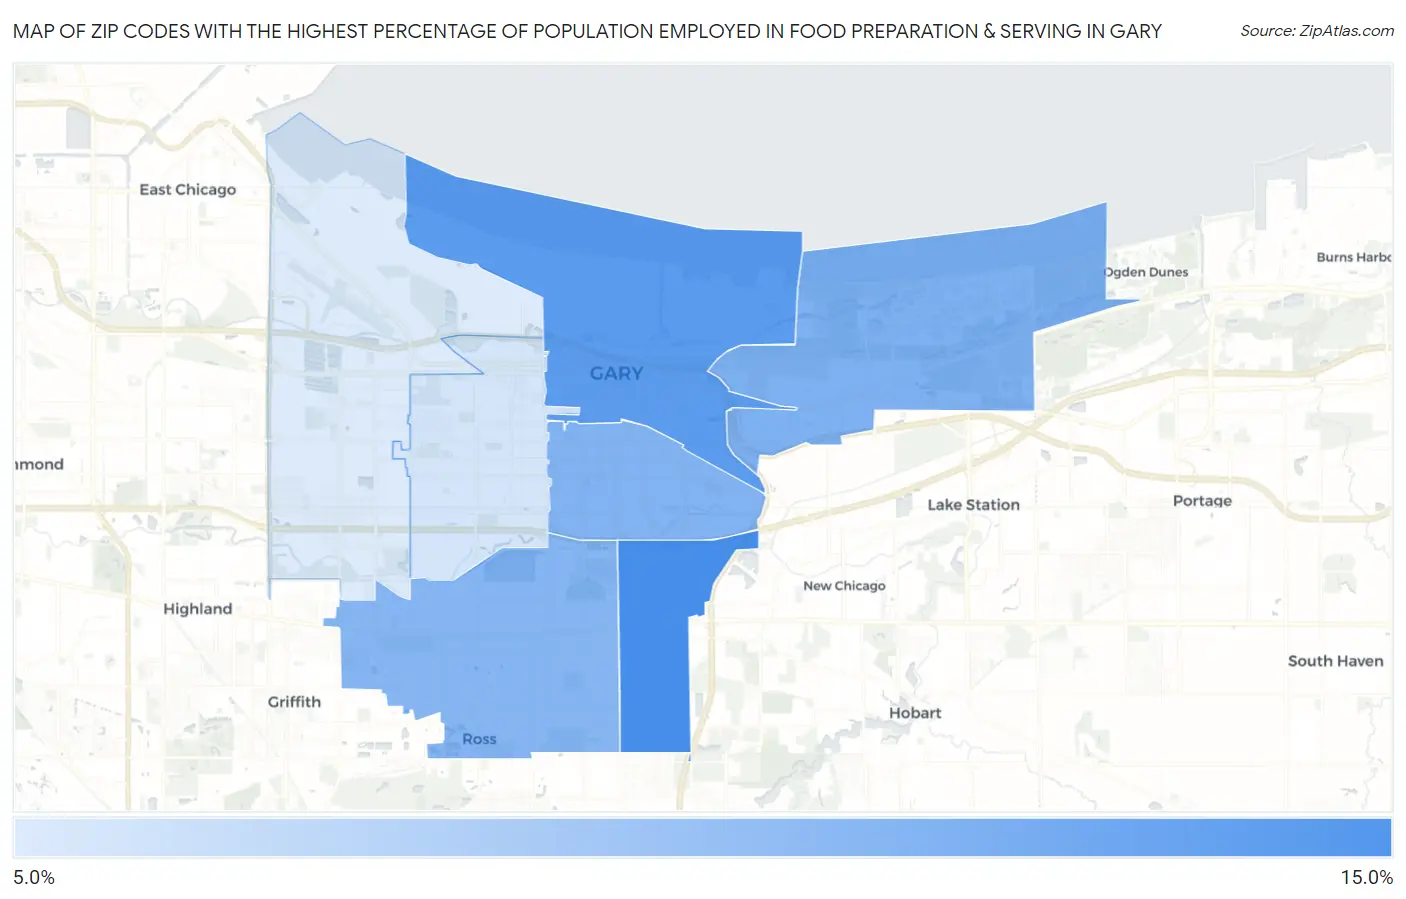
Map of Zip Codes with the Highest Percentage of Population Employed in Food Preparation & Serving in Gary
5.3%
12.0%
Zip Codes with the Highest Percentage of Population Employed in Food Preparation & Serving in Gary, IN
| Zip Code | % Employed | vs State | vs National | |
| 1. | 46409 | 12.0% | 5.3%(+6.68)#28 | 5.3%(+6.71)#1,670 |
| 2. | 46402 | 11.2% | 5.3%(+5.86)#40 | 5.3%(+5.88)#1,972 |
| 3. | 46403 | 9.5% | 5.3%(+4.16)#67 | 5.3%(+4.19)#3,074 |
| 4. | 46407 | 9.3% | 5.3%(+4.02)#69 | 5.3%(+4.05)#3,204 |
| 5. | 46408 | 9.2% | 5.3%(+3.88)#74 | 5.3%(+3.91)#3,330 |
| 6. | 46404 | 5.7% | 5.3%(+0.364)#267 | 5.3%(+0.392)#10,434 |
| 7. | 46406 | 5.3% | 5.3%(-0.040)#298 | 5.3%(-0.012)#11,860 |
1
Common Questions
What are the Top 5 Zip Codes with the Highest Percentage of Population Employed in Food Preparation & Serving in Gary, IN?
Top 5 Zip Codes with the Highest Percentage of Population Employed in Food Preparation & Serving in Gary, IN are:
What zip code has the Highest Percentage of Population Employed in Food Preparation & Serving in Gary, IN?
46409 has the Highest Percentage of Population Employed in Food Preparation & Serving in Gary, IN with 12.0%.
What is the Percentage of Population Employed in Food Preparation & Serving in Gary, IN?
Percentage of Population Employed in Food Preparation & Serving in Gary is 8.4%.
What is the Percentage of Population Employed in Food Preparation & Serving in Indiana?
Percentage of Population Employed in Food Preparation & Serving in Indiana is 5.3%.
What is the Percentage of Population Employed in Food Preparation & Serving in the United States?
Percentage of Population Employed in Food Preparation & Serving in the United States is 5.3%.