Zip Codes with the Highest Percentage of Population Employed in Food Preparation & Serving in Valparaiso, IN
RELATED REPORTS & OPTIONS
Food Preparation & Serving
Valparaiso
Compare Zip Codes
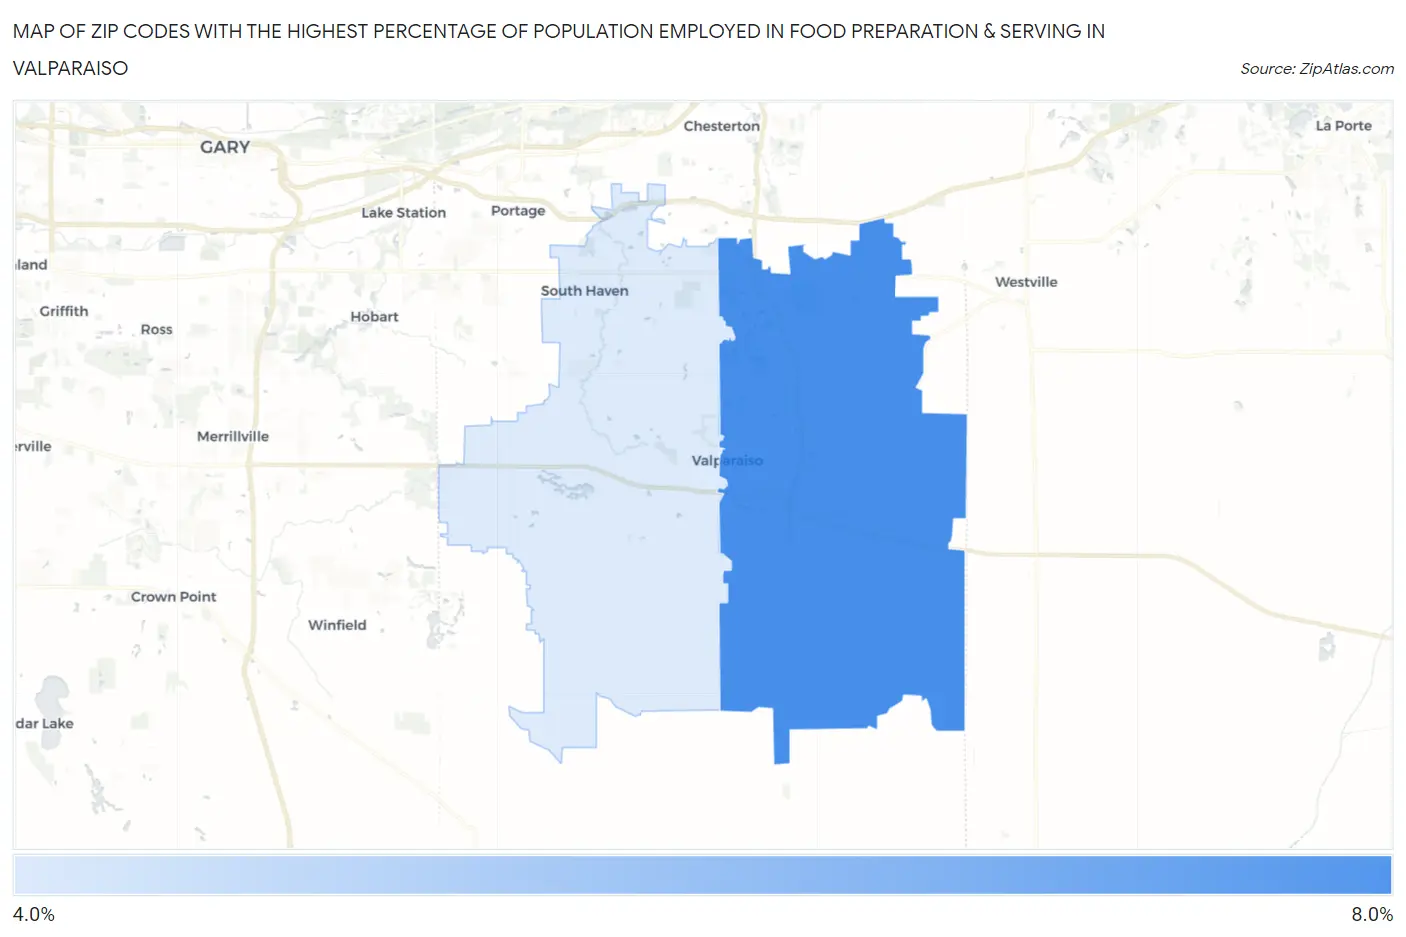
Map of Zip Codes with the Highest Percentage of Population Employed in Food Preparation & Serving in Valparaiso
4.5%
6.4%
Zip Codes with the Highest Percentage of Population Employed in Food Preparation & Serving in Valparaiso, IN
| Zip Code | % Employed | vs State | vs National | |
| 1. | 46383 | 6.4% | 5.3%(+1.12)#186 | 5.3%(+1.15)#8,049 |
| 2. | 46385 | 4.5% | 5.3%(-0.771)#371 | 5.3%(-0.743)#14,849 |
1
Common Questions
What are the Top Zip Codes with the Highest Percentage of Population Employed in Food Preparation & Serving in Valparaiso, IN?
Top Zip Codes with the Highest Percentage of Population Employed in Food Preparation & Serving in Valparaiso, IN are:
What zip code has the Highest Percentage of Population Employed in Food Preparation & Serving in Valparaiso, IN?
46383 has the Highest Percentage of Population Employed in Food Preparation & Serving in Valparaiso, IN with 6.4%.
What is the Percentage of Population Employed in Food Preparation & Serving in Valparaiso, IN?
Percentage of Population Employed in Food Preparation & Serving in Valparaiso is 6.9%.
What is the Percentage of Population Employed in Food Preparation & Serving in Indiana?
Percentage of Population Employed in Food Preparation & Serving in Indiana is 5.3%.
What is the Percentage of Population Employed in Food Preparation & Serving in the United States?
Percentage of Population Employed in Food Preparation & Serving in the United States is 5.3%.