Zip Codes with the Highest Percentage of Population Employed in Food Preparation & Serving in Bloomington, IN
RELATED REPORTS & OPTIONS
Food Preparation & Serving
Bloomington
Compare Zip Codes
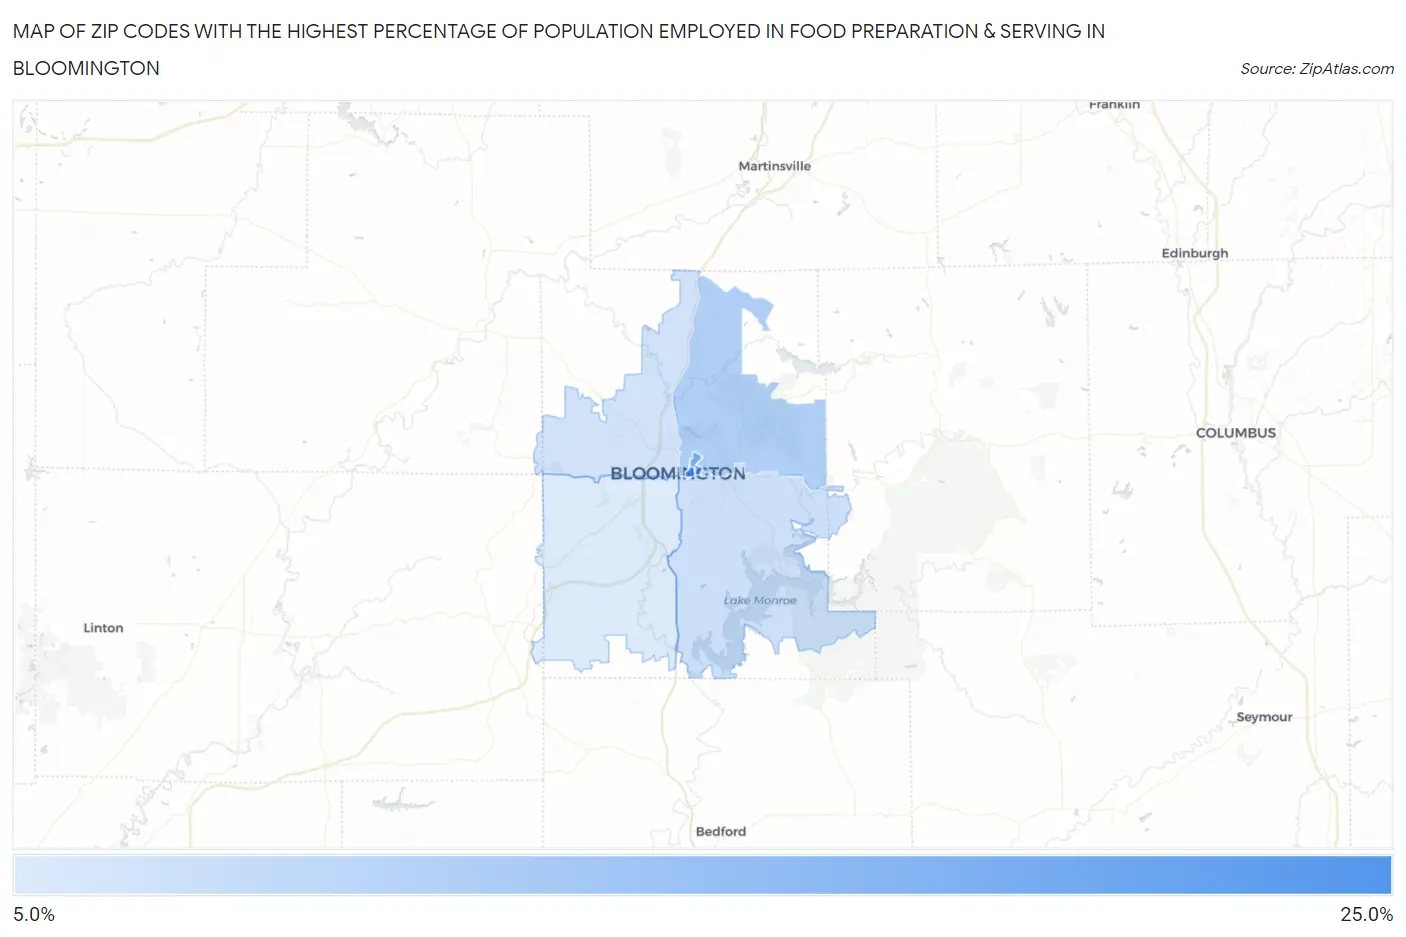
Map of Zip Codes with the Highest Percentage of Population Employed in Food Preparation & Serving in Bloomington
5.9%
23.4%
Zip Codes with the Highest Percentage of Population Employed in Food Preparation & Serving in Bloomington, IN
| Zip Code | % Employed | vs State | vs National | |
| 1. | 47405 | 23.4% | 5.3%(+18.1)#5 | 5.3%(+18.1)#373 |
| 2. | 47406 | 17.6% | 5.3%(+12.3)#12 | 5.3%(+12.4)#688 |
| 3. | 47408 | 10.8% | 5.3%(+5.47)#45 | 5.3%(+5.50)#2,161 |
| 4. | 47401 | 7.7% | 5.3%(+2.35)#120 | 5.3%(+2.38)#5,274 |
| 5. | 47404 | 7.0% | 5.3%(+1.73)#142 | 5.3%(+1.76)#6,444 |
| 6. | 47403 | 5.9% | 5.3%(+0.584)#248 | 5.3%(+0.612)#9,693 |
1
Common Questions
What are the Top 5 Zip Codes with the Highest Percentage of Population Employed in Food Preparation & Serving in Bloomington, IN?
Top 5 Zip Codes with the Highest Percentage of Population Employed in Food Preparation & Serving in Bloomington, IN are:
What zip code has the Highest Percentage of Population Employed in Food Preparation & Serving in Bloomington, IN?
47405 has the Highest Percentage of Population Employed in Food Preparation & Serving in Bloomington, IN with 23.4%.
What is the Percentage of Population Employed in Food Preparation & Serving in Bloomington, IN?
Percentage of Population Employed in Food Preparation & Serving in Bloomington is 9.9%.
What is the Percentage of Population Employed in Food Preparation & Serving in Indiana?
Percentage of Population Employed in Food Preparation & Serving in Indiana is 5.3%.
What is the Percentage of Population Employed in Food Preparation & Serving in the United States?
Percentage of Population Employed in Food Preparation & Serving in the United States is 5.3%.