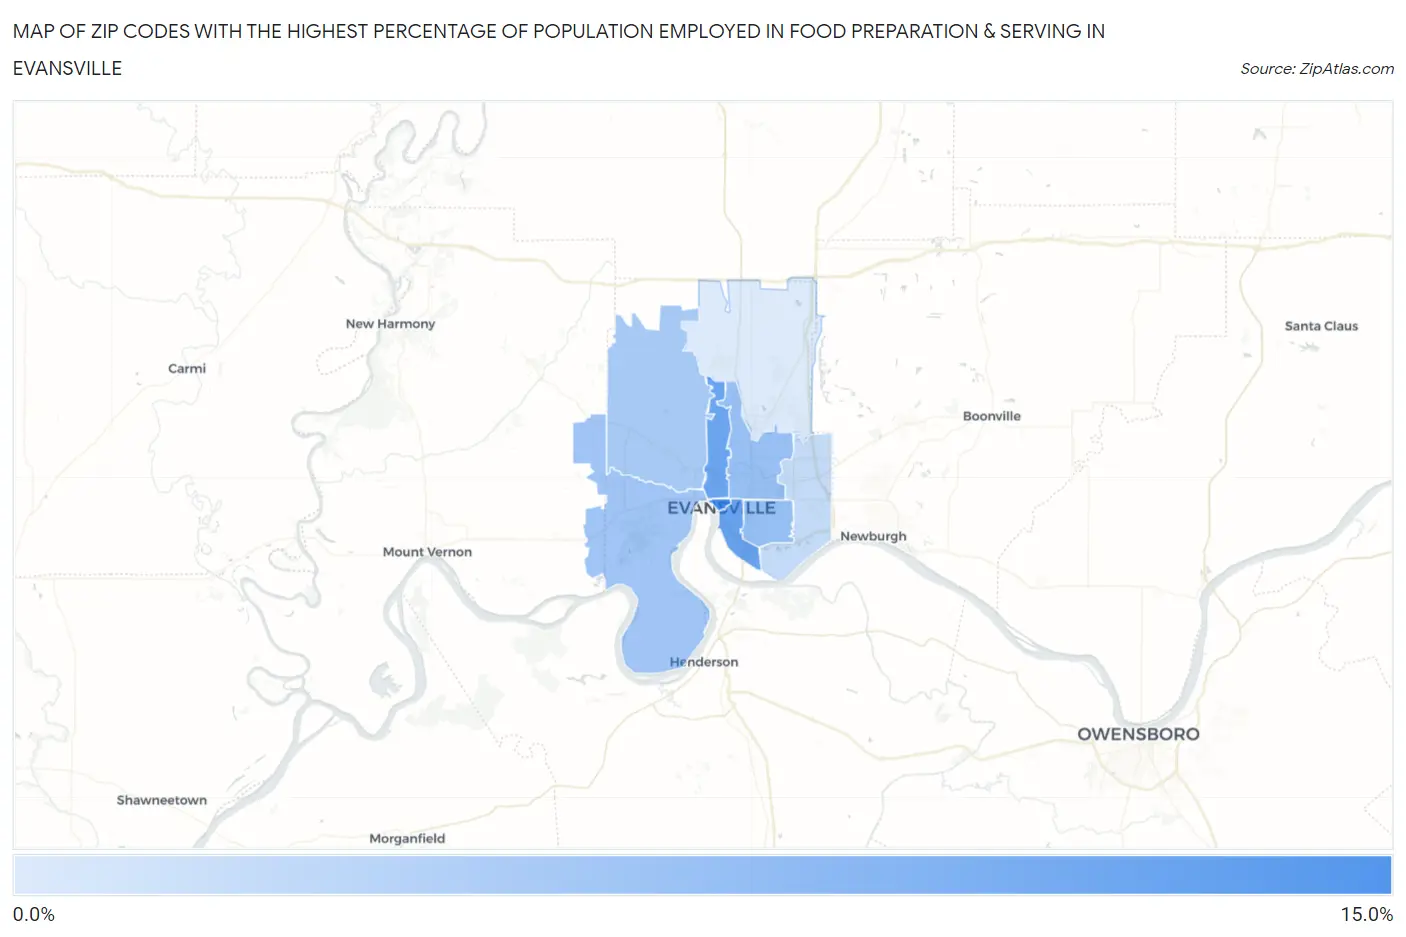
Zip Codes with the Highest Percentage of Population Employed in Food Preparation & Serving in Evansville, IN
RELATED REPORTS & OPTIONS
Food Preparation & Serving
Evansville
Compare Zip Codes
Map of Zip Codes with the Highest Percentage of Population Employed in Food Preparation & Serving in Evansville
2.8%
11.5%
Zip Codes with the Highest Percentage of Population Employed in Food Preparation & Serving in Evansville, IN
| Zip Code | % Employed | vs State | vs National | |
| 1. | 47708 | 11.5% | 5.3%(+6.17)#34 | 5.3%(+6.19)#1,850 |
| 2. | 47713 | 9.6% | 5.3%(+4.30)#66 | 5.3%(+4.33)#2,962 |
| 3. | 47710 | 9.3% | 5.3%(+4.02)#70 | 5.3%(+4.05)#3,208 |
| 4. | 47714 | 6.9% | 5.3%(+1.60)#155 | 5.3%(+1.63)#6,779 |
| 5. | 47711 | 6.7% | 5.3%(+1.43)#166 | 5.3%(+1.46)#7,220 |
| 6. | 47712 | 6.2% | 5.3%(+0.838)#216 | 5.3%(+0.866)#8,874 |
| 7. | 47720 | 5.9% | 5.3%(+0.541)#255 | 5.3%(+0.569)#9,844 |
| 8. | 47715 | 4.3% | 5.3%(-1.05)#406 | 5.3%(-1.02)#16,041 |
| 9. | 47725 | 2.8% | 5.3%(-2.47)#546 | 5.3%(-2.44)#21,880 |
1
Common Questions
What are the Top 5 Zip Codes with the Highest Percentage of Population Employed in Food Preparation & Serving in Evansville, IN?
Top 5 Zip Codes with the Highest Percentage of Population Employed in Food Preparation & Serving in Evansville, IN are:
What zip code has the Highest Percentage of Population Employed in Food Preparation & Serving in Evansville, IN?
47708 has the Highest Percentage of Population Employed in Food Preparation & Serving in Evansville, IN with 11.5%.
What is the Percentage of Population Employed in Food Preparation & Serving in Evansville, IN?
Percentage of Population Employed in Food Preparation & Serving in Evansville is 7.3%.
What is the Percentage of Population Employed in Food Preparation & Serving in Indiana?
Percentage of Population Employed in Food Preparation & Serving in Indiana is 5.3%.
What is the Percentage of Population Employed in Food Preparation & Serving in the United States?
Percentage of Population Employed in Food Preparation & Serving in the United States is 5.3%.