Zip Codes with the Highest Percentage of Population Employed in Food Preparation & Serving in Carmel, IN
RELATED REPORTS & OPTIONS
Food Preparation & Serving
Carmel
Compare Zip Codes
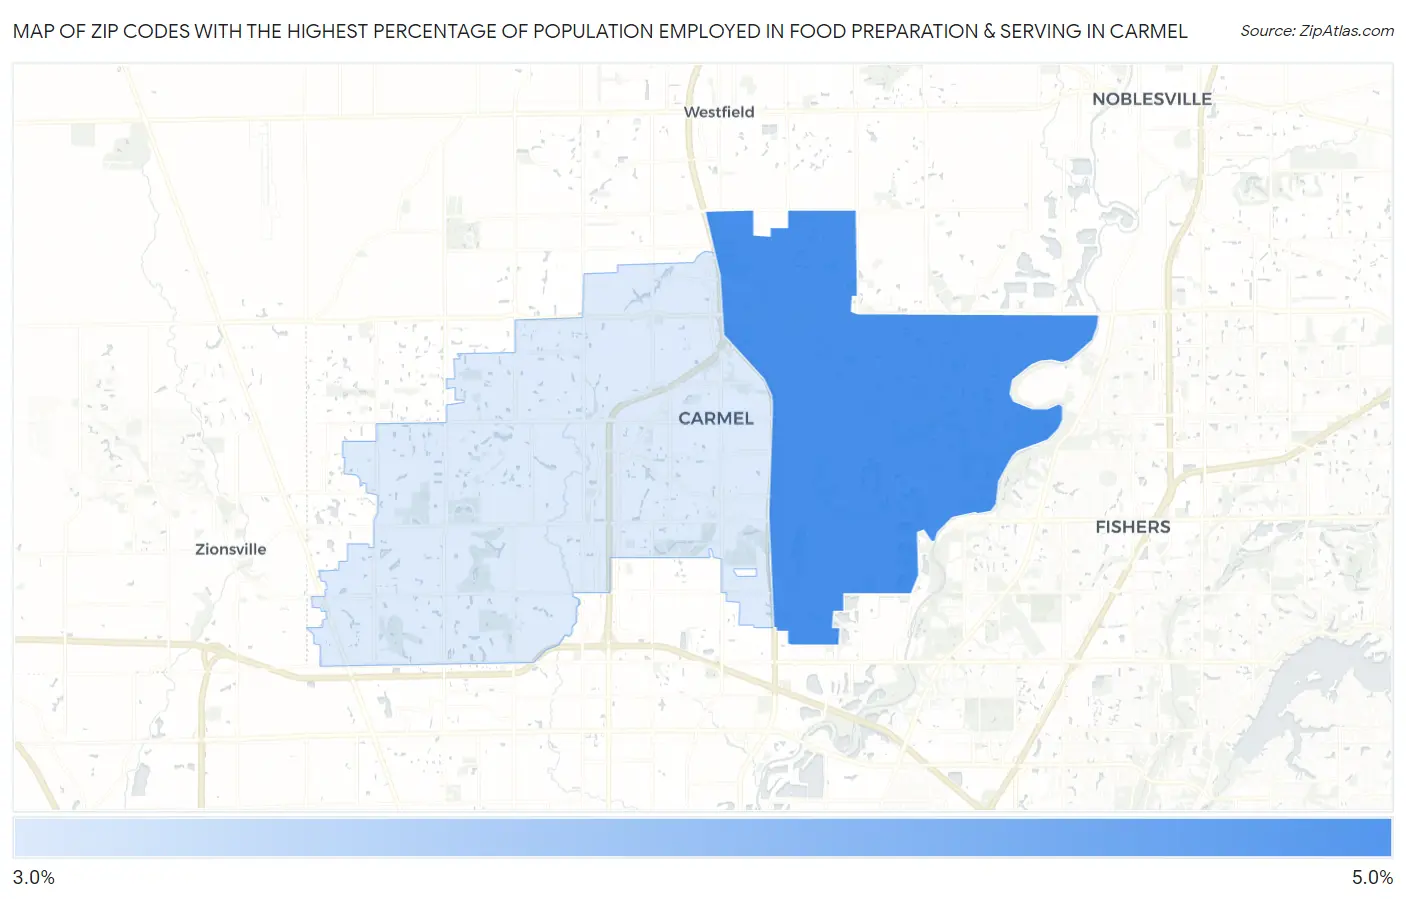
Map of Zip Codes with the Highest Percentage of Population Employed in Food Preparation & Serving in Carmel
4.0%
4.3%
Zip Codes with the Highest Percentage of Population Employed in Food Preparation & Serving in Carmel, IN
| Zip Code | % Employed | vs State | vs National | |
| 1. | 46033 | 4.3% | 5.3%(-0.998)#396 | 5.3%(-0.970)#15,816 |
| 2. | 46032 | 4.0% | 5.3%(-1.36)#441 | 5.3%(-1.33)#17,309 |
1
Common Questions
What are the Top Zip Codes with the Highest Percentage of Population Employed in Food Preparation & Serving in Carmel, IN?
Top Zip Codes with the Highest Percentage of Population Employed in Food Preparation & Serving in Carmel, IN are:
What zip code has the Highest Percentage of Population Employed in Food Preparation & Serving in Carmel, IN?
46033 has the Highest Percentage of Population Employed in Food Preparation & Serving in Carmel, IN with 4.3%.
What is the Percentage of Population Employed in Food Preparation & Serving in Carmel, IN?
Percentage of Population Employed in Food Preparation & Serving in Carmel is 4.7%.
What is the Percentage of Population Employed in Food Preparation & Serving in Indiana?
Percentage of Population Employed in Food Preparation & Serving in Indiana is 5.3%.
What is the Percentage of Population Employed in Food Preparation & Serving in the United States?
Percentage of Population Employed in Food Preparation & Serving in the United States is 5.3%.