Zip Codes with the Highest Percentage of Population Employed in Food Preparation & Serving in Indiana
RELATED REPORTS & OPTIONS
Food Preparation & Serving
Indiana
Compare Zip Codes
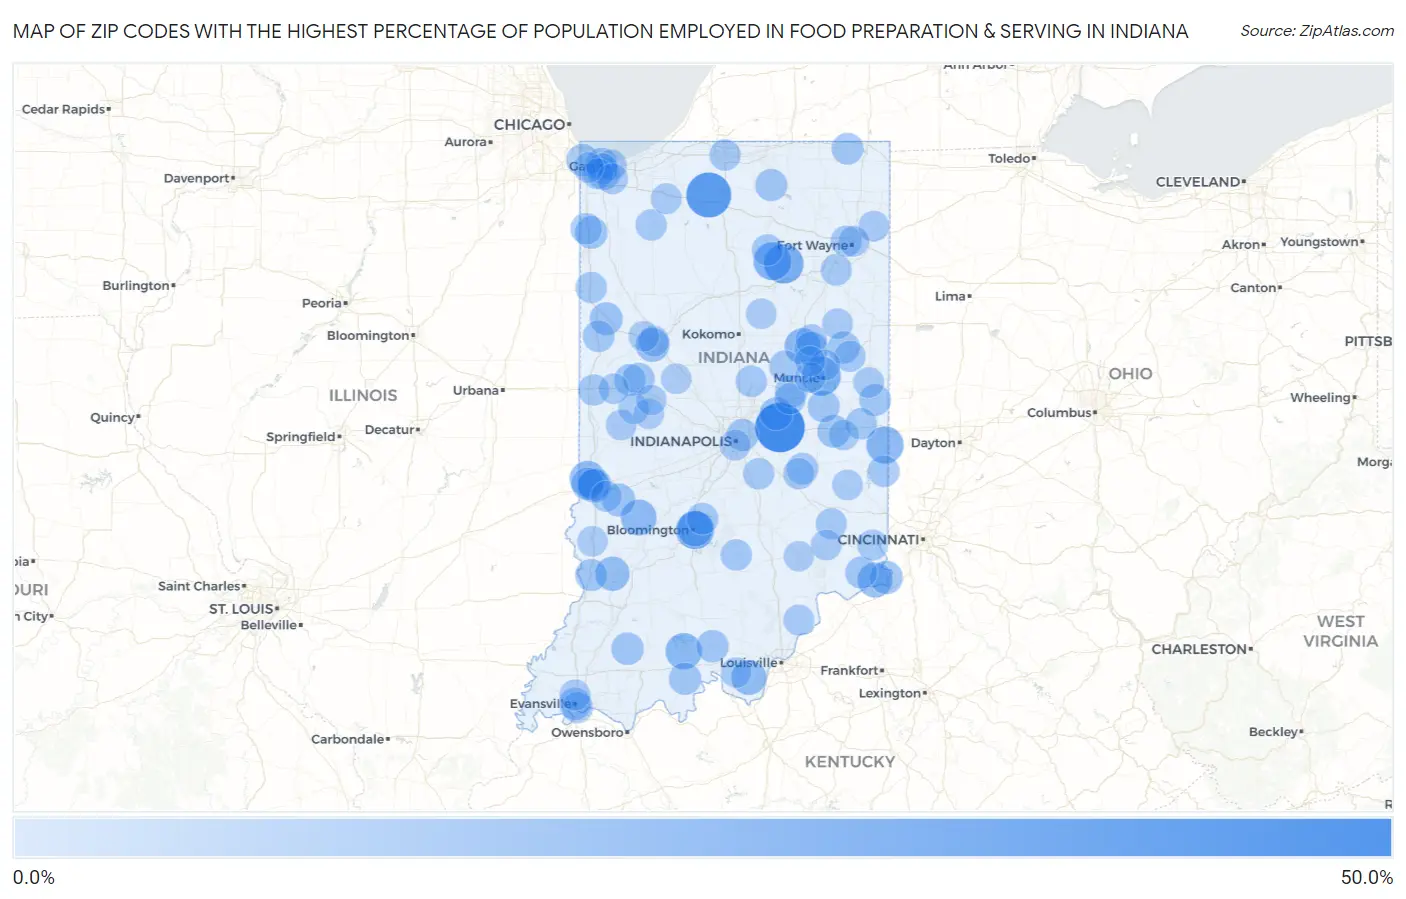
Map of Zip Codes with the Highest Percentage of Population Employed in Food Preparation & Serving in Indiana
0.0%
50.0%
Zip Codes with the Highest Percentage of Population Employed in Food Preparation & Serving in Indiana
| Zip Code | % Employed | vs State | vs National | |
| 1. | 46154 | 44.7% | 5.3%(+39.4)#1 | 5.3%(+39.5)#76 |
| 2. | 46572 | 35.8% | 5.3%(+30.5)#2 | 5.3%(+30.6)#142 |
| 3. | 46980 | 25.4% | 5.3%(+20.1)#3 | 5.3%(+20.1)#301 |
| 4. | 47306 | 24.5% | 5.3%(+19.2)#4 | 5.3%(+19.3)#326 |
| 5. | 47405 | 23.4% | 5.3%(+18.1)#5 | 5.3%(+18.1)#373 |
| 6. | 46943 | 22.4% | 5.3%(+17.1)#6 | 5.3%(+17.2)#405 |
| 7. | 47324 | 21.2% | 5.3%(+15.8)#7 | 5.3%(+15.9)#451 |
| 8. | 47116 | 19.4% | 5.3%(+14.1)#8 | 5.3%(+14.2)#535 |
| 9. | 46930 | 18.5% | 5.3%(+13.2)#9 | 5.3%(+13.2)#611 |
| 10. | 47427 | 18.3% | 5.3%(+12.9)#10 | 5.3%(+13.0)#632 |
| 11. | 47876 | 18.1% | 5.3%(+12.8)#11 | 5.3%(+12.8)#648 |
| 12. | 47406 | 17.6% | 5.3%(+12.3)#12 | 5.3%(+12.4)#688 |
| 13. | 47809 | 16.8% | 5.3%(+11.5)#13 | 5.3%(+11.5)#761 |
| 14. | 47020 | 16.8% | 5.3%(+11.5)#14 | 5.3%(+11.5)#768 |
| 15. | 47160 | 16.7% | 5.3%(+11.4)#15 | 5.3%(+11.4)#784 |
| 16. | 47596 | 15.4% | 5.3%(+10.1)#16 | 5.3%(+10.1)#932 |
| 17. | 46957 | 14.5% | 5.3%(+9.19)#17 | 5.3%(+9.21)#1,061 |
| 18. | 47901 | 14.5% | 5.3%(+9.15)#18 | 5.3%(+9.18)#1,065 |
| 19. | 47038 | 13.5% | 5.3%(+8.14)#19 | 5.3%(+8.17)#1,287 |
| 20. | 47846 | 13.2% | 5.3%(+7.85)#20 | 5.3%(+7.88)#1,348 |
| 21. | 47944 | 13.1% | 5.3%(+7.75)#21 | 5.3%(+7.78)#1,376 |
| 22. | 46048 | 13.0% | 5.3%(+7.69)#22 | 5.3%(+7.72)#1,394 |
| 23. | 47387 | 12.7% | 5.3%(+7.40)#23 | 5.3%(+7.43)#1,463 |
| 24. | 47885 | 12.3% | 5.3%(+6.95)#24 | 5.3%(+6.98)#1,577 |
| 25. | 46379 | 12.2% | 5.3%(+6.93)#25 | 5.3%(+6.96)#1,582 |
| 26. | 47590 | 12.2% | 5.3%(+6.88)#26 | 5.3%(+6.91)#1,596 |
| 27. | 46016 | 12.1% | 5.3%(+6.76)#27 | 5.3%(+6.79)#1,638 |
| 28. | 46409 | 12.0% | 5.3%(+6.68)#28 | 5.3%(+6.71)#1,670 |
| 29. | 46327 | 11.8% | 5.3%(+6.53)#29 | 5.3%(+6.56)#1,719 |
| 30. | 47140 | 11.8% | 5.3%(+6.47)#30 | 5.3%(+6.49)#1,739 |
| 31. | 47514 | 11.8% | 5.3%(+6.45)#31 | 5.3%(+6.48)#1,747 |
| 32. | 46553 | 11.5% | 5.3%(+6.22)#32 | 5.3%(+6.25)#1,839 |
| 33. | 47336 | 11.5% | 5.3%(+6.17)#33 | 5.3%(+6.20)#1,848 |
| 34. | 47708 | 11.5% | 5.3%(+6.17)#34 | 5.3%(+6.19)#1,850 |
| 35. | 46218 | 11.5% | 5.3%(+6.15)#35 | 5.3%(+6.18)#1,855 |
| 36. | 47561 | 11.3% | 5.3%(+6.00)#36 | 5.3%(+6.03)#1,911 |
| 37. | 47361 | 11.3% | 5.3%(+5.95)#37 | 5.3%(+5.98)#1,929 |
| 38. | 47967 | 11.3% | 5.3%(+5.94)#38 | 5.3%(+5.97)#1,932 |
| 39. | 47807 | 11.2% | 5.3%(+5.88)#39 | 5.3%(+5.91)#1,962 |
| 40. | 46402 | 11.2% | 5.3%(+5.86)#40 | 5.3%(+5.88)#1,972 |
| 41. | 47011 | 11.1% | 5.3%(+5.74)#41 | 5.3%(+5.77)#2,032 |
| 42. | 47994 | 11.0% | 5.3%(+5.65)#42 | 5.3%(+5.68)#2,072 |
| 43. | 46776 | 10.9% | 5.3%(+5.58)#43 | 5.3%(+5.60)#2,108 |
| 44. | 47355 | 10.8% | 5.3%(+5.49)#44 | 5.3%(+5.52)#2,154 |
| 45. | 47408 | 10.8% | 5.3%(+5.47)#45 | 5.3%(+5.50)#2,161 |
| 46. | 46146 | 10.7% | 5.3%(+5.42)#46 | 5.3%(+5.45)#2,187 |
| 47. | 46063 | 10.6% | 5.3%(+5.28)#47 | 5.3%(+5.31)#2,265 |
| 48. | 47921 | 10.5% | 5.3%(+5.22)#48 | 5.3%(+5.25)#2,308 |
| 49. | 47003 | 10.5% | 5.3%(+5.19)#49 | 5.3%(+5.22)#2,325 |
| 50. | 47345 | 10.3% | 5.3%(+4.94)#50 | 5.3%(+4.97)#2,451 |
| 51. | 46376 | 10.2% | 5.3%(+4.87)#51 | 5.3%(+4.90)#2,491 |
| 52. | 46030 | 10.2% | 5.3%(+4.85)#52 | 5.3%(+4.87)#2,514 |
| 53. | 47235 | 10.1% | 5.3%(+4.78)#53 | 5.3%(+4.80)#2,566 |
| 54. | 46982 | 10.1% | 5.3%(+4.77)#54 | 5.3%(+4.80)#2,567 |
| 55. | 46374 | 10.0% | 5.3%(+4.72)#55 | 5.3%(+4.75)#2,606 |
| 56. | 46601 | 10.0% | 5.3%(+4.67)#56 | 5.3%(+4.70)#2,649 |
| 57. | 47951 | 9.9% | 5.3%(+4.61)#57 | 5.3%(+4.64)#2,688 |
| 58. | 46989 | 9.9% | 5.3%(+4.60)#58 | 5.3%(+4.63)#2,692 |
| 59. | 46162 | 9.8% | 5.3%(+4.51)#59 | 5.3%(+4.54)#2,777 |
| 60. | 46150 | 9.8% | 5.3%(+4.48)#60 | 5.3%(+4.50)#2,806 |
| 61. | 46013 | 9.8% | 5.3%(+4.45)#61 | 5.3%(+4.48)#2,828 |
| 62. | 47932 | 9.8% | 5.3%(+4.45)#62 | 5.3%(+4.48)#2,829 |
| 63. | 46799 | 9.7% | 5.3%(+4.35)#63 | 5.3%(+4.38)#2,916 |
| 64. | 46808 | 9.6% | 5.3%(+4.31)#64 | 5.3%(+4.34)#2,946 |
| 65. | 47373 | 9.6% | 5.3%(+4.31)#65 | 5.3%(+4.34)#2,947 |
| 66. | 47713 | 9.6% | 5.3%(+4.30)#66 | 5.3%(+4.33)#2,962 |
| 67. | 46403 | 9.5% | 5.3%(+4.16)#67 | 5.3%(+4.19)#3,074 |
| 68. | 47034 | 9.5% | 5.3%(+4.15)#68 | 5.3%(+4.17)#3,091 |
| 69. | 46407 | 9.3% | 5.3%(+4.02)#69 | 5.3%(+4.05)#3,204 |
| 70. | 47710 | 9.3% | 5.3%(+4.02)#70 | 5.3%(+4.05)#3,208 |
| 71. | 47871 | 9.3% | 5.3%(+3.96)#71 | 5.3%(+3.99)#3,250 |
| 72. | 46225 | 9.3% | 5.3%(+3.94)#72 | 5.3%(+3.97)#3,275 |
| 73. | 46340 | 9.2% | 5.3%(+3.93)#73 | 5.3%(+3.96)#3,279 |
| 74. | 46408 | 9.2% | 5.3%(+3.88)#74 | 5.3%(+3.91)#3,330 |
| 75. | 47141 | 9.1% | 5.3%(+3.82)#75 | 5.3%(+3.85)#3,384 |
| 76. | 47001 | 9.1% | 5.3%(+3.79)#76 | 5.3%(+3.82)#3,407 |
| 77. | 46342 | 9.0% | 5.3%(+3.72)#77 | 5.3%(+3.75)#3,490 |
| 78. | 47303 | 9.0% | 5.3%(+3.71)#78 | 5.3%(+3.73)#3,510 |
| 79. | 46741 | 9.0% | 5.3%(+3.66)#79 | 5.3%(+3.69)#3,554 |
| 80. | 47024 | 8.9% | 5.3%(+3.61)#80 | 5.3%(+3.64)#3,597 |
| 81. | 47859 | 8.9% | 5.3%(+3.61)#81 | 5.3%(+3.64)#3,599 |
| 82. | 47359 | 8.9% | 5.3%(+3.56)#82 | 5.3%(+3.58)#3,643 |
| 83. | 47904 | 8.9% | 5.3%(+3.55)#83 | 5.3%(+3.57)#3,655 |
| 84. | 47023 | 8.8% | 5.3%(+3.51)#84 | 5.3%(+3.54)#3,687 |
| 85. | 47394 | 8.8% | 5.3%(+3.50)#85 | 5.3%(+3.53)#3,715 |
| 86. | 46805 | 8.7% | 5.3%(+3.41)#86 | 5.3%(+3.44)#3,808 |
| 87. | 47916 | 8.7% | 5.3%(+3.38)#87 | 5.3%(+3.41)#3,861 |
| 88. | 46911 | 8.6% | 5.3%(+3.28)#88 | 5.3%(+3.31)#3,971 |
| 89. | 47906 | 8.6% | 5.3%(+3.27)#89 | 5.3%(+3.30)#3,979 |
| 90. | 46035 | 8.6% | 5.3%(+3.27)#90 | 5.3%(+3.30)#3,985 |
| 91. | 47965 | 8.6% | 5.3%(+3.26)#91 | 5.3%(+3.29)#4,001 |
| 92. | 47335 | 8.5% | 5.3%(+3.22)#92 | 5.3%(+3.25)#4,036 |
| 93. | 47396 | 8.4% | 5.3%(+3.10)#93 | 5.3%(+3.13)#4,154 |
| 94. | 46323 | 8.4% | 5.3%(+3.08)#94 | 5.3%(+3.10)#4,187 |
| 95. | 47882 | 8.4% | 5.3%(+3.07)#95 | 5.3%(+3.09)#4,203 |
| 96. | 47112 | 8.3% | 5.3%(+3.01)#96 | 5.3%(+3.04)#4,284 |
| 97. | 47987 | 8.3% | 5.3%(+2.99)#97 | 5.3%(+3.02)#4,313 |
| 98. | 47933 | 8.3% | 5.3%(+2.99)#98 | 5.3%(+3.02)#4,318 |
| 99. | 47282 | 8.3% | 5.3%(+2.96)#99 | 5.3%(+2.98)#4,352 |
| 100. | 47342 | 8.2% | 5.3%(+2.93)#100 | 5.3%(+2.96)#4,380 |
Common Questions
What are the Top 10 Zip Codes with the Highest Percentage of Population Employed in Food Preparation & Serving in Indiana?
Top 10 Zip Codes with the Highest Percentage of Population Employed in Food Preparation & Serving in Indiana are:
What zip code has the Highest Percentage of Population Employed in Food Preparation & Serving in Indiana?
46154 has the Highest Percentage of Population Employed in Food Preparation & Serving in Indiana with 44.7%.
What is the Percentage of Population Employed in Food Preparation & Serving in the State of Indiana?
Percentage of Population Employed in Food Preparation & Serving in Indiana is 5.3%.
What is the Percentage of Population Employed in Food Preparation & Serving in the United States?
Percentage of Population Employed in Food Preparation & Serving in the United States is 5.3%.