Hardinsburg, IN Map & Demographics
Hardinsburg Map
Hardinsburg Overview
$13,111
PER CAPITA INCOME
$31,667
AVG HOUSEHOLD INCOME
0.47
INEQUALITY / GINI INDEX
179
TOTAL POPULATION
60
MALE POPULATION
119
FEMALE POPULATION
50.42
MALES / 100 FEMALES
198.33
FEMALES / 100 MALES
34.0
MEDIAN AGE
2.8
AVG FAMILY SIZE
2.4
AVG HOUSEHOLD SIZE
47
LABOR FORCE [ PEOPLE ]
41.2%
PERCENT IN LABOR FORCE
Hardinsburg Zip Codes
Income in Hardinsburg
Income Overview in Hardinsburg
| Characteristic | Number | Measure |
| Per Capita Income | 179 | $13,111 |
| Median Family Income | 52 | $0 |
| Mean Family Income | 52 | $28,717 |
| Median Household Income | 76 | $31,667 |
| Mean Household Income | 76 | $30,245 |
| Income Deficit | 52 | $0 |
| Wage / Income Gap (%) | 179 | 0.00% |
| Wage / Income Gap ($) | 179 | 100.00¢ per $1 |
| Gini / Inequality Index | 179 | 0.47 |
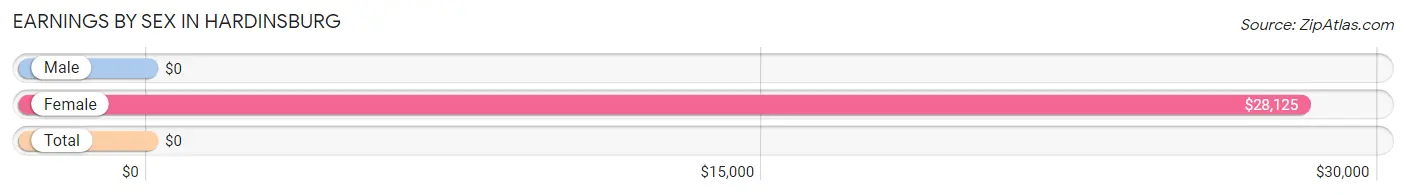
Earnings by Sex in Hardinsburg
| Sex | Number | Average Earnings |
| Male | 28 (45.9%) | $0 |
| Female | 33 (54.1%) | $28,125 |
| Total | 61 (100.0%) | $0 |
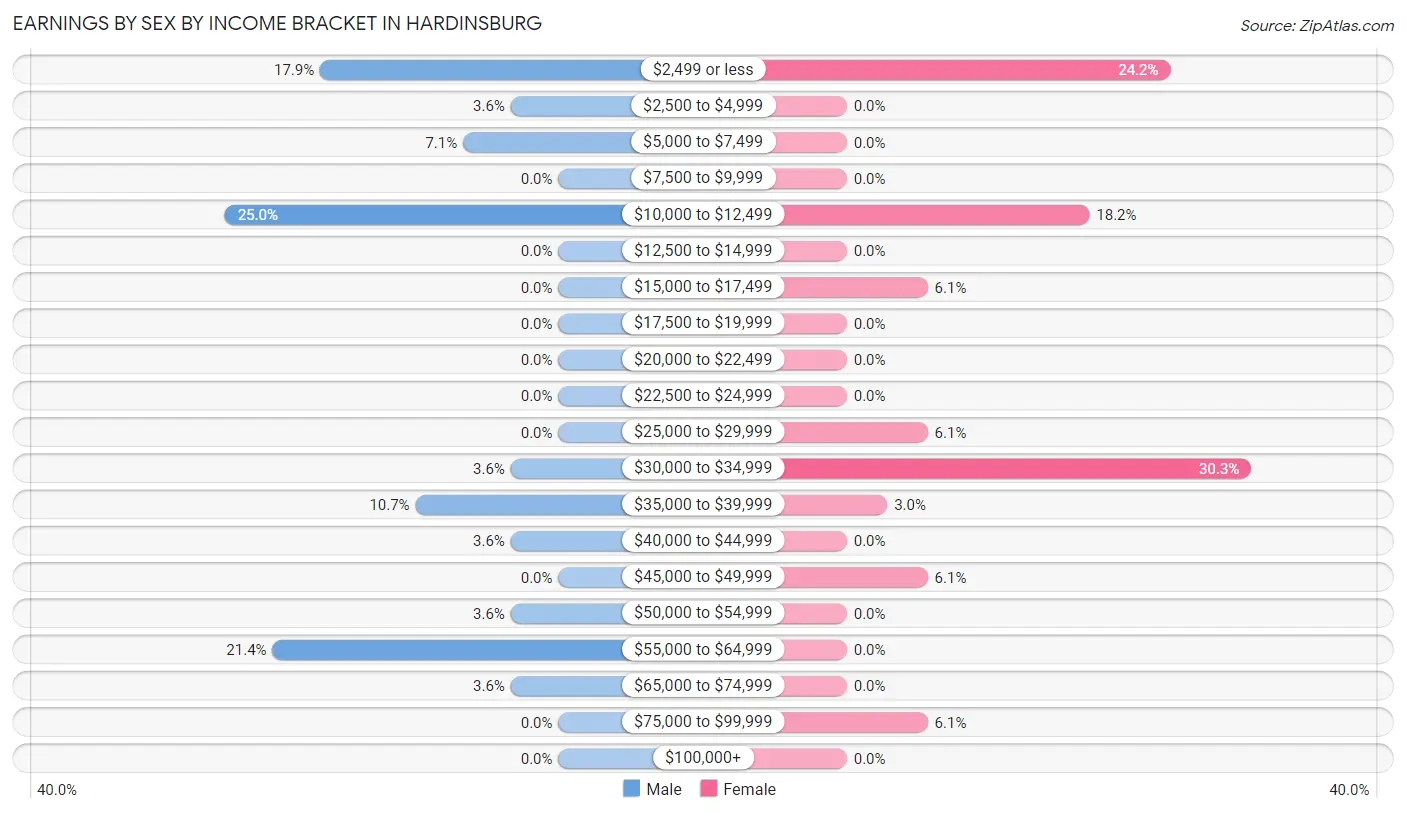
Earnings by Sex by Income Bracket in Hardinsburg
The most common earnings brackets in Hardinsburg are $10,000 to $12,499 for men (7 | 25.0%) and $30,000 to $34,999 for women (10 | 30.3%).
| Income | Male | Female |
| $2,499 or less | 5 (17.9%) | 8 (24.2%) |
| $2,500 to $4,999 | 1 (3.6%) | 0 (0.0%) |
| $5,000 to $7,499 | 2 (7.1%) | 0 (0.0%) |
| $7,500 to $9,999 | 0 (0.0%) | 0 (0.0%) |
| $10,000 to $12,499 | 7 (25.0%) | 6 (18.2%) |
| $12,500 to $14,999 | 0 (0.0%) | 0 (0.0%) |
| $15,000 to $17,499 | 0 (0.0%) | 2 (6.1%) |
| $17,500 to $19,999 | 0 (0.0%) | 0 (0.0%) |
| $20,000 to $22,499 | 0 (0.0%) | 0 (0.0%) |
| $22,500 to $24,999 | 0 (0.0%) | 0 (0.0%) |
| $25,000 to $29,999 | 0 (0.0%) | 2 (6.1%) |
| $30,000 to $34,999 | 1 (3.6%) | 10 (30.3%) |
| $35,000 to $39,999 | 3 (10.7%) | 1 (3.0%) |
| $40,000 to $44,999 | 1 (3.6%) | 0 (0.0%) |
| $45,000 to $49,999 | 0 (0.0%) | 2 (6.1%) |
| $50,000 to $54,999 | 1 (3.6%) | 0 (0.0%) |
| $55,000 to $64,999 | 6 (21.4%) | 0 (0.0%) |
| $65,000 to $74,999 | 1 (3.6%) | 0 (0.0%) |
| $75,000 to $99,999 | 0 (0.0%) | 2 (6.1%) |
| $100,000+ | 0 (0.0%) | 0 (0.0%) |
| Total | 28 (100.0%) | 33 (100.0%) |
Earnings by Sex by Educational Attainment in Hardinsburg
| Educational Attainment | Male Income | Female Income |
| Less than High School | - | - |
| High School Diploma | - | - |
| College or Associate's Degree | - | - |
| Bachelor's Degree | - | - |
| Graduate Degree | - | - |
| Total | - | - |
Family Income in Hardinsburg
Family Income Brackets in Hardinsburg
According to the Hardinsburg family income data, there are 23 families falling into the less than $10,000 income range, which is the most common income bracket and makes up 44.2% of all families.
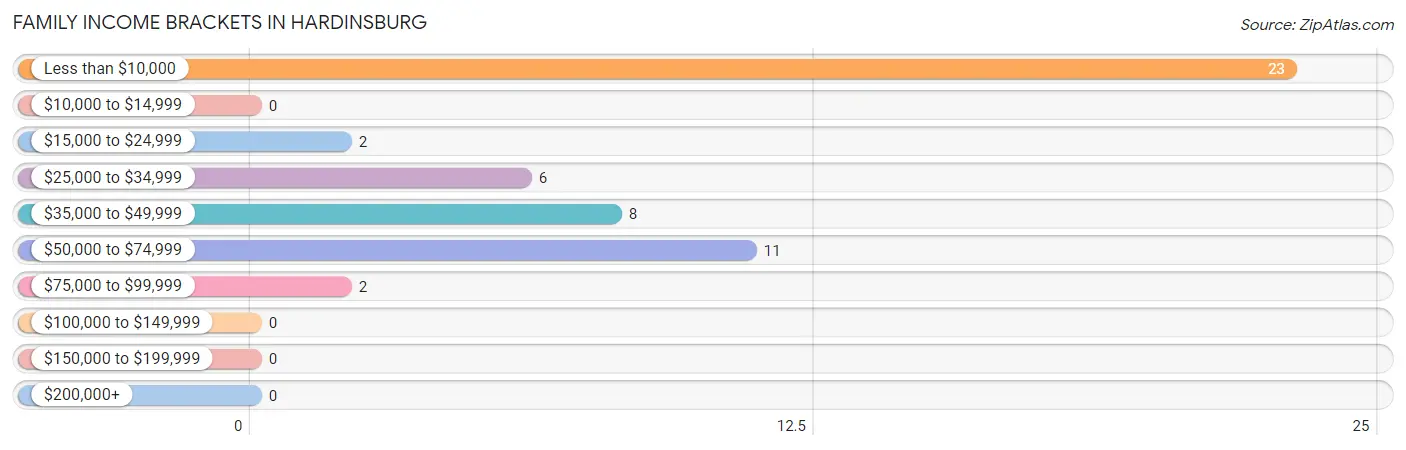
| Income Bracket | # Families | % Families |
| Less than $10,000 | 23 | 44.2% |
| $10,000 to $14,999 | 0 | 0.0% |
| $15,000 to $24,999 | 2 | 3.8% |
| $25,000 to $34,999 | 6 | 11.5% |
| $35,000 to $49,999 | 8 | 15.4% |
| $50,000 to $74,999 | 11 | 21.2% |
| $75,000 to $99,999 | 2 | 3.8% |
| $100,000 to $149,999 | 0 | 0.0% |
| $150,000 to $199,999 | 0 | 0.0% |
| $200,000+ | 0 | 0.0% |
Family Income by Famaliy Size in Hardinsburg
3-person families (6 | 11.5%) account for the highest median family income in Hardinsburg with $68,750 per family, while 3-person families (6 | 11.5%) have the highest median income of $22,917 per family member.
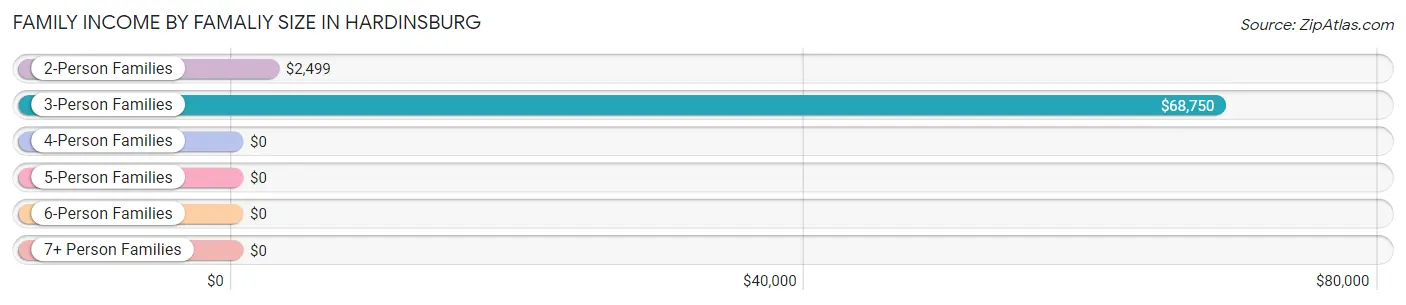
| Income Bracket | # Families | Median Income |
| 2-Person Families | 35 (67.3%) | $2,499 |
| 3-Person Families | 6 (11.5%) | $68,750 |
| 4-Person Families | 2 (3.8%) | $0 |
| 5-Person Families | 0 (0.0%) | $0 |
| 6-Person Families | 5 (9.6%) | $0 |
| 7+ Person Families | 4 (7.7%) | $0 |
| Total | 52 (100.0%) | $0 |
Family Income by Number of Earners in Hardinsburg
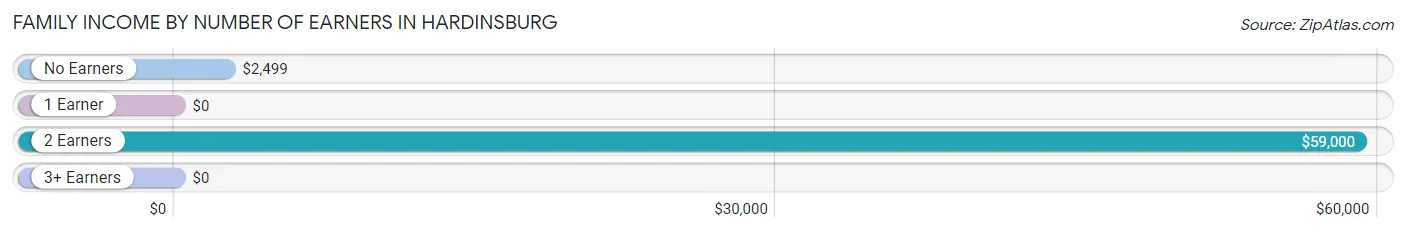
| Number of Earners | # Families | Median Income |
| No Earners | 22 (42.3%) | $2,499 |
| 1 Earner | 12 (23.1%) | $0 |
| 2 Earners | 18 (34.6%) | $59,000 |
| 3+ Earners | 0 (0.0%) | $0 |
| Total | 52 (100.0%) | $0 |
Household Income in Hardinsburg
Household Income Brackets in Hardinsburg
With 23 households falling in the category, the less than $10,000 income range is the most frequent in Hardinsburg, accounting for 30.3% of all households.
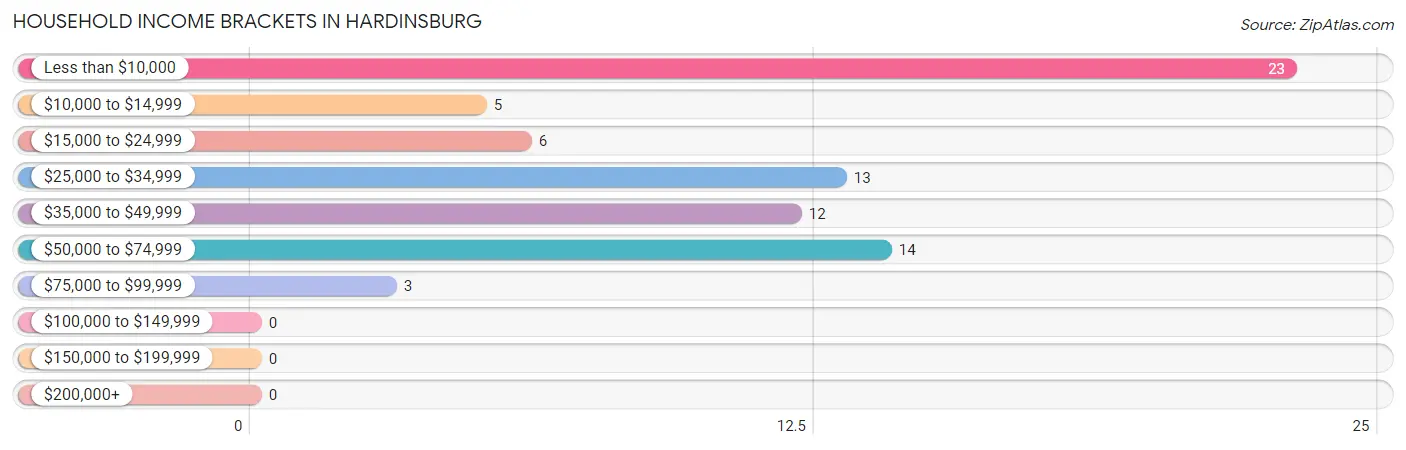
| Income Bracket | # Households | % Households |
| Less than $10,000 | 23 | 30.3% |
| $10,000 to $14,999 | 5 | 6.6% |
| $15,000 to $24,999 | 6 | 7.9% |
| $25,000 to $34,999 | 13 | 17.1% |
| $35,000 to $49,999 | 12 | 15.8% |
| $50,000 to $74,999 | 14 | 18.4% |
| $75,000 to $99,999 | 3 | 3.9% |
| $100,000 to $149,999 | 0 | 0.0% |
| $150,000 to $199,999 | 0 | 0.0% |
| $200,000+ | 0 | 0.0% |
Household Income by Householder Age in Hardinsburg
The median household income in Hardinsburg is $31,667, with the highest median household income of $34,167 found in the 65+ years age bracket for the primary householder. A total of 22 households (28.9%) fall into this category.
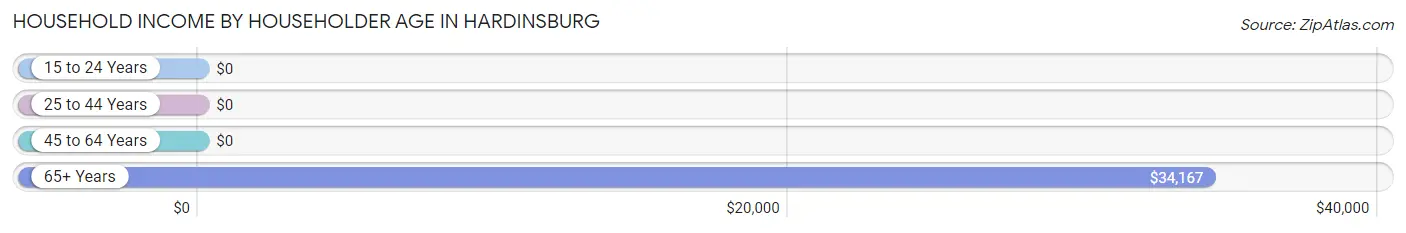
| Income Bracket | # Households | Median Income |
| 15 to 24 Years | 0 (0.0%) | $0 |
| 25 to 44 Years | 31 (40.8%) | $0 |
| 45 to 64 Years | 23 (30.3%) | $0 |
| 65+ Years | 22 (28.9%) | $34,167 |
| Total | 76 (100.0%) | $31,667 |
Poverty in Hardinsburg
Income Below Poverty by Sex and Age in Hardinsburg
With 41.7% poverty level for males and 41.2% for females among the residents of Hardinsburg, 12 to 14 year old males and 35 to 44 year old females are the most vulnerable to poverty, with 4 males (100.0%) and 14 females (82.4%) in their respective age groups living below the poverty level.
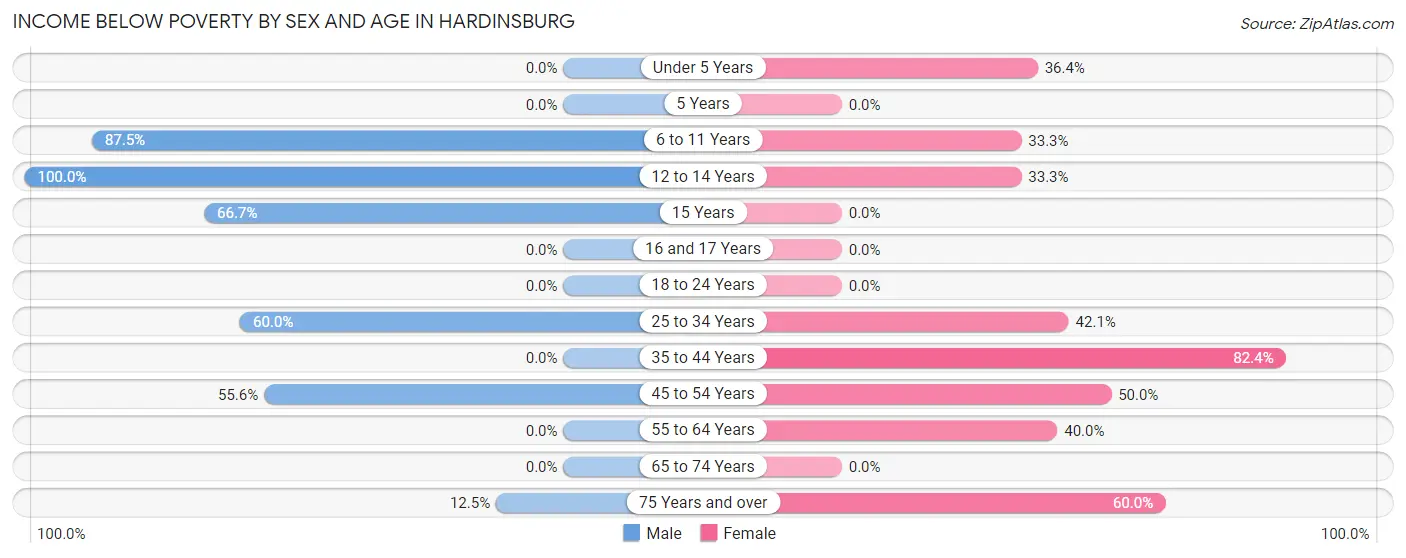
| Age Bracket | Male | Female |
| Under 5 Years | 0 (0.0%) | 4 (36.4%) |
| 5 Years | 0 (0.0%) | 0 (0.0%) |
| 6 to 11 Years | 7 (87.5%) | 8 (33.3%) |
| 12 to 14 Years | 4 (100.0%) | 4 (33.3%) |
| 15 Years | 2 (66.7%) | 0 (0.0%) |
| 16 and 17 Years | 0 (0.0%) | 0 (0.0%) |
| 18 to 24 Years | 0 (0.0%) | 0 (0.0%) |
| 25 to 34 Years | 6 (60.0%) | 8 (42.1%) |
| 35 to 44 Years | 0 (0.0%) | 14 (82.4%) |
| 45 to 54 Years | 5 (55.6%) | 2 (50.0%) |
| 55 to 64 Years | 0 (0.0%) | 6 (40.0%) |
| 65 to 74 Years | 0 (0.0%) | 0 (0.0%) |
| 75 Years and over | 1 (12.5%) | 3 (60.0%) |
| Total | 25 (41.7%) | 49 (41.2%) |
Income Above Poverty by Sex and Age in Hardinsburg
According to the poverty statistics in Hardinsburg, males aged under 5 years and females aged 5 years are the age groups that are most secure financially, with 100.0% of males and 100.0% of females in these age groups living above the poverty line.
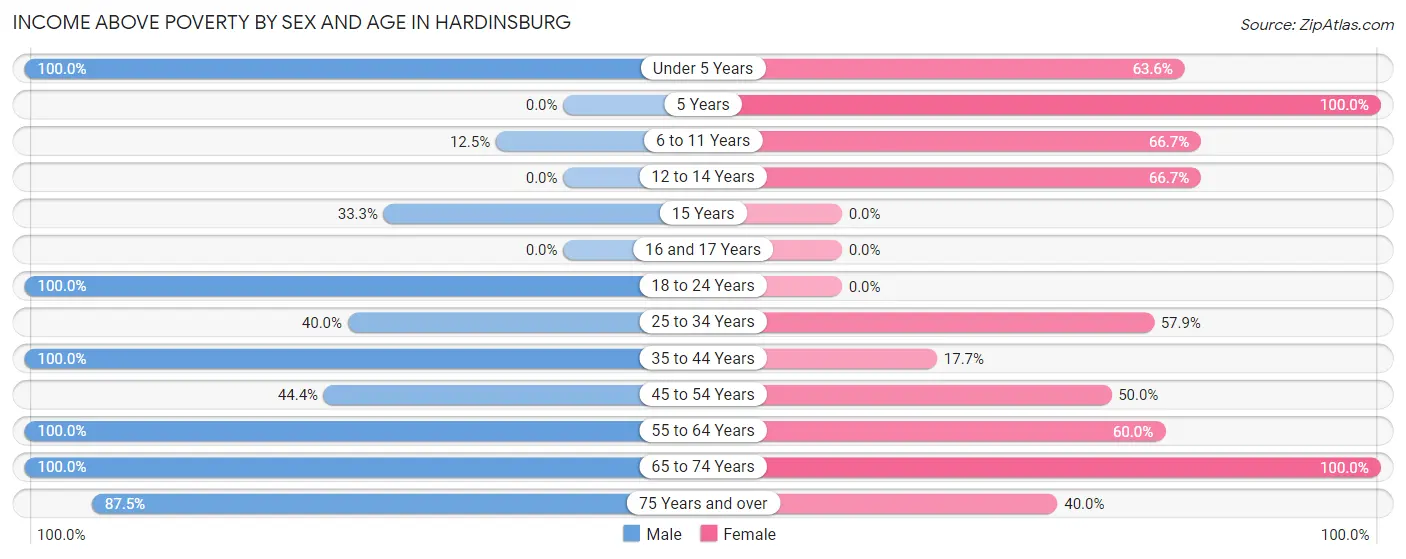
| Age Bracket | Male | Female |
| Under 5 Years | 2 (100.0%) | 7 (63.6%) |
| 5 Years | 0 (0.0%) | 1 (100.0%) |
| 6 to 11 Years | 1 (12.5%) | 16 (66.7%) |
| 12 to 14 Years | 0 (0.0%) | 8 (66.7%) |
| 15 Years | 1 (33.3%) | 0 (0.0%) |
| 16 and 17 Years | 0 (0.0%) | 0 (0.0%) |
| 18 to 24 Years | 2 (100.0%) | 0 (0.0%) |
| 25 to 34 Years | 4 (40.0%) | 11 (57.9%) |
| 35 to 44 Years | 6 (100.0%) | 3 (17.6%) |
| 45 to 54 Years | 4 (44.4%) | 2 (50.0%) |
| 55 to 64 Years | 5 (100.0%) | 9 (60.0%) |
| 65 to 74 Years | 3 (100.0%) | 11 (100.0%) |
| 75 Years and over | 7 (87.5%) | 2 (40.0%) |
| Total | 35 (58.3%) | 70 (58.8%) |
Income Below Poverty Among Married-Couple Families in Hardinsburg
The poverty statistics for married-couple families in Hardinsburg show that 15.4% or 4 of the total 26 families live below the poverty line. Families with 5 or more children have the highest poverty rate of 100.0%, comprising of 4 families. On the other hand, families with no children have the lowest poverty rate of 0.0%, which includes 0 families.
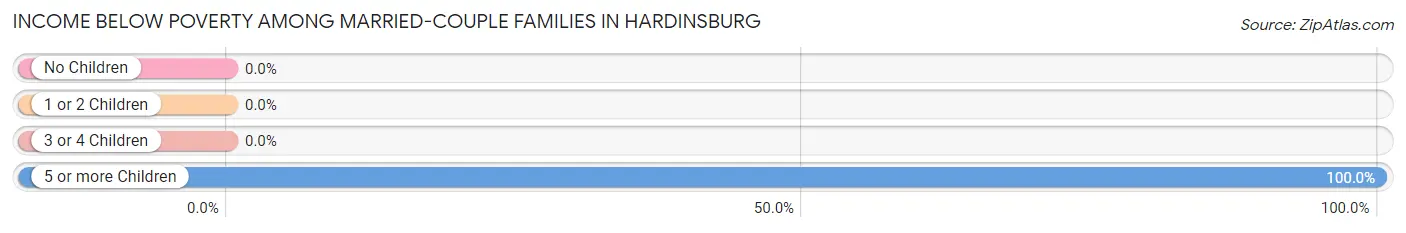
| Children | Above Poverty | Below Poverty |
| No Children | 10 (100.0%) | 0 (0.0%) |
| 1 or 2 Children | 7 (100.0%) | 0 (0.0%) |
| 3 or 4 Children | 5 (100.0%) | 0 (0.0%) |
| 5 or more Children | 0 (0.0%) | 4 (100.0%) |
| Total | 22 (84.6%) | 4 (15.4%) |
Income Below Poverty Among Single-Parent Households in Hardinsburg
According to the poverty data in Hardinsburg, 100.0% or 6 single-father households and 85.0% or 17 single-mother households are living below the poverty line. Among single-father households, those with 1 or 2 children have the highest poverty rate, with 5 households (100.0%) experiencing poverty. Likewise, among single-mother households, those with 1 or 2 children have the highest poverty rate, with 14 households (93.3%) falling below the poverty line.
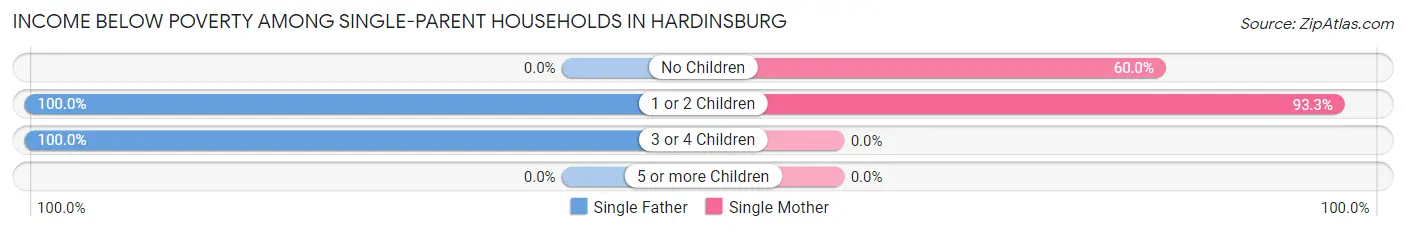
| Children | Single Father | Single Mother |
| No Children | 0 (0.0%) | 3 (60.0%) |
| 1 or 2 Children | 5 (100.0%) | 14 (93.3%) |
| 3 or 4 Children | 1 (100.0%) | 0 (0.0%) |
| 5 or more Children | 0 (0.0%) | 0 (0.0%) |
| Total | 6 (100.0%) | 17 (85.0%) |
Income Below Poverty Among Married-Couple vs Single-Parent Households in Hardinsburg
The poverty data for Hardinsburg shows that 4 of the married-couple family households (15.4%) and 23 of the single-parent households (88.5%) are living below the poverty level. Within the married-couple family households, those with 5 or more children have the highest poverty rate, with 4 households (100.0%) falling below the poverty line. Among the single-parent households, those with 3 or 4 children have the highest poverty rate, with 1 household (100.0%) living below poverty.
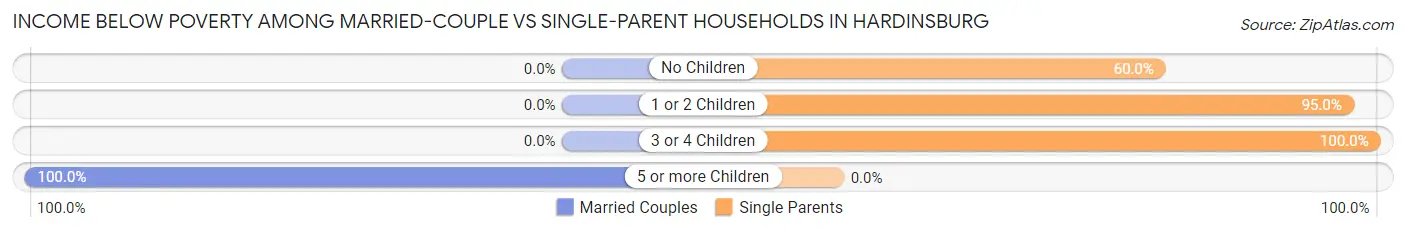
| Children | Married-Couple Families | Single-Parent Households |
| No Children | 0 (0.0%) | 3 (60.0%) |
| 1 or 2 Children | 0 (0.0%) | 19 (95.0%) |
| 3 or 4 Children | 0 (0.0%) | 1 (100.0%) |
| 5 or more Children | 4 (100.0%) | 0 (0.0%) |
| Total | 4 (15.4%) | 23 (88.5%) |
Race in Hardinsburg
The most populous races in Hardinsburg are White / Caucasian (155 | 86.6%), and Two or more Races (24 | 13.4%).
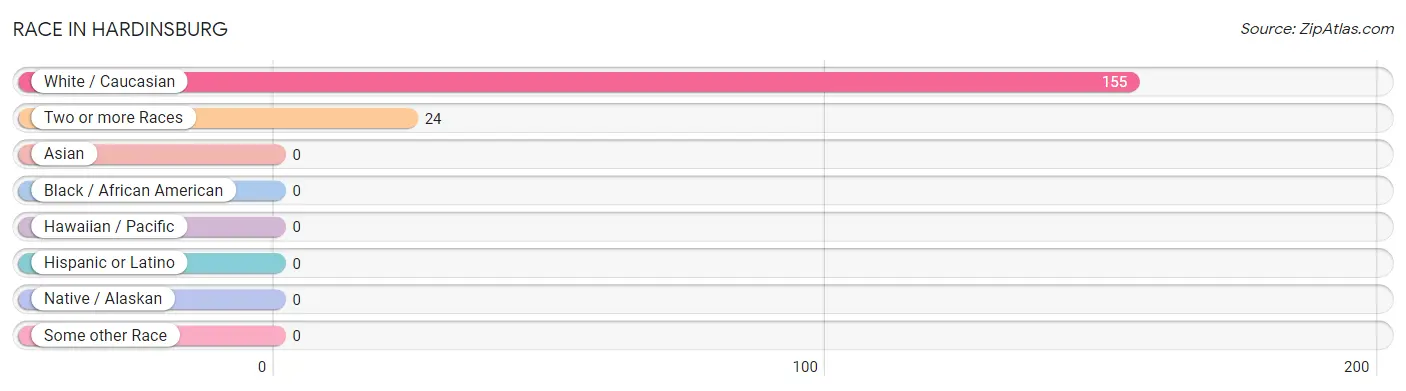
| Race | # Population | % Population |
| Asian | 0 | 0.0% |
| Black / African American | 0 | 0.0% |
| Hawaiian / Pacific | 0 | 0.0% |
| Hispanic or Latino | 0 | 0.0% |
| Native / Alaskan | 0 | 0.0% |
| White / Caucasian | 155 | 86.6% |
| Two or more Races | 24 | 13.4% |
| Some other Race | 0 | 0.0% |
| Total | 179 | 100.0% |
Ancestry in Hardinsburg
The most populous ancestries reported in Hardinsburg are American (42 | 23.5%), English (24 | 13.4%), German (18 | 10.1%), Irish (11 | 6.1%), and Italian (4 | 2.2%), together accounting for 55.3% of all Hardinsburg residents.
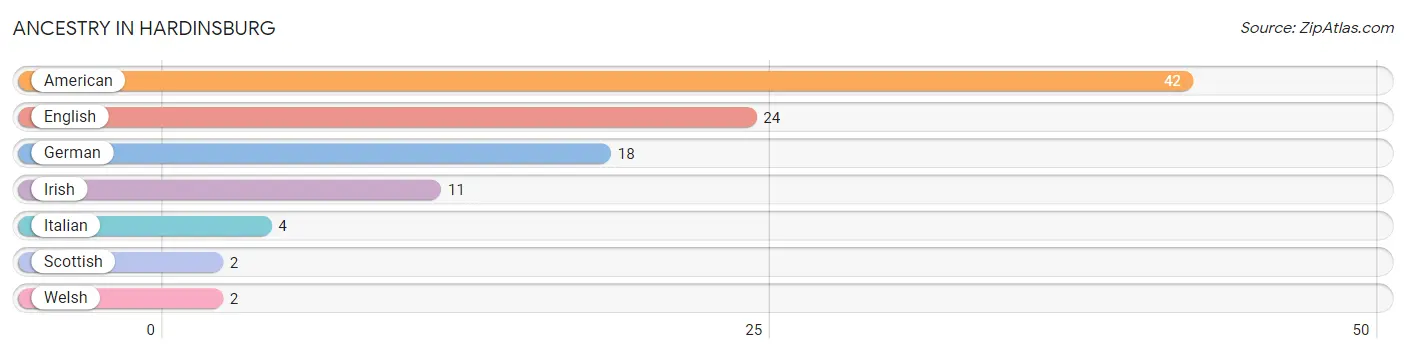
| Ancestry | # Population | % Population |
| American | 42 | 23.5% |
| English | 24 | 13.4% |
| German | 18 | 10.1% |
| Irish | 11 | 6.1% |
| Italian | 4 | 2.2% |
| Scottish | 2 | 1.1% |
| Welsh | 2 | 1.1% | View All 7 Rows |
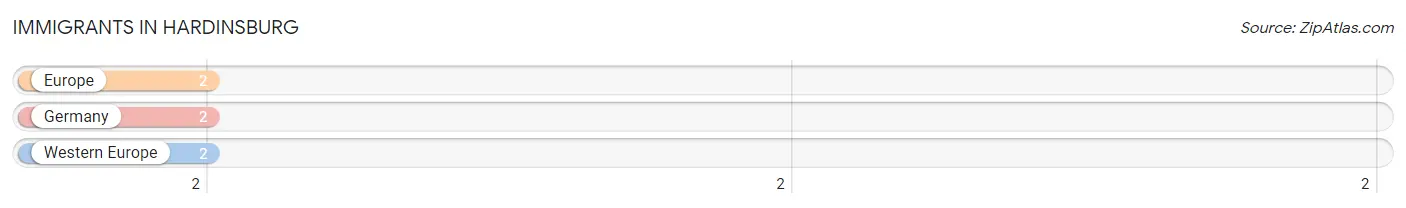
Immigrants in Hardinsburg
The most numerous immigrant groups reported in Hardinsburg came from Europe (2 | 1.1%), Germany (2 | 1.1%), and Western Europe (2 | 1.1%), together accounting for 3.4% of all Hardinsburg residents.
| Immigration Origin | # Population | % Population |
| Europe | 2 | 1.1% |
| Germany | 2 | 1.1% |
| Western Europe | 2 | 1.1% | View All 3 Rows |
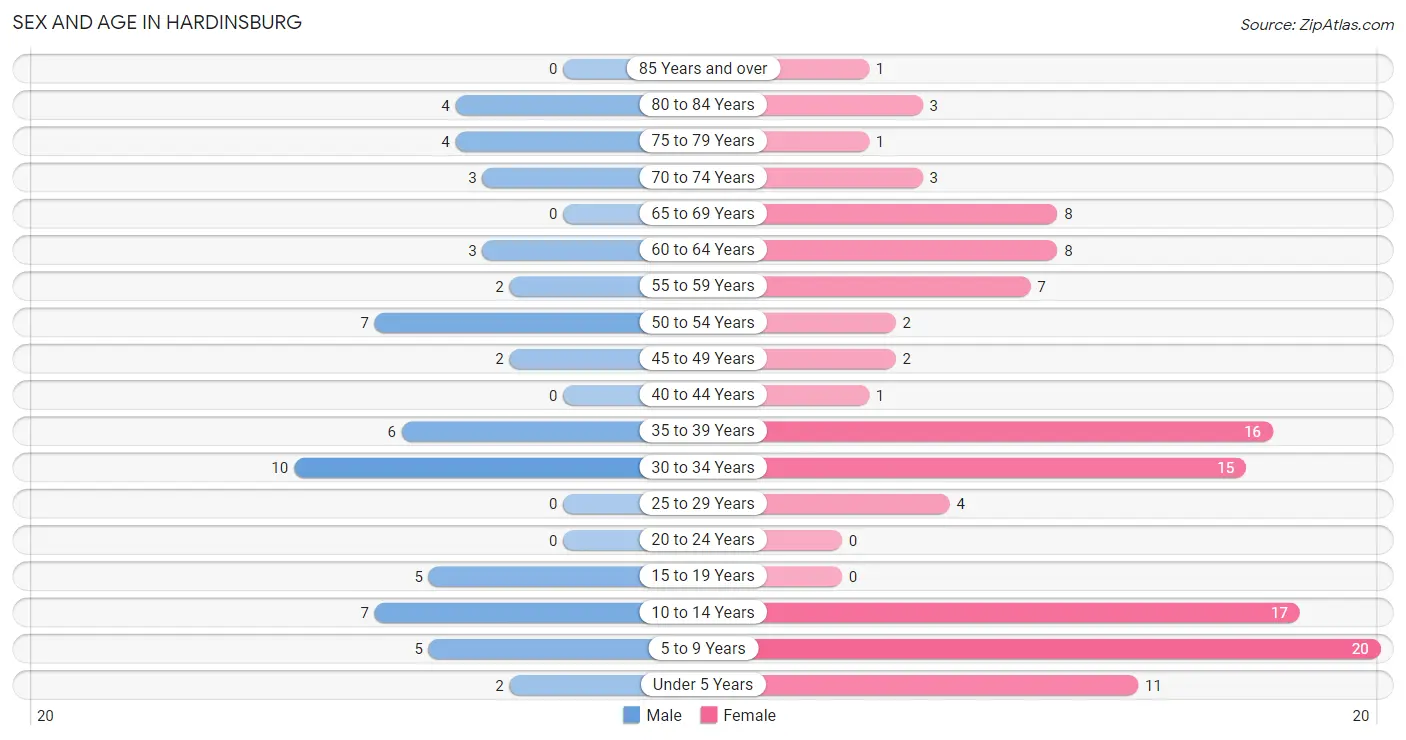
Sex and Age in Hardinsburg
Sex and Age in Hardinsburg
The most populous age groups in Hardinsburg are 30 to 34 Years (10 | 16.7%) for men and 5 to 9 Years (20 | 16.8%) for women.
| Age Bracket | Male | Female |
| Under 5 Years | 2 (3.3%) | 11 (9.2%) |
| 5 to 9 Years | 5 (8.3%) | 20 (16.8%) |
| 10 to 14 Years | 7 (11.7%) | 17 (14.3%) |
| 15 to 19 Years | 5 (8.3%) | 0 (0.0%) |
| 20 to 24 Years | 0 (0.0%) | 0 (0.0%) |
| 25 to 29 Years | 0 (0.0%) | 4 (3.4%) |
| 30 to 34 Years | 10 (16.7%) | 15 (12.6%) |
| 35 to 39 Years | 6 (10.0%) | 16 (13.5%) |
| 40 to 44 Years | 0 (0.0%) | 1 (0.8%) |
| 45 to 49 Years | 2 (3.3%) | 2 (1.7%) |
| 50 to 54 Years | 7 (11.7%) | 2 (1.7%) |
| 55 to 59 Years | 2 (3.3%) | 7 (5.9%) |
| 60 to 64 Years | 3 (5.0%) | 8 (6.7%) |
| 65 to 69 Years | 0 (0.0%) | 8 (6.7%) |
| 70 to 74 Years | 3 (5.0%) | 3 (2.5%) |
| 75 to 79 Years | 4 (6.7%) | 1 (0.8%) |
| 80 to 84 Years | 4 (6.7%) | 3 (2.5%) |
| 85 Years and over | 0 (0.0%) | 1 (0.8%) |
| Total | 60 (100.0%) | 119 (100.0%) |
Families and Households in Hardinsburg
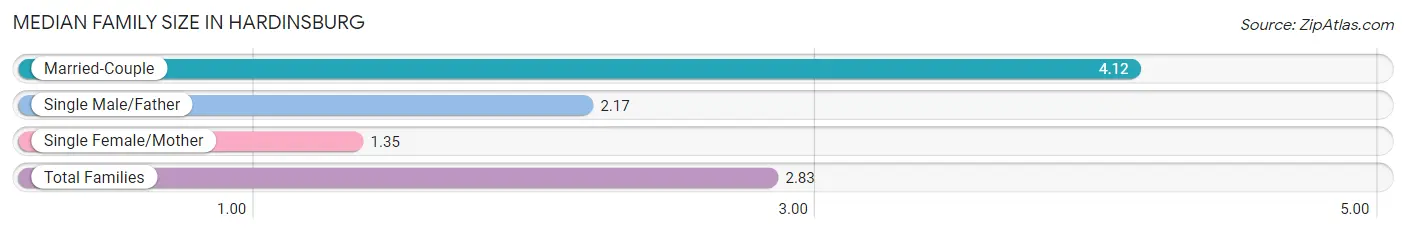
Median Family Size in Hardinsburg
The median family size in Hardinsburg is 2.83 persons per family, with married-couple families (26 | 50.0%) accounting for the largest median family size of 4.12 persons per family. On the other hand, single female/mother families (20 | 38.5%) represent the smallest median family size with 1.35 persons per family.
| Family Type | # Families | Family Size |
| Married-Couple | 26 (50.0%) | 4.12 |
| Single Male/Father | 6 (11.5%) | 2.17 |
| Single Female/Mother | 20 (38.5%) | 1.35 |
| Total Families | 52 (100.0%) | 2.83 |
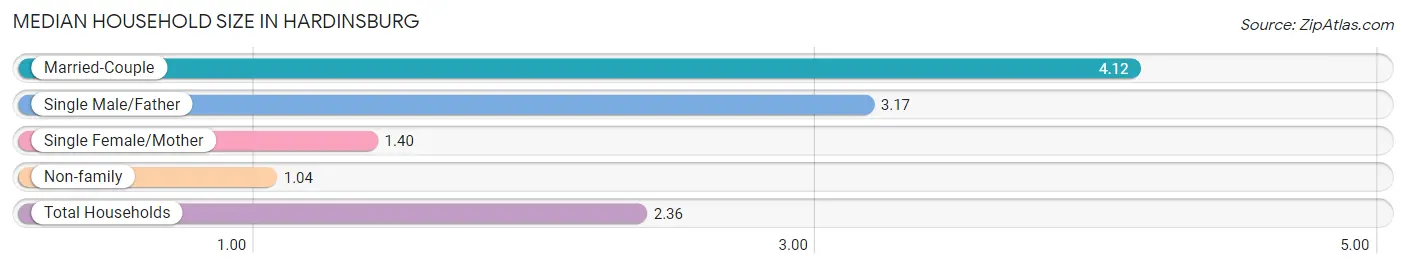
Median Household Size in Hardinsburg
The median household size in Hardinsburg is 2.36 persons per household, with married-couple households (26 | 34.2%) accounting for the largest median household size of 4.12 persons per household. non-family households (24 | 31.6%) represent the smallest median household size with 1.04 persons per household.
| Household Type | # Households | Household Size |
| Married-Couple | 26 (34.2%) | 4.12 |
| Single Male/Father | 6 (7.9%) | 3.17 |
| Single Female/Mother | 20 (26.3%) | 1.40 |
| Non-family | 24 (31.6%) | 1.04 |
| Total Households | 76 (100.0%) | 2.36 |
Household Size by Marriage Status in Hardinsburg
Out of a total of 76 households in Hardinsburg, 52 (68.4%) are family households, while 24 (31.6%) are nonfamily households. The most numerous type of family households are 2-person households, comprising 29, and the most common type of nonfamily households are 1-person households, comprising 23.
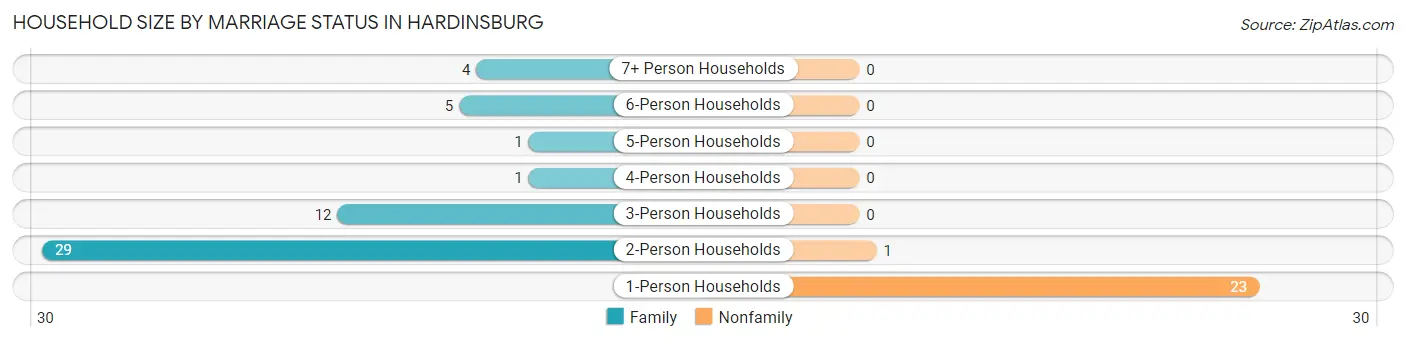
| Household Size | Family Households | Nonfamily Households |
| 1-Person Households | - | 23 (30.3%) |
| 2-Person Households | 29 (38.2%) | 1 (1.3%) |
| 3-Person Households | 12 (15.8%) | 0 (0.0%) |
| 4-Person Households | 1 (1.3%) | 0 (0.0%) |
| 5-Person Households | 1 (1.3%) | 0 (0.0%) |
| 6-Person Households | 5 (6.6%) | 0 (0.0%) |
| 7+ Person Households | 4 (5.3%) | 0 (0.0%) |
| Total | 52 (68.4%) | 24 (31.6%) |
Female Fertility in Hardinsburg
Fertility by Age in Hardinsburg
Average fertility rate in Hardinsburg is 158.0 births per 1,000 women. Women in the age bracket of 20 to 34 years have the highest fertility rate with 316.0 births per 1,000 women. Women in the age bracket of 20 to 34 years acount for 100.0% of all women with births.
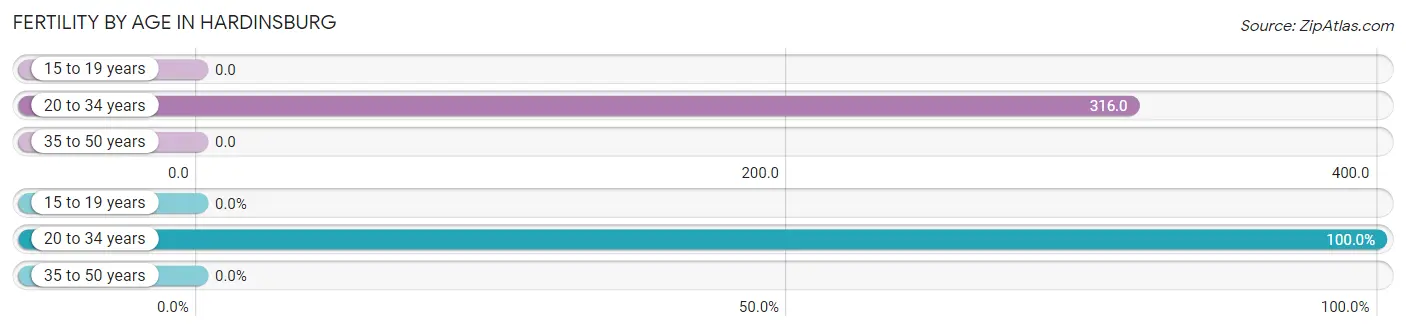
| Age Bracket | Women with Births | Births / 1,000 Women |
| 15 to 19 years | 0 (0.0%) | 0.0 |
| 20 to 34 years | 6 (100.0%) | 316.0 |
| 35 to 50 years | 0 (0.0%) | 0.0 |
| Total | 6 (100.0%) | 158.0 |
Fertility by Age by Marriage Status in Hardinsburg
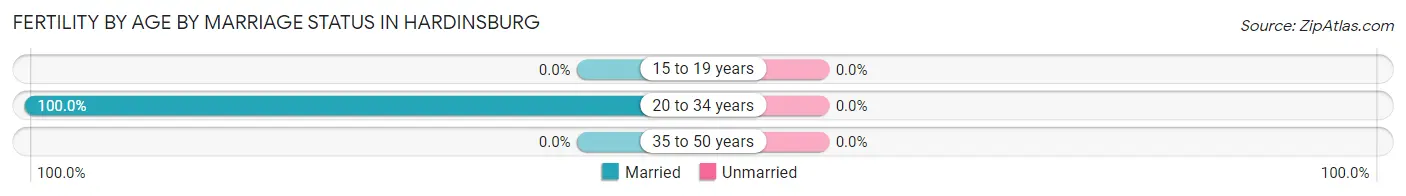
| Age Bracket | Married | Unmarried |
| 15 to 19 years | 0 (0.0%) | 0 (0.0%) |
| 20 to 34 years | 6 (100.0%) | 0 (0.0%) |
| 35 to 50 years | 0 (0.0%) | 0 (0.0%) |
| Total | 6 (100.0%) | 0 (0.0%) |
Fertility by Education in Hardinsburg
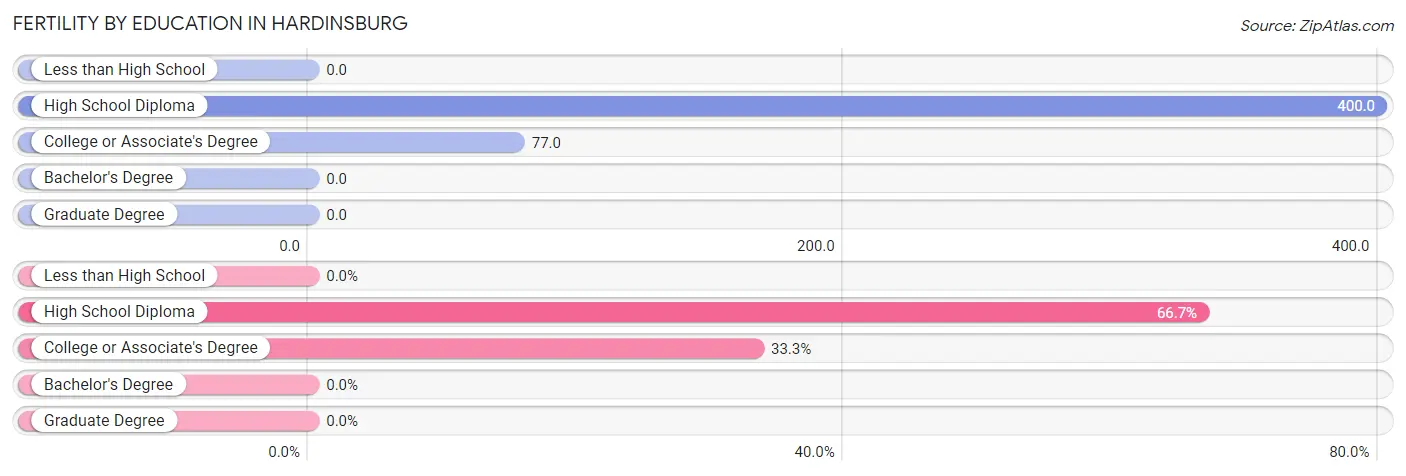
| Educational Attainment | Women with Births | Births / 1,000 Women |
| Less than High School | 0 (0.0%) | 0.0 |
| High School Diploma | 4 (66.7%) | 400.0 |
| College or Associate's Degree | 2 (33.3%) | 77.0 |
| Bachelor's Degree | 0 (0.0%) | 0.0 |
| Graduate Degree | 0 (0.0%) | 0.0 |
| Total | 6 (100.0%) | 158.0 |
Fertility by Education by Marriage Status in Hardinsburg
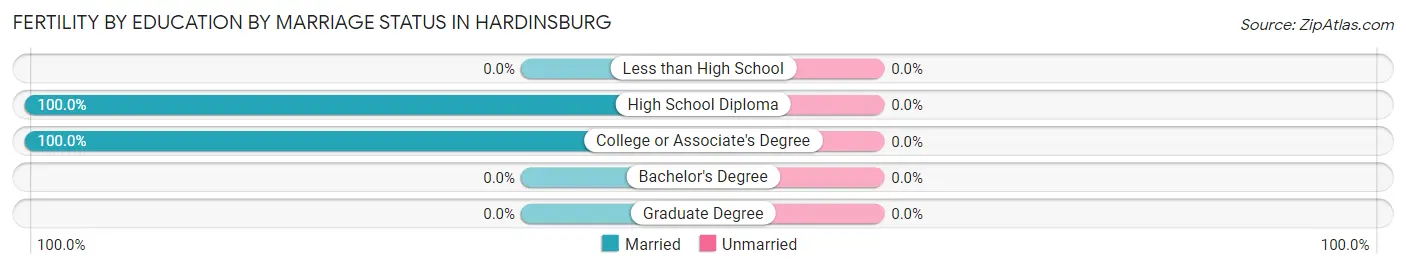
| Educational Attainment | Married | Unmarried |
| Less than High School | 0 (0.0%) | 0 (0.0%) |
| High School Diploma | 4 (100.0%) | 0 (0.0%) |
| College or Associate's Degree | 2 (100.0%) | 0 (0.0%) |
| Bachelor's Degree | 0 (0.0%) | 0 (0.0%) |
| Graduate Degree | 0 (0.0%) | 0 (0.0%) |
| Total | 6 (100.0%) | 0 (0.0%) |
Employment Characteristics in Hardinsburg
Employment by Class of Employer in Hardinsburg
Among the 47 employed individuals in Hardinsburg, private company employees (36 | 76.6%), self-employed (not incorporated) (6 | 12.8%), and not-for-profit organizations (4 | 8.5%) make up the most common classes of employment.
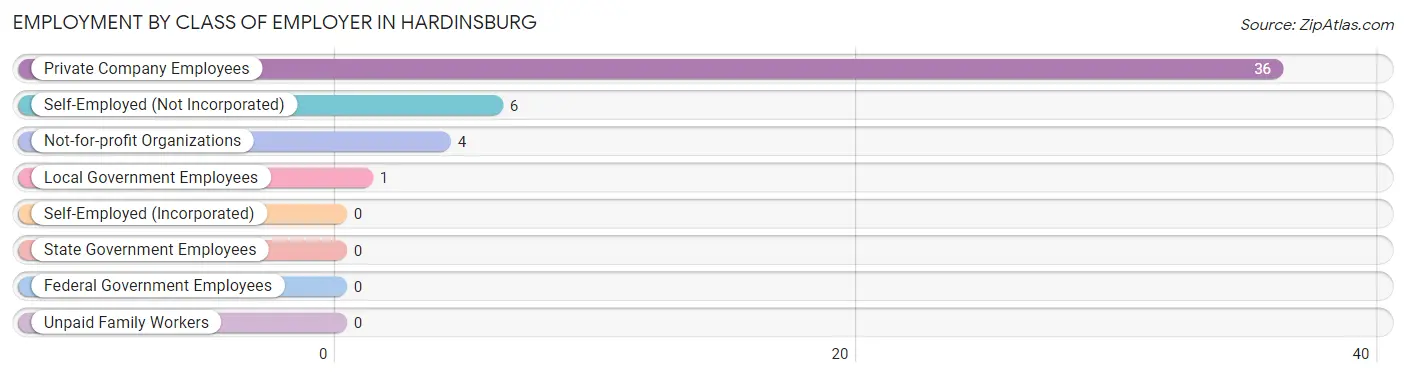
| Employer Class | # Employees | % Employees |
| Private Company Employees | 36 | 76.6% |
| Self-Employed (Incorporated) | 0 | 0.0% |
| Self-Employed (Not Incorporated) | 6 | 12.8% |
| Not-for-profit Organizations | 4 | 8.5% |
| Local Government Employees | 1 | 2.1% |
| State Government Employees | 0 | 0.0% |
| Federal Government Employees | 0 | 0.0% |
| Unpaid Family Workers | 0 | 0.0% |
| Total | 47 | 100.0% |
Employment Status by Age in Hardinsburg
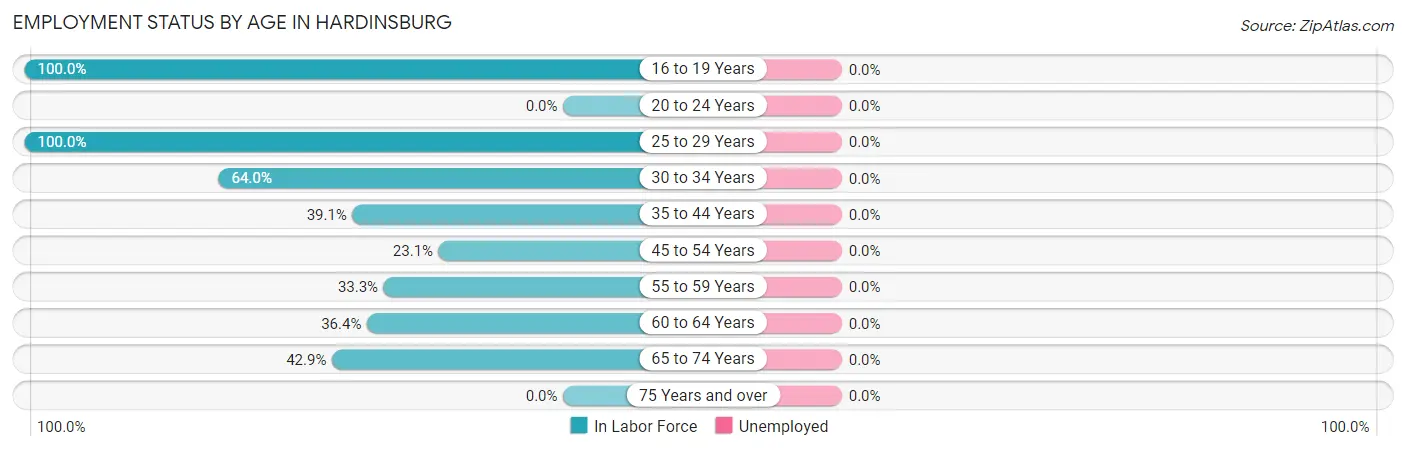
| Age Bracket | In Labor Force | Unemployed |
| 16 to 19 Years | 2 (100.0%) | 0 (0.0%) |
| 20 to 24 Years | 0 (0.0%) | 0 (0.0%) |
| 25 to 29 Years | 4 (100.0%) | 0 (0.0%) |
| 30 to 34 Years | 16 (64.0%) | 0 (0.0%) |
| 35 to 44 Years | 9 (39.1%) | 0 (0.0%) |
| 45 to 54 Years | 3 (23.1%) | 0 (0.0%) |
| 55 to 59 Years | 3 (33.3%) | 0 (0.0%) |
| 60 to 64 Years | 4 (36.4%) | 0 (0.0%) |
| 65 to 74 Years | 6 (42.9%) | 0 (0.0%) |
| 75 Years and over | 0 (0.0%) | 0 (0.0%) |
| Total | 47 (41.2%) | 0 (0.0%) |
Employment Status by Educational Attainment in Hardinsburg
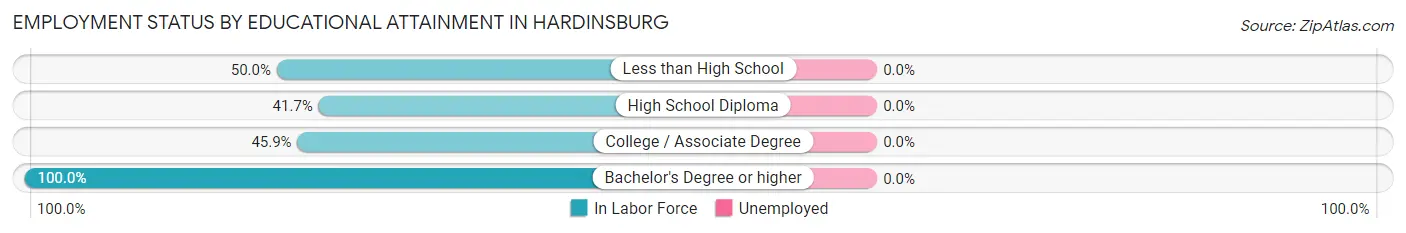
| Educational Attainment | In Labor Force | Unemployed |
| Less than High School | 5 (50.0%) | 0 (0.0%) |
| High School Diploma | 15 (41.7%) | 0 (0.0%) |
| College / Associate Degree | 17 (45.9%) | 0 (0.0%) |
| Bachelor's Degree or higher | 2 (100.0%) | 0 (0.0%) |
| Total | 39 (45.9%) | 0 (0.0%) |
Employment Occupations by Sex in Hardinsburg
Management, Business, Science and Arts Occupations
The most common Management, Business, Science and Arts occupations in Hardinsburg are Community & Social Service (2 | 4.3%), Education Instruction & Library (2 | 4.3%), Health Diagnosing & Treating (2 | 4.3%), and Health Technologists (2 | 4.3%).
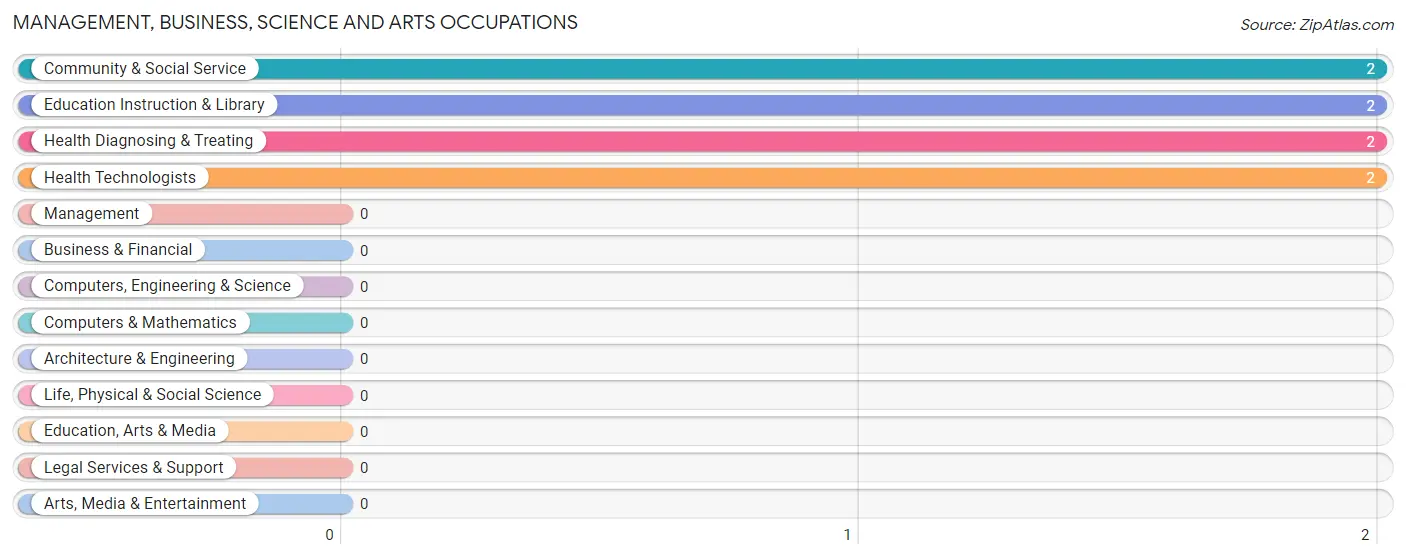
Management, Business, Science and Arts Occupations by Sex
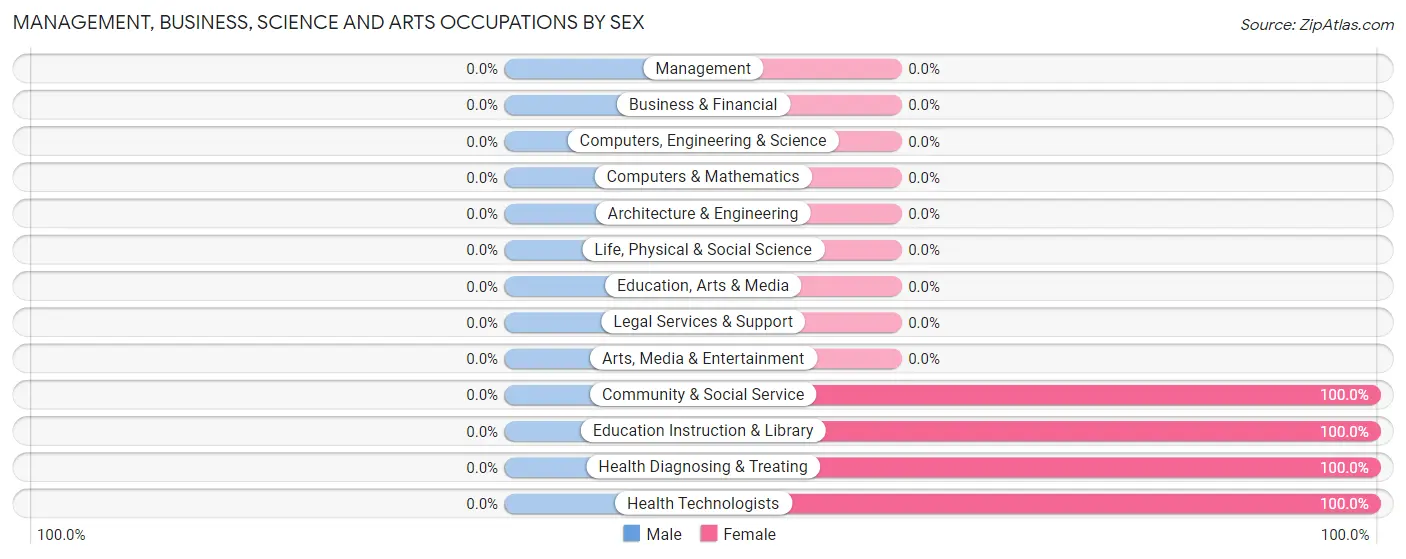
| Occupation | Male | Female |
| Management | 0 (0.0%) | 0 (0.0%) |
| Business & Financial | 0 (0.0%) | 0 (0.0%) |
| Computers, Engineering & Science | 0 (0.0%) | 0 (0.0%) |
| Computers & Mathematics | 0 (0.0%) | 0 (0.0%) |
| Architecture & Engineering | 0 (0.0%) | 0 (0.0%) |
| Life, Physical & Social Science | 0 (0.0%) | 0 (0.0%) |
| Community & Social Service | 0 (0.0%) | 2 (100.0%) |
| Education, Arts & Media | 0 (0.0%) | 0 (0.0%) |
| Legal Services & Support | 0 (0.0%) | 0 (0.0%) |
| Education Instruction & Library | 0 (0.0%) | 2 (100.0%) |
| Arts, Media & Entertainment | 0 (0.0%) | 0 (0.0%) |
| Health Diagnosing & Treating | 0 (0.0%) | 2 (100.0%) |
| Health Technologists | 0 (0.0%) | 2 (100.0%) |
| Total (Category) | 0 (0.0%) | 4 (100.0%) |
| Total (Overall) | 21 (44.7%) | 26 (55.3%) |
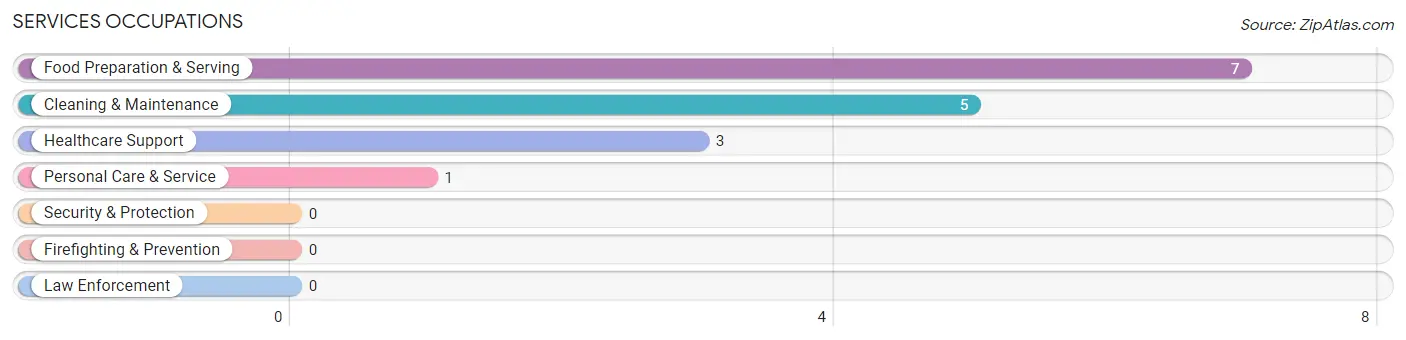
Services Occupations
The most common Services occupations in Hardinsburg are Food Preparation & Serving (7 | 14.9%), Cleaning & Maintenance (5 | 10.6%), Healthcare Support (3 | 6.4%), and Personal Care & Service (1 | 2.1%).
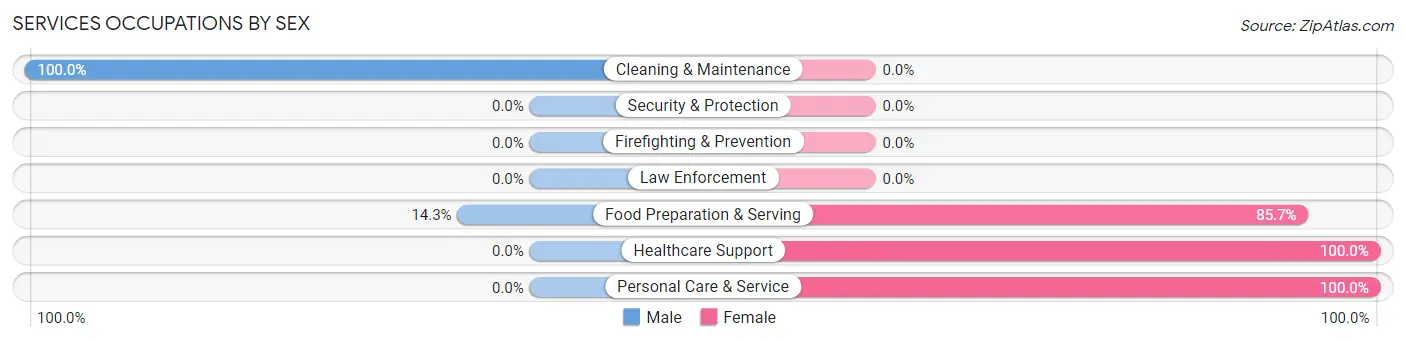
Services Occupations by Sex
Within the Services occupations in Hardinsburg, the most male-oriented occupations are Cleaning & Maintenance (100.0%), and Food Preparation & Serving (14.3%), while the most female-oriented occupations are Healthcare Support (100.0%), Personal Care & Service (100.0%), and Food Preparation & Serving (85.7%).
| Occupation | Male | Female |
| Healthcare Support | 0 (0.0%) | 3 (100.0%) |
| Security & Protection | 0 (0.0%) | 0 (0.0%) |
| Firefighting & Prevention | 0 (0.0%) | 0 (0.0%) |
| Law Enforcement | 0 (0.0%) | 0 (0.0%) |
| Food Preparation & Serving | 1 (14.3%) | 6 (85.7%) |
| Cleaning & Maintenance | 5 (100.0%) | 0 (0.0%) |
| Personal Care & Service | 0 (0.0%) | 1 (100.0%) |
| Total (Category) | 6 (37.5%) | 10 (62.5%) |
| Total (Overall) | 21 (44.7%) | 26 (55.3%) |
Sales and Office Occupations
The most common Sales and Office occupations in Hardinsburg are Office & Administration (6 | 12.8%), and Sales & Related (1 | 2.1%).
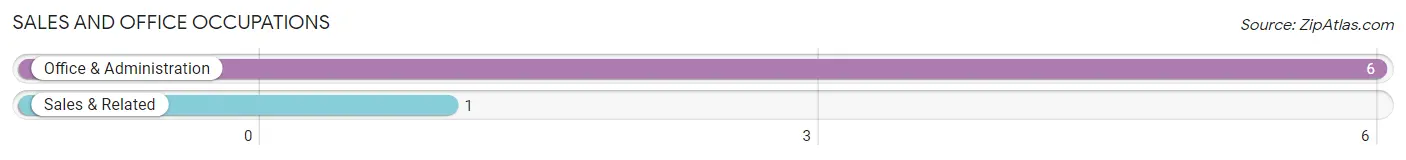
Sales and Office Occupations by Sex
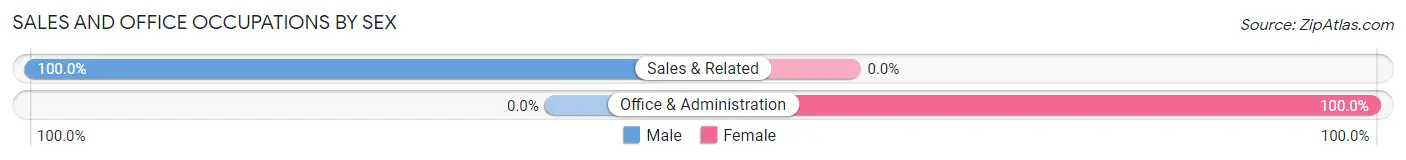
| Occupation | Male | Female |
| Sales & Related | 1 (100.0%) | 0 (0.0%) |
| Office & Administration | 0 (0.0%) | 6 (100.0%) |
| Total (Category) | 1 (14.3%) | 6 (85.7%) |
| Total (Overall) | 21 (44.7%) | 26 (55.3%) |
Natural Resources, Construction and Maintenance Occupations
The most common Natural Resources, Construction and Maintenance occupations in Hardinsburg are , and Construction & Extraction (5 | 10.6%).
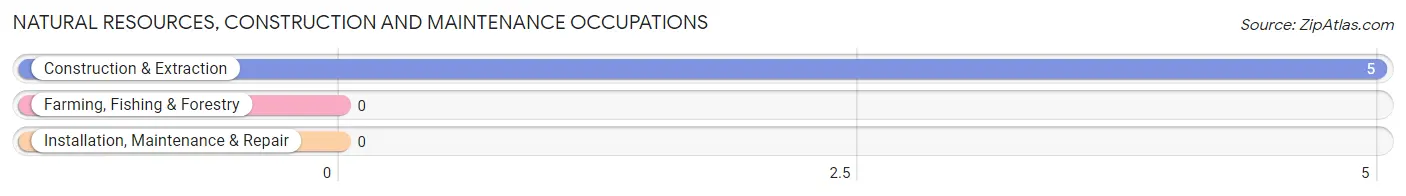
Natural Resources, Construction and Maintenance Occupations by Sex

| Occupation | Male | Female |
| Farming, Fishing & Forestry | 0 (0.0%) | 0 (0.0%) |
| Construction & Extraction | 5 (100.0%) | 0 (0.0%) |
| Installation, Maintenance & Repair | 0 (0.0%) | 0 (0.0%) |
| Total (Category) | 5 (100.0%) | 0 (0.0%) |
| Total (Overall) | 21 (44.7%) | 26 (55.3%) |
Production, Transportation and Moving Occupations
The most common Production, Transportation and Moving occupations in Hardinsburg are Production (12 | 25.5%), Material Moving (2 | 4.3%), and Transportation (1 | 2.1%).
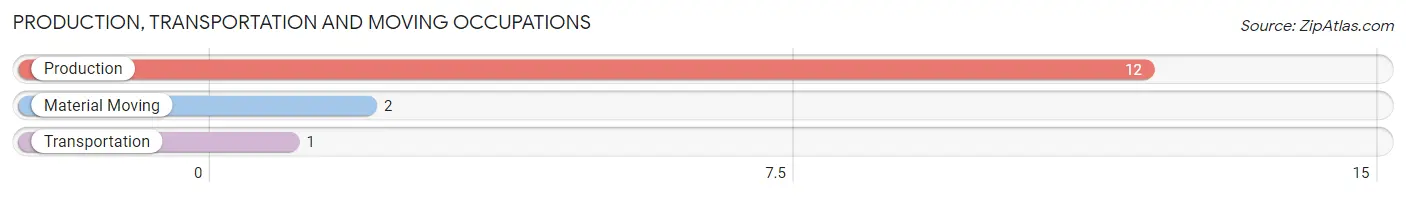
Production, Transportation and Moving Occupations by Sex
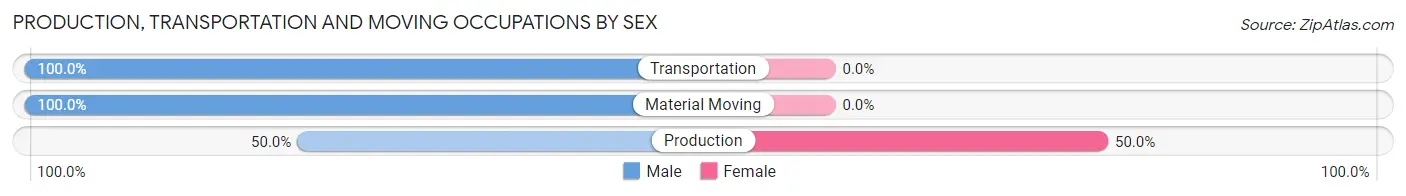
| Occupation | Male | Female |
| Production | 6 (50.0%) | 6 (50.0%) |
| Transportation | 1 (100.0%) | 0 (0.0%) |
| Material Moving | 2 (100.0%) | 0 (0.0%) |
| Total (Category) | 9 (60.0%) | 6 (40.0%) |
| Total (Overall) | 21 (44.7%) | 26 (55.3%) |
Employment Industries by Sex in Hardinsburg
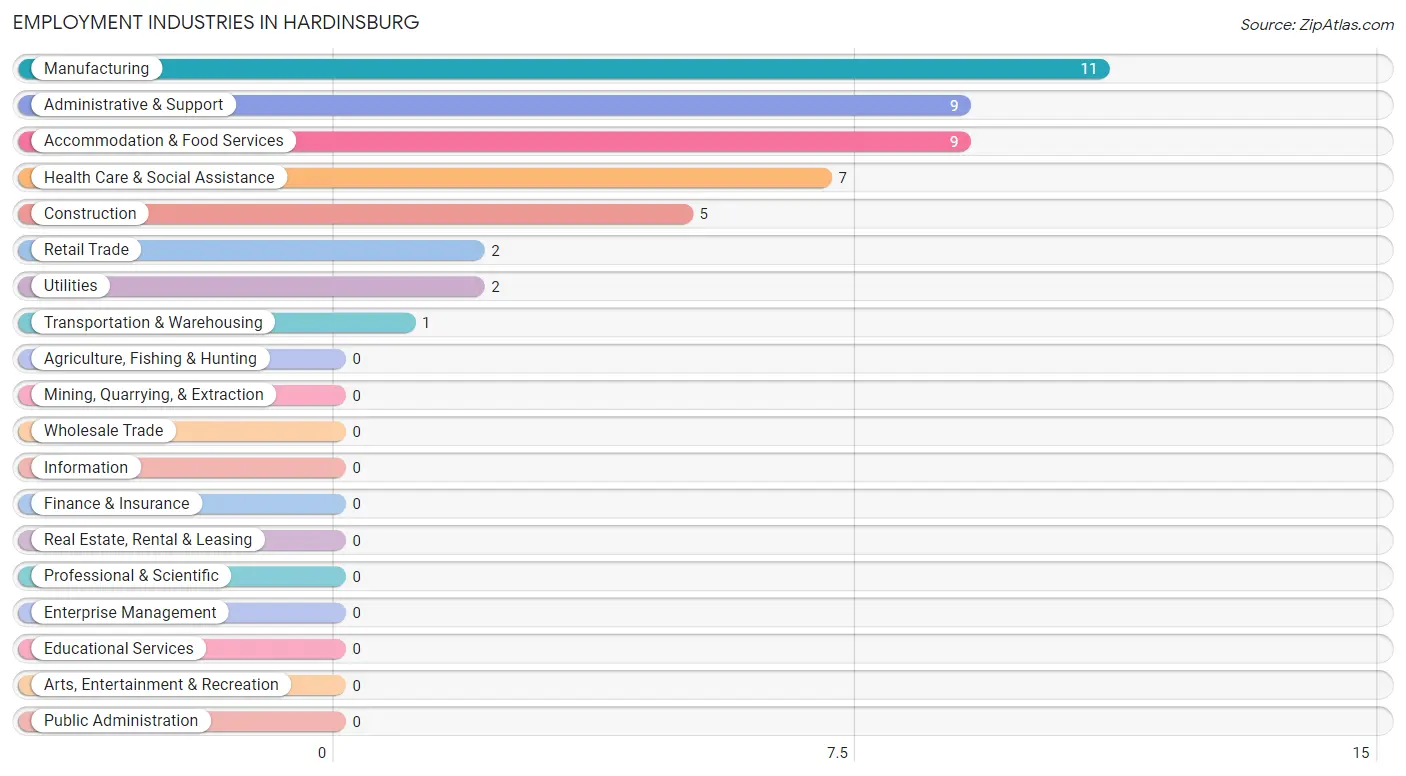
Employment Industries in Hardinsburg
The major employment industries in Hardinsburg include Manufacturing (11 | 23.4%), Administrative & Support (9 | 19.2%), Accommodation & Food Services (9 | 19.2%), Health Care & Social Assistance (7 | 14.9%), and Construction (5 | 10.6%).
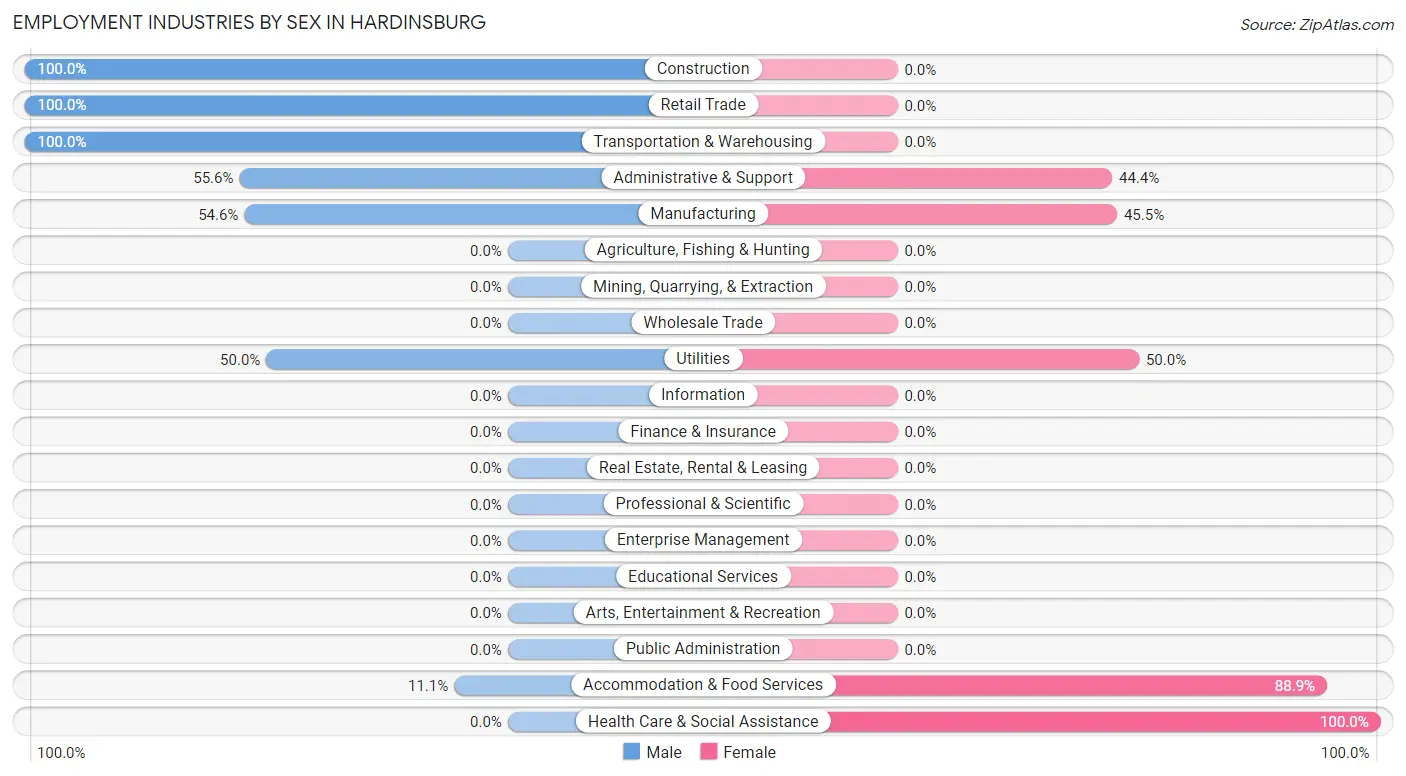
Employment Industries by Sex in Hardinsburg
The Hardinsburg industries that see more men than women are Construction (100.0%), Retail Trade (100.0%), and Transportation & Warehousing (100.0%), whereas the industries that tend to have a higher number of women are Health Care & Social Assistance (100.0%), Accommodation & Food Services (88.9%), and Utilities (50.0%).
| Industry | Male | Female |
| Agriculture, Fishing & Hunting | 0 (0.0%) | 0 (0.0%) |
| Mining, Quarrying, & Extraction | 0 (0.0%) | 0 (0.0%) |
| Construction | 5 (100.0%) | 0 (0.0%) |
| Manufacturing | 6 (54.5%) | 5 (45.5%) |
| Wholesale Trade | 0 (0.0%) | 0 (0.0%) |
| Retail Trade | 2 (100.0%) | 0 (0.0%) |
| Transportation & Warehousing | 1 (100.0%) | 0 (0.0%) |
| Utilities | 1 (50.0%) | 1 (50.0%) |
| Information | 0 (0.0%) | 0 (0.0%) |
| Finance & Insurance | 0 (0.0%) | 0 (0.0%) |
| Real Estate, Rental & Leasing | 0 (0.0%) | 0 (0.0%) |
| Professional & Scientific | 0 (0.0%) | 0 (0.0%) |
| Enterprise Management | 0 (0.0%) | 0 (0.0%) |
| Administrative & Support | 5 (55.6%) | 4 (44.4%) |
| Educational Services | 0 (0.0%) | 0 (0.0%) |
| Health Care & Social Assistance | 0 (0.0%) | 7 (100.0%) |
| Arts, Entertainment & Recreation | 0 (0.0%) | 0 (0.0%) |
| Accommodation & Food Services | 1 (11.1%) | 8 (88.9%) |
| Public Administration | 0 (0.0%) | 0 (0.0%) |
| Total | 21 (44.7%) | 26 (55.3%) |
Education in Hardinsburg
School Enrollment in Hardinsburg
The most common levels of schooling among the 56 students in Hardinsburg are middle school (15 | 26.8%), kindergarten (14 | 25.0%), and elementary school (14 | 25.0%).
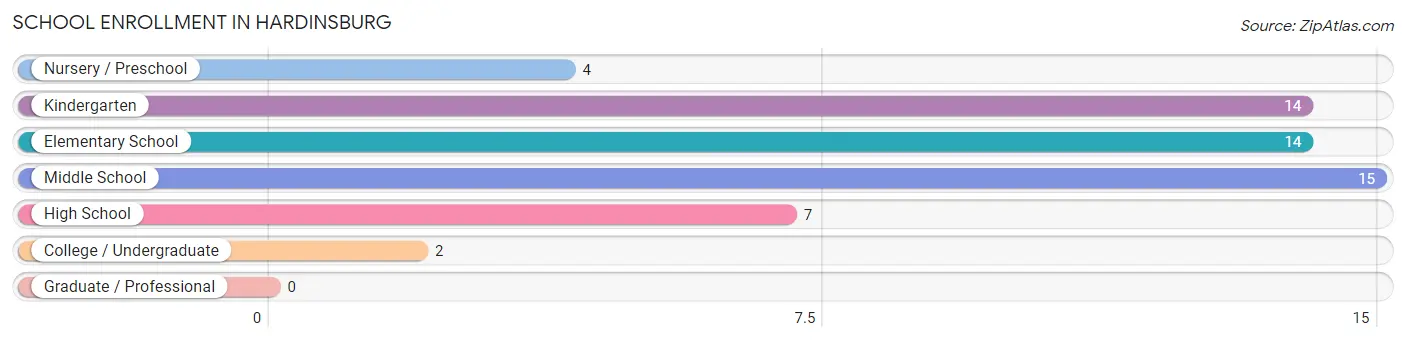
| School Level | # Students | % Students |
| Nursery / Preschool | 4 | 7.1% |
| Kindergarten | 14 | 25.0% |
| Elementary School | 14 | 25.0% |
| Middle School | 15 | 26.8% |
| High School | 7 | 12.5% |
| College / Undergraduate | 2 | 3.6% |
| Graduate / Professional | 0 | 0.0% |
| Total | 56 | 100.0% |
School Enrollment by Age by Funding Source in Hardinsburg
Out of a total of 56 students who are enrolled in schools in Hardinsburg, 4 (7.1%) attend a private institution, while the remaining 52 (92.9%) are enrolled in public schools. The age group of 15 to 17 year olds has the highest likelihood of being enrolled in private schools, with 1 (33.3% in the age bracket) enrolled. Conversely, the age group of 3 to 4 year olds has the lowest likelihood of being enrolled in a private school, with 4 (100.0% in the age bracket) attending a public institution.
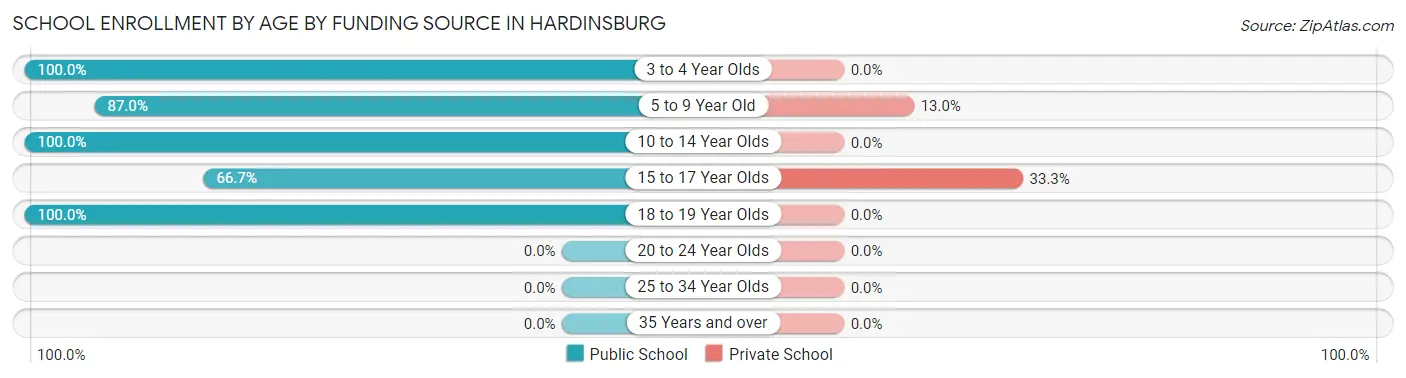
| Age Bracket | Public School | Private School |
| 3 to 4 Year Olds | 4 (100.0%) | 0 (0.0%) |
| 5 to 9 Year Old | 20 (87.0%) | 3 (13.0%) |
| 10 to 14 Year Olds | 24 (100.0%) | 0 (0.0%) |
| 15 to 17 Year Olds | 2 (66.7%) | 1 (33.3%) |
| 18 to 19 Year Olds | 2 (100.0%) | 0 (0.0%) |
| 20 to 24 Year Olds | 0 (0.0%) | 0 (0.0%) |
| 25 to 34 Year Olds | 0 (0.0%) | 0 (0.0%) |
| 35 Years and over | 0 (0.0%) | 0 (0.0%) |
| Total | 52 (92.9%) | 4 (7.1%) |
Educational Attainment by Field of Study in Hardinsburg
Education (4 | 66.7%), and science & technology (2 | 33.3%) are the most common fields of study among 6 individuals in Hardinsburg who have obtained a bachelor's degree or higher.
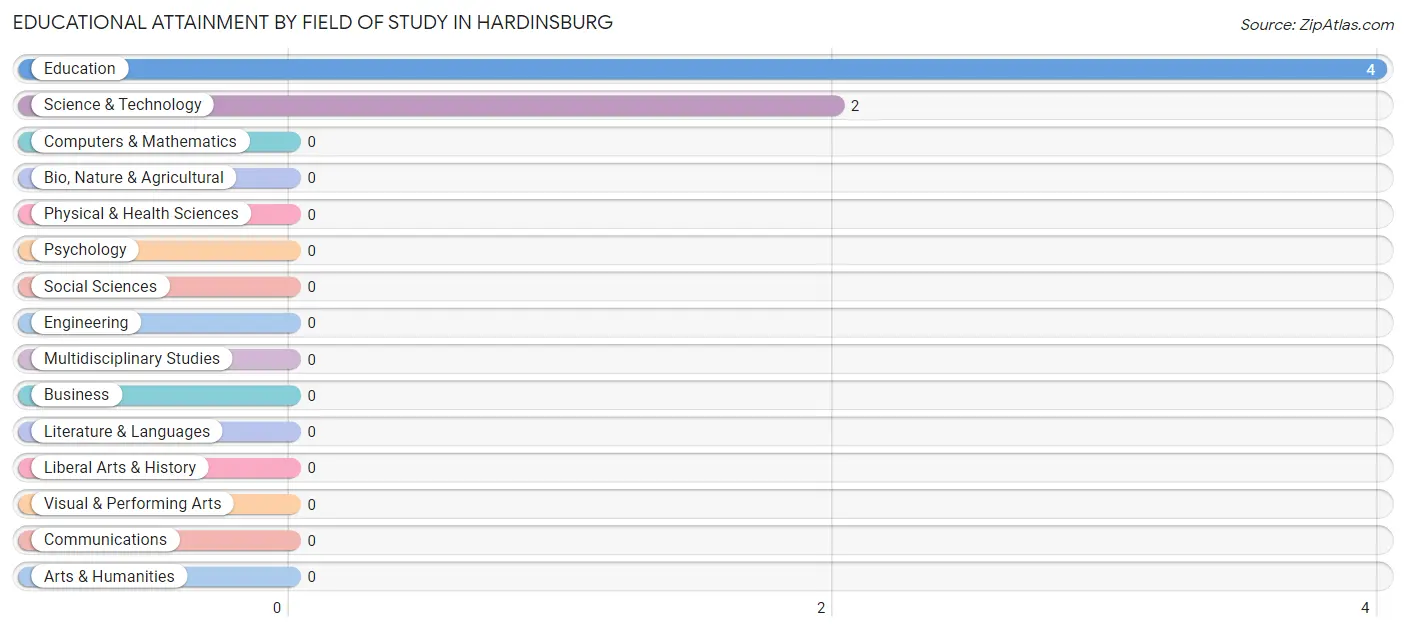
| Field of Study | # Graduates | % Graduates |
| Computers & Mathematics | 0 | 0.0% |
| Bio, Nature & Agricultural | 0 | 0.0% |
| Physical & Health Sciences | 0 | 0.0% |
| Psychology | 0 | 0.0% |
| Social Sciences | 0 | 0.0% |
| Engineering | 0 | 0.0% |
| Multidisciplinary Studies | 0 | 0.0% |
| Science & Technology | 2 | 33.3% |
| Business | 0 | 0.0% |
| Education | 4 | 66.7% |
| Literature & Languages | 0 | 0.0% |
| Liberal Arts & History | 0 | 0.0% |
| Visual & Performing Arts | 0 | 0.0% |
| Communications | 0 | 0.0% |
| Arts & Humanities | 0 | 0.0% |
| Total | 6 | 100.0% |
Transportation & Commute in Hardinsburg
Vehicle Availability by Sex in Hardinsburg
The most prevalent vehicle ownership categories in Hardinsburg are males with 3 vehicles (15, accounting for 71.4%) and females with 3 vehicles (13, making up 57.7%).
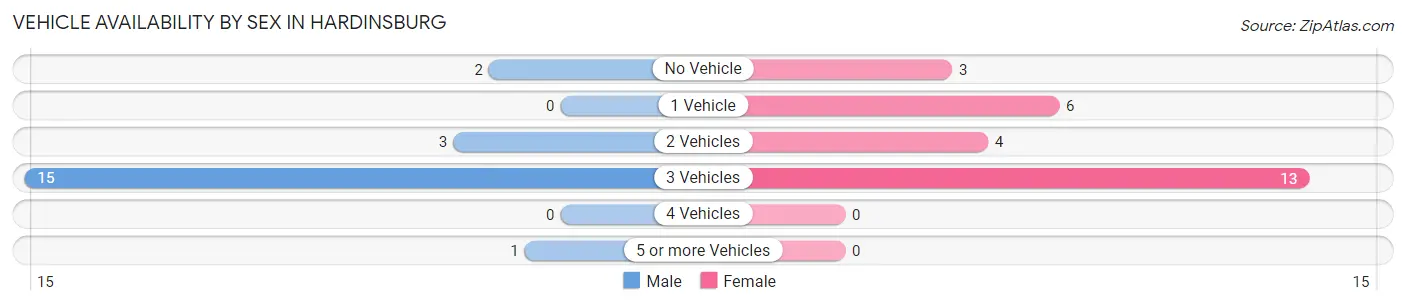
| Vehicles Available | Male | Female |
| No Vehicle | 2 (9.5%) | 3 (11.5%) |
| 1 Vehicle | 0 (0.0%) | 6 (23.1%) |
| 2 Vehicles | 3 (14.3%) | 4 (15.4%) |
| 3 Vehicles | 15 (71.4%) | 13 (50.0%) |
| 4 Vehicles | 0 (0.0%) | 0 (0.0%) |
| 5 or more Vehicles | 1 (4.8%) | 0 (0.0%) |
| Total | 21 (100.0%) | 26 (100.0%) |
Commute Time in Hardinsburg
The most frequently occuring commute durations in Hardinsburg are 30 to 34 minutes (10 commuters, 22.2%), 45 to 59 minutes (8 commuters, 17.8%), and 60 to 89 minutes (7 commuters, 15.6%).
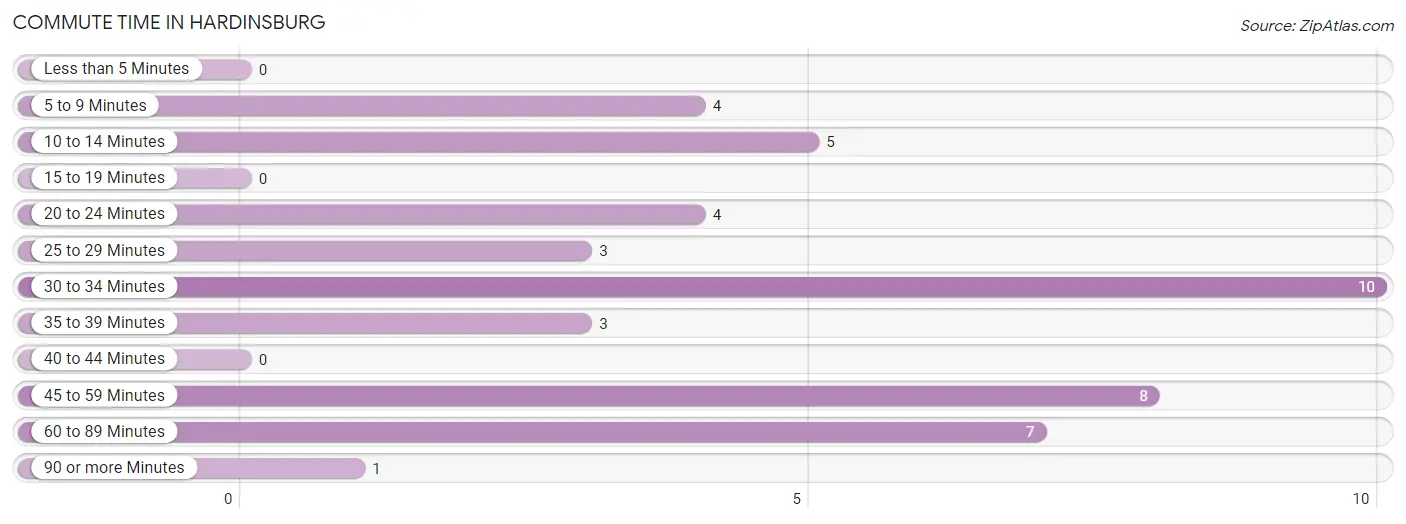
| Commute Time | # Commuters | % Commuters |
| Less than 5 Minutes | 0 | 0.0% |
| 5 to 9 Minutes | 4 | 8.9% |
| 10 to 14 Minutes | 5 | 11.1% |
| 15 to 19 Minutes | 0 | 0.0% |
| 20 to 24 Minutes | 4 | 8.9% |
| 25 to 29 Minutes | 3 | 6.7% |
| 30 to 34 Minutes | 10 | 22.2% |
| 35 to 39 Minutes | 3 | 6.7% |
| 40 to 44 Minutes | 0 | 0.0% |
| 45 to 59 Minutes | 8 | 17.8% |
| 60 to 89 Minutes | 7 | 15.6% |
| 90 or more Minutes | 1 | 2.2% |
Commute Time by Sex in Hardinsburg
The most common commute times in Hardinsburg are 30 to 34 minutes (5 commuters, 23.8%) for males and 30 to 34 minutes (5 commuters, 20.8%) for females.
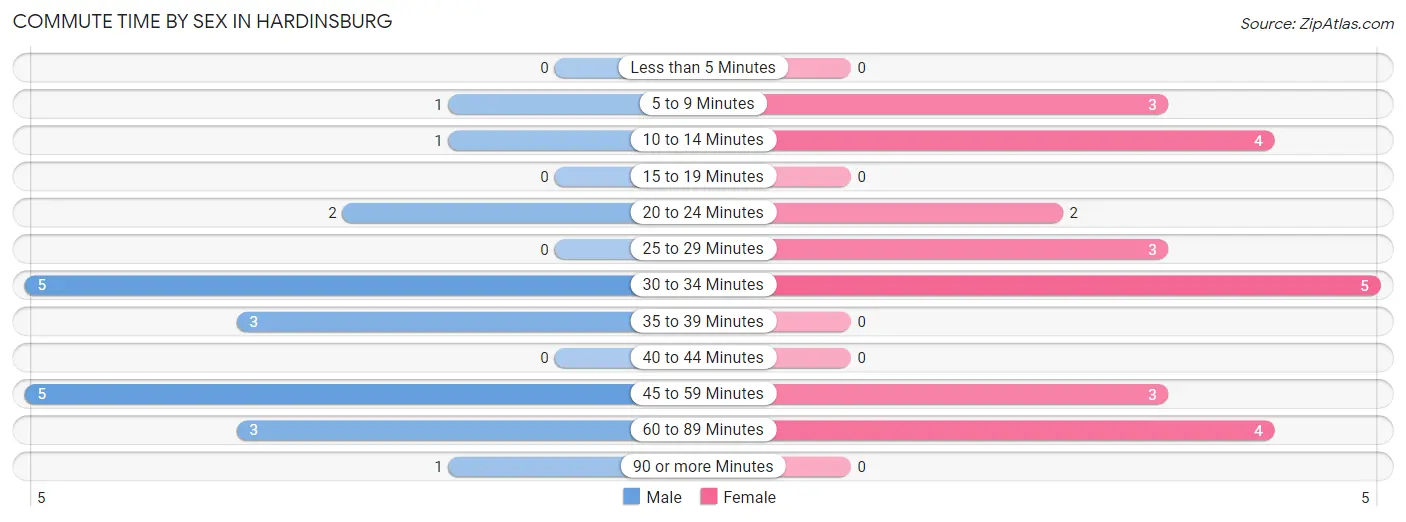
| Commute Time | Male | Female |
| Less than 5 Minutes | 0 (0.0%) | 0 (0.0%) |
| 5 to 9 Minutes | 1 (4.8%) | 3 (12.5%) |
| 10 to 14 Minutes | 1 (4.8%) | 4 (16.7%) |
| 15 to 19 Minutes | 0 (0.0%) | 0 (0.0%) |
| 20 to 24 Minutes | 2 (9.5%) | 2 (8.3%) |
| 25 to 29 Minutes | 0 (0.0%) | 3 (12.5%) |
| 30 to 34 Minutes | 5 (23.8%) | 5 (20.8%) |
| 35 to 39 Minutes | 3 (14.3%) | 0 (0.0%) |
| 40 to 44 Minutes | 0 (0.0%) | 0 (0.0%) |
| 45 to 59 Minutes | 5 (23.8%) | 3 (12.5%) |
| 60 to 89 Minutes | 3 (14.3%) | 4 (16.7%) |
| 90 or more Minutes | 1 (4.8%) | 0 (0.0%) |
Time of Departure to Work by Sex in Hardinsburg
The most frequent times of departure to work in Hardinsburg are 8:00 AM to 8:29 AM (6, 28.6%) for males and 10:00 AM to 10:59 AM (6, 25.0%) for females.
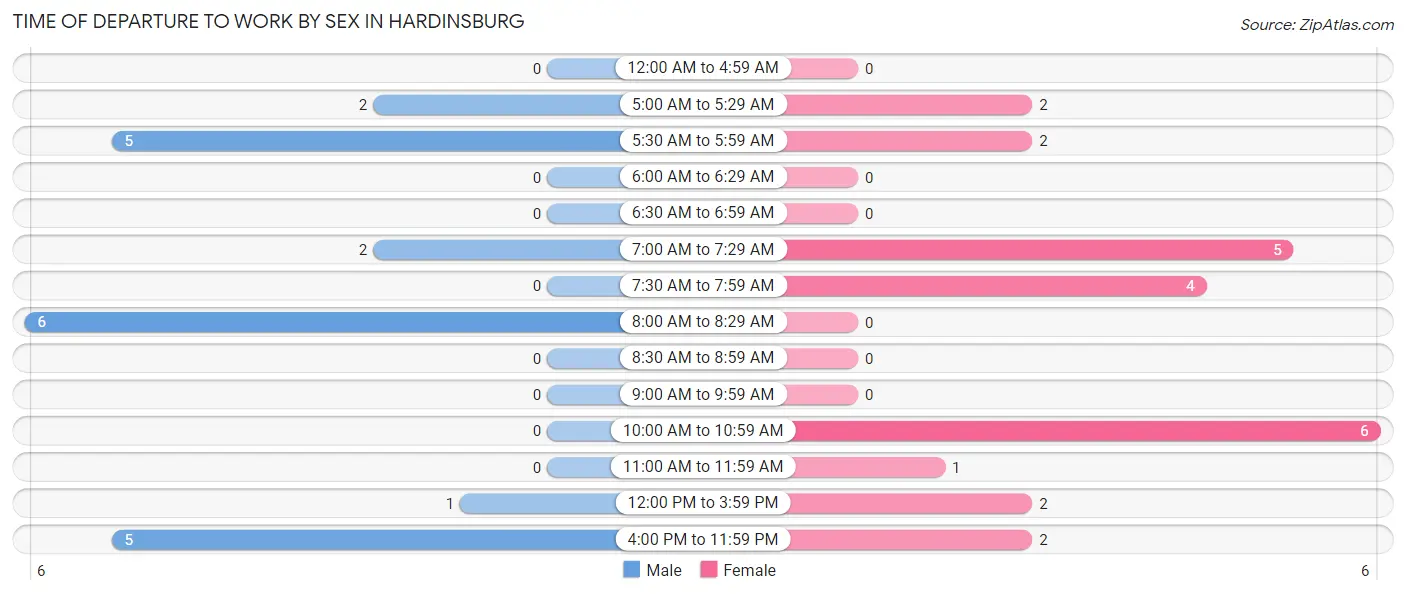
| Time of Departure | Male | Female |
| 12:00 AM to 4:59 AM | 0 (0.0%) | 0 (0.0%) |
| 5:00 AM to 5:29 AM | 2 (9.5%) | 2 (8.3%) |
| 5:30 AM to 5:59 AM | 5 (23.8%) | 2 (8.3%) |
| 6:00 AM to 6:29 AM | 0 (0.0%) | 0 (0.0%) |
| 6:30 AM to 6:59 AM | 0 (0.0%) | 0 (0.0%) |
| 7:00 AM to 7:29 AM | 2 (9.5%) | 5 (20.8%) |
| 7:30 AM to 7:59 AM | 0 (0.0%) | 4 (16.7%) |
| 8:00 AM to 8:29 AM | 6 (28.6%) | 0 (0.0%) |
| 8:30 AM to 8:59 AM | 0 (0.0%) | 0 (0.0%) |
| 9:00 AM to 9:59 AM | 0 (0.0%) | 0 (0.0%) |
| 10:00 AM to 10:59 AM | 0 (0.0%) | 6 (25.0%) |
| 11:00 AM to 11:59 AM | 0 (0.0%) | 1 (4.2%) |
| 12:00 PM to 3:59 PM | 1 (4.8%) | 2 (8.3%) |
| 4:00 PM to 11:59 PM | 5 (23.8%) | 2 (8.3%) |
| Total | 21 (100.0%) | 24 (100.0%) |
Housing Occupancy in Hardinsburg
Occupancy by Ownership in Hardinsburg
Of the total 76 dwellings in Hardinsburg, owner-occupied units account for 61 (80.3%), while renter-occupied units make up 15 (19.7%).
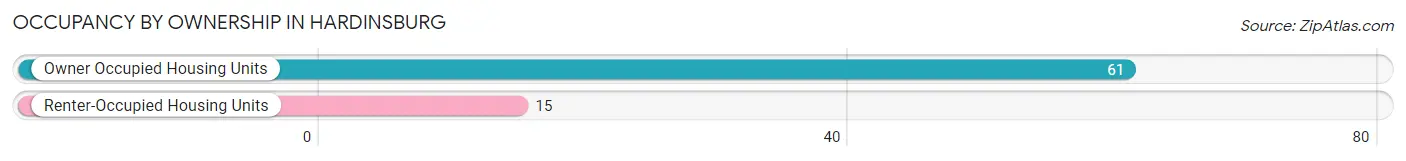
| Occupancy | # Housing Units | % Housing Units |
| Owner Occupied Housing Units | 61 | 80.3% |
| Renter-Occupied Housing Units | 15 | 19.7% |
| Total Occupied Housing Units | 76 | 100.0% |
Occupancy by Household Size in Hardinsburg
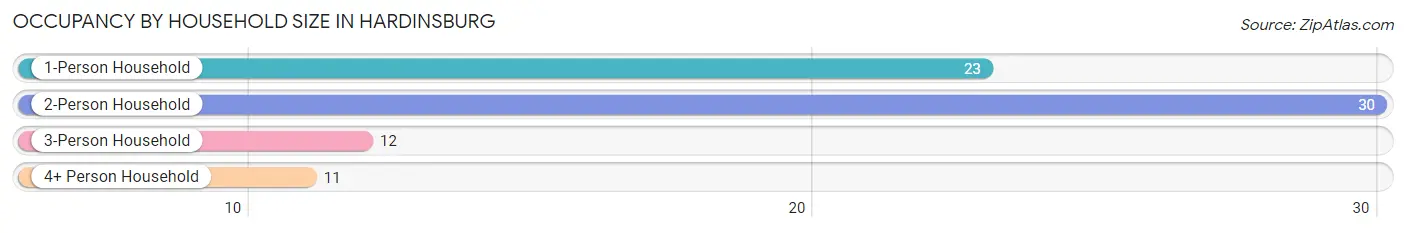
| Household Size | # Housing Units | % Housing Units |
| 1-Person Household | 23 | 30.3% |
| 2-Person Household | 30 | 39.5% |
| 3-Person Household | 12 | 15.8% |
| 4+ Person Household | 11 | 14.5% |
| Total Housing Units | 76 | 100.0% |
Occupancy by Ownership by Household Size in Hardinsburg
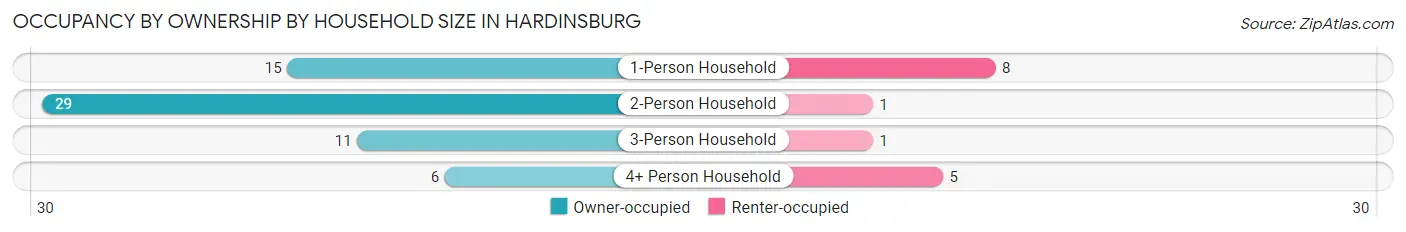
| Household Size | Owner-occupied | Renter-occupied |
| 1-Person Household | 15 (65.2%) | 8 (34.8%) |
| 2-Person Household | 29 (96.7%) | 1 (3.3%) |
| 3-Person Household | 11 (91.7%) | 1 (8.3%) |
| 4+ Person Household | 6 (54.5%) | 5 (45.5%) |
| Total Housing Units | 61 (80.3%) | 15 (19.7%) |
Occupancy by Educational Attainment in Hardinsburg
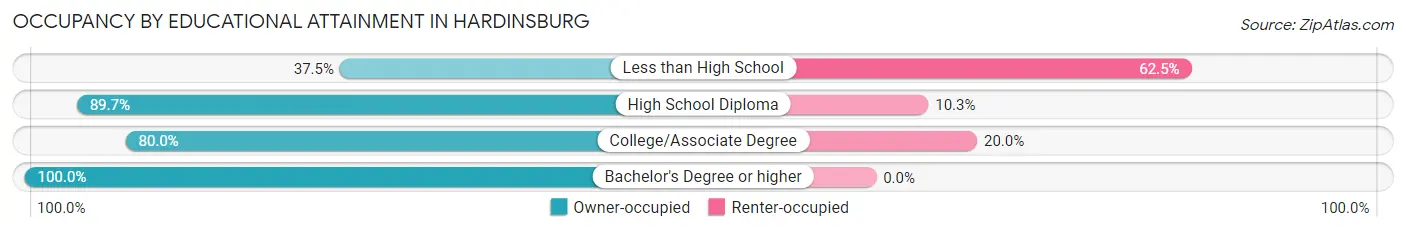
| Household Size | Owner-occupied | Renter-occupied |
| Less than High School | 3 (37.5%) | 5 (62.5%) |
| High School Diploma | 26 (89.7%) | 3 (10.3%) |
| College/Associate Degree | 28 (80.0%) | 7 (20.0%) |
| Bachelor's Degree or higher | 4 (100.0%) | 0 (0.0%) |
Occupancy by Age of Householder in Hardinsburg
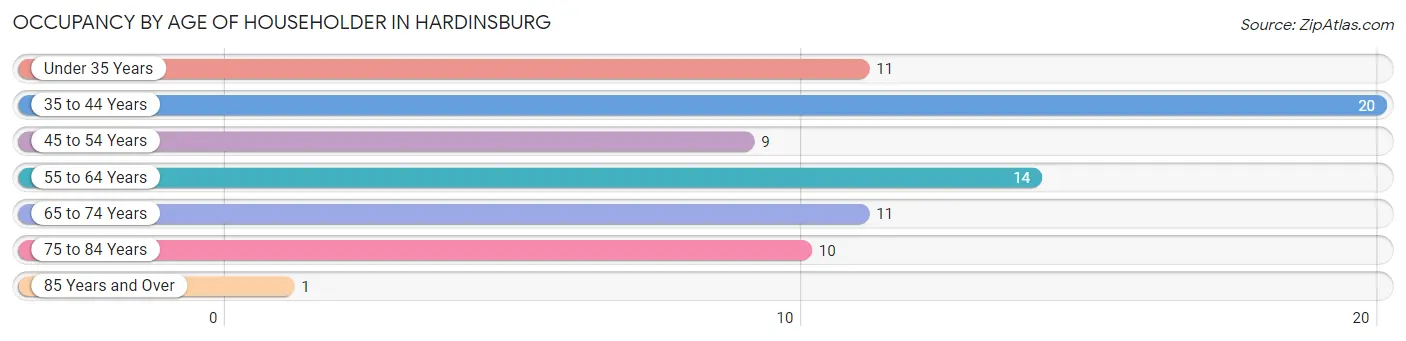
| Age Bracket | # Households | % Households |
| Under 35 Years | 11 | 14.5% |
| 35 to 44 Years | 20 | 26.3% |
| 45 to 54 Years | 9 | 11.8% |
| 55 to 64 Years | 14 | 18.4% |
| 65 to 74 Years | 11 | 14.5% |
| 75 to 84 Years | 10 | 13.2% |
| 85 Years and Over | 1 | 1.3% |
| Total | 76 | 100.0% |
Housing Finances in Hardinsburg
Median Income by Occupancy in Hardinsburg
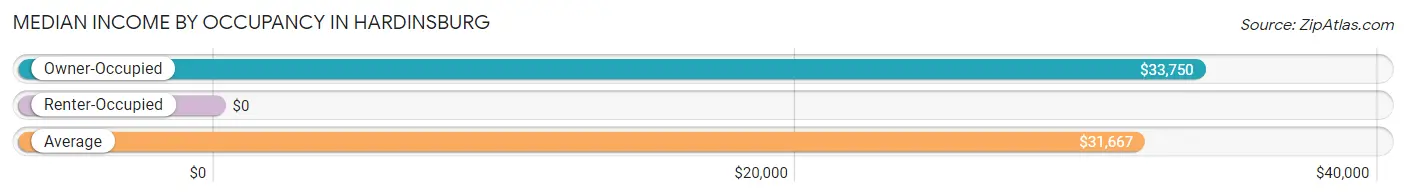
| Occupancy Type | # Households | Median Income |
| Owner-Occupied | 61 (80.3%) | $33,750 |
| Renter-Occupied | 15 (19.7%) | $0 |
| Average | 76 (100.0%) | $31,667 |
Occupancy by Householder Income Bracket in Hardinsburg
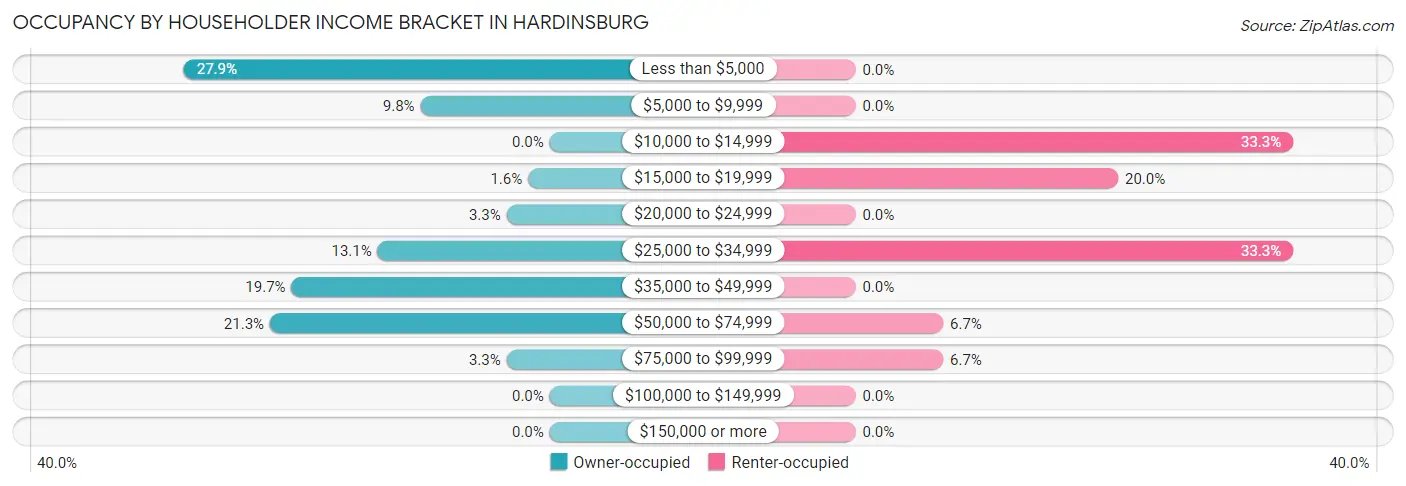
| Income Bracket | Owner-occupied | Renter-occupied |
| Less than $5,000 | 17 (27.9%) | 0 (0.0%) |
| $5,000 to $9,999 | 6 (9.8%) | 0 (0.0%) |
| $10,000 to $14,999 | 0 (0.0%) | 5 (33.3%) |
| $15,000 to $19,999 | 1 (1.6%) | 3 (20.0%) |
| $20,000 to $24,999 | 2 (3.3%) | 0 (0.0%) |
| $25,000 to $34,999 | 8 (13.1%) | 5 (33.3%) |
| $35,000 to $49,999 | 12 (19.7%) | 0 (0.0%) |
| $50,000 to $74,999 | 13 (21.3%) | 1 (6.7%) |
| $75,000 to $99,999 | 2 (3.3%) | 1 (6.7%) |
| $100,000 to $149,999 | 0 (0.0%) | 0 (0.0%) |
| $150,000 or more | 0 (0.0%) | 0 (0.0%) |
| Total | 61 (100.0%) | 15 (100.0%) |
Monthly Housing Cost Tiers in Hardinsburg
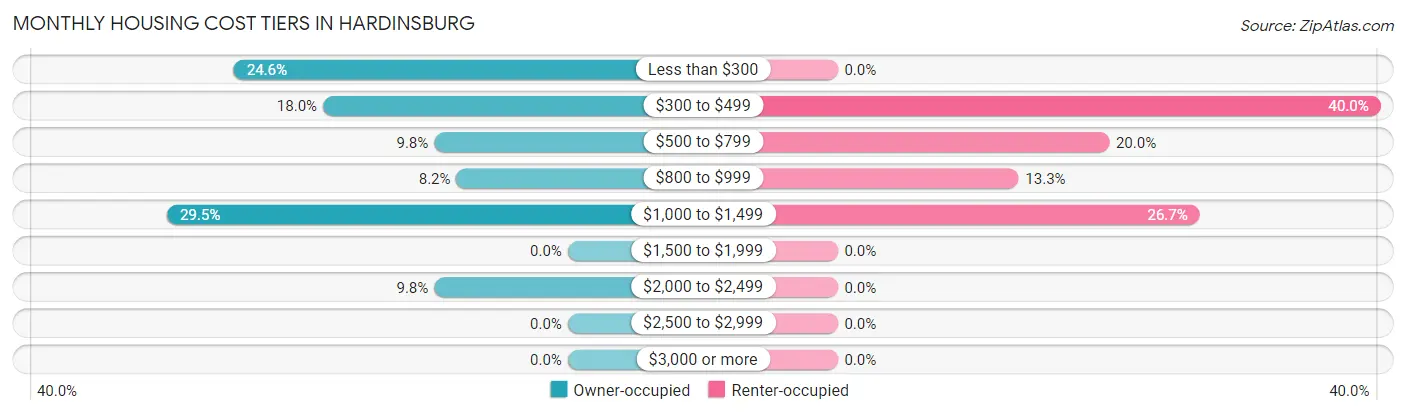
| Monthly Cost | Owner-occupied | Renter-occupied |
| Less than $300 | 15 (24.6%) | 0 (0.0%) |
| $300 to $499 | 11 (18.0%) | 6 (40.0%) |
| $500 to $799 | 6 (9.8%) | 3 (20.0%) |
| $800 to $999 | 5 (8.2%) | 2 (13.3%) |
| $1,000 to $1,499 | 18 (29.5%) | 4 (26.7%) |
| $1,500 to $1,999 | 0 (0.0%) | 0 (0.0%) |
| $2,000 to $2,499 | 6 (9.8%) | 0 (0.0%) |
| $2,500 to $2,999 | 0 (0.0%) | 0 (0.0%) |
| $3,000 or more | 0 (0.0%) | 0 (0.0%) |
| Total | 61 (100.0%) | 15 (100.0%) |
Physical Housing Characteristics in Hardinsburg
Housing Structures in Hardinsburg
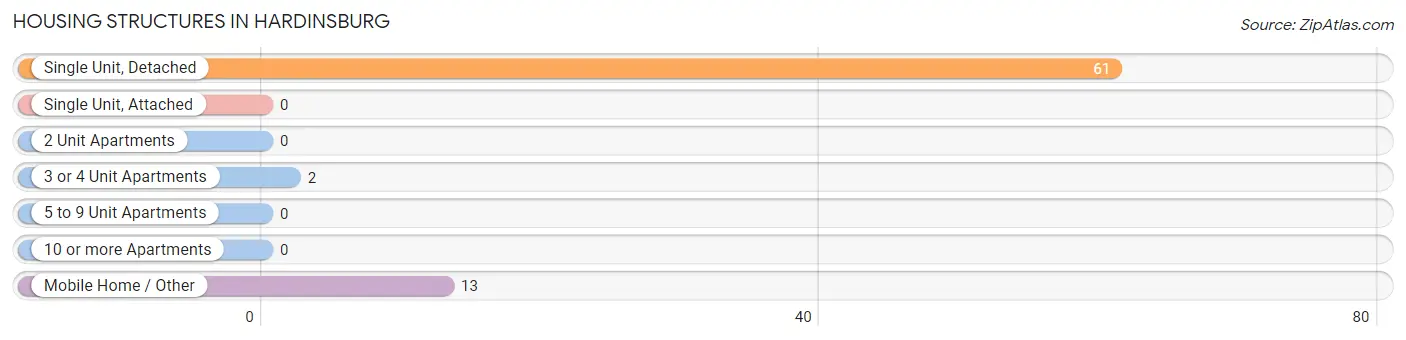
| Structure Type | # Housing Units | % Housing Units |
| Single Unit, Detached | 61 | 80.3% |
| Single Unit, Attached | 0 | 0.0% |
| 2 Unit Apartments | 0 | 0.0% |
| 3 or 4 Unit Apartments | 2 | 2.6% |
| 5 to 9 Unit Apartments | 0 | 0.0% |
| 10 or more Apartments | 0 | 0.0% |
| Mobile Home / Other | 13 | 17.1% |
| Total | 76 | 100.0% |
Housing Structures by Occupancy in Hardinsburg
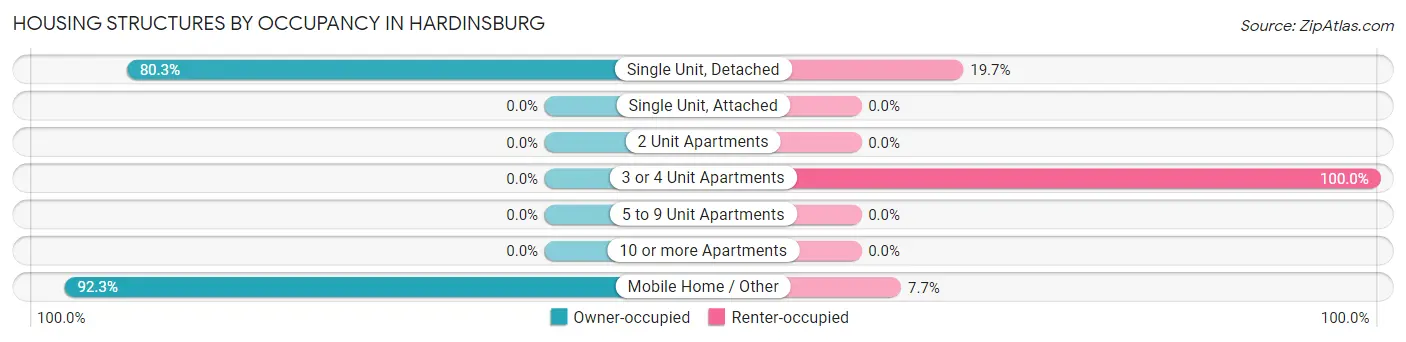
| Structure Type | Owner-occupied | Renter-occupied |
| Single Unit, Detached | 49 (80.3%) | 12 (19.7%) |
| Single Unit, Attached | 0 (0.0%) | 0 (0.0%) |
| 2 Unit Apartments | 0 (0.0%) | 0 (0.0%) |
| 3 or 4 Unit Apartments | 0 (0.0%) | 2 (100.0%) |
| 5 to 9 Unit Apartments | 0 (0.0%) | 0 (0.0%) |
| 10 or more Apartments | 0 (0.0%) | 0 (0.0%) |
| Mobile Home / Other | 12 (92.3%) | 1 (7.7%) |
| Total | 61 (80.3%) | 15 (19.7%) |
Housing Structures by Number of Rooms in Hardinsburg
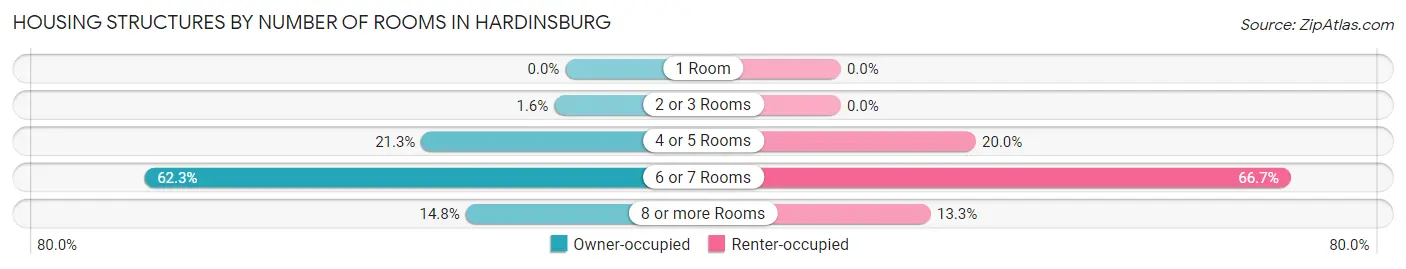
| Number of Rooms | Owner-occupied | Renter-occupied |
| 1 Room | 0 (0.0%) | 0 (0.0%) |
| 2 or 3 Rooms | 1 (1.6%) | 0 (0.0%) |
| 4 or 5 Rooms | 13 (21.3%) | 3 (20.0%) |
| 6 or 7 Rooms | 38 (62.3%) | 10 (66.7%) |
| 8 or more Rooms | 9 (14.7%) | 2 (13.3%) |
| Total | 61 (100.0%) | 15 (100.0%) |
Housing Structure by Heating Type in Hardinsburg
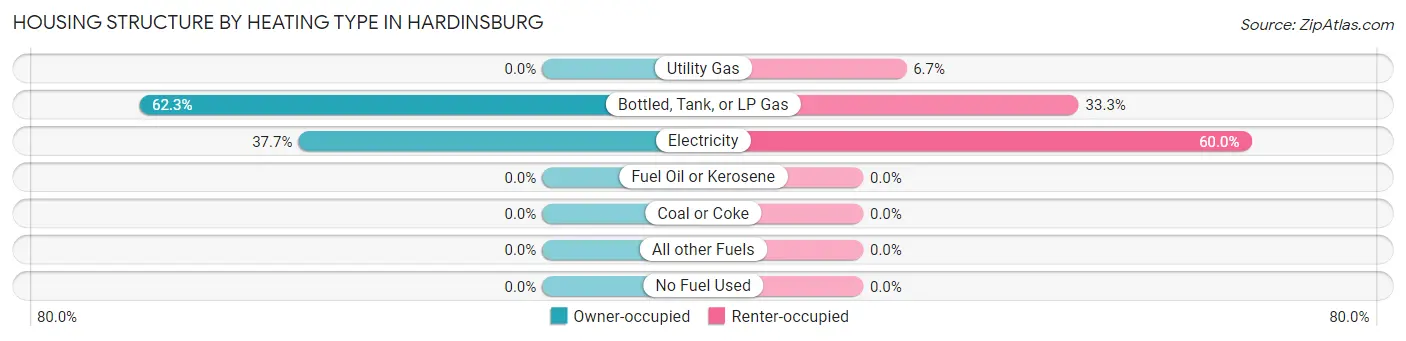
| Heating Type | Owner-occupied | Renter-occupied |
| Utility Gas | 0 (0.0%) | 1 (6.7%) |
| Bottled, Tank, or LP Gas | 38 (62.3%) | 5 (33.3%) |
| Electricity | 23 (37.7%) | 9 (60.0%) |
| Fuel Oil or Kerosene | 0 (0.0%) | 0 (0.0%) |
| Coal or Coke | 0 (0.0%) | 0 (0.0%) |
| All other Fuels | 0 (0.0%) | 0 (0.0%) |
| No Fuel Used | 0 (0.0%) | 0 (0.0%) |
| Total | 61 (100.0%) | 15 (100.0%) |
Household Vehicle Usage in Hardinsburg
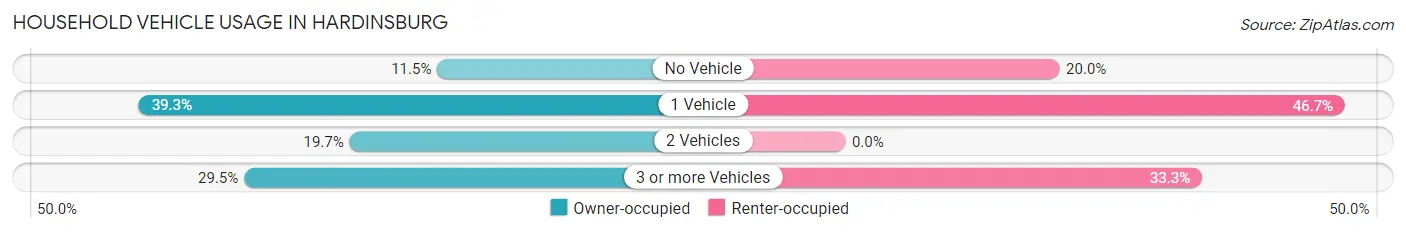
| Vehicles per Household | Owner-occupied | Renter-occupied |
| No Vehicle | 7 (11.5%) | 3 (20.0%) |
| 1 Vehicle | 24 (39.3%) | 7 (46.7%) |
| 2 Vehicles | 12 (19.7%) | 0 (0.0%) |
| 3 or more Vehicles | 18 (29.5%) | 5 (33.3%) |
| Total | 61 (100.0%) | 15 (100.0%) |
Real Estate & Mortgages in Hardinsburg
Real Estate and Mortgage Overview in Hardinsburg
| Characteristic | Without Mortgage | With Mortgage |
| Housing Units | 28 | 33 |
| Median Property Value | $91,000 | $0 |
| Median Household Income | $33,500 | $0 |
| Monthly Housing Costs | $275 | $0 |
| Real Estate Taxes | $460 | $1 |
Property Value by Mortgage Status in Hardinsburg
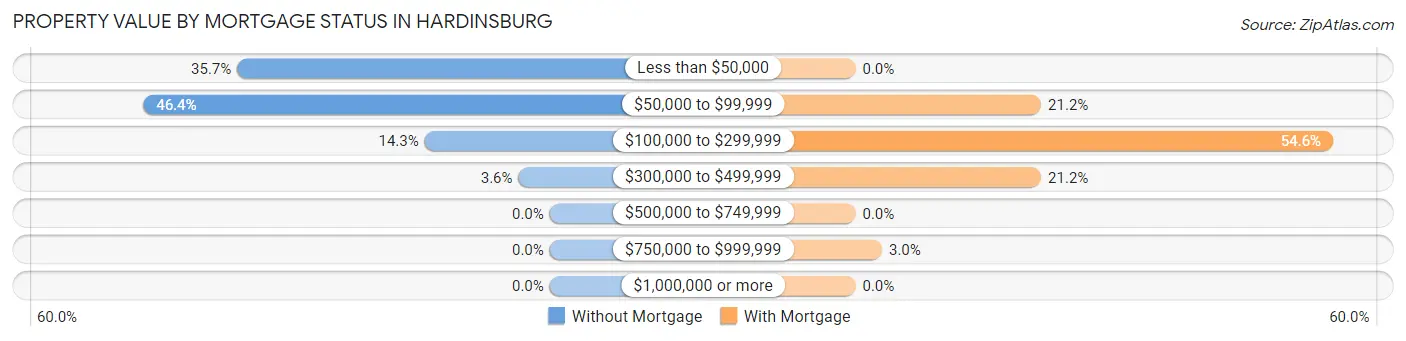
| Property Value | Without Mortgage | With Mortgage |
| Less than $50,000 | 10 (35.7%) | 0 (0.0%) |
| $50,000 to $99,999 | 13 (46.4%) | 7 (21.2%) |
| $100,000 to $299,999 | 4 (14.3%) | 18 (54.5%) |
| $300,000 to $499,999 | 1 (3.6%) | 7 (21.2%) |
| $500,000 to $749,999 | 0 (0.0%) | 0 (0.0%) |
| $750,000 to $999,999 | 0 (0.0%) | 1 (3.0%) |
| $1,000,000 or more | 0 (0.0%) | 0 (0.0%) |
| Total | 28 (100.0%) | 33 (100.0%) |
Household Income by Mortgage Status in Hardinsburg
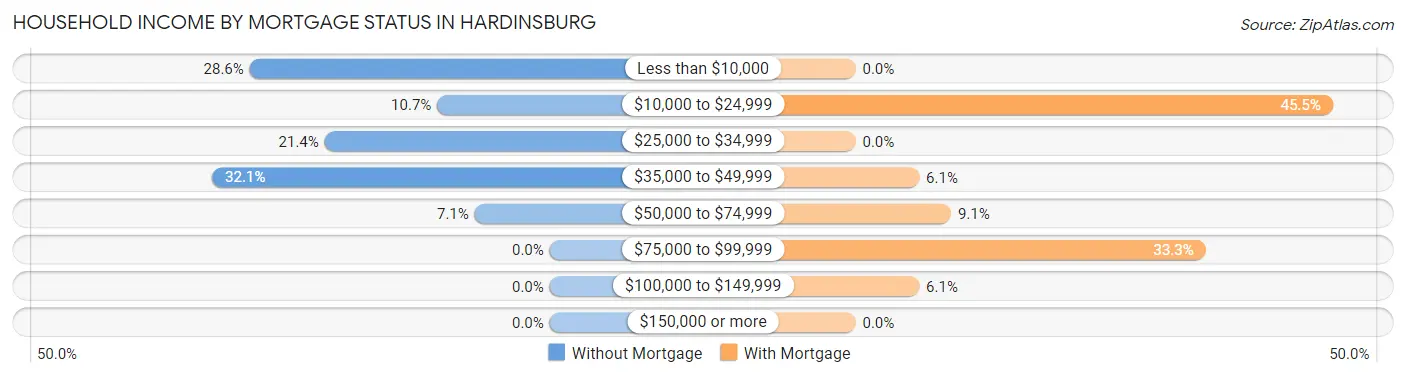
| Household Income | Without Mortgage | With Mortgage |
| Less than $10,000 | 8 (28.6%) | 0 (0.0%) |
| $10,000 to $24,999 | 3 (10.7%) | 15 (45.5%) |
| $25,000 to $34,999 | 6 (21.4%) | 0 (0.0%) |
| $35,000 to $49,999 | 9 (32.1%) | 2 (6.1%) |
| $50,000 to $74,999 | 2 (7.1%) | 3 (9.1%) |
| $75,000 to $99,999 | 0 (0.0%) | 11 (33.3%) |
| $100,000 to $149,999 | 0 (0.0%) | 2 (6.1%) |
| $150,000 or more | 0 (0.0%) | 0 (0.0%) |
| Total | 28 (100.0%) | 33 (100.0%) |
Property Value to Household Income Ratio in Hardinsburg
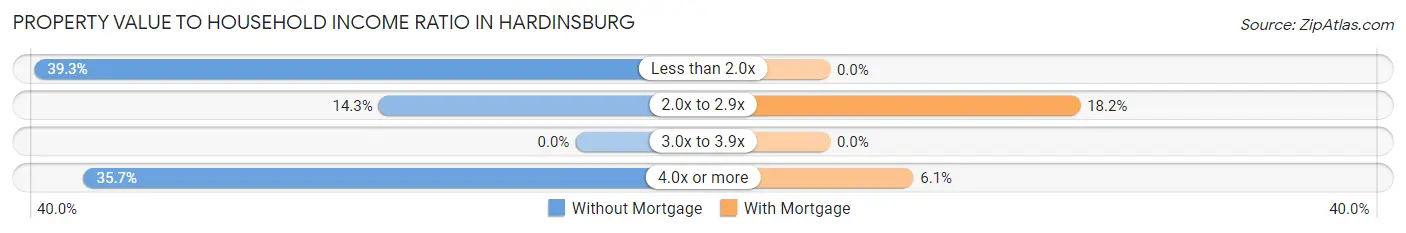
| Value-to-Income Ratio | Without Mortgage | With Mortgage |
| Less than 2.0x | 11 (39.3%) | 0 (0.0%) |
| 2.0x to 2.9x | 4 (14.3%) | 6 (18.2%) |
| 3.0x to 3.9x | 0 (0.0%) | 0 (0.0%) |
| 4.0x or more | 10 (35.7%) | 2 (6.1%) |
| Total | 28 (100.0%) | 33 (100.0%) |
Real Estate Taxes by Mortgage Status in Hardinsburg
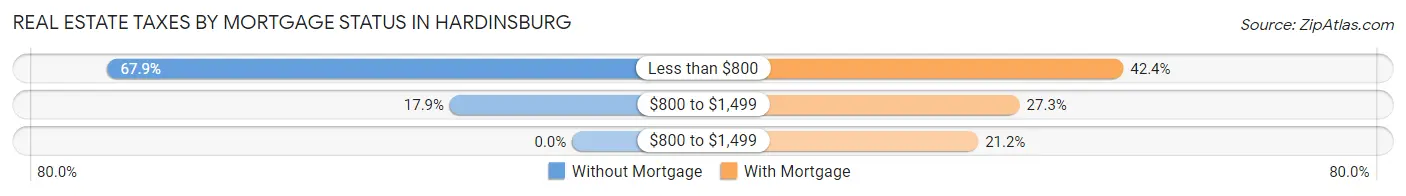
| Property Taxes | Without Mortgage | With Mortgage |
| Less than $800 | 19 (67.9%) | 14 (42.4%) |
| $800 to $1,499 | 5 (17.9%) | 9 (27.3%) |
| $800 to $1,499 | 0 (0.0%) | 7 (21.2%) |
| Total | 28 (100.0%) | 33 (100.0%) |
Health & Disability in Hardinsburg
Health Insurance Coverage by Age in Hardinsburg
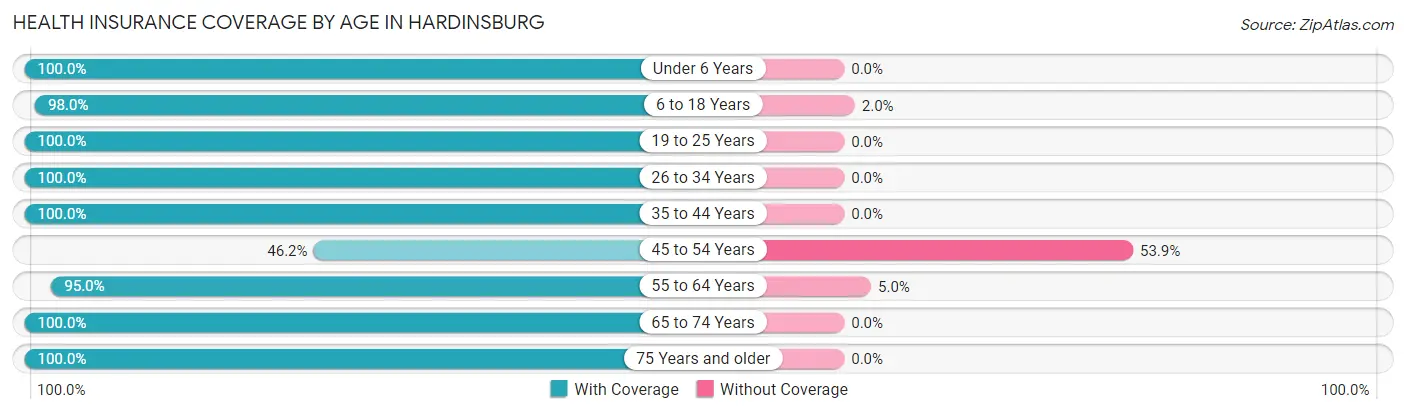
| Age Bracket | With Coverage | Without Coverage |
| Under 6 Years | 14 (100.0%) | 0 (0.0%) |
| 6 to 18 Years | 50 (98.0%) | 1 (2.0%) |
| 19 to 25 Years | 2 (100.0%) | 0 (0.0%) |
| 26 to 34 Years | 29 (100.0%) | 0 (0.0%) |
| 35 to 44 Years | 23 (100.0%) | 0 (0.0%) |
| 45 to 54 Years | 6 (46.2%) | 7 (53.8%) |
| 55 to 64 Years | 19 (95.0%) | 1 (5.0%) |
| 65 to 74 Years | 14 (100.0%) | 0 (0.0%) |
| 75 Years and older | 13 (100.0%) | 0 (0.0%) |
| Total | 170 (95.0%) | 9 (5.0%) |
Health Insurance Coverage by Citizenship Status in Hardinsburg
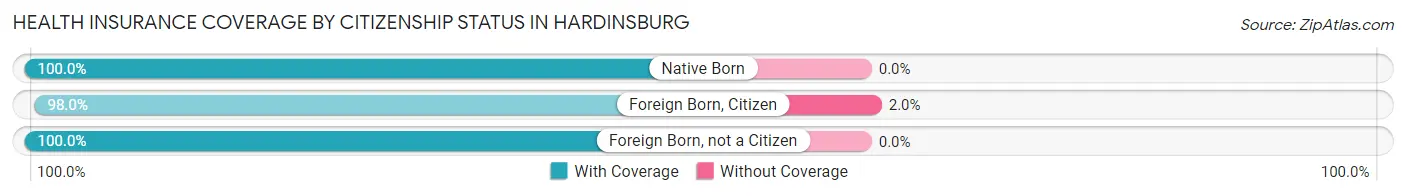
| Citizenship Status | With Coverage | Without Coverage |
| Native Born | 14 (100.0%) | 0 (0.0%) |
| Foreign Born, Citizen | 50 (98.0%) | 1 (2.0%) |
| Foreign Born, not a Citizen | 2 (100.0%) | 0 (0.0%) |
Health Insurance Coverage by Household Income in Hardinsburg
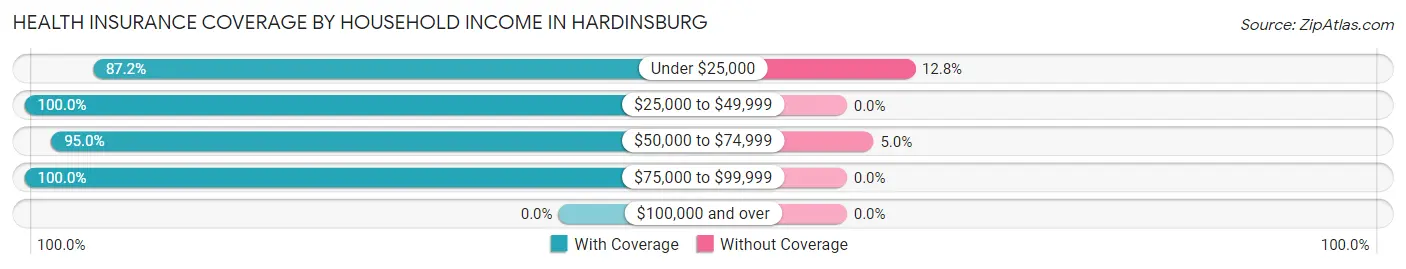
| Household Income | With Coverage | Without Coverage |
| Under $25,000 | 41 (87.2%) | 6 (12.8%) |
| $25,000 to $49,999 | 66 (100.0%) | 0 (0.0%) |
| $50,000 to $74,999 | 57 (95.0%) | 3 (5.0%) |
| $75,000 to $99,999 | 6 (100.0%) | 0 (0.0%) |
| $100,000 and over | 0 (0.0%) | 0 (0.0%) |
Public vs Private Health Insurance Coverage by Age in Hardinsburg
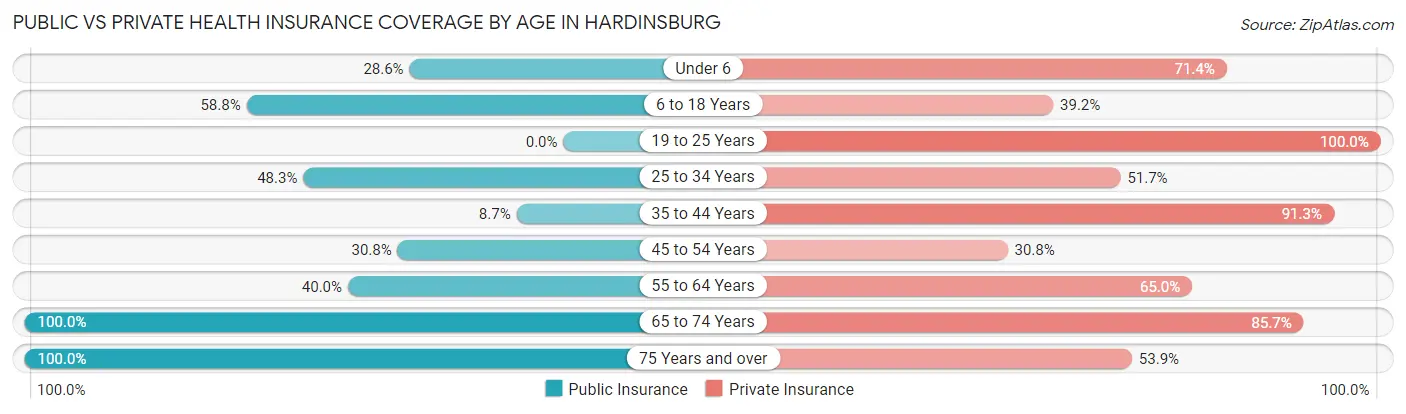
| Age Bracket | Public Insurance | Private Insurance |
| Under 6 | 4 (28.6%) | 10 (71.4%) |
| 6 to 18 Years | 30 (58.8%) | 20 (39.2%) |
| 19 to 25 Years | 0 (0.0%) | 2 (100.0%) |
| 25 to 34 Years | 14 (48.3%) | 15 (51.7%) |
| 35 to 44 Years | 2 (8.7%) | 21 (91.3%) |
| 45 to 54 Years | 4 (30.8%) | 4 (30.8%) |
| 55 to 64 Years | 8 (40.0%) | 13 (65.0%) |
| 65 to 74 Years | 14 (100.0%) | 12 (85.7%) |
| 75 Years and over | 13 (100.0%) | 7 (53.8%) |
| Total | 89 (49.7%) | 104 (58.1%) |
Disability Status by Sex by Age in Hardinsburg
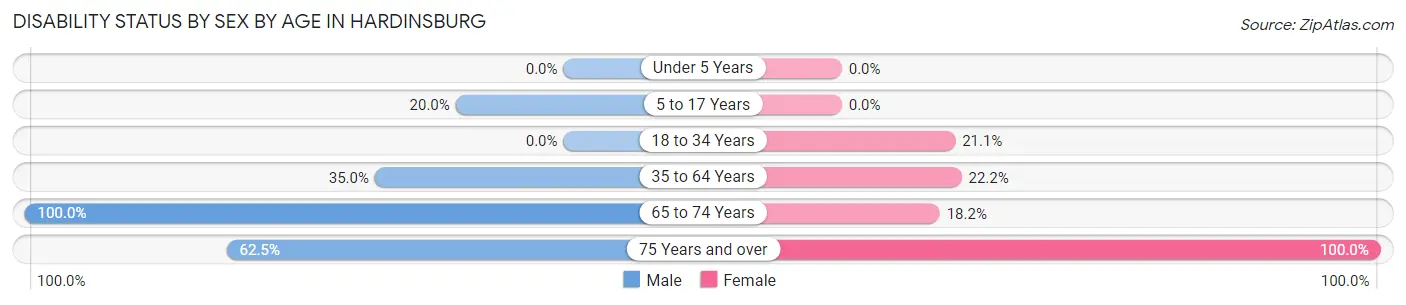
| Age Bracket | Male | Female |
| Under 5 Years | 0 (0.0%) | 0 (0.0%) |
| 5 to 17 Years | 3 (20.0%) | 0 (0.0%) |
| 18 to 34 Years | 0 (0.0%) | 4 (21.0%) |
| 35 to 64 Years | 7 (35.0%) | 8 (22.2%) |
| 65 to 74 Years | 3 (100.0%) | 2 (18.2%) |
| 75 Years and over | 5 (62.5%) | 5 (100.0%) |
Disability Class by Sex by Age in Hardinsburg
Disability Class: Hearing Difficulty
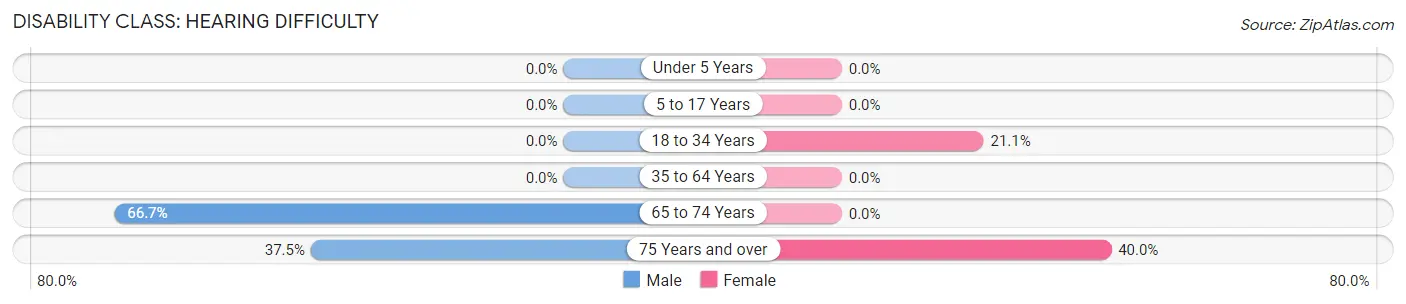
| Age Bracket | Male | Female |
| Under 5 Years | 0 (0.0%) | 0 (0.0%) |
| 5 to 17 Years | 0 (0.0%) | 0 (0.0%) |
| 18 to 34 Years | 0 (0.0%) | 4 (21.0%) |
| 35 to 64 Years | 0 (0.0%) | 0 (0.0%) |
| 65 to 74 Years | 2 (66.7%) | 0 (0.0%) |
| 75 Years and over | 3 (37.5%) | 2 (40.0%) |
Disability Class: Vision Difficulty
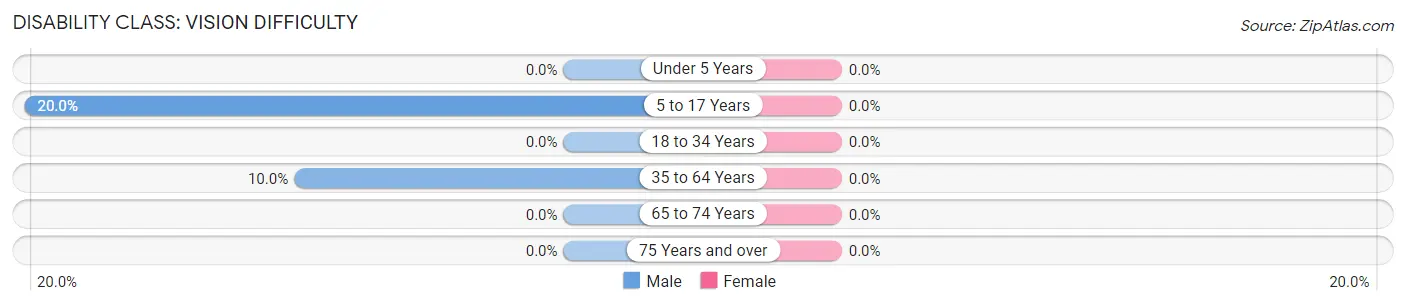
| Age Bracket | Male | Female |
| Under 5 Years | 0 (0.0%) | 0 (0.0%) |
| 5 to 17 Years | 3 (20.0%) | 0 (0.0%) |
| 18 to 34 Years | 0 (0.0%) | 0 (0.0%) |
| 35 to 64 Years | 2 (10.0%) | 0 (0.0%) |
| 65 to 74 Years | 0 (0.0%) | 0 (0.0%) |
| 75 Years and over | 0 (0.0%) | 0 (0.0%) |
Disability Class: Cognitive Difficulty
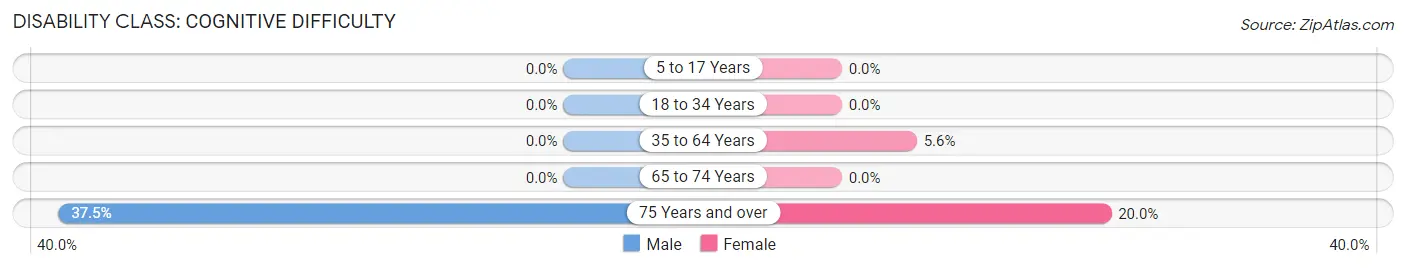
| Age Bracket | Male | Female |
| 5 to 17 Years | 0 (0.0%) | 0 (0.0%) |
| 18 to 34 Years | 0 (0.0%) | 0 (0.0%) |
| 35 to 64 Years | 0 (0.0%) | 2 (5.6%) |
| 65 to 74 Years | 0 (0.0%) | 0 (0.0%) |
| 75 Years and over | 3 (37.5%) | 1 (20.0%) |
Disability Class: Ambulatory Difficulty
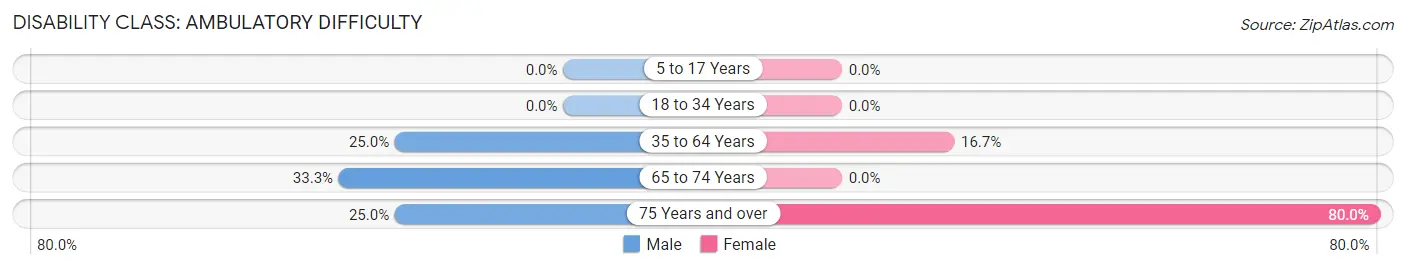
| Age Bracket | Male | Female |
| 5 to 17 Years | 0 (0.0%) | 0 (0.0%) |
| 18 to 34 Years | 0 (0.0%) | 0 (0.0%) |
| 35 to 64 Years | 5 (25.0%) | 6 (16.7%) |
| 65 to 74 Years | 1 (33.3%) | 0 (0.0%) |
| 75 Years and over | 2 (25.0%) | 4 (80.0%) |
Disability Class: Self-Care Difficulty
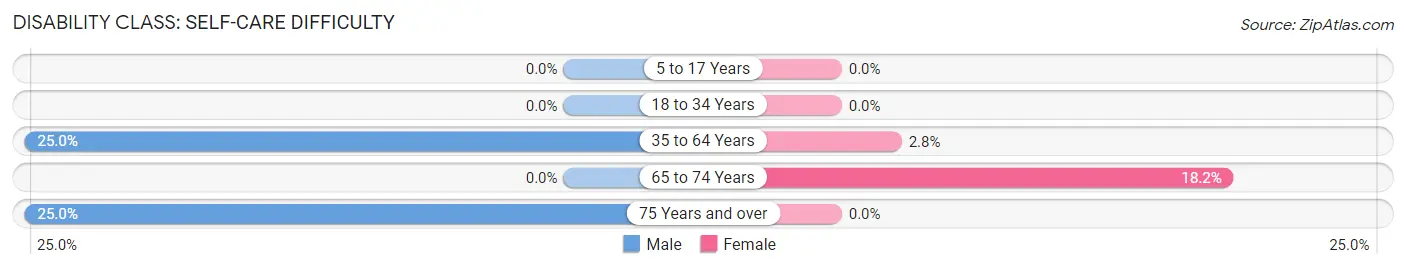
| Age Bracket | Male | Female |
| 5 to 17 Years | 0 (0.0%) | 0 (0.0%) |
| 18 to 34 Years | 0 (0.0%) | 0 (0.0%) |
| 35 to 64 Years | 5 (25.0%) | 1 (2.8%) |
| 65 to 74 Years | 0 (0.0%) | 2 (18.2%) |
| 75 Years and over | 2 (25.0%) | 0 (0.0%) |
Technology Access in Hardinsburg
Computing Device Access in Hardinsburg
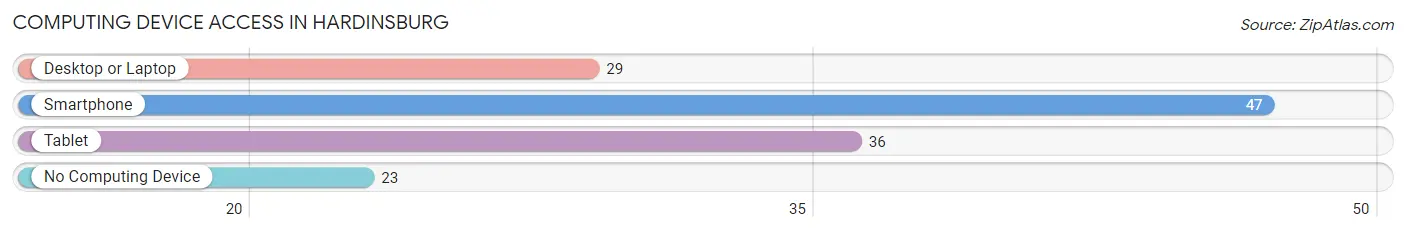
| Device Type | # Households | % Households |
| Desktop or Laptop | 29 | 38.2% |
| Smartphone | 47 | 61.8% |
| Tablet | 36 | 47.4% |
| No Computing Device | 23 | 30.3% |
| Total | 76 | 100.0% |
Internet Access in Hardinsburg
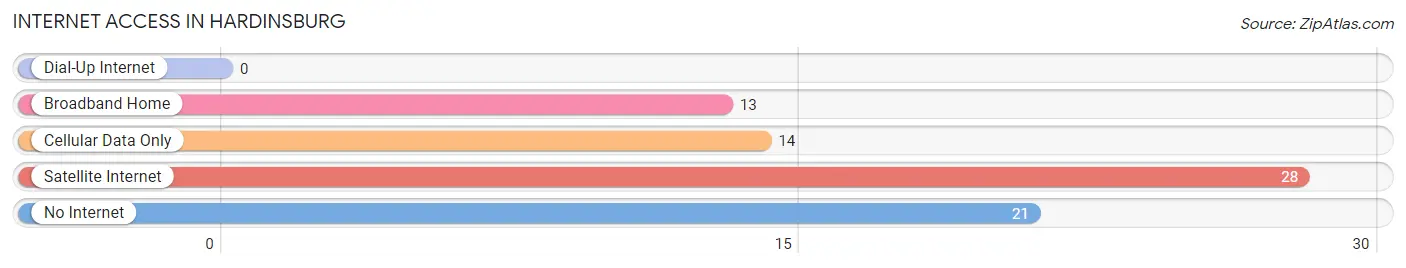
| Internet Type | # Households | % Households |
| Dial-Up Internet | 0 | 0.0% |
| Broadband Home | 13 | 17.1% |
| Cellular Data Only | 14 | 18.4% |
| Satellite Internet | 28 | 36.8% |
| No Internet | 21 | 27.6% |
| Total | 76 | 100.0% |
Hardinsburg Summary
Hardinsburg, Indiana is a small town located in the southwestern corner of the state, in the county of Breckinridge. It is situated on the banks of the Ohio River, and is part of the Louisville metropolitan area. The town has a population of just over 1,000 people, and is known for its rural charm and small-town atmosphere.
History
Hardinsburg was founded in 1818 by William Hardin, a Revolutionary War veteran who had moved to the area from Kentucky. He named the town after himself, and it quickly became a thriving community. The town was incorporated in 1837, and by the mid-1800s it had become a major trading center for the surrounding area.
In the late 1800s, Hardinsburg was a major stop on the Louisville and Nashville Railroad, and the town grew rapidly. The railroad brought new businesses and industries to the area, and the population increased significantly.
In the early 1900s, Hardinsburg was a major center for the coal mining industry. The town was home to several large coal mines, and the population continued to grow. However, the coal industry declined in the mid-1900s, and the town's population began to decline as well.
Geography
Hardinsburg is located in the southwestern corner of Indiana, in Breckinridge County. It is situated on the banks of the Ohio River, and is part of the Louisville metropolitan area. The town is located about 30 miles from Louisville, and is accessible by Interstate 64.
The town is situated in a rural area, and is surrounded by rolling hills and farmland. The climate is humid and subtropical, with hot summers and mild winters.
Economy
The economy of Hardinsburg is largely based on agriculture and tourism. The town is home to several small farms, and the surrounding area is known for its production of corn, soybeans, and other crops.
Tourism is also an important part of the local economy. The town is home to several historic sites, including the Hardinsburg Historic District, which is listed on the National Register of Historic Places. The town also hosts several annual festivals and events, including the Hardinsburg Harvest Festival and the Hardinsburg Music Festival.
Demographics
As of the 2010 census, Hardinsburg had a population of 1,072 people. The racial makeup of the town was 97.2% White, 0.7% African American, 0.3% Native American, 0.2% Asian, 0.1% Pacific Islander, 0.7% from other races, and 0.9% from two or more races. Hispanic or Latino of any race were 1.3% of the population.
The median household income in Hardinsburg was $37,500, and the median family income was $45,000. The per capita income was $19,000. About 11.2% of families and 14.2% of the population were below the poverty line, including 18.2% of those under age 18 and 8.3% of those age 65 or over.
Common Questions
What is Per Capita Income in Hardinsburg?
Per Capita income in Hardinsburg is $13,111.
What is the Median Household income in Hardinsburg?
Median Household Income in Hardinsburg is $31,667.
What is Inequality or Gini Index in Hardinsburg?
Inequality or Gini Index in Hardinsburg is 0.47.
What is the Total Population of Hardinsburg?
Total Population of Hardinsburg is 179.
What is the Total Male Population of Hardinsburg?
Total Male Population of Hardinsburg is 60.
What is the Total Female Population of Hardinsburg?
Total Female Population of Hardinsburg is 119.
What is the Ratio of Males per 100 Females in Hardinsburg?
There are 50.42 Males per 100 Females in Hardinsburg.
What is the Ratio of Females per 100 Males in Hardinsburg?
There are 198.33 Females per 100 Males in Hardinsburg.
What is the Median Population Age in Hardinsburg?
Median Population Age in Hardinsburg is 34.0 Years.
What is the Average Family Size in Hardinsburg
Average Family Size in Hardinsburg is 2.8 People.
What is the Average Household Size in Hardinsburg
Average Household Size in Hardinsburg is 2.4 People.
How Large is the Labor Force in Hardinsburg?
There are 47 People in the Labor Forcein in Hardinsburg.
What is the Percentage of People in the Labor Force in Hardinsburg?
41.2% of People are in the Labor Force in Hardinsburg.