Zip Codes with the Highest Percentage of Population Employed in Architecture & Engineering in Laredo, TX
RELATED REPORTS & OPTIONS
Architecture & Engineering
Laredo
Compare Zip Codes
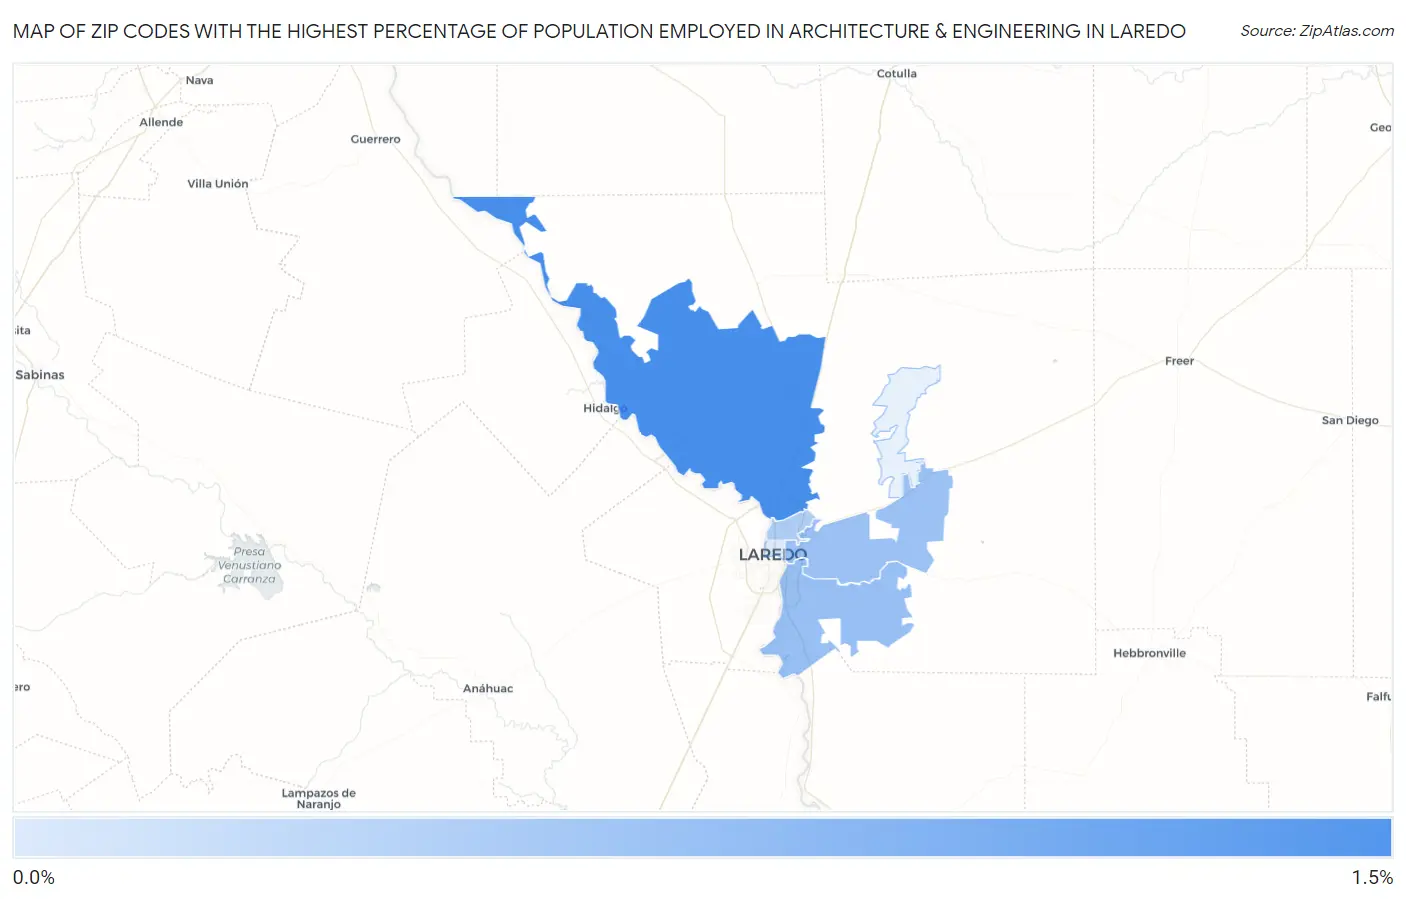
Map of Zip Codes with the Highest Percentage of Population Employed in Architecture & Engineering in Laredo
0.11%
1.4%
Zip Codes with the Highest Percentage of Population Employed in Architecture & Engineering in Laredo, TX
| Zip Code | % Employed | vs State | vs National | |
| 1. | 78045 | 1.4% | 2.2%(-0.790)#729 | 2.1%(-0.717)#13,342 |
| 2. | 78046 | 0.71% | 2.2%(-1.51)#1,024 | 2.1%(-1.44)#18,813 |
| 3. | 78043 | 0.68% | 2.2%(-1.54)#1,045 | 2.1%(-1.47)#19,022 |
| 4. | 78041 | 0.52% | 2.2%(-1.70)#1,117 | 2.1%(-1.63)#20,126 |
| 5. | 78040 | 0.11% | 2.2%(-2.11)#1,283 | 2.1%(-2.04)#22,357 |
1
Common Questions
What are the Top 5 Zip Codes with the Highest Percentage of Population Employed in Architecture & Engineering in Laredo, TX?
Top 5 Zip Codes with the Highest Percentage of Population Employed in Architecture & Engineering in Laredo, TX are:
What zip code has the Highest Percentage of Population Employed in Architecture & Engineering in Laredo, TX?
78045 has the Highest Percentage of Population Employed in Architecture & Engineering in Laredo, TX with 1.4%.
What is the Percentage of Population Employed in Architecture & Engineering in Laredo, TX?
Percentage of Population Employed in Architecture & Engineering in Laredo is 0.81%.
What is the Percentage of Population Employed in Architecture & Engineering in Texas?
Percentage of Population Employed in Architecture & Engineering in Texas is 2.2%.
What is the Percentage of Population Employed in Architecture & Engineering in the United States?
Percentage of Population Employed in Architecture & Engineering in the United States is 2.1%.