Zip Codes with the Highest Percentage of Population Employed in Architecture & Engineering in Weatherford, TX
RELATED REPORTS & OPTIONS
Architecture & Engineering
Weatherford
Compare Zip Codes
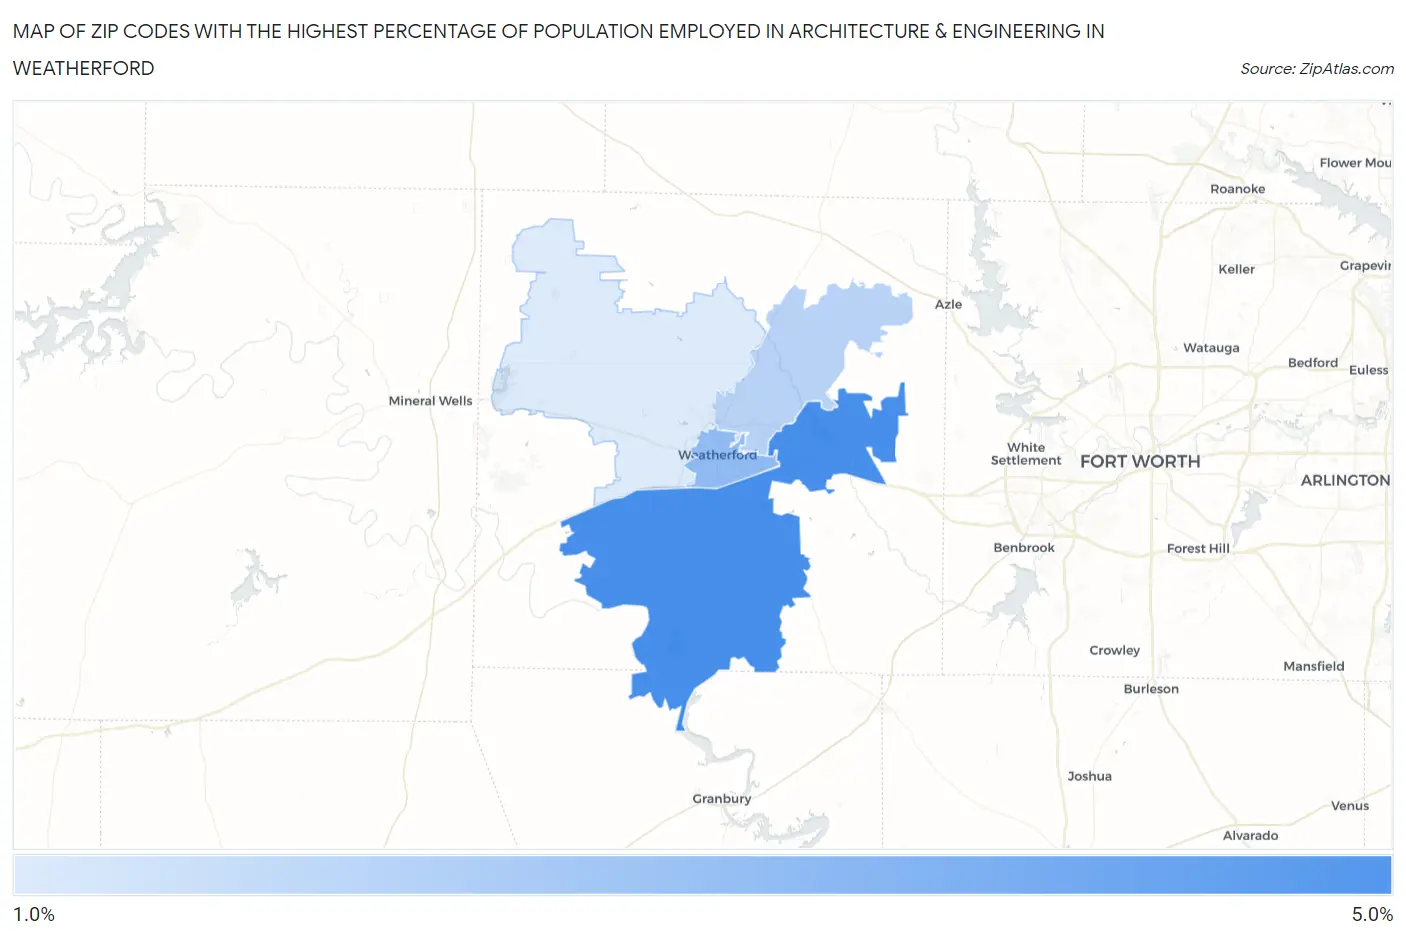
Map of Zip Codes with the Highest Percentage of Population Employed in Architecture & Engineering in Weatherford
1.5%
4.4%
Zip Codes with the Highest Percentage of Population Employed in Architecture & Engineering in Weatherford, TX
| Zip Code | % Employed | vs State | vs National | |
| 1. | 76087 | 4.4% | 2.2%(+2.19)#120 | 2.1%(+2.27)#2,233 |
| 2. | 76086 | 3.0% | 2.2%(+0.764)#302 | 2.1%(+0.837)#5,102 |
| 3. | 76085 | 2.2% | 2.2%(+0.005)#458 | 2.1%(+0.078)#8,329 |
| 4. | 76088 | 1.5% | 2.2%(-0.680)#686 | 2.1%(-0.607)#12,552 |
1
Common Questions
What are the Top 3 Zip Codes with the Highest Percentage of Population Employed in Architecture & Engineering in Weatherford, TX?
Top 3 Zip Codes with the Highest Percentage of Population Employed in Architecture & Engineering in Weatherford, TX are:
What zip code has the Highest Percentage of Population Employed in Architecture & Engineering in Weatherford, TX?
76087 has the Highest Percentage of Population Employed in Architecture & Engineering in Weatherford, TX with 4.4%.
What is the Percentage of Population Employed in Architecture & Engineering in Weatherford, TX?
Percentage of Population Employed in Architecture & Engineering in Weatherford is 4.0%.
What is the Percentage of Population Employed in Architecture & Engineering in Texas?
Percentage of Population Employed in Architecture & Engineering in Texas is 2.2%.
What is the Percentage of Population Employed in Architecture & Engineering in the United States?
Percentage of Population Employed in Architecture & Engineering in the United States is 2.1%.