West University Place, TX Map & Demographics
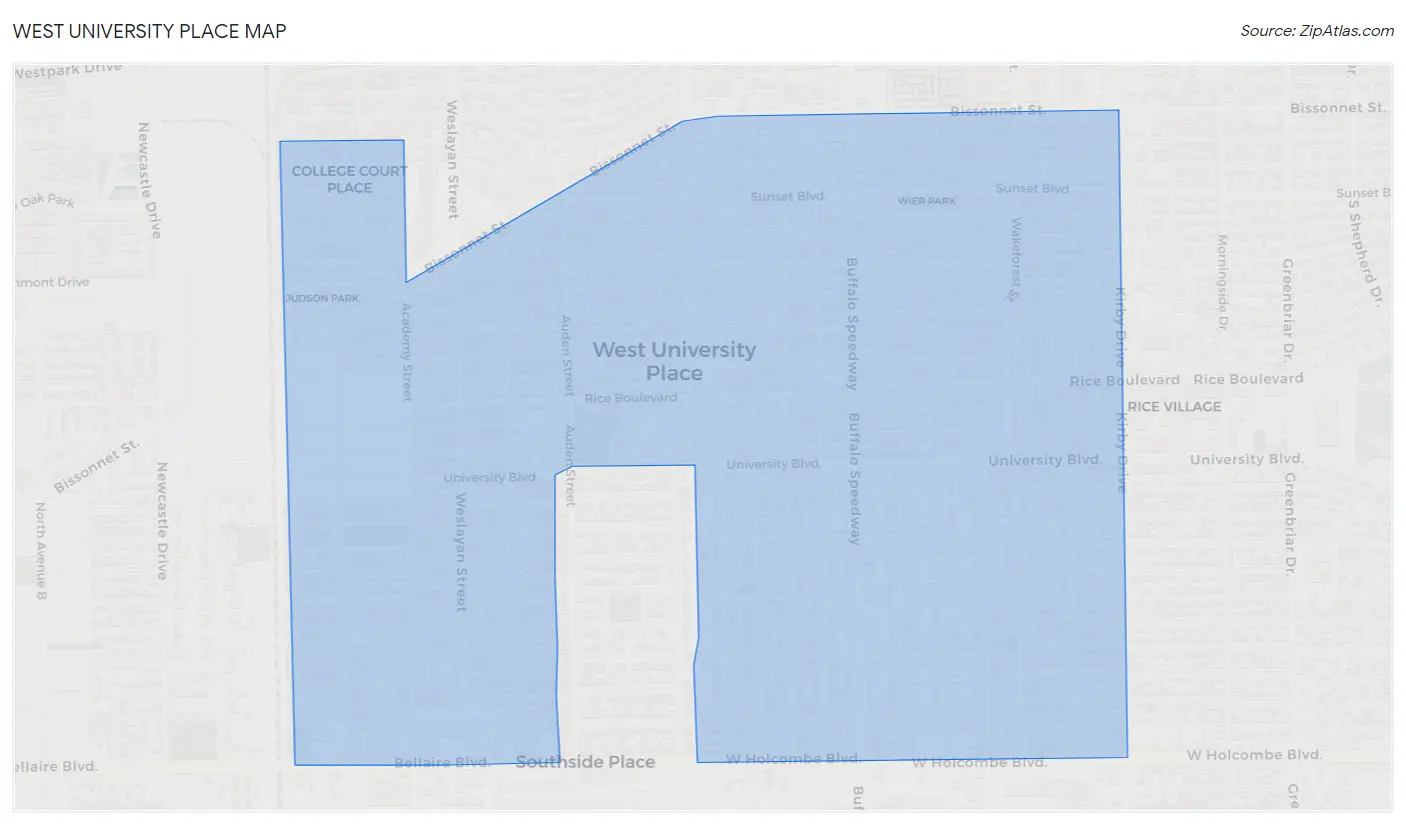
West University Place Map
West University Place Overview
$142,082
PER CAPITA INCOME
$250,001
AVG FAMILY INCOME
$250,001
AVG HOUSEHOLD INCOME
61.5%
WAGE / INCOME GAP [ % ]
38.5¢/ $1
WAGE / INCOME GAP [ $ ]
0.47
INEQUALITY / GINI INDEX
14,963
TOTAL POPULATION
7,618
MALE POPULATION
7,345
FEMALE POPULATION
103.72
MALES / 100 FEMALES
96.42
FEMALES / 100 MALES
41.7
MEDIAN AGE
3.1
AVG FAMILY SIZE
2.9
AVG HOUSEHOLD SIZE
6,800
LABOR FORCE [ PEOPLE ]
62.6%
PERCENT IN LABOR FORCE
5.7%
UNEMPLOYMENT RATE
Income in West University Place
Income Overview in West University Place
Per Capita Income in West University Place is $142,082, while median incomes of families and households are $250,001 and $250,001 respectively.
| Characteristic | Number | Measure |
| Per Capita Income | 14,963 | $142,082 |
| Median Family Income | 4,498 | $250,001 |
| Mean Family Income | 4,498 | $426,956 |
| Median Household Income | 5,245 | $250,001 |
| Mean Household Income | 5,245 | $403,845 |
| Income Deficit | 4,498 | $0 |
| Wage / Income Gap (%) | 14,963 | 61.52% |
| Wage / Income Gap ($) | 14,963 | 38.48¢ per $1 |
| Gini / Inequality Index | 14,963 | 0.47 |
Earnings by Sex in West University Place
Average Earnings in West University Place are $150,000, $220,750 for men and $84,955 for women, a difference of 61.5%.
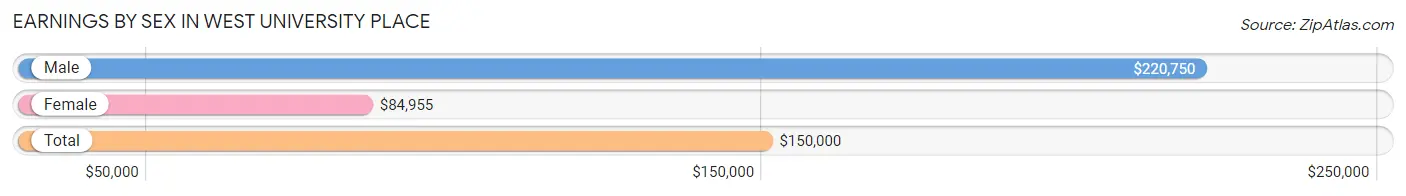
| Sex | Number | Average Earnings |
| Male | 4,246 (60.4%) | $220,750 |
| Female | 2,788 (39.6%) | $84,955 |
| Total | 7,034 (100.0%) | $150,000 |
Earnings by Sex by Income Bracket in West University Place
The most common earnings brackets in West University Place are $100,000+ for men (3,105 | 73.1%) and $100,000+ for women (1,346 | 48.3%).
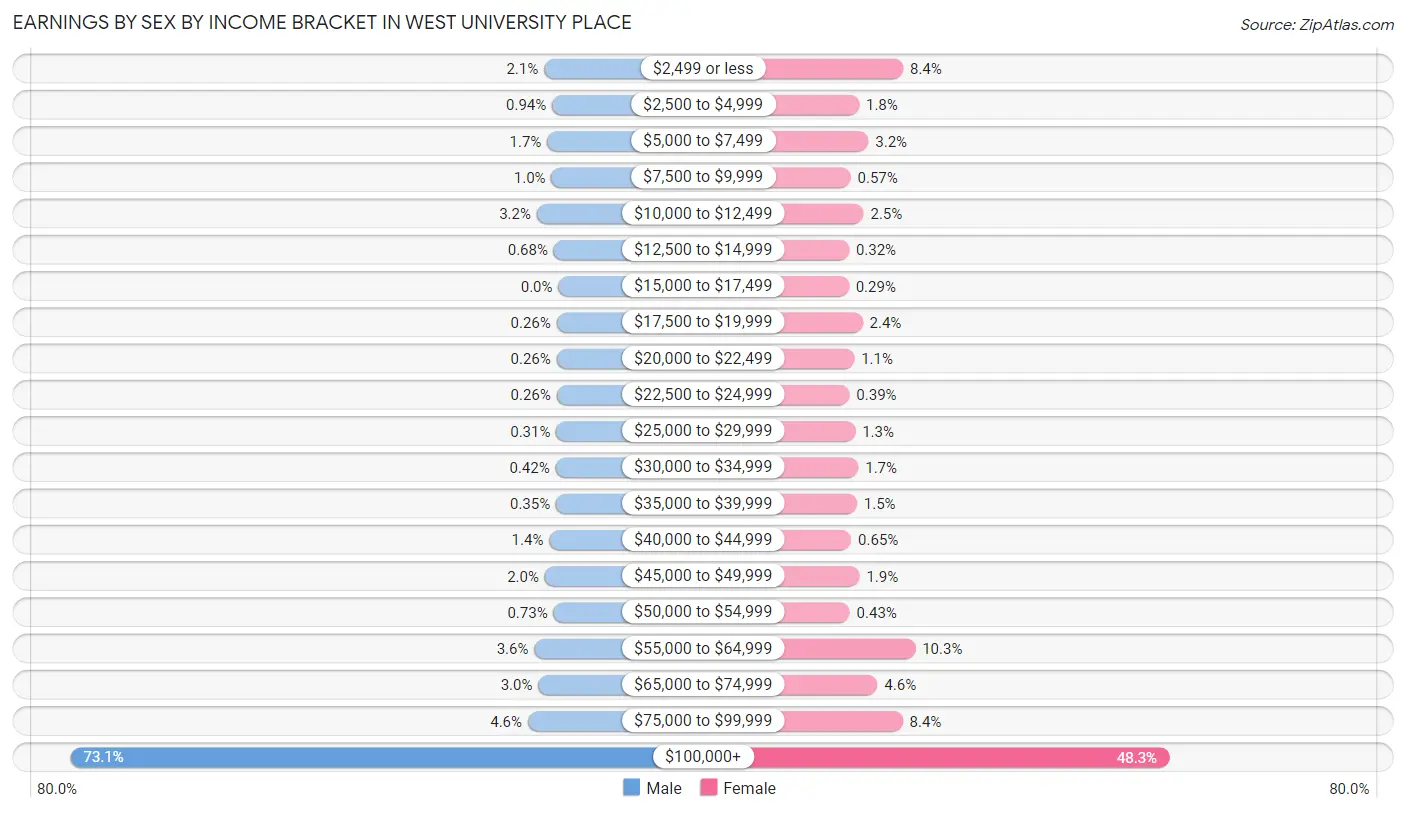
| Income | Male | Female |
| $2,499 or less | 91 (2.1%) | 235 (8.4%) |
| $2,500 to $4,999 | 40 (0.9%) | 51 (1.8%) |
| $5,000 to $7,499 | 71 (1.7%) | 90 (3.2%) |
| $7,500 to $9,999 | 44 (1.0%) | 16 (0.6%) |
| $10,000 to $12,499 | 137 (3.2%) | 70 (2.5%) |
| $12,500 to $14,999 | 29 (0.7%) | 9 (0.3%) |
| $15,000 to $17,499 | 0 (0.0%) | 8 (0.3%) |
| $17,500 to $19,999 | 11 (0.3%) | 66 (2.4%) |
| $20,000 to $22,499 | 11 (0.3%) | 31 (1.1%) |
| $22,500 to $24,999 | 11 (0.3%) | 11 (0.4%) |
| $25,000 to $29,999 | 13 (0.3%) | 35 (1.3%) |
| $30,000 to $34,999 | 18 (0.4%) | 48 (1.7%) |
| $35,000 to $39,999 | 15 (0.4%) | 42 (1.5%) |
| $40,000 to $44,999 | 58 (1.4%) | 18 (0.6%) |
| $45,000 to $49,999 | 86 (2.0%) | 53 (1.9%) |
| $50,000 to $54,999 | 31 (0.7%) | 12 (0.4%) |
| $55,000 to $64,999 | 153 (3.6%) | 286 (10.3%) |
| $65,000 to $74,999 | 128 (3.0%) | 128 (4.6%) |
| $75,000 to $99,999 | 194 (4.6%) | 233 (8.4%) |
| $100,000+ | 3,105 (73.1%) | 1,346 (48.3%) |
| Total | 4,246 (100.0%) | 2,788 (100.0%) |
Earnings by Sex by Educational Attainment in West University Place
Average earnings in West University Place are $227,862 for men and $103,767 for women, a difference of 54.5%. Men with an educational attainment of graduate degree enjoy the highest average annual earnings of $250,001, while those with high school diploma education earn the least with $48,750. Women with an educational attainment of graduate degree earn the most with the average annual earnings of $135,987, while those with college or associate's degree education have the smallest earnings of $38,056.
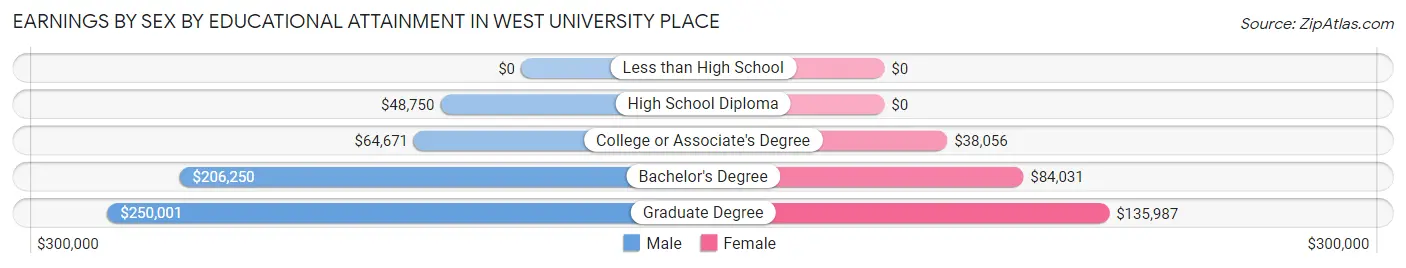
| Educational Attainment | Male Income | Female Income |
| Less than High School | - | - |
| High School Diploma | $48,750 | $0 |
| College or Associate's Degree | $64,671 | $38,056 |
| Bachelor's Degree | $206,250 | $84,031 |
| Graduate Degree | $250,001 | $135,987 |
| Total | $227,862 | $103,767 |
Family Income in West University Place
Family Income Brackets in West University Place
According to the West University Place family income data, there are 3,167 families falling into the $200,000+ income range, which is the most common income bracket and makes up 70.4% of all families. Conversely, the less than $10,000 income bracket is the least frequent group with only 27 families (0.6%) belonging to this category.
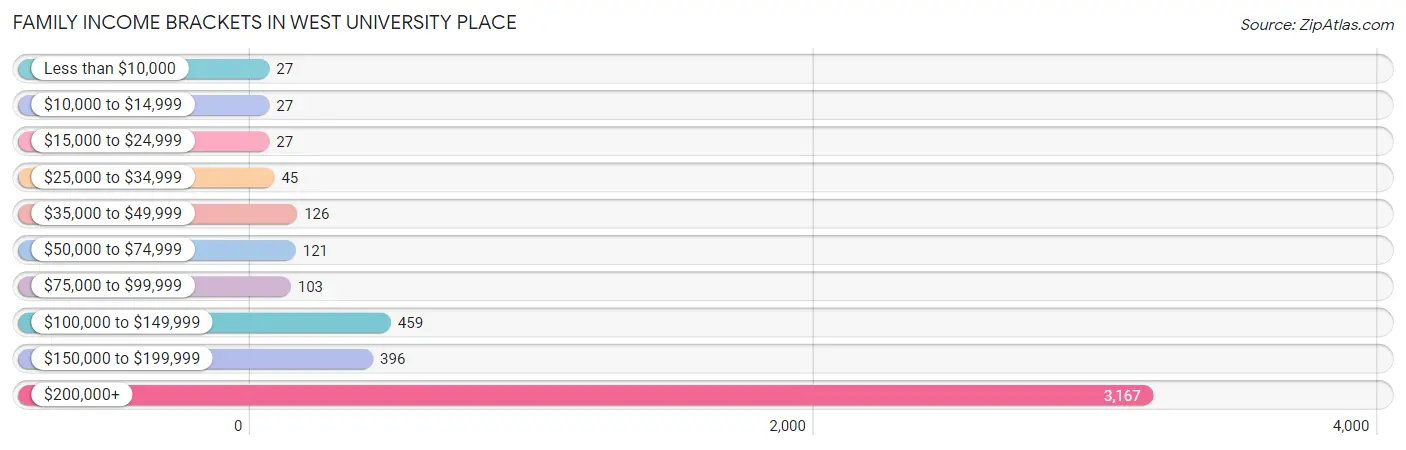
| Income Bracket | # Families | % Families |
| Less than $10,000 | 27 | 0.6% |
| $10,000 to $14,999 | 27 | 0.6% |
| $15,000 to $24,999 | 27 | 0.6% |
| $25,000 to $34,999 | 45 | 1.0% |
| $35,000 to $49,999 | 126 | 2.8% |
| $50,000 to $74,999 | 121 | 2.7% |
| $75,000 to $99,999 | 103 | 2.3% |
| $100,000 to $149,999 | 459 | 10.2% |
| $150,000 to $199,999 | 396 | 8.8% |
| $200,000+ | 3,167 | 70.4% |
Family Income by Famaliy Size in West University Place
3-person families (728 | 16.2%) account for the highest median family income in West University Place with $250,001 per family, while 2-person families (2,055 | 45.7%) have the highest median income of $117,400 per family member.
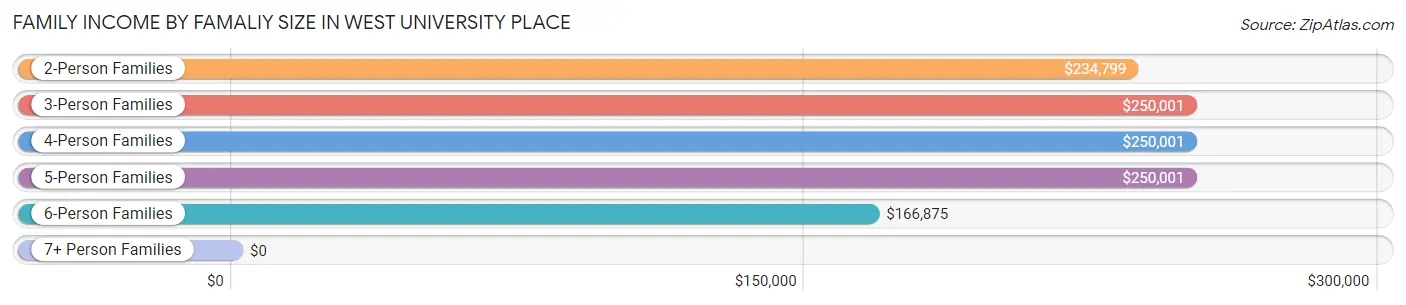
| Income Bracket | # Families | Median Income |
| 2-Person Families | 2,055 (45.7%) | $234,799 |
| 3-Person Families | 728 (16.2%) | $250,001 |
| 4-Person Families | 1,129 (25.1%) | $250,001 |
| 5-Person Families | 450 (10.0%) | $250,001 |
| 6-Person Families | 136 (3.0%) | $166,875 |
| 7+ Person Families | 0 (0.0%) | $0 |
| Total | 4,498 (100.0%) | $250,001 |
Family Income by Number of Earners in West University Place
The median family income in West University Place is $250,001, with families comprising 1 earner (1,493) having the highest median family income of $250,001, while families with no earners (560) have the lowest median family income of $153,750, accounting for 33.2% and 12.4% of families, respectively.
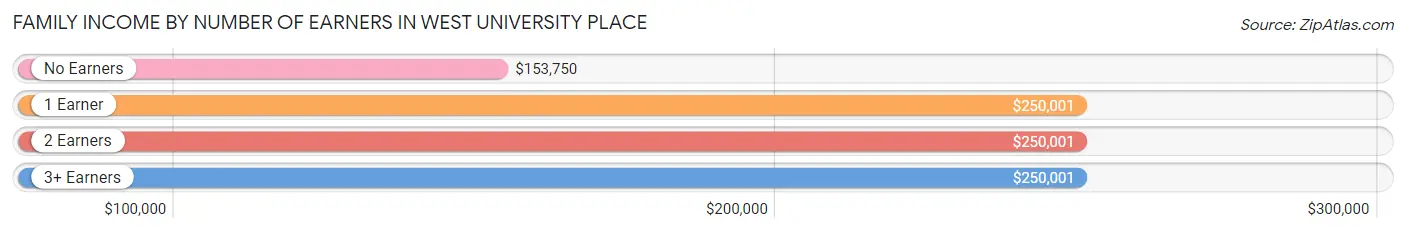
| Number of Earners | # Families | Median Income |
| No Earners | 560 (12.4%) | $153,750 |
| 1 Earner | 1,493 (33.2%) | $250,001 |
| 2 Earners | 2,328 (51.8%) | $250,001 |
| 3+ Earners | 117 (2.6%) | $250,001 |
| Total | 4,498 (100.0%) | $250,001 |
Household Income in West University Place
Household Income Brackets in West University Place
With 3,414 households falling in the category, the $200,000+ income range is the most frequent in West University Place, accounting for 65.1% of all households. In contrast, only 26 households (0.5%) fall into the $10,000 to $14,999 income bracket, making it the least populous group.
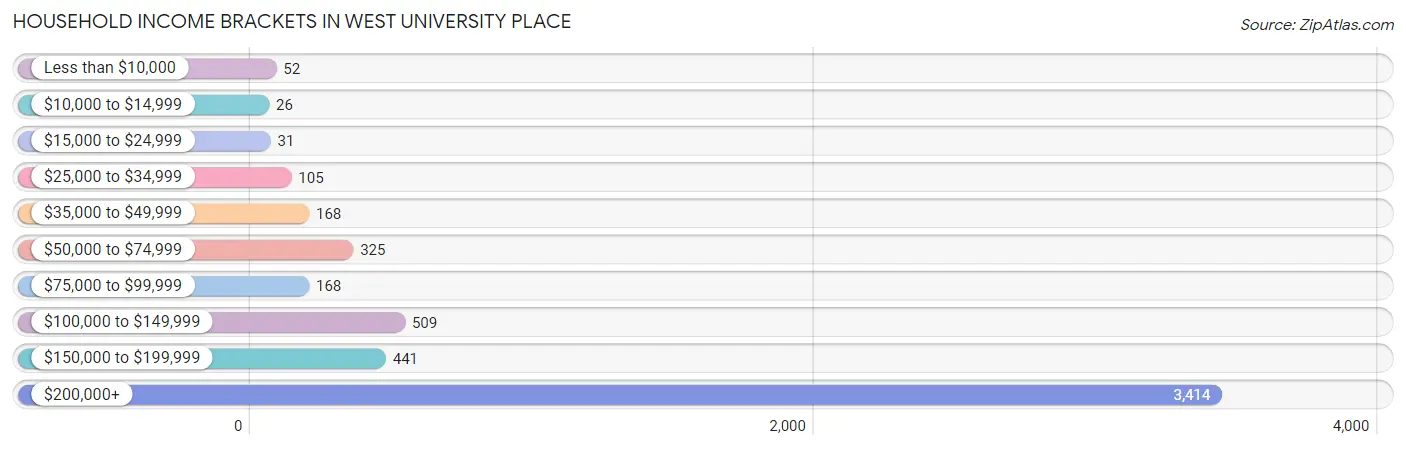
| Income Bracket | # Households | % Households |
| Less than $10,000 | 52 | 1.0% |
| $10,000 to $14,999 | 26 | 0.5% |
| $15,000 to $24,999 | 31 | 0.6% |
| $25,000 to $34,999 | 105 | 2.0% |
| $35,000 to $49,999 | 168 | 3.2% |
| $50,000 to $74,999 | 325 | 6.2% |
| $75,000 to $99,999 | 168 | 3.2% |
| $100,000 to $149,999 | 509 | 9.7% |
| $150,000 to $199,999 | 441 | 8.4% |
| $200,000+ | 3,414 | 65.1% |
Household Income by Householder Age in West University Place
The median household income in West University Place is $250,001, with the highest median household income of $250,001 found in the 25 to 44 years age bracket for the primary householder. A total of 1,482 households (28.3%) fall into this category. Meanwhile, the 15 to 24 years age bracket for the primary householder has the lowest median household income of $0, with 28 households (0.5%) in this group.
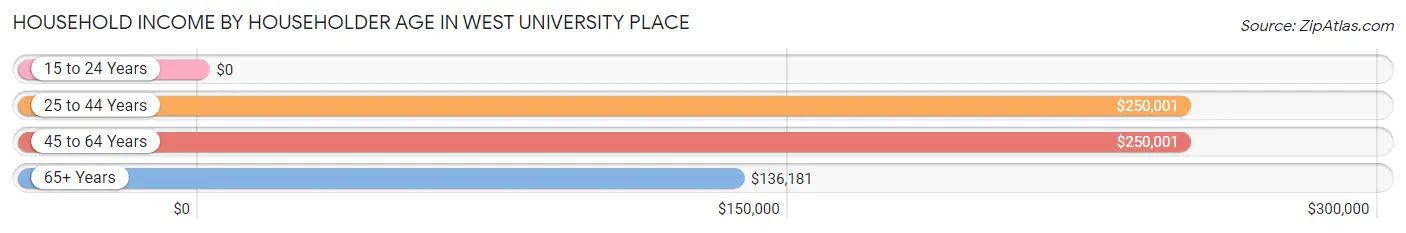
| Income Bracket | # Households | Median Income |
| 15 to 24 Years | 28 (0.5%) | $0 |
| 25 to 44 Years | 1,482 (28.3%) | $250,001 |
| 45 to 64 Years | 2,300 (43.9%) | $250,001 |
| 65+ Years | 1,435 (27.4%) | $136,181 |
| Total | 5,245 (100.0%) | $250,001 |
Poverty in West University Place
Income Below Poverty by Sex and Age in West University Place
With 0.9% poverty level for males and 2.5% for females among the residents of West University Place, 18 to 24 year old males and 16 and 17 year old females are the most vulnerable to poverty, with 28 males (7.9%) and 36 females (15.5%) in their respective age groups living below the poverty level.
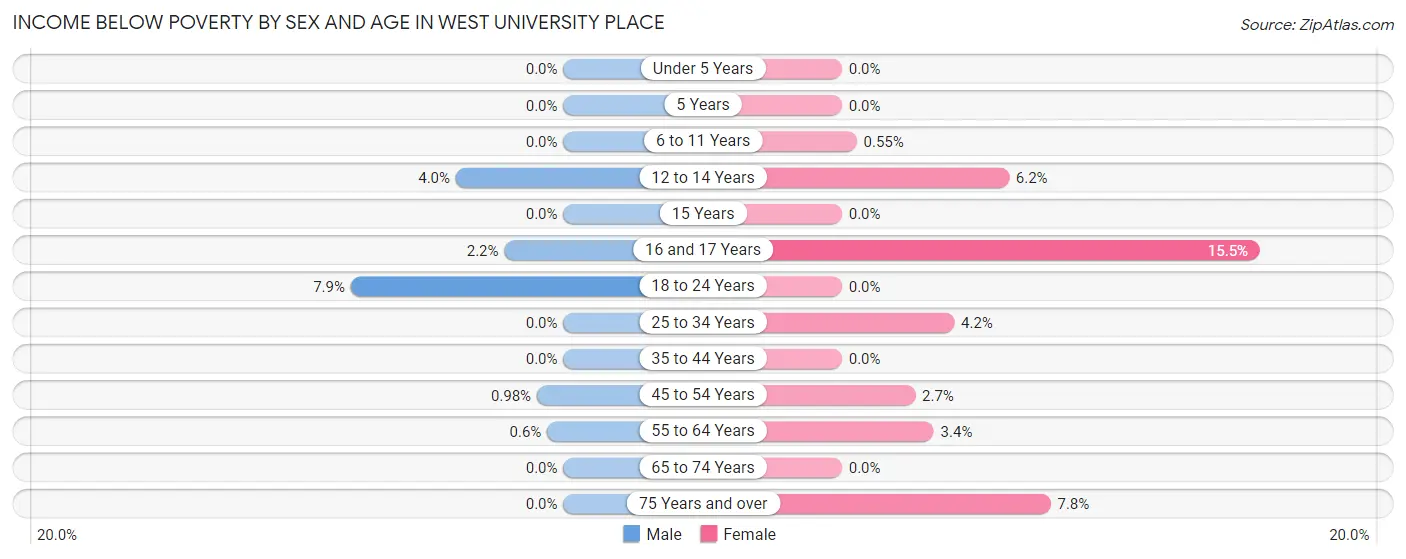
| Age Bracket | Male | Female |
| Under 5 Years | 0 (0.0%) | 0 (0.0%) |
| 5 Years | 0 (0.0%) | 0 (0.0%) |
| 6 to 11 Years | 0 (0.0%) | 5 (0.5%) |
| 12 to 14 Years | 13 (4.0%) | 30 (6.2%) |
| 15 Years | 0 (0.0%) | 0 (0.0%) |
| 16 and 17 Years | 8 (2.2%) | 36 (15.5%) |
| 18 to 24 Years | 28 (7.9%) | 0 (0.0%) |
| 25 to 34 Years | 0 (0.0%) | 16 (4.2%) |
| 35 to 44 Years | 0 (0.0%) | 0 (0.0%) |
| 45 to 54 Years | 12 (1.0%) | 29 (2.7%) |
| 55 to 64 Years | 7 (0.6%) | 33 (3.4%) |
| 65 to 74 Years | 0 (0.0%) | 0 (0.0%) |
| 75 Years and over | 0 (0.0%) | 33 (7.7%) |
| Total | 68 (0.9%) | 182 (2.5%) |
Income Above Poverty by Sex and Age in West University Place
According to the poverty statistics in West University Place, males aged under 5 years and females aged under 5 years are the age groups that are most secure financially, with 100.0% of males and 100.0% of females in these age groups living above the poverty line.
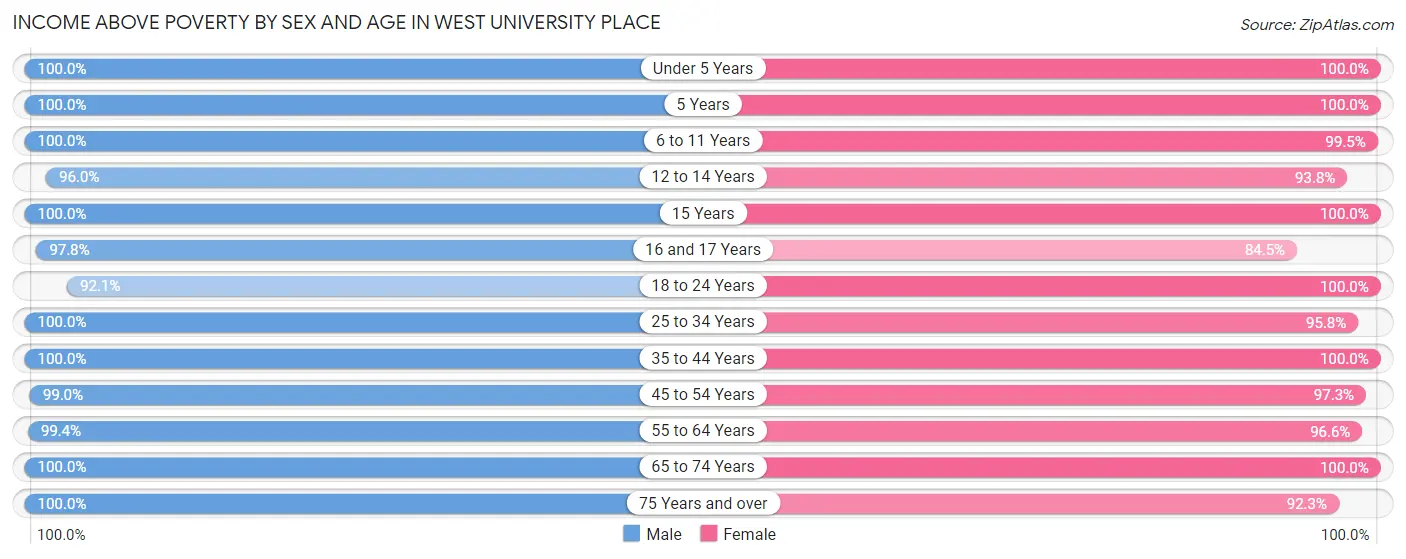
| Age Bracket | Male | Female |
| Under 5 Years | 540 (100.0%) | 610 (100.0%) |
| 5 Years | 121 (100.0%) | 108 (100.0%) |
| 6 to 11 Years | 686 (100.0%) | 910 (99.5%) |
| 12 to 14 Years | 313 (96.0%) | 454 (93.8%) |
| 15 Years | 218 (100.0%) | 92 (100.0%) |
| 16 and 17 Years | 357 (97.8%) | 196 (84.5%) |
| 18 to 24 Years | 327 (92.1%) | 78 (100.0%) |
| 25 to 34 Years | 373 (100.0%) | 368 (95.8%) |
| 35 to 44 Years | 1,101 (100.0%) | 1,187 (100.0%) |
| 45 to 54 Years | 1,218 (99.0%) | 1,038 (97.3%) |
| 55 to 64 Years | 1,151 (99.4%) | 936 (96.6%) |
| 65 to 74 Years | 684 (100.0%) | 793 (100.0%) |
| 75 Years and over | 461 (100.0%) | 393 (92.2%) |
| Total | 7,550 (99.1%) | 7,163 (97.5%) |
Income Below Poverty Among Married-Couple Families in West University Place
The poverty statistics for married-couple families in West University Place show that 0.8% or 35 of the total 4,155 families live below the poverty line. Families with no children have the highest poverty rate of 1.4%, comprising of 28 families. On the other hand, families with 3 or 4 children have the lowest poverty rate of 0.0%, which includes 0 families.
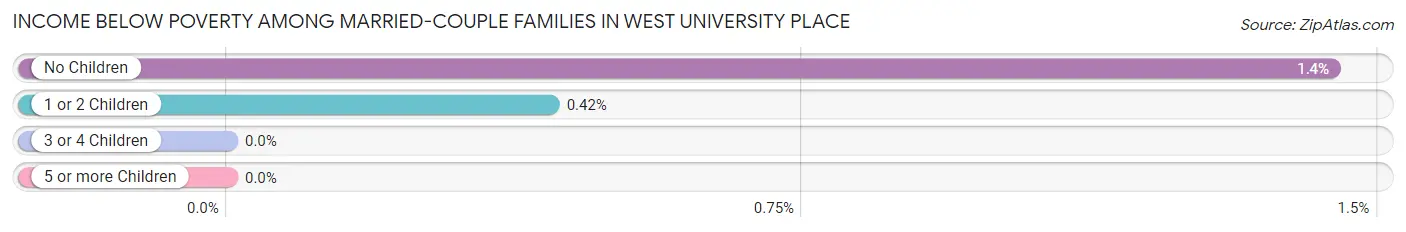
| Children | Above Poverty | Below Poverty |
| No Children | 1,914 (98.6%) | 28 (1.4%) |
| 1 or 2 Children | 1,657 (99.6%) | 7 (0.4%) |
| 3 or 4 Children | 549 (100.0%) | 0 (0.0%) |
| 5 or more Children | 0 (0.0%) | 0 (0.0%) |
| Total | 4,120 (99.2%) | 35 (0.8%) |
Income Below Poverty Among Single-Parent Households in West University Place
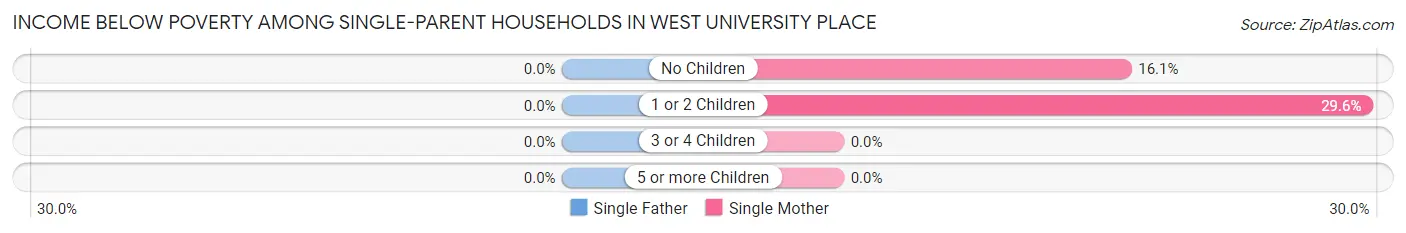
| Children | Single Father | Single Mother |
| No Children | 0 (0.0%) | 18 (16.1%) |
| 1 or 2 Children | 0 (0.0%) | 29 (29.6%) |
| 3 or 4 Children | 0 (0.0%) | 0 (0.0%) |
| 5 or more Children | 0 (0.0%) | 0 (0.0%) |
| Total | 0 (0.0%) | 47 (22.4%) |
Income Below Poverty Among Married-Couple vs Single-Parent Households in West University Place
The poverty data for West University Place shows that 35 of the married-couple family households (0.8%) and 47 of the single-parent households (13.7%) are living below the poverty level. Within the married-couple family households, those with no children have the highest poverty rate, with 28 households (1.4%) falling below the poverty line. Among the single-parent households, those with 1 or 2 children have the highest poverty rate, with 29 household (25.2%) living below poverty.
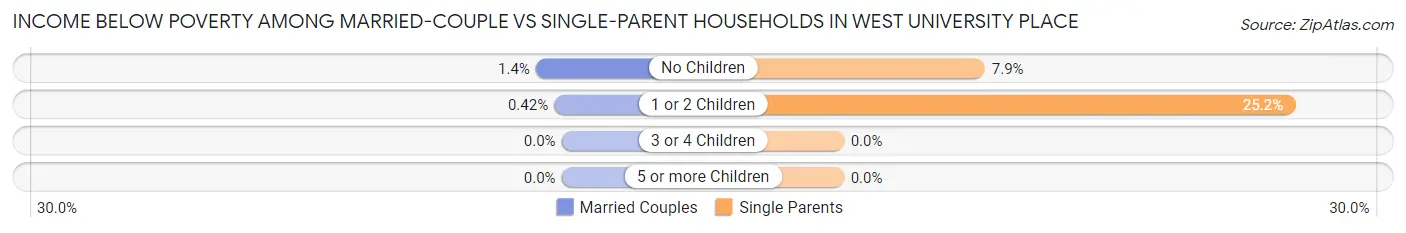
| Children | Married-Couple Families | Single-Parent Households |
| No Children | 28 (1.4%) | 18 (7.9%) |
| 1 or 2 Children | 7 (0.4%) | 29 (25.2%) |
| 3 or 4 Children | 0 (0.0%) | 0 (0.0%) |
| 5 or more Children | 0 (0.0%) | 0 (0.0%) |
| Total | 35 (0.8%) | 47 (13.7%) |
Race in West University Place
The most populous races in West University Place are White / Caucasian (11,493 | 76.8%), Asian (1,644 | 11.0%), and Two or more Races (1,554 | 10.4%).
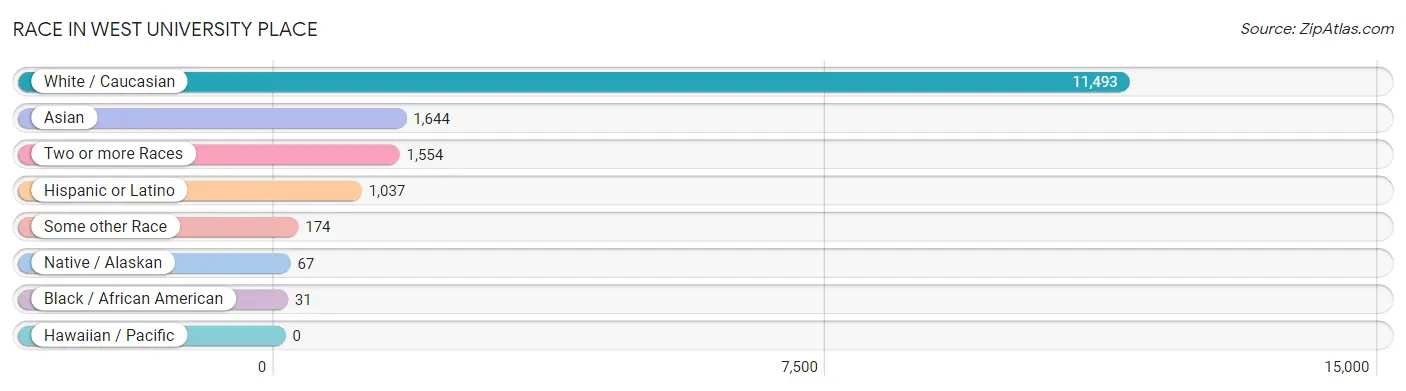
| Race | # Population | % Population |
| Asian | 1,644 | 11.0% |
| Black / African American | 31 | 0.2% |
| Hawaiian / Pacific | 0 | 0.0% |
| Hispanic or Latino | 1,037 | 6.9% |
| Native / Alaskan | 67 | 0.4% |
| White / Caucasian | 11,493 | 76.8% |
| Two or more Races | 1,554 | 10.4% |
| Some other Race | 174 | 1.2% |
| Total | 14,963 | 100.0% |
Ancestry in West University Place
The most populous ancestries reported in West University Place are English (2,340 | 15.6%), German (2,267 | 15.1%), Irish (1,377 | 9.2%), Indian (Asian) (938 | 6.3%), and American (696 | 4.6%), together accounting for 50.9% of all West University Place residents.
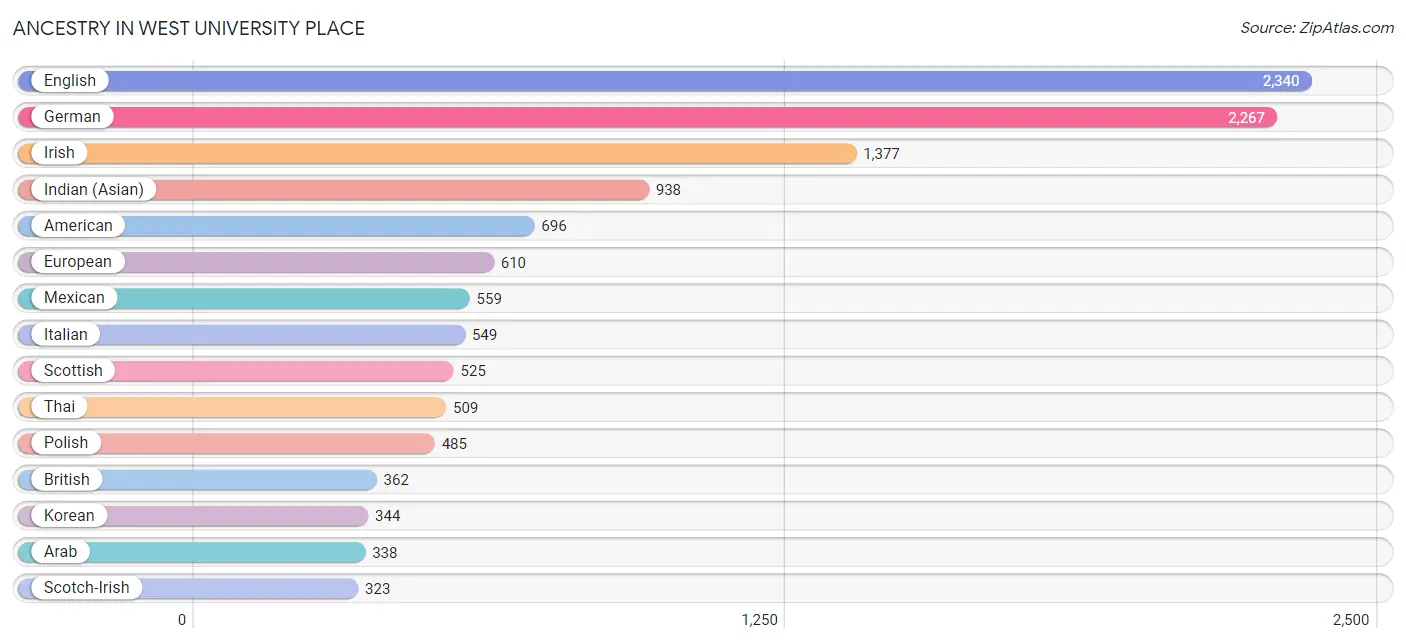
| Ancestry | # Population | % Population |
| African | 13 | 0.1% |
| Alsatian | 8 | 0.1% |
| American | 696 | 4.6% |
| Arab | 338 | 2.3% |
| Argentinean | 60 | 0.4% |
| Armenian | 5 | 0.0% |
| Australian | 104 | 0.7% |
| Austrian | 135 | 0.9% |
| Belgian | 12 | 0.1% |
| Bhutanese | 47 | 0.3% |
| Brazilian | 43 | 0.3% |
| British | 362 | 2.4% |
| Burmese | 78 | 0.5% |
| Canadian | 177 | 1.2% |
| Central American | 130 | 0.9% |
| Cherokee | 13 | 0.1% |
| Chilean | 15 | 0.1% |
| Choctaw | 54 | 0.4% |
| Colombian | 57 | 0.4% |
| Creek | 62 | 0.4% |
| Croatian | 18 | 0.1% |
| Cuban | 50 | 0.3% |
| Czech | 127 | 0.9% |
| Czechoslovakian | 11 | 0.1% |
| Danish | 10 | 0.1% |
| Dutch | 98 | 0.6% |
| Eastern European | 155 | 1.0% |
| Egyptian | 11 | 0.1% |
| English | 2,340 | 15.6% |
| European | 610 | 4.1% |
| Filipino | 71 | 0.5% |
| Finnish | 14 | 0.1% |
| French | 313 | 2.1% |
| French Canadian | 24 | 0.2% |
| German | 2,267 | 15.1% |
| Greek | 102 | 0.7% |
| Guatemalan | 53 | 0.4% |
| Honduran | 9 | 0.1% |
| Hungarian | 59 | 0.4% |
| Indian (Asian) | 938 | 6.3% |
| Iranian | 121 | 0.8% |
| Iraqi | 95 | 0.6% |
| Irish | 1,377 | 9.2% |
| Italian | 549 | 3.7% |
| Jamaican | 23 | 0.2% |
| Korean | 344 | 2.3% |
| Laotian | 45 | 0.3% |
| Lebanese | 30 | 0.2% |
| Lithuanian | 54 | 0.4% |
| Mexican | 559 | 3.7% |
| Mexican American Indian | 67 | 0.4% |
| Nicaraguan | 10 | 0.1% |
| Northern European | 26 | 0.2% |
| Norwegian | 76 | 0.5% |
| Panamanian | 58 | 0.4% |
| Polish | 485 | 3.2% |
| Portuguese | 19 | 0.1% |
| Puerto Rican | 20 | 0.1% |
| Romanian | 30 | 0.2% |
| Russian | 104 | 0.7% |
| Scotch-Irish | 323 | 2.2% |
| Scottish | 525 | 3.5% |
| Slovak | 10 | 0.1% |
| Slovene | 16 | 0.1% |
| South American | 150 | 1.0% |
| Soviet Union | 12 | 0.1% |
| Spaniard | 19 | 0.1% |
| Sri Lankan | 126 | 0.8% |
| Subsaharan African | 13 | 0.1% |
| Swedish | 165 | 1.1% |
| Swiss | 51 | 0.3% |
| Thai | 509 | 3.4% |
| Turkish | 11 | 0.1% |
| Ukrainian | 217 | 1.5% |
| Venezuelan | 18 | 0.1% |
| Welsh | 70 | 0.5% | View All 76 Rows |
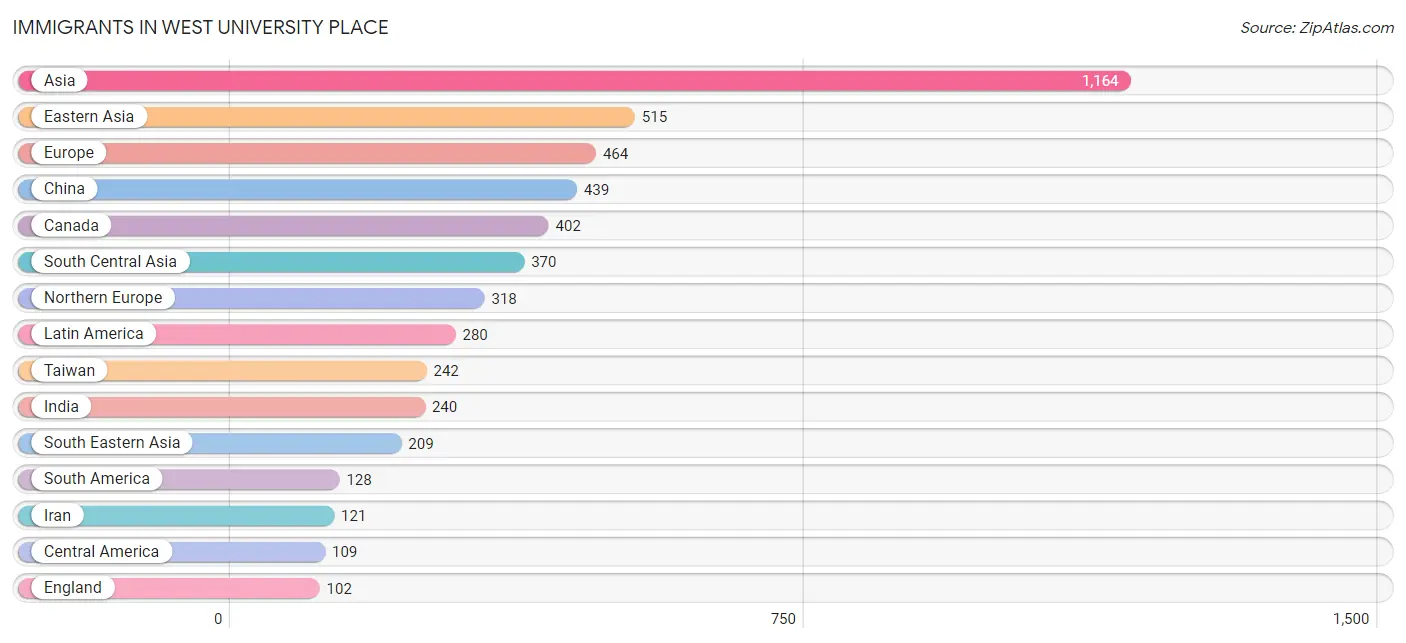
Immigrants in West University Place
The most numerous immigrant groups reported in West University Place came from Asia (1,164 | 7.8%), Eastern Asia (515 | 3.4%), Europe (464 | 3.1%), China (439 | 2.9%), and Canada (402 | 2.7%), together accounting for 19.9% of all West University Place residents.
| Immigration Origin | # Population | % Population |
| Africa | 85 | 0.6% |
| Argentina | 32 | 0.2% |
| Asia | 1,164 | 7.8% |
| Australia | 49 | 0.3% |
| Brazil | 43 | 0.3% |
| Canada | 402 | 2.7% |
| Caribbean | 43 | 0.3% |
| Central America | 109 | 0.7% |
| Chile | 15 | 0.1% |
| China | 439 | 2.9% |
| Colombia | 20 | 0.1% |
| Costa Rica | 12 | 0.1% |
| Cuba | 20 | 0.1% |
| Czechoslovakia | 9 | 0.1% |
| Eastern Africa | 18 | 0.1% |
| Eastern Asia | 515 | 3.4% |
| Eastern Europe | 21 | 0.1% |
| England | 102 | 0.7% |
| Europe | 464 | 3.1% |
| France | 29 | 0.2% |
| Germany | 59 | 0.4% |
| India | 240 | 1.6% |
| Indonesia | 45 | 0.3% |
| Iran | 121 | 0.8% |
| Iraq | 9 | 0.1% |
| Ireland | 49 | 0.3% |
| Italy | 37 | 0.3% |
| Jamaica | 23 | 0.2% |
| Japan | 31 | 0.2% |
| Korea | 45 | 0.3% |
| Kuwait | 7 | 0.1% |
| Latin America | 280 | 1.9% |
| Lebanon | 39 | 0.3% |
| Malaysia | 39 | 0.3% |
| Mexico | 49 | 0.3% |
| Nicaragua | 19 | 0.1% |
| Northern Africa | 39 | 0.3% |
| Northern Europe | 318 | 2.1% |
| Oceania | 61 | 0.4% |
| Pakistan | 9 | 0.1% |
| Panama | 29 | 0.2% |
| Philippines | 62 | 0.4% |
| Scotland | 19 | 0.1% |
| Senegal | 13 | 0.1% |
| South Africa | 15 | 0.1% |
| South America | 128 | 0.9% |
| South Central Asia | 370 | 2.5% |
| South Eastern Asia | 209 | 1.4% |
| Southern Europe | 37 | 0.3% |
| Sweden | 27 | 0.2% |
| Taiwan | 242 | 1.6% |
| Turkey | 15 | 0.1% |
| Ukraine | 12 | 0.1% |
| Venezuela | 18 | 0.1% |
| Vietnam | 40 | 0.3% |
| Western Africa | 13 | 0.1% |
| Western Asia | 70 | 0.5% |
| Western Europe | 88 | 0.6% | View All 58 Rows |
Sex and Age in West University Place
Sex and Age in West University Place
The most populous age groups in West University Place are 15 to 19 Years (824 | 10.8%) for men and 10 to 14 Years (795 | 10.8%) for women.
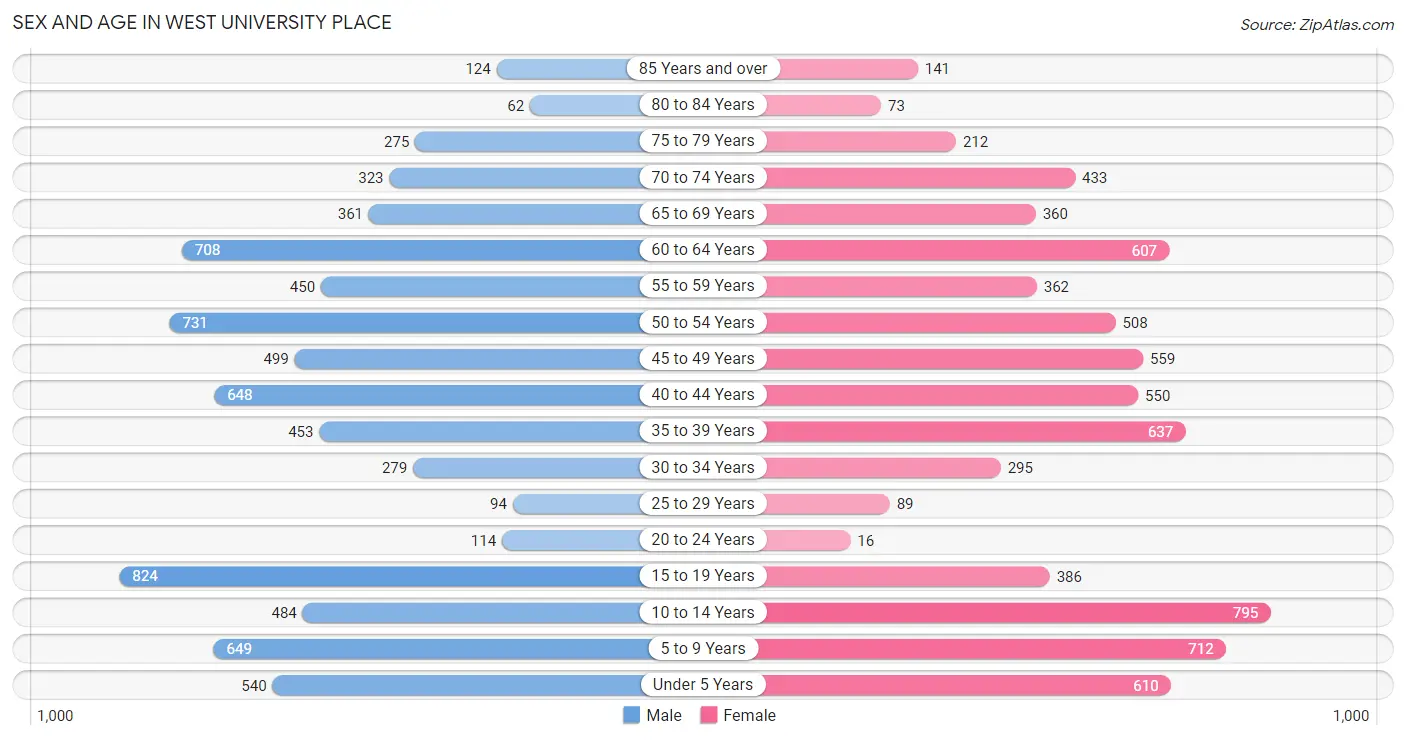
| Age Bracket | Male | Female |
| Under 5 Years | 540 (7.1%) | 610 (8.3%) |
| 5 to 9 Years | 649 (8.5%) | 712 (9.7%) |
| 10 to 14 Years | 484 (6.4%) | 795 (10.8%) |
| 15 to 19 Years | 824 (10.8%) | 386 (5.3%) |
| 20 to 24 Years | 114 (1.5%) | 16 (0.2%) |
| 25 to 29 Years | 94 (1.2%) | 89 (1.2%) |
| 30 to 34 Years | 279 (3.7%) | 295 (4.0%) |
| 35 to 39 Years | 453 (5.9%) | 637 (8.7%) |
| 40 to 44 Years | 648 (8.5%) | 550 (7.5%) |
| 45 to 49 Years | 499 (6.6%) | 559 (7.6%) |
| 50 to 54 Years | 731 (9.6%) | 508 (6.9%) |
| 55 to 59 Years | 450 (5.9%) | 362 (4.9%) |
| 60 to 64 Years | 708 (9.3%) | 607 (8.3%) |
| 65 to 69 Years | 361 (4.7%) | 360 (4.9%) |
| 70 to 74 Years | 323 (4.2%) | 433 (5.9%) |
| 75 to 79 Years | 275 (3.6%) | 212 (2.9%) |
| 80 to 84 Years | 62 (0.8%) | 73 (1.0%) |
| 85 Years and over | 124 (1.6%) | 141 (1.9%) |
| Total | 7,618 (100.0%) | 7,345 (100.0%) |
Families and Households in West University Place
Median Family Size in West University Place
The median family size in West University Place is 3.13 persons per family, with married-couple families (4,155 | 92.4%) accounting for the largest median family size of 3.18 persons per family. On the other hand, single male/father families (133 | 3.0%) represent the smallest median family size with 2.15 persons per family.
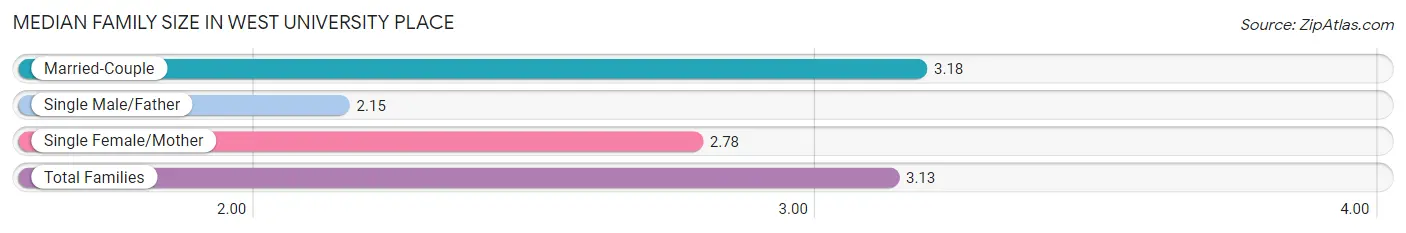
| Family Type | # Families | Family Size |
| Married-Couple | 4,155 (92.4%) | 3.18 |
| Single Male/Father | 133 (3.0%) | 2.15 |
| Single Female/Mother | 210 (4.7%) | 2.78 |
| Total Families | 4,498 (100.0%) | 3.13 |
Median Household Size in West University Place
The median household size in West University Place is 2.85 persons per household, with married-couple households (4,155 | 79.2%) accounting for the largest median household size of 3.19 persons per household. non-family households (747 | 14.2%) represent the smallest median household size with 1.10 persons per household.
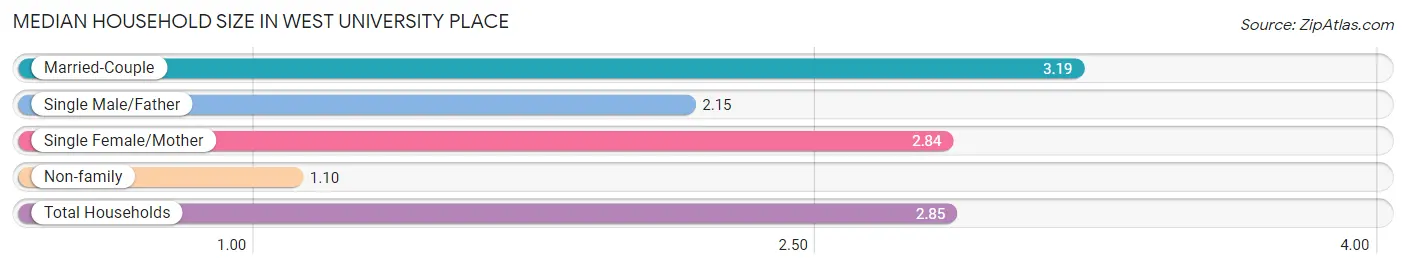
| Household Type | # Households | Household Size |
| Married-Couple | 4,155 (79.2%) | 3.19 |
| Single Male/Father | 133 (2.5%) | 2.15 |
| Single Female/Mother | 210 (4.0%) | 2.84 |
| Non-family | 747 (14.2%) | 1.10 |
| Total Households | 5,245 (100.0%) | 2.85 |
Household Size by Marriage Status in West University Place
Out of a total of 5,245 households in West University Place, 4,498 (85.8%) are family households, while 747 (14.2%) are nonfamily households. The most numerous type of family households are 2-person households, comprising 2,055, and the most common type of nonfamily households are 1-person households, comprising 664.
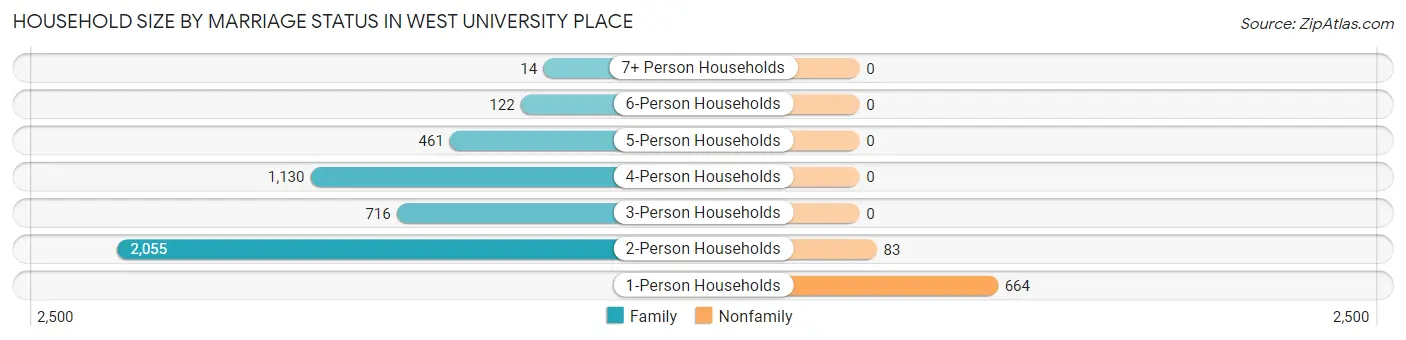
| Household Size | Family Households | Nonfamily Households |
| 1-Person Households | - | 664 (12.7%) |
| 2-Person Households | 2,055 (39.2%) | 83 (1.6%) |
| 3-Person Households | 716 (13.7%) | 0 (0.0%) |
| 4-Person Households | 1,130 (21.5%) | 0 (0.0%) |
| 5-Person Households | 461 (8.8%) | 0 (0.0%) |
| 6-Person Households | 122 (2.3%) | 0 (0.0%) |
| 7+ Person Households | 14 (0.3%) | 0 (0.0%) |
| Total | 4,498 (85.8%) | 747 (14.2%) |
Female Fertility in West University Place
Fertility by Age in West University Place
Average fertility rate in West University Place is 37.0 births per 1,000 women. Women in the age bracket of 15 to 19 years have the highest fertility rate with 62.0 births per 1,000 women. Women in the age bracket of 35 to 50 years acount for 64.3% of all women with births.
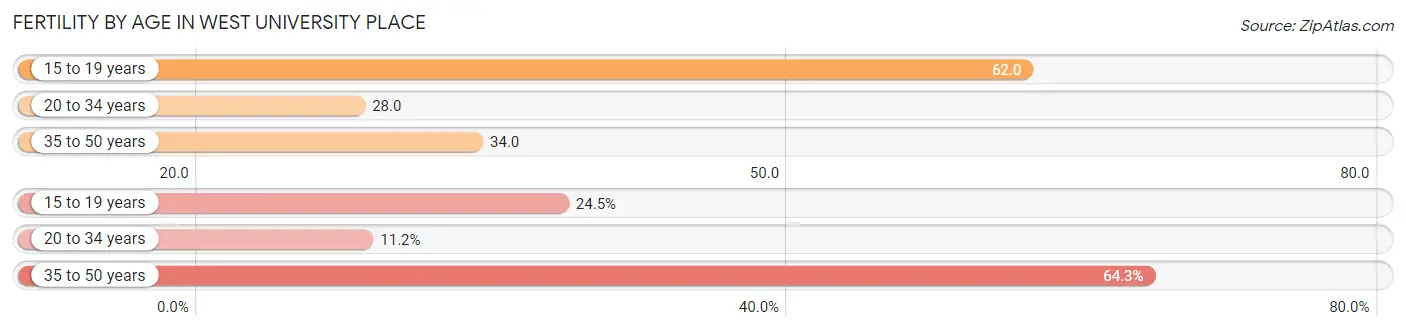
| Age Bracket | Women with Births | Births / 1,000 Women |
| 15 to 19 years | 24 (24.5%) | 62.0 |
| 20 to 34 years | 11 (11.2%) | 28.0 |
| 35 to 50 years | 63 (64.3%) | 34.0 |
| Total | 98 (100.0%) | 37.0 |
Fertility by Age by Marriage Status in West University Place
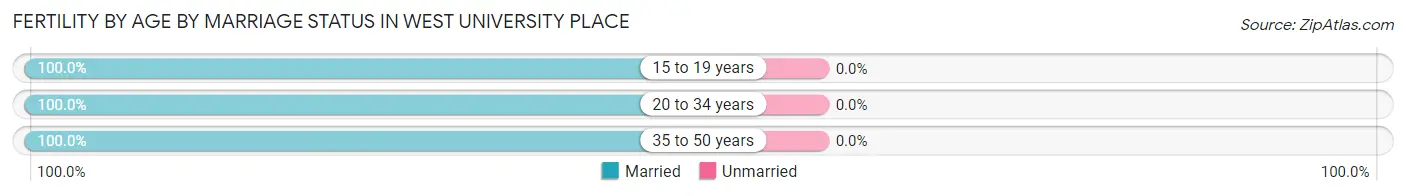
| Age Bracket | Married | Unmarried |
| 15 to 19 years | 24 (100.0%) | 0 (0.0%) |
| 20 to 34 years | 11 (100.0%) | 0 (0.0%) |
| 35 to 50 years | 63 (100.0%) | 0 (0.0%) |
| Total | 98 (100.0%) | 0 (0.0%) |
Fertility by Education in West University Place
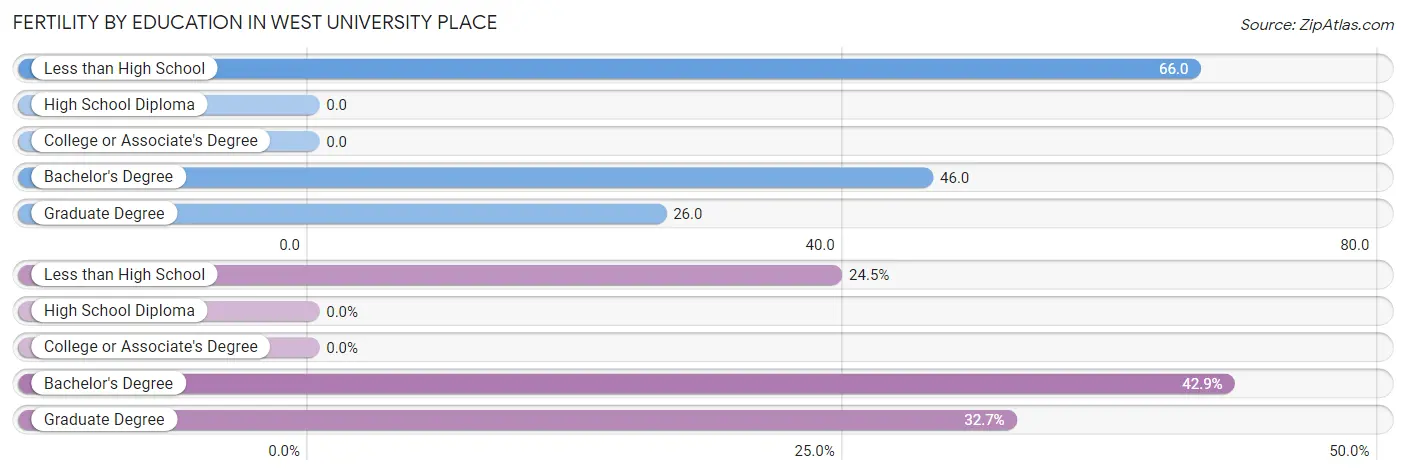
| Educational Attainment | Women with Births | Births / 1,000 Women |
| Less than High School | 24 (24.5%) | 66.0 |
| High School Diploma | 0 (0.0%) | 0.0 |
| College or Associate's Degree | 0 (0.0%) | 0.0 |
| Bachelor's Degree | 42 (42.9%) | 46.0 |
| Graduate Degree | 32 (32.7%) | 26.0 |
| Total | 98 (100.0%) | 37.0 |
Fertility by Education by Marriage Status in West University Place
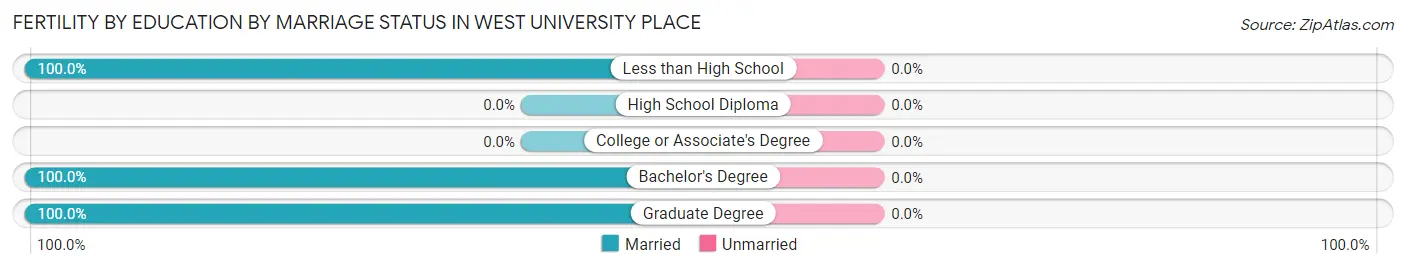
| Educational Attainment | Married | Unmarried |
| Less than High School | 24 (100.0%) | 0 (0.0%) |
| High School Diploma | 0 (0.0%) | 0 (0.0%) |
| College or Associate's Degree | 0 (0.0%) | 0 (0.0%) |
| Bachelor's Degree | 42 (100.0%) | 0 (0.0%) |
| Graduate Degree | 32 (100.0%) | 0 (0.0%) |
| Total | 98 (100.0%) | 0 (0.0%) |
Employment Characteristics in West University Place
Employment by Class of Employer in West University Place
Among the 6,384 employed individuals in West University Place, private company employees (3,617 | 56.7%), self-employed (incorporated) (913 | 14.3%), and not-for-profit organizations (649 | 10.2%) make up the most common classes of employment.
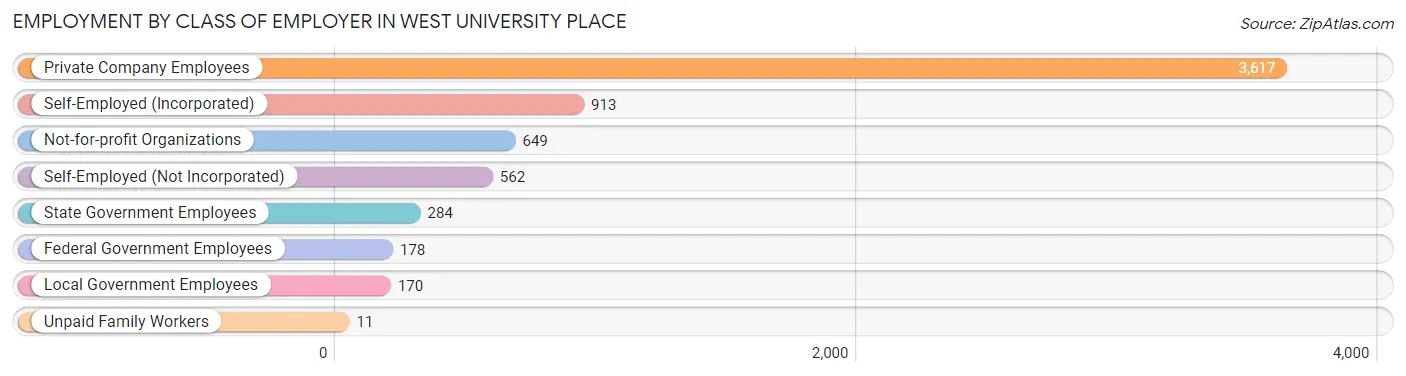
| Employer Class | # Employees | % Employees |
| Private Company Employees | 3,617 | 56.7% |
| Self-Employed (Incorporated) | 913 | 14.3% |
| Self-Employed (Not Incorporated) | 562 | 8.8% |
| Not-for-profit Organizations | 649 | 10.2% |
| Local Government Employees | 170 | 2.7% |
| State Government Employees | 284 | 4.4% |
| Federal Government Employees | 178 | 2.8% |
| Unpaid Family Workers | 11 | 0.2% |
| Total | 6,384 | 100.0% |
Employment Status by Age in West University Place
According to the labor force statistics for West University Place, out of the total population over 16 years of age (10,863), 62.6% or 6,800 individuals are in the labor force, with 5.7% or 388 of them unemployed. The age group with the highest labor force participation rate is 25 to 29 years, with 100.0% or 183 individuals in the labor force. Within the labor force, the 65 to 74 years age range has the highest percentage of unemployed individuals, with 22.2% or 147 of them being unemployed.
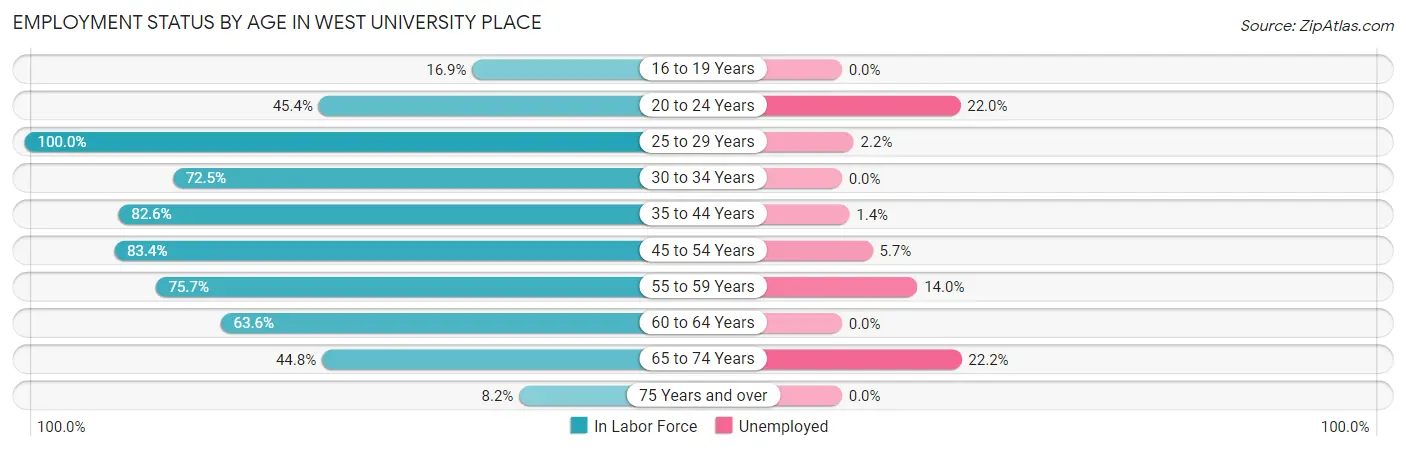
| Age Bracket | In Labor Force | Unemployed |
| 16 to 19 Years | 152 (16.9%) | 0 (0.0%) |
| 20 to 24 Years | 59 (45.4%) | 13 (22.0%) |
| 25 to 29 Years | 183 (100.0%) | 4 (2.2%) |
| 30 to 34 Years | 416 (72.5%) | 0 (0.0%) |
| 35 to 44 Years | 1,890 (82.6%) | 26 (1.4%) |
| 45 to 54 Years | 1,916 (83.4%) | 109 (5.7%) |
| 55 to 59 Years | 615 (75.7%) | 86 (14.0%) |
| 60 to 64 Years | 836 (63.6%) | 0 (0.0%) |
| 65 to 74 Years | 662 (44.8%) | 147 (22.2%) |
| 75 Years and over | 73 (8.2%) | 0 (0.0%) |
| Total | 6,800 (62.6%) | 388 (5.7%) |
Employment Status by Educational Attainment in West University Place
According to labor force statistics for West University Place, 78.4% of individuals (5,856) out of the total population between 25 and 64 years of age (7,469) are in the labor force, with 3.8% or 223 of them being unemployed. The group with the highest labor force participation rate are those with the educational attainment of less than high school, with 100.0% or 30 individuals in the labor force. Within the labor force, individuals with bachelor's degree or higher education have the highest percentage of unemployment, with 4.1% or 223 of them being unemployed.
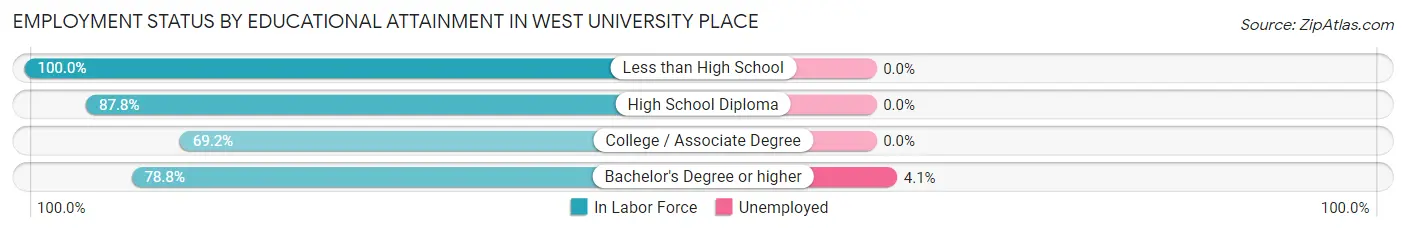
| Educational Attainment | In Labor Force | Unemployed |
| Less than High School | 30 (100.0%) | 0 (0.0%) |
| High School Diploma | 79 (87.8%) | 0 (0.0%) |
| College / Associate Degree | 314 (69.2%) | 0 (0.0%) |
| Bachelor's Degree or higher | 5,433 (78.8%) | 283 (4.1%) |
| Total | 5,856 (78.4%) | 284 (3.8%) |
Employment Occupations by Sex in West University Place
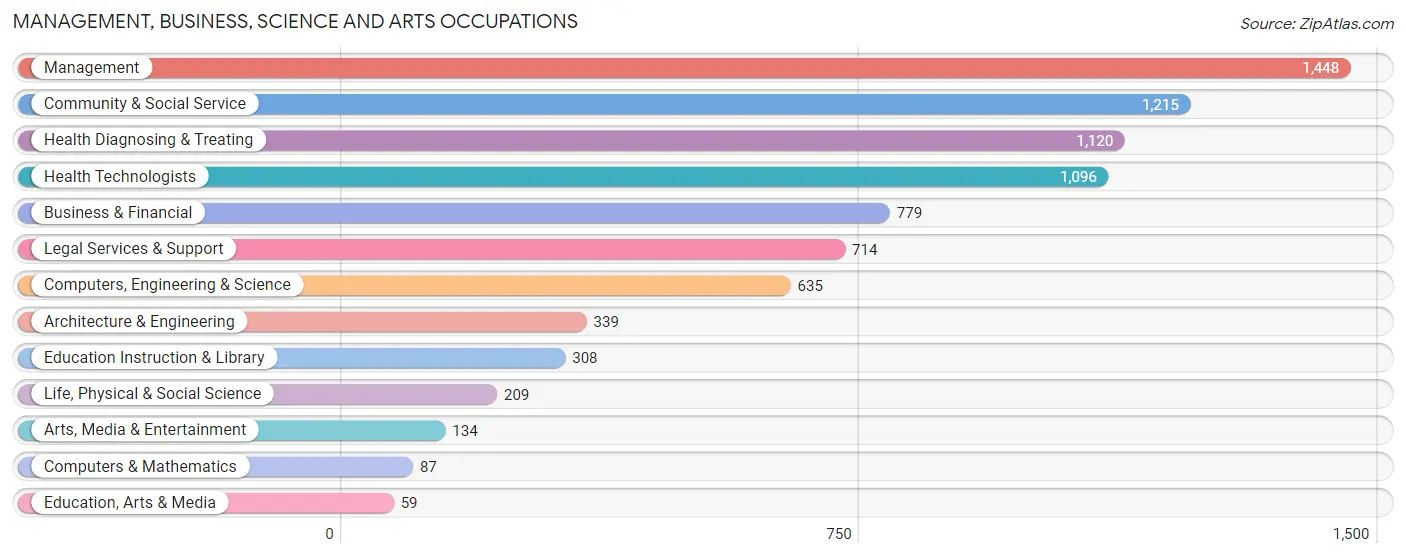
Management, Business, Science and Arts Occupations
The most common Management, Business, Science and Arts occupations in West University Place are Management (1,448 | 22.7%), Community & Social Service (1,215 | 19.1%), Health Diagnosing & Treating (1,120 | 17.6%), Health Technologists (1,096 | 17.2%), and Business & Financial (779 | 12.2%).
Management, Business, Science and Arts Occupations by Sex
Within the Management, Business, Science and Arts occupations in West University Place, the most male-oriented occupations are Architecture & Engineering (89.4%), Computers, Engineering & Science (69.8%), and Management (68.5%), while the most female-oriented occupations are Education, Arts & Media (83.1%), Computers & Mathematics (69.0%), and Arts, Media & Entertainment (59.0%).
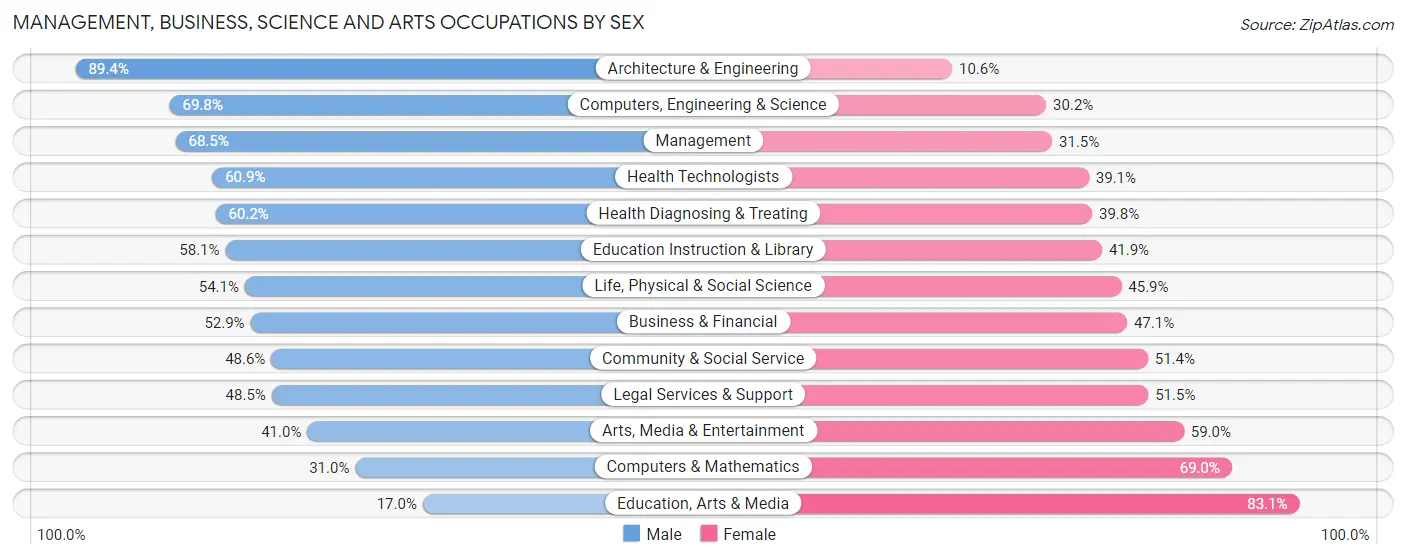
| Occupation | Male | Female |
| Management | 992 (68.5%) | 456 (31.5%) |
| Business & Financial | 412 (52.9%) | 367 (47.1%) |
| Computers, Engineering & Science | 443 (69.8%) | 192 (30.2%) |
| Computers & Mathematics | 27 (31.0%) | 60 (69.0%) |
| Architecture & Engineering | 303 (89.4%) | 36 (10.6%) |
| Life, Physical & Social Science | 113 (54.1%) | 96 (45.9%) |
| Community & Social Service | 590 (48.6%) | 625 (51.4%) |
| Education, Arts & Media | 10 (17.0%) | 49 (83.1%) |
| Legal Services & Support | 346 (48.5%) | 368 (51.5%) |
| Education Instruction & Library | 179 (58.1%) | 129 (41.9%) |
| Arts, Media & Entertainment | 55 (41.0%) | 79 (59.0%) |
| Health Diagnosing & Treating | 674 (60.2%) | 446 (39.8%) |
| Health Technologists | 667 (60.9%) | 429 (39.1%) |
| Total (Category) | 3,111 (59.9%) | 2,086 (40.1%) |
| Total (Overall) | 3,873 (60.7%) | 2,504 (39.3%) |
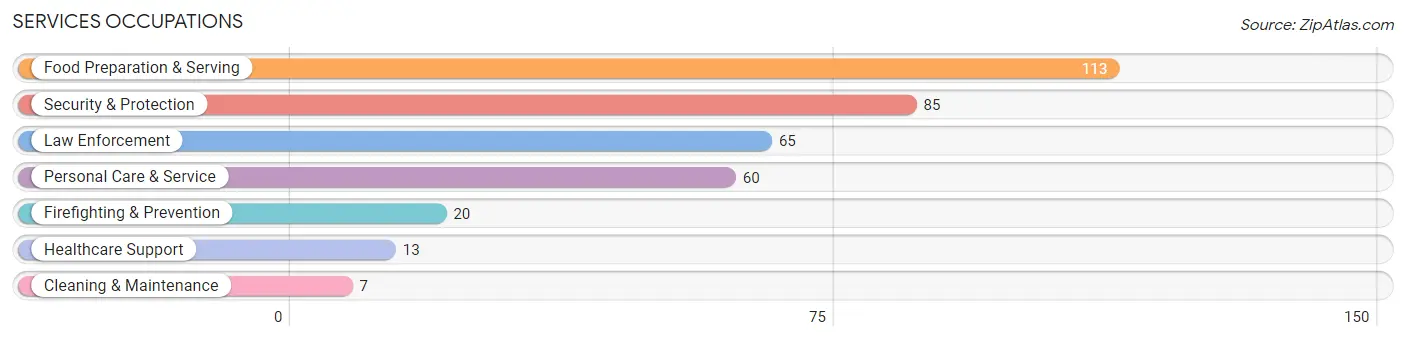
Services Occupations
The most common Services occupations in West University Place are Food Preparation & Serving (113 | 1.8%), Security & Protection (85 | 1.3%), Law Enforcement (65 | 1.0%), Personal Care & Service (60 | 0.9%), and Firefighting & Prevention (20 | 0.3%).
Services Occupations by Sex
Within the Services occupations in West University Place, the most male-oriented occupations are Law Enforcement (100.0%), Security & Protection (96.5%), and Firefighting & Prevention (85.0%), while the most female-oriented occupations are Healthcare Support (100.0%), Cleaning & Maintenance (100.0%), and Personal Care & Service (83.3%).
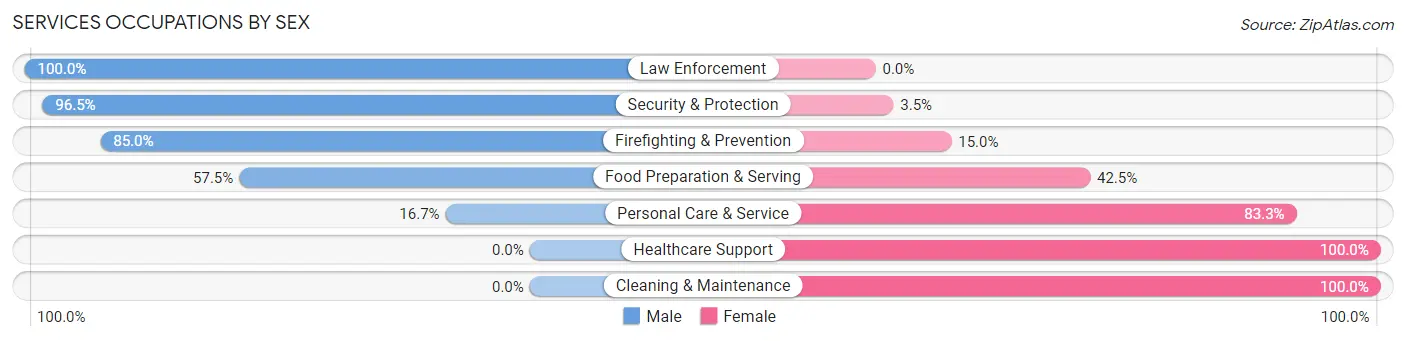
| Occupation | Male | Female |
| Healthcare Support | 0 (0.0%) | 13 (100.0%) |
| Security & Protection | 82 (96.5%) | 3 (3.5%) |
| Firefighting & Prevention | 17 (85.0%) | 3 (15.0%) |
| Law Enforcement | 65 (100.0%) | 0 (0.0%) |
| Food Preparation & Serving | 65 (57.5%) | 48 (42.5%) |
| Cleaning & Maintenance | 0 (0.0%) | 7 (100.0%) |
| Personal Care & Service | 10 (16.7%) | 50 (83.3%) |
| Total (Category) | 157 (56.5%) | 121 (43.5%) |
| Total (Overall) | 3,873 (60.7%) | 2,504 (39.3%) |
Sales and Office Occupations
The most common Sales and Office occupations in West University Place are Sales & Related (450 | 7.1%), and Office & Administration (295 | 4.6%).

Sales and Office Occupations by Sex

| Occupation | Male | Female |
| Sales & Related | 315 (70.0%) | 135 (30.0%) |
| Office & Administration | 133 (45.1%) | 162 (54.9%) |
| Total (Category) | 448 (60.1%) | 297 (39.9%) |
| Total (Overall) | 3,873 (60.7%) | 2,504 (39.3%) |
Natural Resources, Construction and Maintenance Occupations
The most common Natural Resources, Construction and Maintenance occupations in West University Place are Construction & Extraction (35 | 0.5%), and Installation, Maintenance & Repair (11 | 0.2%).
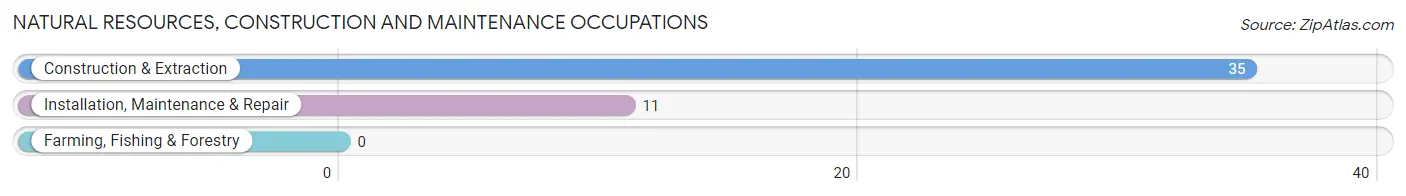
Natural Resources, Construction and Maintenance Occupations by Sex

| Occupation | Male | Female |
| Farming, Fishing & Forestry | 0 (0.0%) | 0 (0.0%) |
| Construction & Extraction | 35 (100.0%) | 0 (0.0%) |
| Installation, Maintenance & Repair | 11 (100.0%) | 0 (0.0%) |
| Total (Category) | 46 (100.0%) | 0 (0.0%) |
| Total (Overall) | 3,873 (60.7%) | 2,504 (39.3%) |
Production, Transportation and Moving Occupations
The most common Production, Transportation and Moving occupations in West University Place are Transportation (69 | 1.1%), Production (30 | 0.5%), and Material Moving (12 | 0.2%).
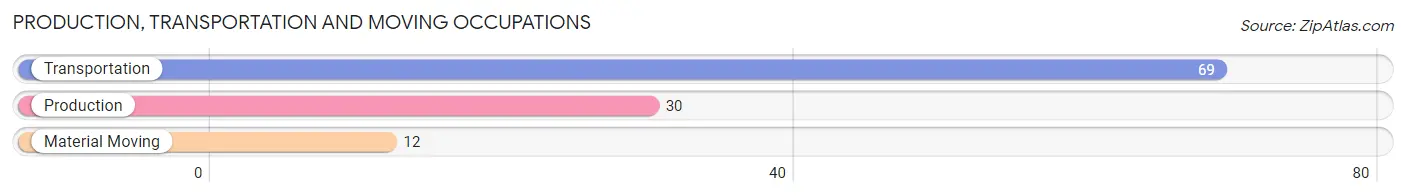
Production, Transportation and Moving Occupations by Sex
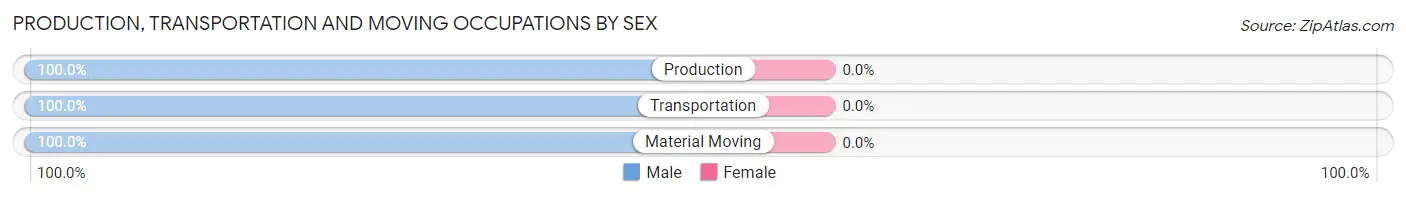
| Occupation | Male | Female |
| Production | 30 (100.0%) | 0 (0.0%) |
| Transportation | 69 (100.0%) | 0 (0.0%) |
| Material Moving | 12 (100.0%) | 0 (0.0%) |
| Total (Category) | 111 (100.0%) | 0 (0.0%) |
| Total (Overall) | 3,873 (60.7%) | 2,504 (39.3%) |
Employment Industries by Sex in West University Place
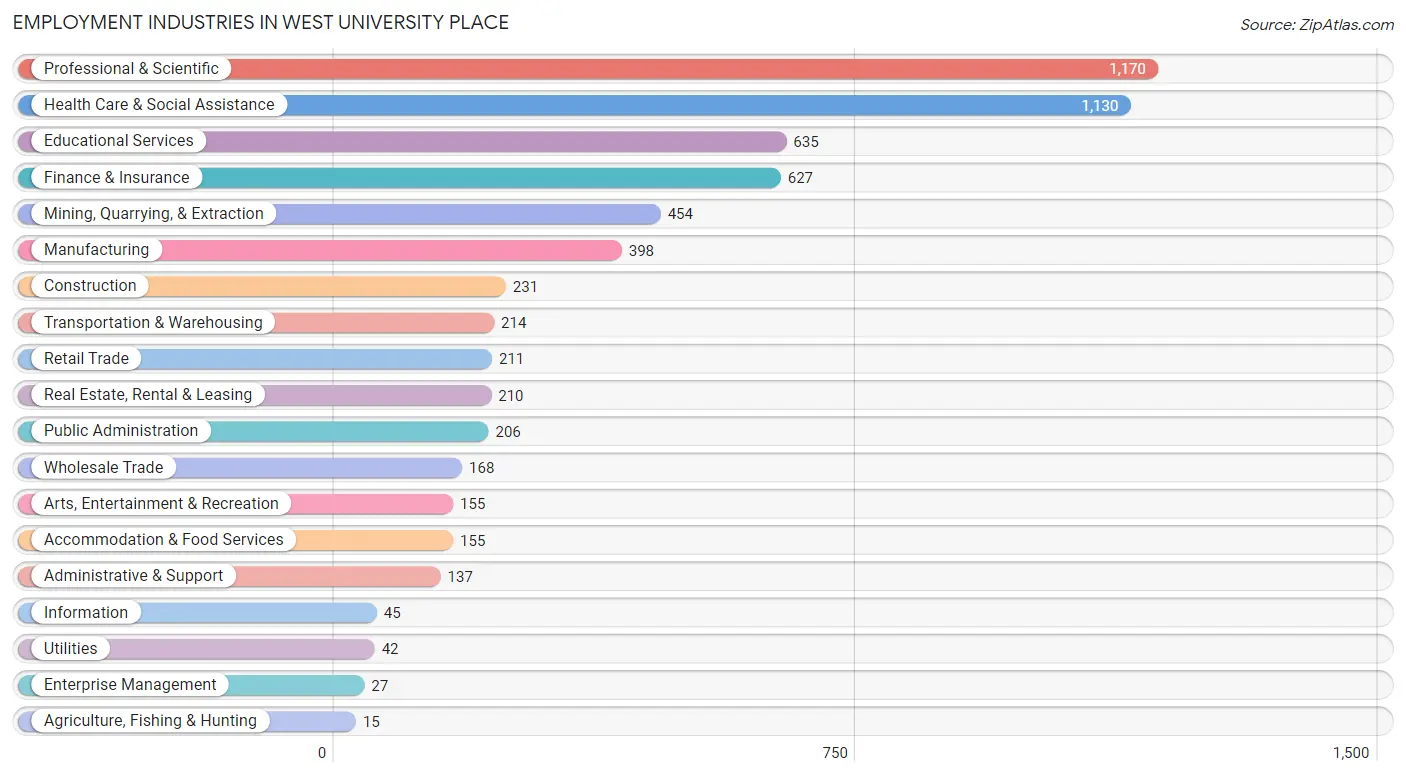
Employment Industries in West University Place
The major employment industries in West University Place include Professional & Scientific (1,170 | 18.3%), Health Care & Social Assistance (1,130 | 17.7%), Educational Services (635 | 10.0%), Finance & Insurance (627 | 9.8%), and Mining, Quarrying, & Extraction (454 | 7.1%).
Employment Industries by Sex in West University Place
The West University Place industries that see more men than women are Utilities (100.0%), Information (100.0%), and Construction (96.1%), whereas the industries that tend to have a higher number of women are Agriculture, Fishing & Hunting (100.0%), Accommodation & Food Services (67.7%), and Educational Services (57.0%).
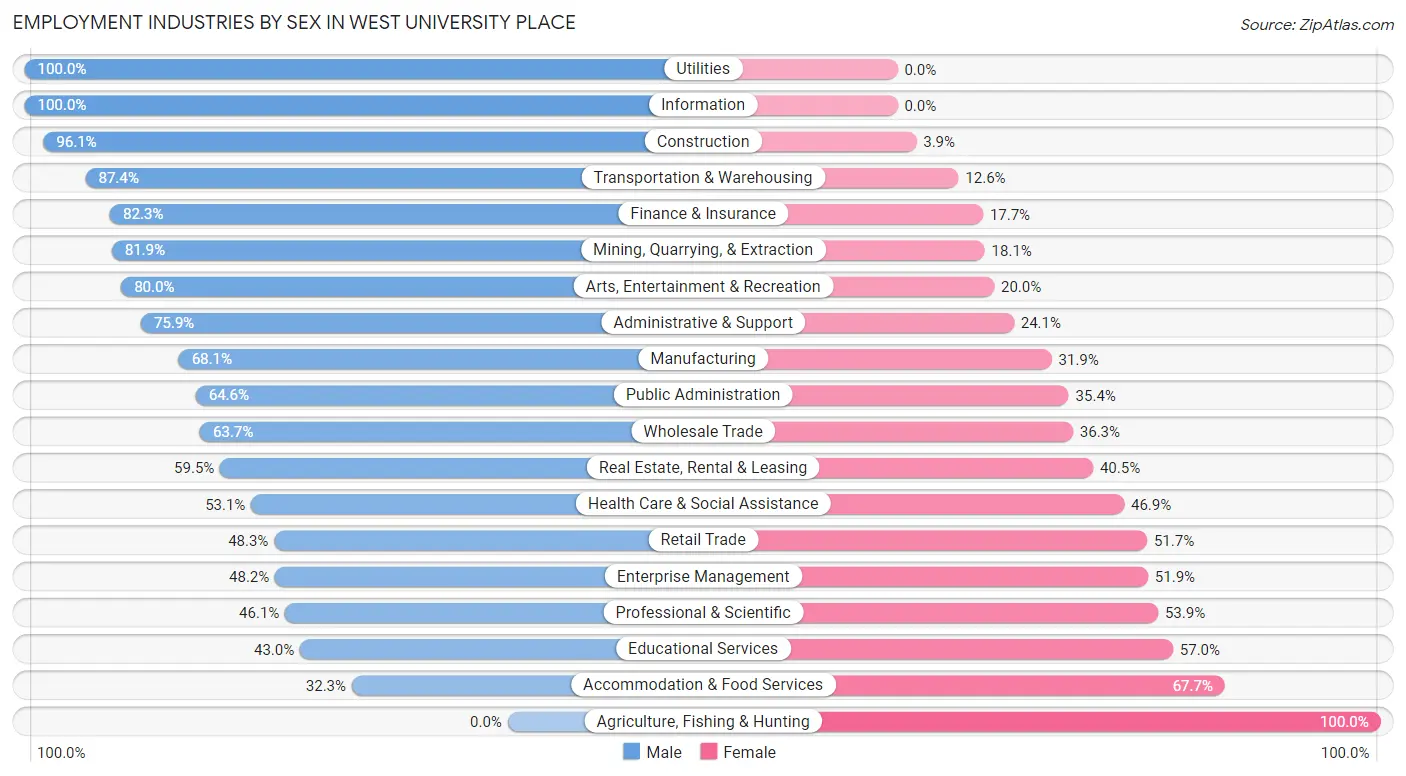
| Industry | Male | Female |
| Agriculture, Fishing & Hunting | 0 (0.0%) | 15 (100.0%) |
| Mining, Quarrying, & Extraction | 372 (81.9%) | 82 (18.1%) |
| Construction | 222 (96.1%) | 9 (3.9%) |
| Manufacturing | 271 (68.1%) | 127 (31.9%) |
| Wholesale Trade | 107 (63.7%) | 61 (36.3%) |
| Retail Trade | 102 (48.3%) | 109 (51.7%) |
| Transportation & Warehousing | 187 (87.4%) | 27 (12.6%) |
| Utilities | 42 (100.0%) | 0 (0.0%) |
| Information | 45 (100.0%) | 0 (0.0%) |
| Finance & Insurance | 516 (82.3%) | 111 (17.7%) |
| Real Estate, Rental & Leasing | 125 (59.5%) | 85 (40.5%) |
| Professional & Scientific | 539 (46.1%) | 631 (53.9%) |
| Enterprise Management | 13 (48.1%) | 14 (51.8%) |
| Administrative & Support | 104 (75.9%) | 33 (24.1%) |
| Educational Services | 273 (43.0%) | 362 (57.0%) |
| Health Care & Social Assistance | 600 (53.1%) | 530 (46.9%) |
| Arts, Entertainment & Recreation | 124 (80.0%) | 31 (20.0%) |
| Accommodation & Food Services | 50 (32.3%) | 105 (67.7%) |
| Public Administration | 133 (64.6%) | 73 (35.4%) |
| Total | 3,873 (60.7%) | 2,504 (39.3%) |
Education in West University Place
School Enrollment in West University Place
The most common levels of schooling among the 4,443 students in West University Place are elementary school (1,079 | 24.3%), middle school (1,073 | 24.1%), and high school (978 | 22.0%).
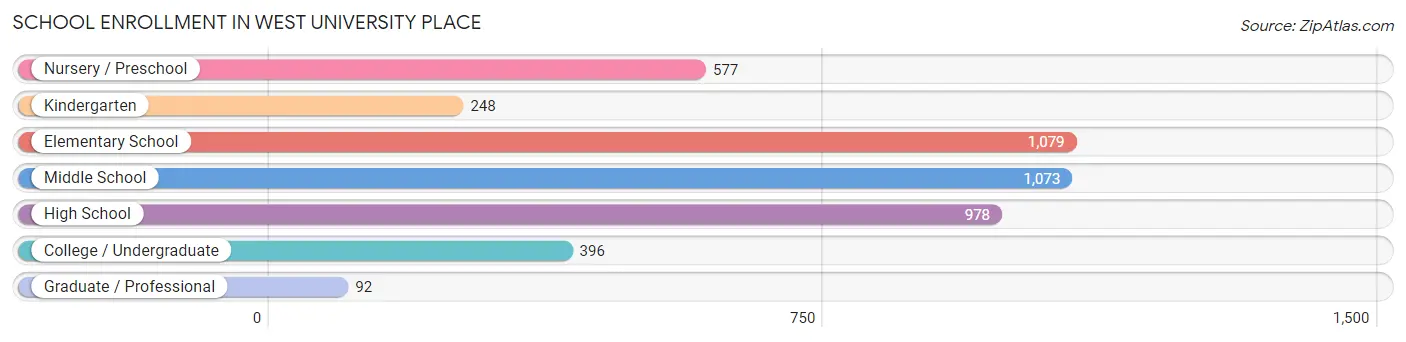
| School Level | # Students | % Students |
| Nursery / Preschool | 577 | 13.0% |
| Kindergarten | 248 | 5.6% |
| Elementary School | 1,079 | 24.3% |
| Middle School | 1,073 | 24.1% |
| High School | 978 | 22.0% |
| College / Undergraduate | 396 | 8.9% |
| Graduate / Professional | 92 | 2.1% |
| Total | 4,443 | 100.0% |
School Enrollment by Age by Funding Source in West University Place
Out of a total of 4,443 students who are enrolled in schools in West University Place, 2,564 (57.7%) attend a private institution, while the remaining 1,879 (42.3%) are enrolled in public schools. The age group of 3 to 4 year olds has the highest likelihood of being enrolled in private schools, with 392 (87.7% in the age bracket) enrolled. Conversely, the age group of 35 years and over has the lowest likelihood of being enrolled in a private school, with 72 (85.7% in the age bracket) attending a public institution.
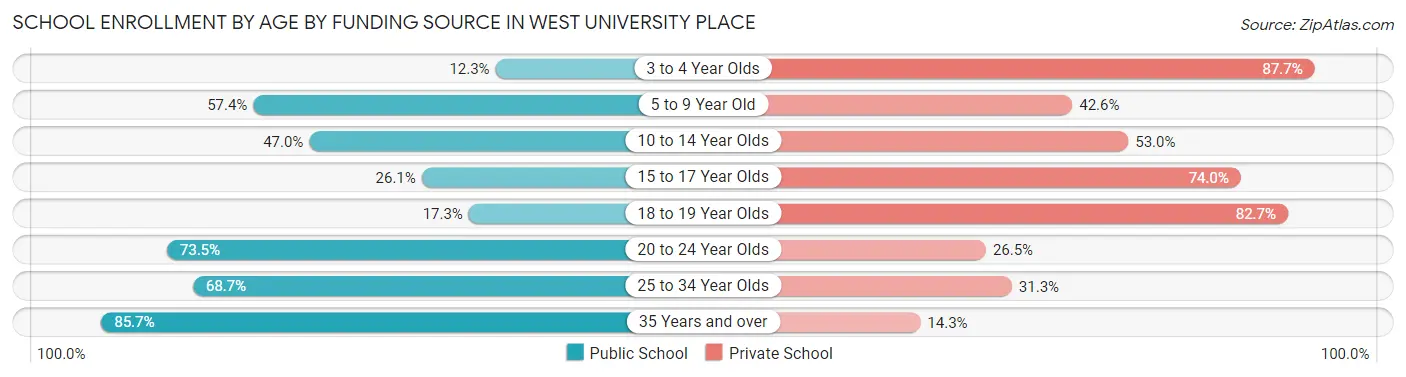
| Age Bracket | Public School | Private School |
| 3 to 4 Year Olds | 55 (12.3%) | 392 (87.7%) |
| 5 to 9 Year Old | 743 (57.4%) | 551 (42.6%) |
| 10 to 14 Year Olds | 601 (47.0%) | 678 (53.0%) |
| 15 to 17 Year Olds | 230 (26.1%) | 653 (74.0%) |
| 18 to 19 Year Olds | 47 (17.3%) | 225 (82.7%) |
| 20 to 24 Year Olds | 86 (73.5%) | 31 (26.5%) |
| 25 to 34 Year Olds | 46 (68.7%) | 21 (31.3%) |
| 35 Years and over | 72 (85.7%) | 12 (14.3%) |
| Total | 1,879 (42.3%) | 2,564 (57.7%) |
Educational Attainment by Field of Study in West University Place
Business (2,277 | 23.5%), social sciences (1,252 | 12.9%), engineering (1,134 | 11.7%), bio, nature & agricultural (790 | 8.2%), and physical & health sciences (706 | 7.3%) are the most common fields of study among 9,673 individuals in West University Place who have obtained a bachelor's degree or higher.
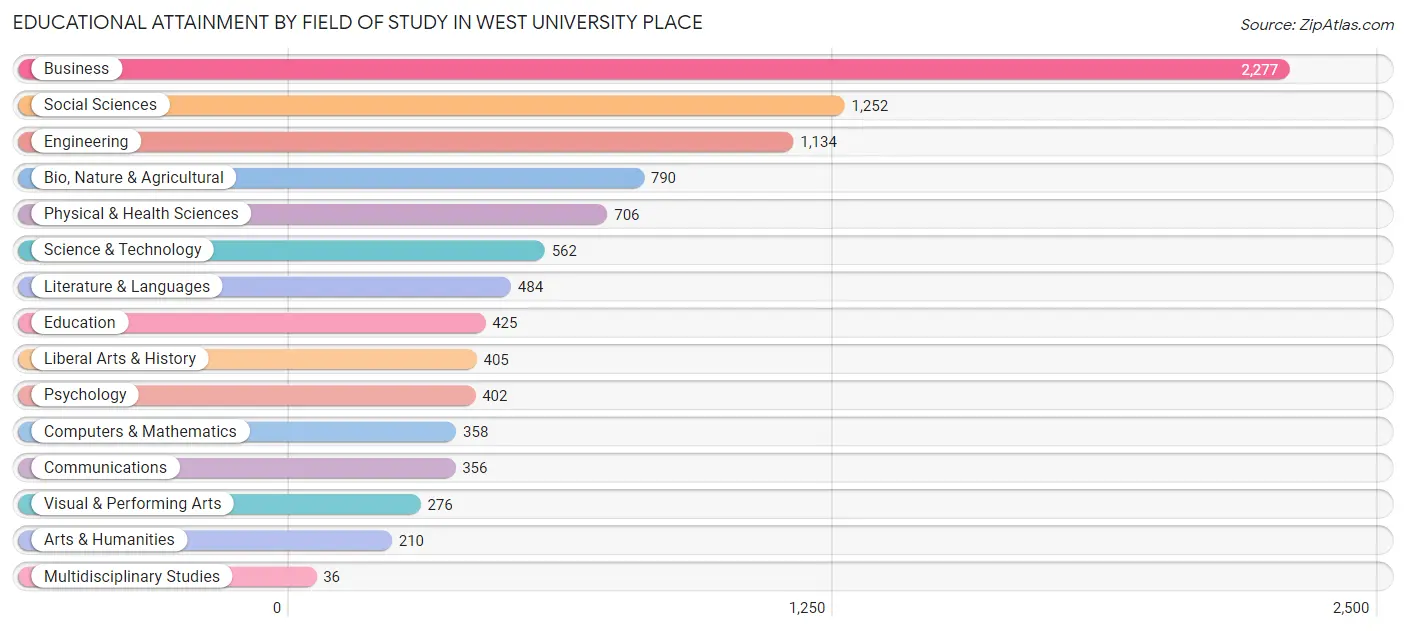
| Field of Study | # Graduates | % Graduates |
| Computers & Mathematics | 358 | 3.7% |
| Bio, Nature & Agricultural | 790 | 8.2% |
| Physical & Health Sciences | 706 | 7.3% |
| Psychology | 402 | 4.2% |
| Social Sciences | 1,252 | 12.9% |
| Engineering | 1,134 | 11.7% |
| Multidisciplinary Studies | 36 | 0.4% |
| Science & Technology | 562 | 5.8% |
| Business | 2,277 | 23.5% |
| Education | 425 | 4.4% |
| Literature & Languages | 484 | 5.0% |
| Liberal Arts & History | 405 | 4.2% |
| Visual & Performing Arts | 276 | 2.9% |
| Communications | 356 | 3.7% |
| Arts & Humanities | 210 | 2.2% |
| Total | 9,673 | 100.0% |
Transportation & Commute in West University Place
Vehicle Availability by Sex in West University Place
The most prevalent vehicle ownership categories in West University Place are males with 2 vehicles (2,507, accounting for 64.3%) and females with 2 vehicles (1,587, making up 100.8%).
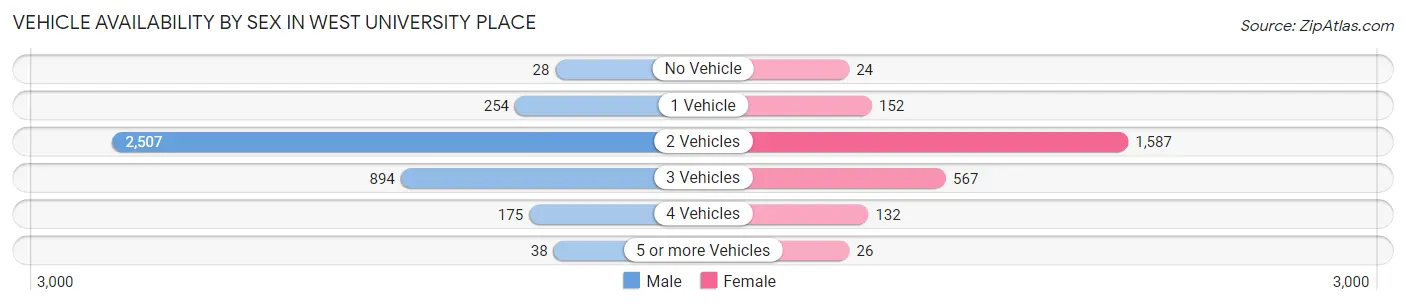
| Vehicles Available | Male | Female |
| No Vehicle | 28 (0.7%) | 24 (1.0%) |
| 1 Vehicle | 254 (6.5%) | 152 (6.1%) |
| 2 Vehicles | 2,507 (64.3%) | 1,587 (63.8%) |
| 3 Vehicles | 894 (23.0%) | 567 (22.8%) |
| 4 Vehicles | 175 (4.5%) | 132 (5.3%) |
| 5 or more Vehicles | 38 (1.0%) | 26 (1.1%) |
| Total | 3,896 (100.0%) | 2,488 (100.0%) |
Commute Time in West University Place
The most frequently occuring commute durations in West University Place are 15 to 19 minutes (1,415 commuters, 27.2%), 20 to 24 minutes (1,045 commuters, 20.1%), and 10 to 14 minutes (801 commuters, 15.4%).
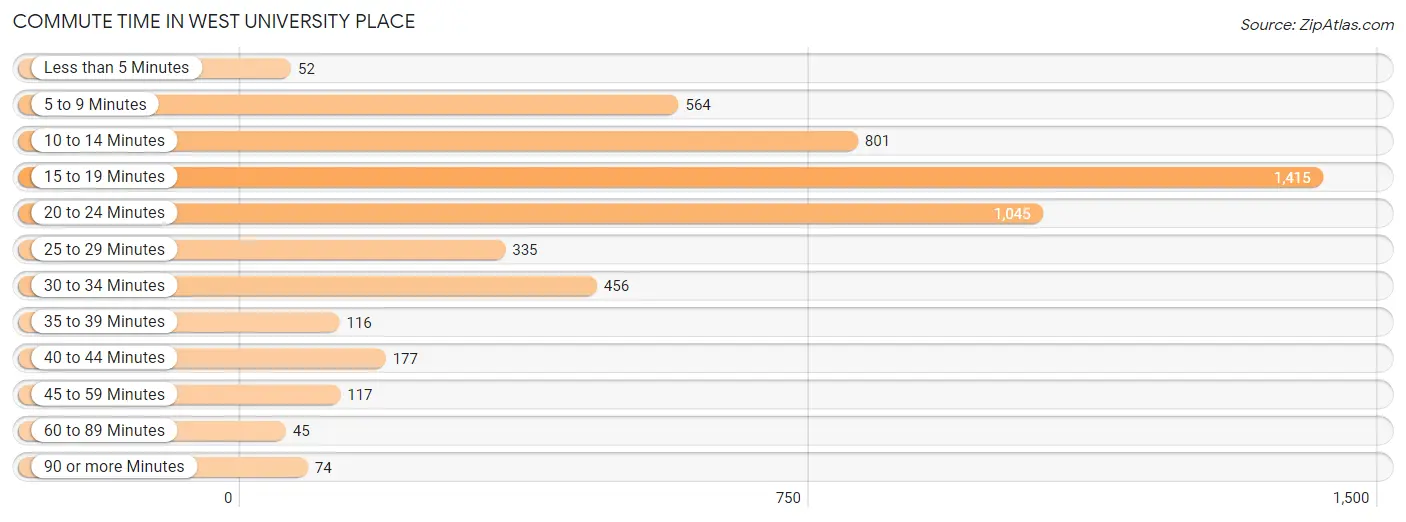
| Commute Time | # Commuters | % Commuters |
| Less than 5 Minutes | 52 | 1.0% |
| 5 to 9 Minutes | 564 | 10.8% |
| 10 to 14 Minutes | 801 | 15.4% |
| 15 to 19 Minutes | 1,415 | 27.2% |
| 20 to 24 Minutes | 1,045 | 20.1% |
| 25 to 29 Minutes | 335 | 6.5% |
| 30 to 34 Minutes | 456 | 8.8% |
| 35 to 39 Minutes | 116 | 2.2% |
| 40 to 44 Minutes | 177 | 3.4% |
| 45 to 59 Minutes | 117 | 2.2% |
| 60 to 89 Minutes | 45 | 0.9% |
| 90 or more Minutes | 74 | 1.4% |
Commute Time by Sex in West University Place
The most common commute times in West University Place are 15 to 19 minutes (834 commuters, 26.6%) for males and 15 to 19 minutes (581 commuters, 28.2%) for females.
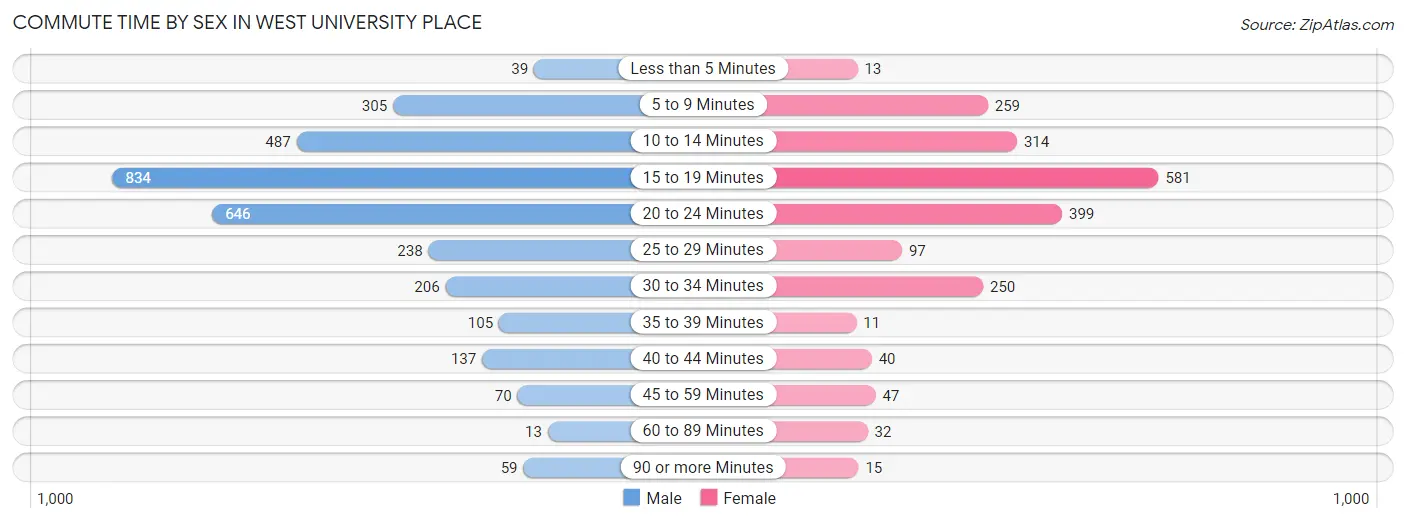
| Commute Time | Male | Female |
| Less than 5 Minutes | 39 (1.2%) | 13 (0.6%) |
| 5 to 9 Minutes | 305 (9.7%) | 259 (12.6%) |
| 10 to 14 Minutes | 487 (15.5%) | 314 (15.3%) |
| 15 to 19 Minutes | 834 (26.6%) | 581 (28.2%) |
| 20 to 24 Minutes | 646 (20.6%) | 399 (19.4%) |
| 25 to 29 Minutes | 238 (7.6%) | 97 (4.7%) |
| 30 to 34 Minutes | 206 (6.6%) | 250 (12.1%) |
| 35 to 39 Minutes | 105 (3.4%) | 11 (0.5%) |
| 40 to 44 Minutes | 137 (4.4%) | 40 (1.9%) |
| 45 to 59 Minutes | 70 (2.2%) | 47 (2.3%) |
| 60 to 89 Minutes | 13 (0.4%) | 32 (1.5%) |
| 90 or more Minutes | 59 (1.9%) | 15 (0.7%) |
Time of Departure to Work by Sex in West University Place
The most frequent times of departure to work in West University Place are 8:00 AM to 8:29 AM (710, 22.6%) for males and 8:00 AM to 8:29 AM (387, 18.8%) for females.
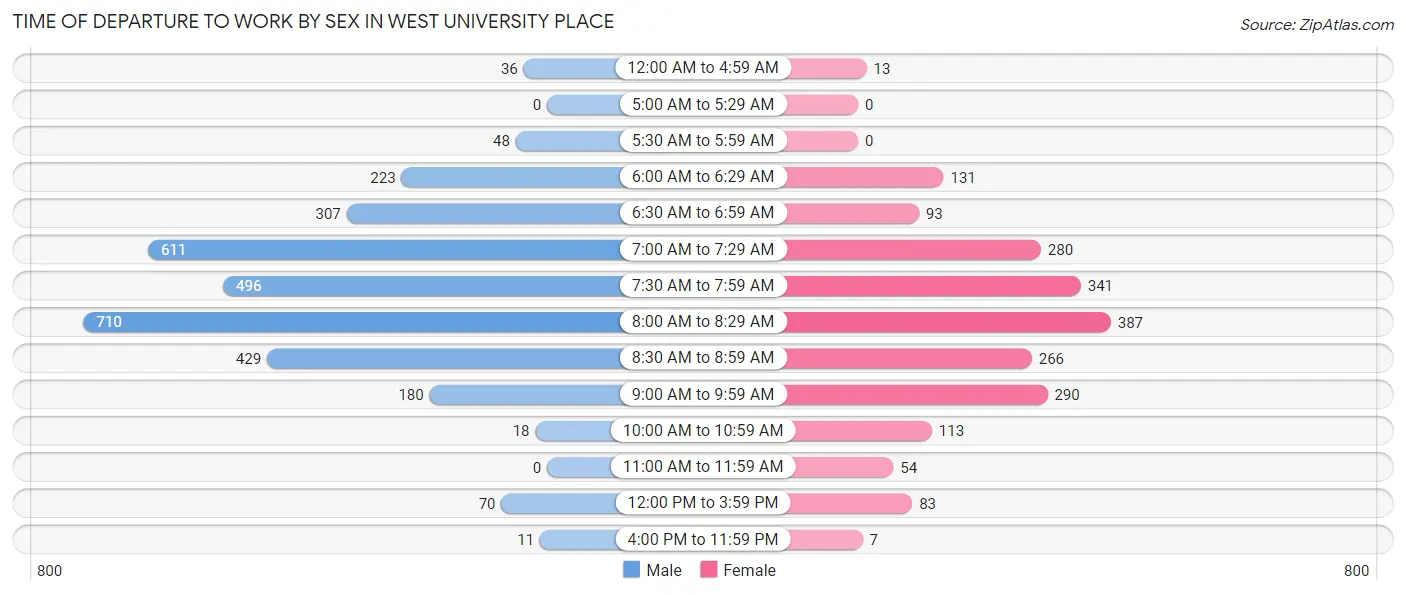
| Time of Departure | Male | Female |
| 12:00 AM to 4:59 AM | 36 (1.1%) | 13 (0.6%) |
| 5:00 AM to 5:29 AM | 0 (0.0%) | 0 (0.0%) |
| 5:30 AM to 5:59 AM | 48 (1.5%) | 0 (0.0%) |
| 6:00 AM to 6:29 AM | 223 (7.1%) | 131 (6.4%) |
| 6:30 AM to 6:59 AM | 307 (9.8%) | 93 (4.5%) |
| 7:00 AM to 7:29 AM | 611 (19.5%) | 280 (13.6%) |
| 7:30 AM to 7:59 AM | 496 (15.8%) | 341 (16.6%) |
| 8:00 AM to 8:29 AM | 710 (22.6%) | 387 (18.8%) |
| 8:30 AM to 8:59 AM | 429 (13.7%) | 266 (12.9%) |
| 9:00 AM to 9:59 AM | 180 (5.7%) | 290 (14.1%) |
| 10:00 AM to 10:59 AM | 18 (0.6%) | 113 (5.5%) |
| 11:00 AM to 11:59 AM | 0 (0.0%) | 54 (2.6%) |
| 12:00 PM to 3:59 PM | 70 (2.2%) | 83 (4.0%) |
| 4:00 PM to 11:59 PM | 11 (0.4%) | 7 (0.3%) |
| Total | 3,139 (100.0%) | 2,058 (100.0%) |
Housing Occupancy in West University Place
Occupancy by Ownership in West University Place
Of the total 5,245 dwellings in West University Place, owner-occupied units account for 4,858 (92.6%), while renter-occupied units make up 387 (7.4%).
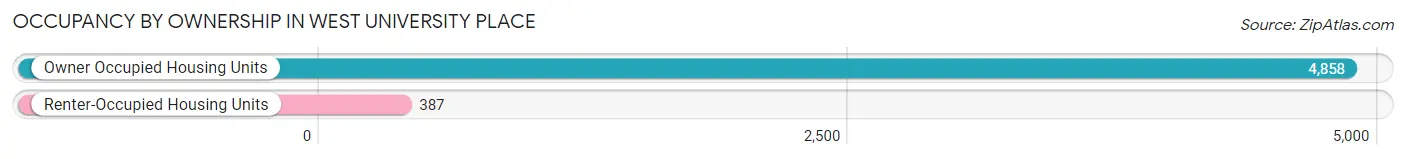
| Occupancy | # Housing Units | % Housing Units |
| Owner Occupied Housing Units | 4,858 | 92.6% |
| Renter-Occupied Housing Units | 387 | 7.4% |
| Total Occupied Housing Units | 5,245 | 100.0% |
Occupancy by Household Size in West University Place
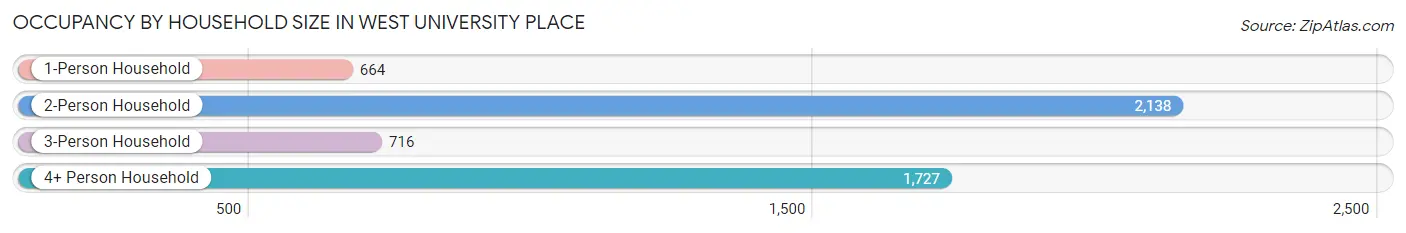
| Household Size | # Housing Units | % Housing Units |
| 1-Person Household | 664 | 12.7% |
| 2-Person Household | 2,138 | 40.8% |
| 3-Person Household | 716 | 13.7% |
| 4+ Person Household | 1,727 | 32.9% |
| Total Housing Units | 5,245 | 100.0% |
Occupancy by Ownership by Household Size in West University Place
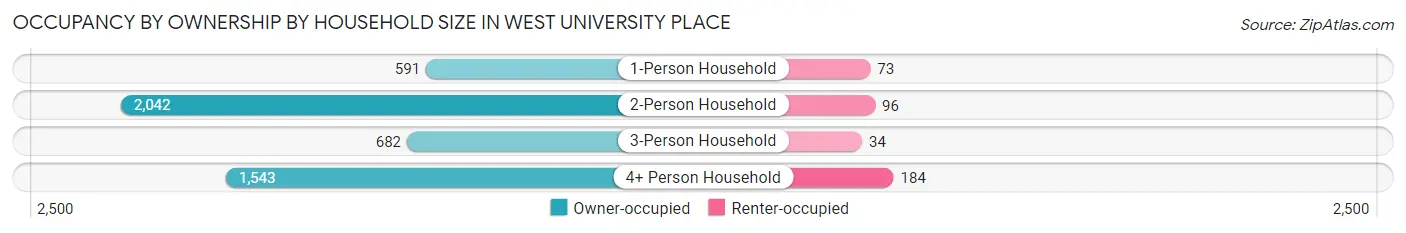
| Household Size | Owner-occupied | Renter-occupied |
| 1-Person Household | 591 (89.0%) | 73 (11.0%) |
| 2-Person Household | 2,042 (95.5%) | 96 (4.5%) |
| 3-Person Household | 682 (95.3%) | 34 (4.8%) |
| 4+ Person Household | 1,543 (89.3%) | 184 (10.6%) |
| Total Housing Units | 4,858 (92.6%) | 387 (7.4%) |
Occupancy by Educational Attainment in West University Place
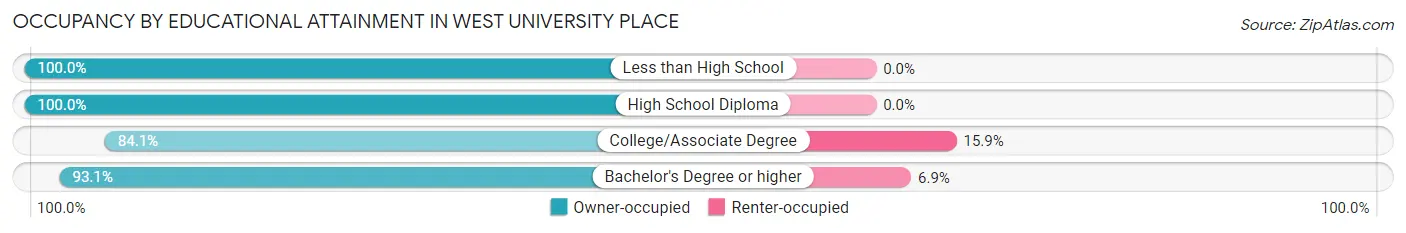
| Household Size | Owner-occupied | Renter-occupied |
| Less than High School | 72 (100.0%) | 0 (0.0%) |
| High School Diploma | 64 (100.0%) | 0 (0.0%) |
| College/Associate Degree | 306 (84.1%) | 58 (15.9%) |
| Bachelor's Degree or higher | 4,416 (93.1%) | 329 (6.9%) |
Occupancy by Age of Householder in West University Place
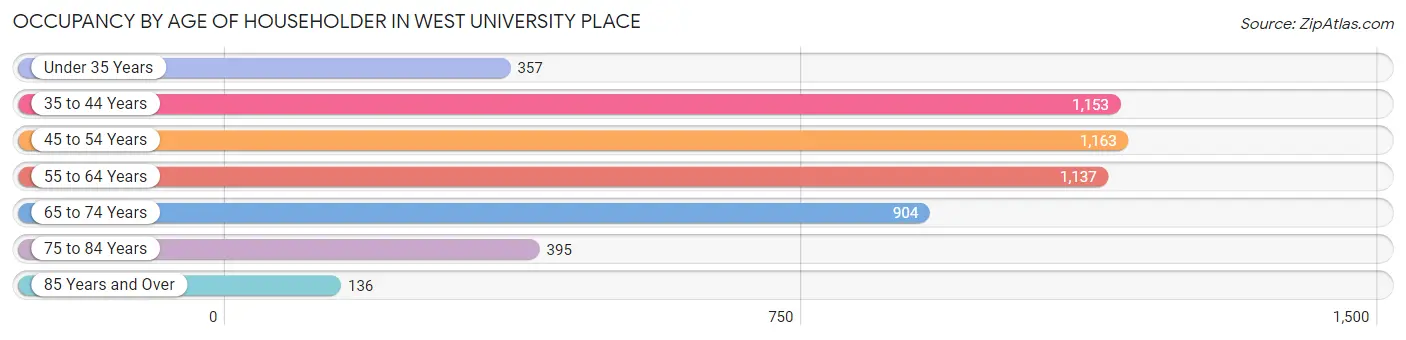
| Age Bracket | # Households | % Households |
| Under 35 Years | 357 | 6.8% |
| 35 to 44 Years | 1,153 | 22.0% |
| 45 to 54 Years | 1,163 | 22.2% |
| 55 to 64 Years | 1,137 | 21.7% |
| 65 to 74 Years | 904 | 17.2% |
| 75 to 84 Years | 395 | 7.5% |
| 85 Years and Over | 136 | 2.6% |
| Total | 5,245 | 100.0% |
Housing Finances in West University Place
Median Income by Occupancy in West University Place
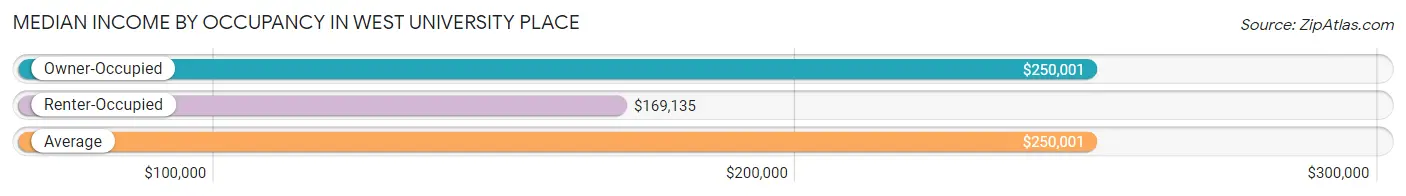
| Occupancy Type | # Households | Median Income |
| Owner-Occupied | 4,858 (92.6%) | $250,001 |
| Renter-Occupied | 387 (7.4%) | $169,135 |
| Average | 5,245 (100.0%) | $250,001 |
Occupancy by Householder Income Bracket in West University Place
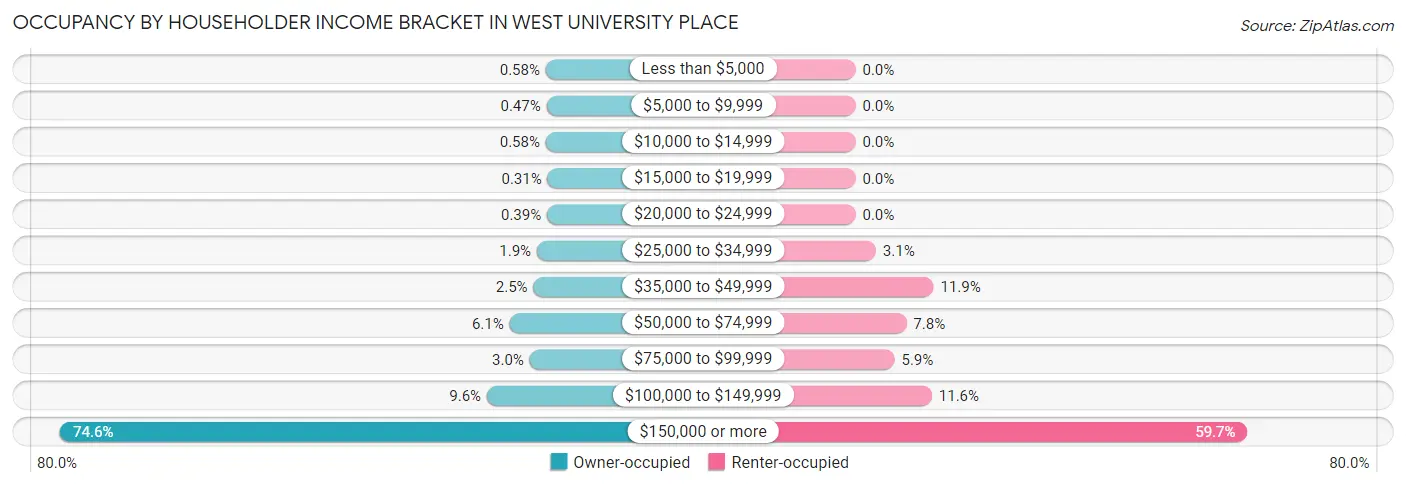
| Income Bracket | Owner-occupied | Renter-occupied |
| Less than $5,000 | 28 (0.6%) | 0 (0.0%) |
| $5,000 to $9,999 | 23 (0.5%) | 0 (0.0%) |
| $10,000 to $14,999 | 28 (0.6%) | 0 (0.0%) |
| $15,000 to $19,999 | 15 (0.3%) | 0 (0.0%) |
| $20,000 to $24,999 | 19 (0.4%) | 0 (0.0%) |
| $25,000 to $34,999 | 94 (1.9%) | 12 (3.1%) |
| $35,000 to $49,999 | 120 (2.5%) | 46 (11.9%) |
| $50,000 to $74,999 | 297 (6.1%) | 30 (7.7%) |
| $75,000 to $99,999 | 147 (3.0%) | 23 (5.9%) |
| $100,000 to $149,999 | 464 (9.6%) | 45 (11.6%) |
| $150,000 or more | 3,623 (74.6%) | 231 (59.7%) |
| Total | 4,858 (100.0%) | 387 (100.0%) |
Monthly Housing Cost Tiers in West University Place
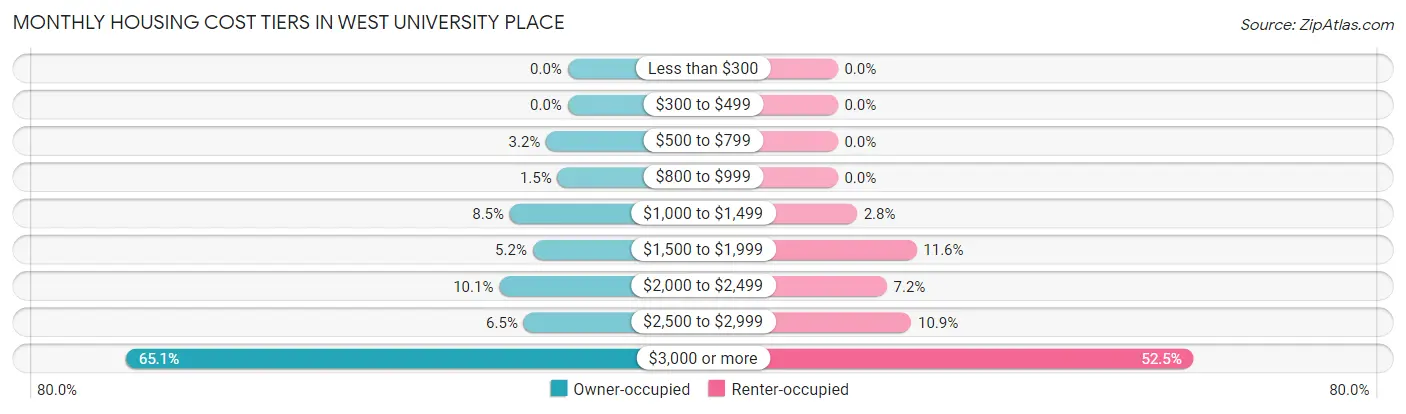
| Monthly Cost | Owner-occupied | Renter-occupied |
| Less than $300 | 0 (0.0%) | 0 (0.0%) |
| $300 to $499 | 0 (0.0%) | 0 (0.0%) |
| $500 to $799 | 154 (3.2%) | 0 (0.0%) |
| $800 to $999 | 73 (1.5%) | 0 (0.0%) |
| $1,000 to $1,499 | 414 (8.5%) | 11 (2.8%) |
| $1,500 to $1,999 | 250 (5.1%) | 45 (11.6%) |
| $2,000 to $2,499 | 490 (10.1%) | 28 (7.2%) |
| $2,500 to $2,999 | 315 (6.5%) | 42 (10.8%) |
| $3,000 or more | 3,162 (65.1%) | 203 (52.4%) |
| Total | 4,858 (100.0%) | 387 (100.0%) |
Physical Housing Characteristics in West University Place
Housing Structures in West University Place
| Structure Type | # Housing Units | % Housing Units |
| Single Unit, Detached | 5,046 | 96.2% |
| Single Unit, Attached | 173 | 3.3% |
| 2 Unit Apartments | 0 | 0.0% |
| 3 or 4 Unit Apartments | 8 | 0.2% |
| 5 to 9 Unit Apartments | 18 | 0.3% |
| 10 or more Apartments | 0 | 0.0% |
| Mobile Home / Other | 0 | 0.0% |
| Total | 5,245 | 100.0% |
Housing Structures by Occupancy in West University Place
| Structure Type | Owner-occupied | Renter-occupied |
| Single Unit, Detached | 4,677 (92.7%) | 369 (7.3%) |
| Single Unit, Attached | 173 (100.0%) | 0 (0.0%) |
| 2 Unit Apartments | 0 (0.0%) | 0 (0.0%) |
| 3 or 4 Unit Apartments | 8 (100.0%) | 0 (0.0%) |
| 5 to 9 Unit Apartments | 0 (0.0%) | 18 (100.0%) |
| 10 or more Apartments | 0 (0.0%) | 0 (0.0%) |
| Mobile Home / Other | 0 (0.0%) | 0 (0.0%) |
| Total | 4,858 (92.6%) | 387 (7.4%) |
Housing Structures by Number of Rooms in West University Place
| Number of Rooms | Owner-occupied | Renter-occupied |
| 1 Room | 7 (0.1%) | 0 (0.0%) |
| 2 or 3 Rooms | 18 (0.4%) | 0 (0.0%) |
| 4 or 5 Rooms | 452 (9.3%) | 73 (18.9%) |
| 6 or 7 Rooms | 1,083 (22.3%) | 103 (26.6%) |
| 8 or more Rooms | 3,298 (67.9%) | 211 (54.5%) |
| Total | 4,858 (100.0%) | 387 (100.0%) |
Housing Structure by Heating Type in West University Place
| Heating Type | Owner-occupied | Renter-occupied |
| Utility Gas | 3,482 (71.7%) | 215 (55.6%) |
| Bottled, Tank, or LP Gas | 85 (1.8%) | 0 (0.0%) |
| Electricity | 1,291 (26.6%) | 172 (44.4%) |
| Fuel Oil or Kerosene | 0 (0.0%) | 0 (0.0%) |
| Coal or Coke | 0 (0.0%) | 0 (0.0%) |
| All other Fuels | 0 (0.0%) | 0 (0.0%) |
| No Fuel Used | 0 (0.0%) | 0 (0.0%) |
| Total | 4,858 (100.0%) | 387 (100.0%) |
Household Vehicle Usage in West University Place
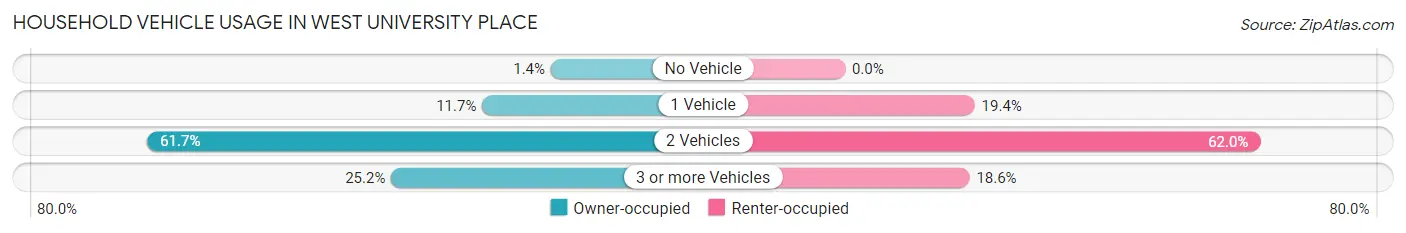
| Vehicles per Household | Owner-occupied | Renter-occupied |
| No Vehicle | 68 (1.4%) | 0 (0.0%) |
| 1 Vehicle | 566 (11.7%) | 75 (19.4%) |
| 2 Vehicles | 2,998 (61.7%) | 240 (62.0%) |
| 3 or more Vehicles | 1,226 (25.2%) | 72 (18.6%) |
| Total | 4,858 (100.0%) | 387 (100.0%) |
Real Estate & Mortgages in West University Place
Real Estate and Mortgage Overview in West University Place
| Characteristic | Without Mortgage | With Mortgage |
| Housing Units | 2,060 | 2,798 |
| Median Property Value | $1,180,300 | $1,464,000 |
| Median Household Income | $233,616 | $2,287 |
| Monthly Housing Costs | $1,501 | $2,614 |
| Real Estate Taxes | $10,001 | $7 |
Property Value by Mortgage Status in West University Place
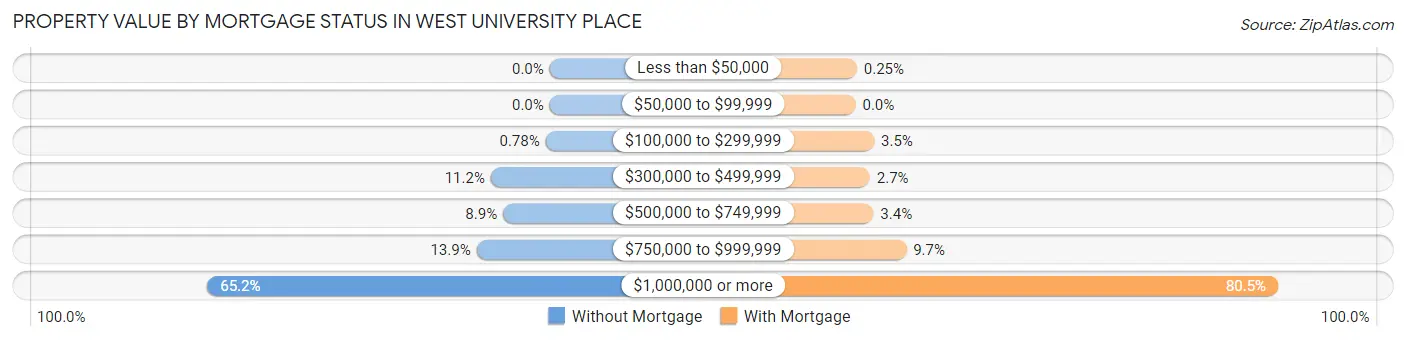
| Property Value | Without Mortgage | With Mortgage |
| Less than $50,000 | 0 (0.0%) | 7 (0.3%) |
| $50,000 to $99,999 | 0 (0.0%) | 0 (0.0%) |
| $100,000 to $299,999 | 16 (0.8%) | 99 (3.5%) |
| $300,000 to $499,999 | 231 (11.2%) | 76 (2.7%) |
| $500,000 to $749,999 | 183 (8.9%) | 95 (3.4%) |
| $750,000 to $999,999 | 287 (13.9%) | 270 (9.7%) |
| $1,000,000 or more | 1,343 (65.2%) | 2,251 (80.4%) |
| Total | 2,060 (100.0%) | 2,798 (100.0%) |
Household Income by Mortgage Status in West University Place
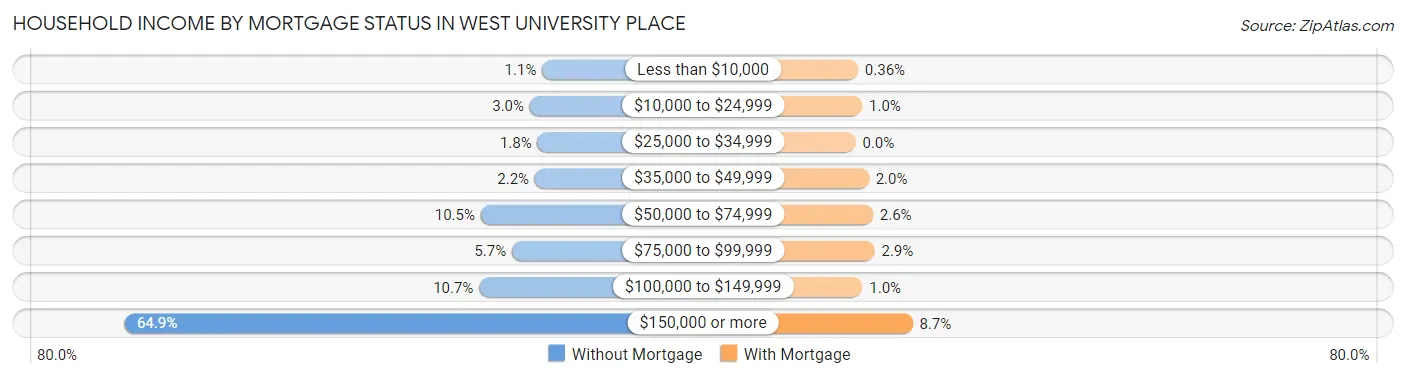
| Household Income | Without Mortgage | With Mortgage |
| Less than $10,000 | 23 (1.1%) | 10 (0.4%) |
| $10,000 to $24,999 | 62 (3.0%) | 28 (1.0%) |
| $25,000 to $34,999 | 38 (1.8%) | 0 (0.0%) |
| $35,000 to $49,999 | 46 (2.2%) | 56 (2.0%) |
| $50,000 to $74,999 | 216 (10.5%) | 74 (2.6%) |
| $75,000 to $99,999 | 118 (5.7%) | 81 (2.9%) |
| $100,000 to $149,999 | 221 (10.7%) | 29 (1.0%) |
| $150,000 or more | 1,336 (64.8%) | 243 (8.7%) |
| Total | 2,060 (100.0%) | 2,798 (100.0%) |
Property Value to Household Income Ratio in West University Place
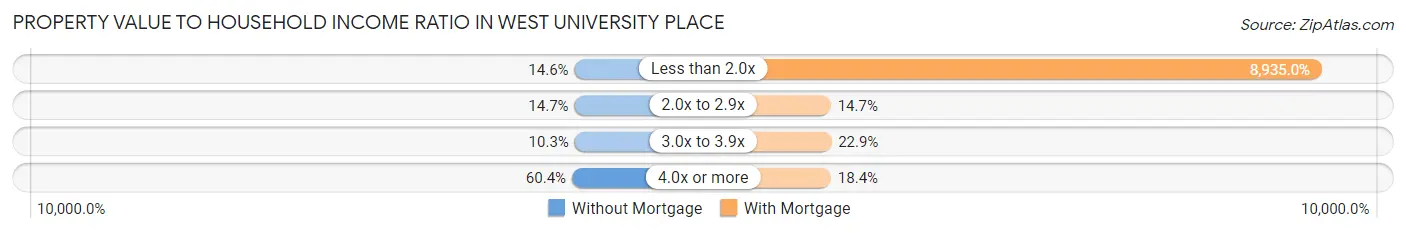
| Value-to-Income Ratio | Without Mortgage | With Mortgage |
| Less than 2.0x | 301 (14.6%) | 250,001 (8,935.0%) |
| 2.0x to 2.9x | 302 (14.7%) | 411 (14.7%) |
| 3.0x to 3.9x | 213 (10.3%) | 642 (22.9%) |
| 4.0x or more | 1,244 (60.4%) | 514 (18.4%) |
| Total | 2,060 (100.0%) | 2,798 (100.0%) |
Real Estate Taxes by Mortgage Status in West University Place
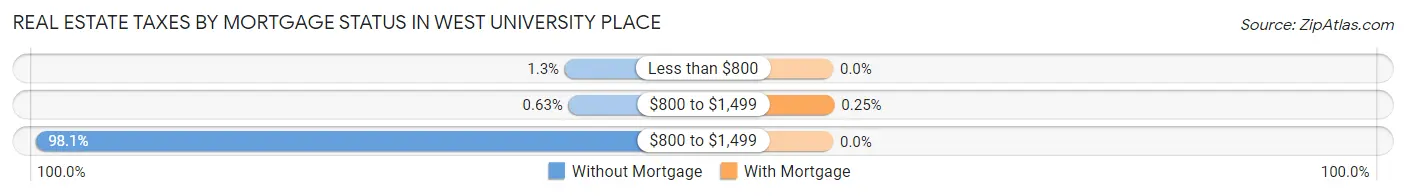
| Property Taxes | Without Mortgage | With Mortgage |
| Less than $800 | 27 (1.3%) | 0 (0.0%) |
| $800 to $1,499 | 13 (0.6%) | 7 (0.3%) |
| $800 to $1,499 | 2,020 (98.1%) | 0 (0.0%) |
| Total | 2,060 (100.0%) | 2,798 (100.0%) |
Health & Disability in West University Place
Health Insurance Coverage by Age in West University Place
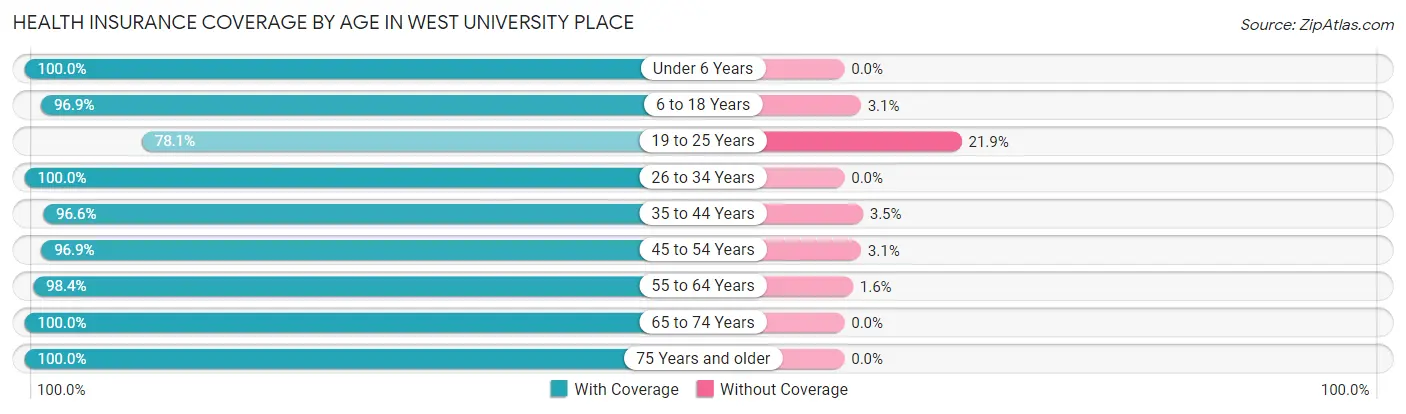
| Age Bracket | With Coverage | Without Coverage |
| Under 6 Years | 1,379 (100.0%) | 0 (0.0%) |
| 6 to 18 Years | 3,453 (96.9%) | 109 (3.1%) |
| 19 to 25 Years | 168 (78.1%) | 47 (21.9%) |
| 26 to 34 Years | 731 (100.0%) | 0 (0.0%) |
| 35 to 44 Years | 2,209 (96.6%) | 79 (3.5%) |
| 45 to 54 Years | 2,187 (96.9%) | 70 (3.1%) |
| 55 to 64 Years | 2,093 (98.4%) | 34 (1.6%) |
| 65 to 74 Years | 1,477 (100.0%) | 0 (0.0%) |
| 75 Years and older | 887 (100.0%) | 0 (0.0%) |
| Total | 14,584 (97.7%) | 339 (2.3%) |
Health Insurance Coverage by Citizenship Status in West University Place
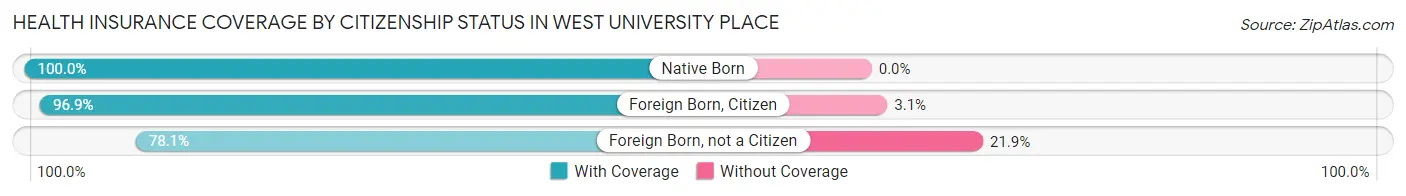
| Citizenship Status | With Coverage | Without Coverage |
| Native Born | 1,379 (100.0%) | 0 (0.0%) |
| Foreign Born, Citizen | 3,453 (96.9%) | 109 (3.1%) |
| Foreign Born, not a Citizen | 168 (78.1%) | 47 (21.9%) |
Health Insurance Coverage by Household Income in West University Place
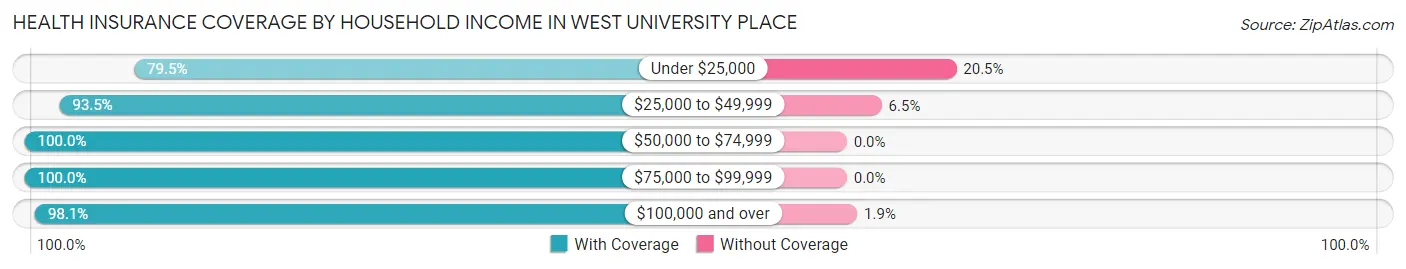
| Household Income | With Coverage | Without Coverage |
| Under $25,000 | 151 (79.5%) | 39 (20.5%) |
| $25,000 to $49,999 | 615 (93.5%) | 43 (6.5%) |
| $50,000 to $74,999 | 541 (100.0%) | 0 (0.0%) |
| $75,000 to $99,999 | 300 (100.0%) | 0 (0.0%) |
| $100,000 and over | 12,977 (98.1%) | 257 (1.9%) |
Public vs Private Health Insurance Coverage by Age in West University Place
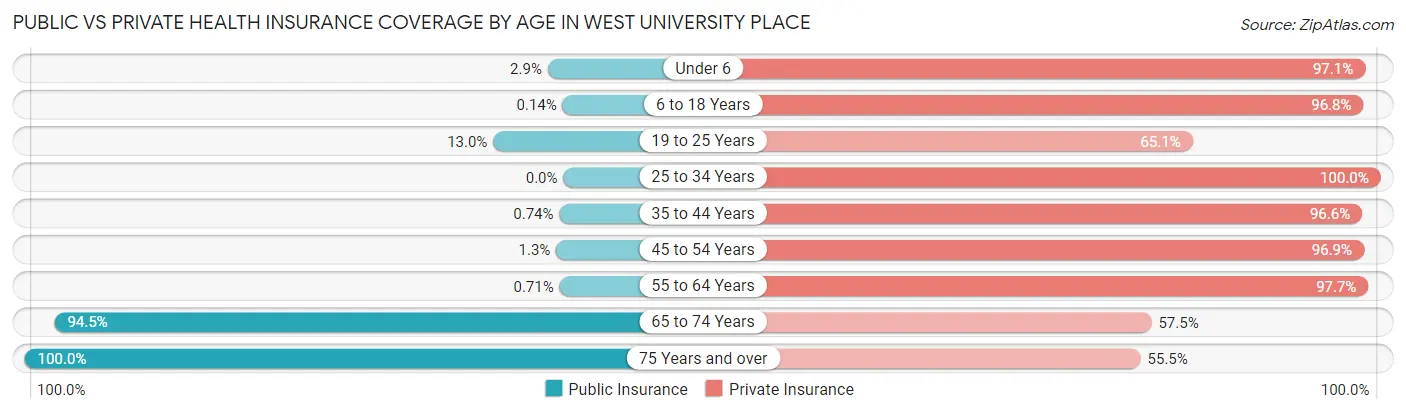
| Age Bracket | Public Insurance | Private Insurance |
| Under 6 | 40 (2.9%) | 1,339 (97.1%) |
| 6 to 18 Years | 5 (0.1%) | 3,448 (96.8%) |
| 19 to 25 Years | 28 (13.0%) | 140 (65.1%) |
| 25 to 34 Years | 0 (0.0%) | 731 (100.0%) |
| 35 to 44 Years | 17 (0.7%) | 2,209 (96.6%) |
| 45 to 54 Years | 30 (1.3%) | 2,187 (96.9%) |
| 55 to 64 Years | 15 (0.7%) | 2,078 (97.7%) |
| 65 to 74 Years | 1,395 (94.5%) | 849 (57.5%) |
| 75 Years and over | 887 (100.0%) | 492 (55.5%) |
| Total | 2,417 (16.2%) | 13,473 (90.3%) |
Disability Status by Sex by Age in West University Place
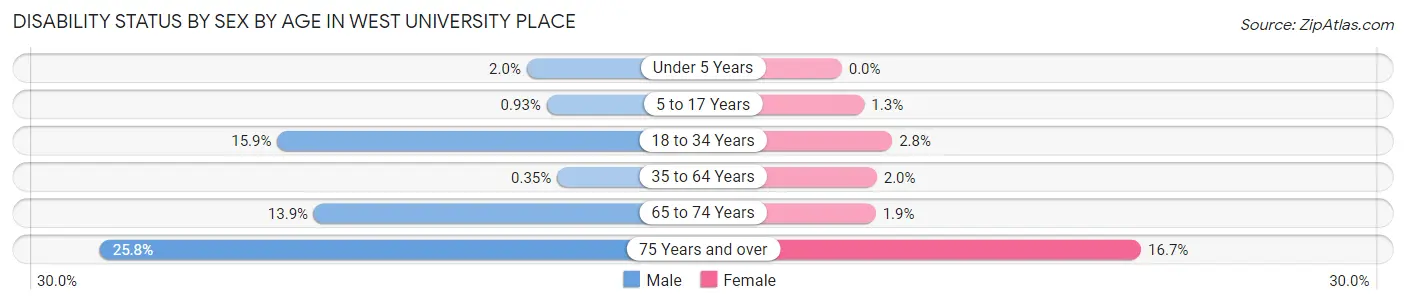
| Age Bracket | Male | Female |
| Under 5 Years | 11 (2.0%) | 0 (0.0%) |
| 5 to 17 Years | 16 (0.9%) | 23 (1.3%) |
| 18 to 34 Years | 116 (15.9%) | 13 (2.8%) |
| 35 to 64 Years | 12 (0.4%) | 63 (1.9%) |
| 65 to 74 Years | 95 (13.9%) | 15 (1.9%) |
| 75 Years and over | 119 (25.8%) | 71 (16.7%) |
Disability Class by Sex by Age in West University Place
Disability Class: Hearing Difficulty
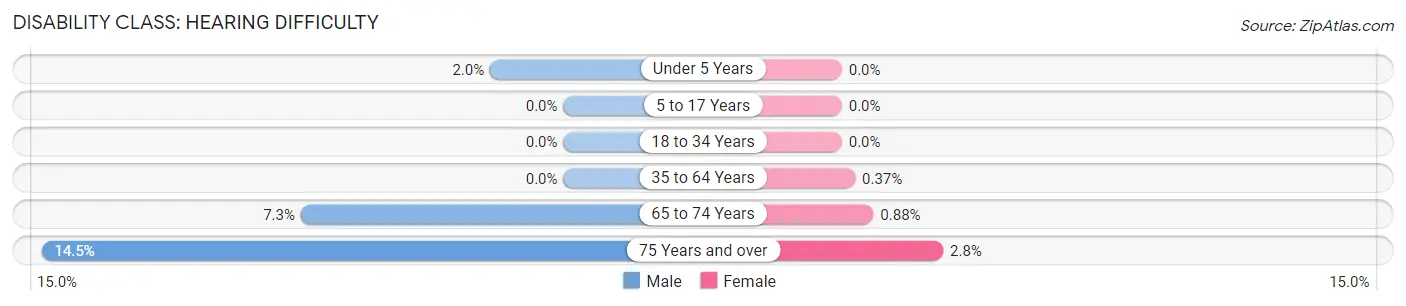
| Age Bracket | Male | Female |
| Under 5 Years | 11 (2.0%) | 0 (0.0%) |
| 5 to 17 Years | 0 (0.0%) | 0 (0.0%) |
| 18 to 34 Years | 0 (0.0%) | 0 (0.0%) |
| 35 to 64 Years | 0 (0.0%) | 12 (0.4%) |
| 65 to 74 Years | 50 (7.3%) | 7 (0.9%) |
| 75 Years and over | 67 (14.5%) | 12 (2.8%) |
Disability Class: Vision Difficulty
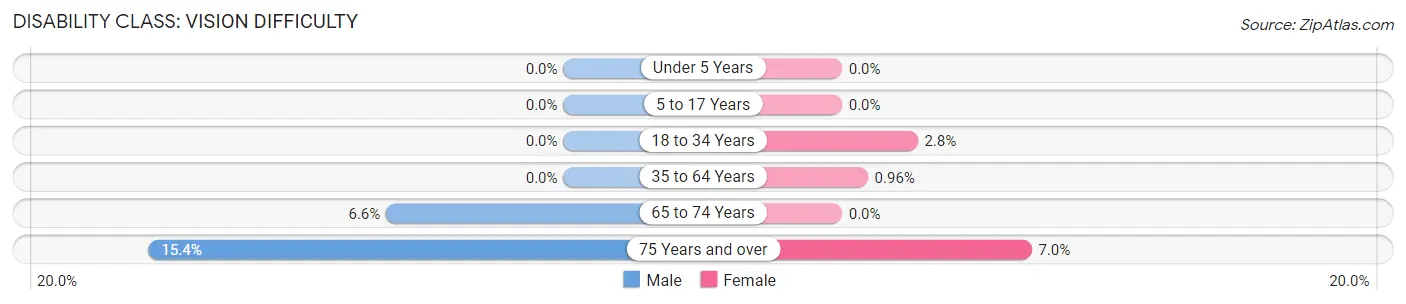
| Age Bracket | Male | Female |
| Under 5 Years | 0 (0.0%) | 0 (0.0%) |
| 5 to 17 Years | 0 (0.0%) | 0 (0.0%) |
| 18 to 34 Years | 0 (0.0%) | 13 (2.8%) |
| 35 to 64 Years | 0 (0.0%) | 31 (1.0%) |
| 65 to 74 Years | 45 (6.6%) | 0 (0.0%) |
| 75 Years and over | 71 (15.4%) | 30 (7.0%) |
Disability Class: Cognitive Difficulty
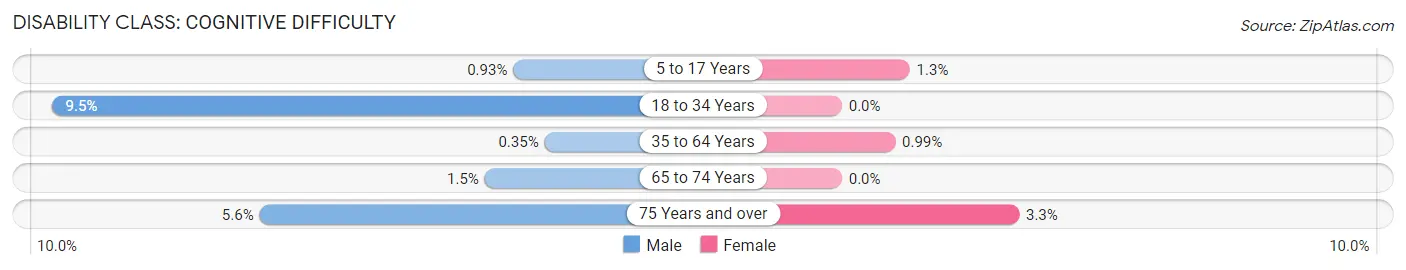
| Age Bracket | Male | Female |
| 5 to 17 Years | 16 (0.9%) | 23 (1.3%) |
| 18 to 34 Years | 69 (9.5%) | 0 (0.0%) |
| 35 to 64 Years | 12 (0.4%) | 32 (1.0%) |
| 65 to 74 Years | 10 (1.5%) | 0 (0.0%) |
| 75 Years and over | 26 (5.6%) | 14 (3.3%) |
Disability Class: Ambulatory Difficulty
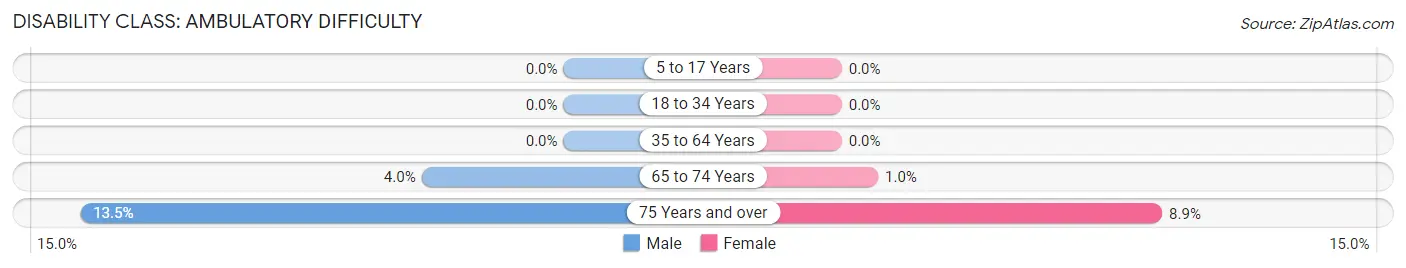
| Age Bracket | Male | Female |
| 5 to 17 Years | 0 (0.0%) | 0 (0.0%) |
| 18 to 34 Years | 0 (0.0%) | 0 (0.0%) |
| 35 to 64 Years | 0 (0.0%) | 0 (0.0%) |
| 65 to 74 Years | 27 (4.0%) | 8 (1.0%) |
| 75 Years and over | 62 (13.5%) | 38 (8.9%) |
Disability Class: Self-Care Difficulty
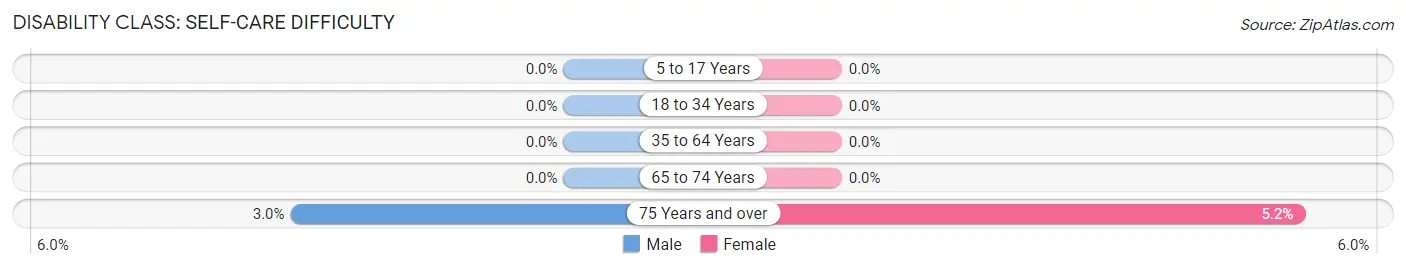
| Age Bracket | Male | Female |
| 5 to 17 Years | 0 (0.0%) | 0 (0.0%) |
| 18 to 34 Years | 0 (0.0%) | 0 (0.0%) |
| 35 to 64 Years | 0 (0.0%) | 0 (0.0%) |
| 65 to 74 Years | 0 (0.0%) | 0 (0.0%) |
| 75 Years and over | 14 (3.0%) | 22 (5.2%) |
Technology Access in West University Place
Computing Device Access in West University Place
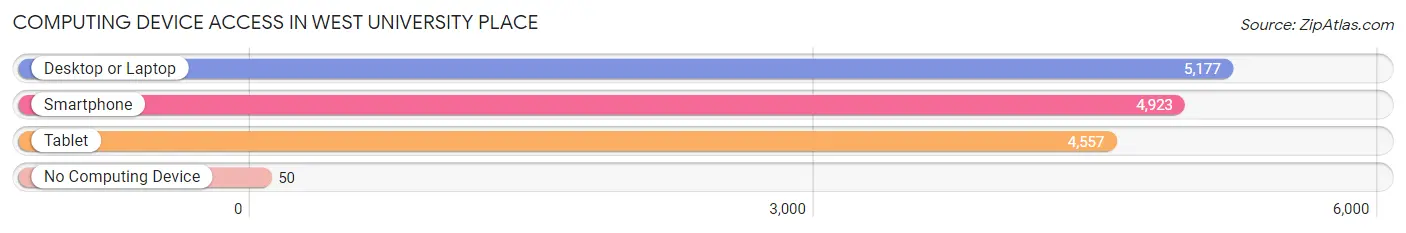
| Device Type | # Households | % Households |
| Desktop or Laptop | 5,177 | 98.7% |
| Smartphone | 4,923 | 93.9% |
| Tablet | 4,557 | 86.9% |
| No Computing Device | 50 | 0.9% |
| Total | 5,245 | 100.0% |
Internet Access in West University Place
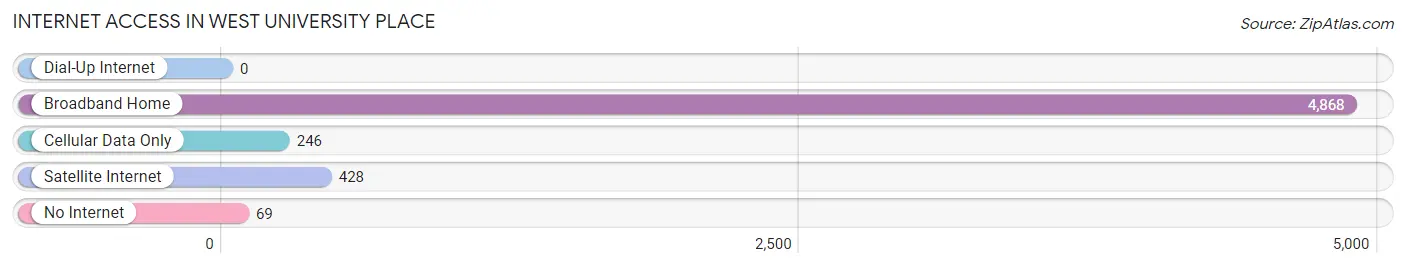
| Internet Type | # Households | % Households |
| Dial-Up Internet | 0 | 0.0% |
| Broadband Home | 4,868 | 92.8% |
| Cellular Data Only | 246 | 4.7% |
| Satellite Internet | 428 | 8.2% |
| No Internet | 69 | 1.3% |
| Total | 5,245 | 100.0% |
West University Place Summary
History
West University Place, Texas, is a small city located in the Houston metropolitan area. It is bordered by the cities of Bellaire, Southside Place, and Houston. The city was founded in 1917 and incorporated in 1924. It is known for its tree-lined streets, high-end homes, and excellent schools.
West University Place was originally part of the John and Augustus Allen land grant, which was granted to them in 1824 by the Mexican government. The land was used for farming and ranching until the early 1900s, when the area began to be developed. The city was named after the University of Houston, which was founded in 1927.
The city was originally developed as a residential suburb of Houston, and it quickly became a popular place to live. The city was known for its high-end homes and tree-lined streets. In the 1950s, the city began to attract more businesses, and it became a popular shopping destination.
In the 1970s, the city began to experience rapid growth, and it became one of the most affluent cities in the Houston area. The city is now home to many high-end shops, restaurants, and businesses.
Geography
West University Place is located in Harris County, Texas, in the Houston metropolitan area. It is bordered by the cities of Bellaire, Southside Place, and Houston. The city is located about 10 miles southwest of downtown Houston.
The city covers an area of 2.7 square miles, and it has a population of approximately 15,000 people. The city is located in a flat, low-lying area, and it is surrounded by several small lakes and ponds. The city is also home to several parks, including the West University Place Park and the West University Place Nature Preserve.
Economy
West University Place is a wealthy city, and it has a strong economy. The city is home to many high-end shops, restaurants, and businesses. The city is also home to several large employers, including the University of Houston, the Houston Independent School District, and the Houston Community College System.
The city also has a strong real estate market, and it is home to many high-end homes. The median home value in the city is $1.2 million, and the median household income is $150,000.
Demographics
West University Place is a diverse city, and it has a population of approximately 15,000 people. The city is predominantly white, with about 70% of the population identifying as white. The city also has a large Asian population, with about 15% of the population identifying as Asian. The city also has a large Hispanic population, with about 10% of the population identifying as Hispanic.
The city has a median age of 40, and the median household income is $150,000. The city also has a high rate of college-educated residents, with about 70% of the population having a college degree.
Common Questions
What is Per Capita Income in West University Place?
Per Capita income in West University Place is $142,082.
What is the Median Family Income in West University Place?
Median Family Income in West University Place is $250,001.
What is the Median Household income in West University Place?
Median Household Income in West University Place is $250,001.
What is Income or Wage Gap in West University Place?
Income or Wage Gap in West University Place is 61.5%.
Women in West University Place earn 38.5 cents for every dollar earned by a man.
What is Inequality or Gini Index in West University Place?
Inequality or Gini Index in West University Place is 0.47.
What is the Total Population of West University Place?
Total Population of West University Place is 14,963.
What is the Total Male Population of West University Place?
Total Male Population of West University Place is 7,618.
What is the Total Female Population of West University Place?
Total Female Population of West University Place is 7,345.
What is the Ratio of Males per 100 Females in West University Place?
There are 103.72 Males per 100 Females in West University Place.
What is the Ratio of Females per 100 Males in West University Place?
There are 96.42 Females per 100 Males in West University Place.
What is the Median Population Age in West University Place?
Median Population Age in West University Place is 41.7 Years.
What is the Average Family Size in West University Place
Average Family Size in West University Place is 3.1 People.
What is the Average Household Size in West University Place
Average Household Size in West University Place is 2.9 People.
How Large is the Labor Force in West University Place?
There are 6,800 People in the Labor Forcein in West University Place.
What is the Percentage of People in the Labor Force in West University Place?
62.6% of People are in the Labor Force in West University Place.
What is the Unemployment Rate in West University Place?
Unemployment Rate in West University Place is 5.7%.