Zip Codes with the Highest Percentage of Population Employed in Architecture & Engineering in Granbury, TX
RELATED REPORTS & OPTIONS
Architecture & Engineering
Granbury
Compare Zip Codes
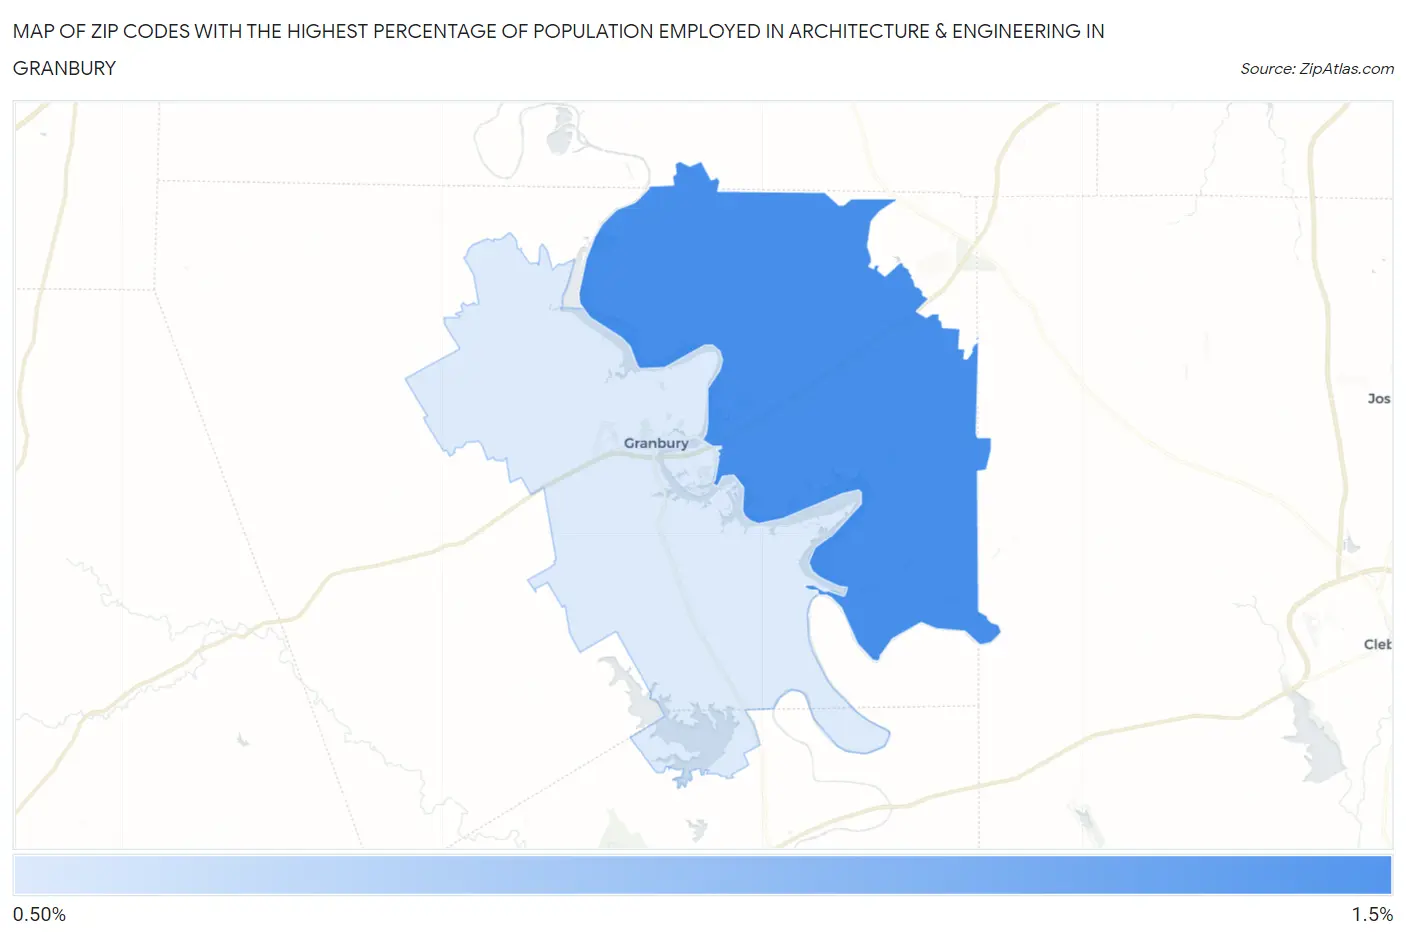
Map of Zip Codes with the Highest Percentage of Population Employed in Architecture & Engineering in Granbury
0.70%
1.5%
Zip Codes with the Highest Percentage of Population Employed in Architecture & Engineering in Granbury, TX
| Zip Code | % Employed | vs State | vs National | |
| 1. | 76049 | 1.5% | 2.2%(-0.723)#706 | 2.1%(-0.650)#12,888 |
| 2. | 76048 | 0.70% | 2.2%(-1.52)#1,027 | 2.1%(-1.45)#18,863 |
1
Common Questions
What are the Top Zip Codes with the Highest Percentage of Population Employed in Architecture & Engineering in Granbury, TX?
Top Zip Codes with the Highest Percentage of Population Employed in Architecture & Engineering in Granbury, TX are:
What zip code has the Highest Percentage of Population Employed in Architecture & Engineering in Granbury, TX?
76049 has the Highest Percentage of Population Employed in Architecture & Engineering in Granbury, TX with 1.5%.
What is the Percentage of Population Employed in Architecture & Engineering in Granbury, TX?
Percentage of Population Employed in Architecture & Engineering in Granbury is 0.96%.
What is the Percentage of Population Employed in Architecture & Engineering in Texas?
Percentage of Population Employed in Architecture & Engineering in Texas is 2.2%.
What is the Percentage of Population Employed in Architecture & Engineering in the United States?
Percentage of Population Employed in Architecture & Engineering in the United States is 2.1%.