Zip Codes with the Highest Percentage of Population Employed in Architecture & Engineering in Denton, TX
RELATED REPORTS & OPTIONS
Architecture & Engineering
Denton
Compare Zip Codes
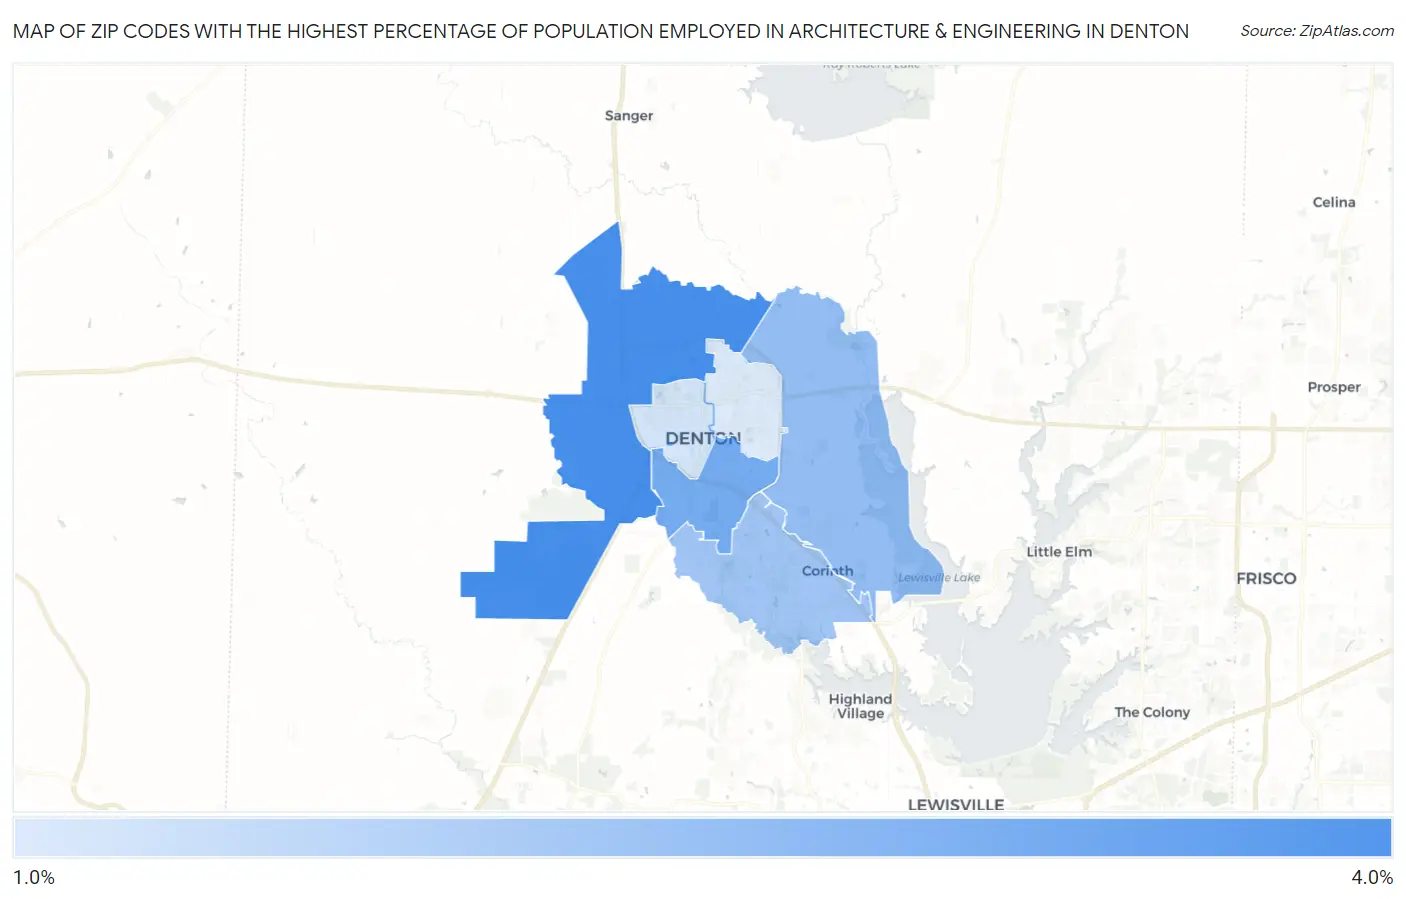
Map of Zip Codes with the Highest Percentage of Population Employed in Architecture & Engineering in Denton
1.3%
3.9%
Zip Codes with the Highest Percentage of Population Employed in Architecture & Engineering in Denton, TX
| Zip Code | % Employed | vs State | vs National | |
| 1. | 76207 | 3.9% | 2.2%(+1.71)#155 | 2.1%(+1.78)#2,885 |
| 2. | 76205 | 3.1% | 2.2%(+0.885)#283 | 2.1%(+0.958)#4,723 |
| 3. | 76208 | 2.6% | 2.2%(+0.350)#366 | 2.1%(+0.423)#6,686 |
| 4. | 76210 | 2.3% | 2.2%(+0.086)#428 | 2.1%(+0.159)#7,900 |
| 5. | 76201 | 1.4% | 2.2%(-0.799)#734 | 2.1%(-0.726)#13,408 |
| 6. | 76209 | 1.3% | 2.2%(-0.946)#786 | 2.1%(-0.873)#14,479 |
1
Common Questions
What are the Top 5 Zip Codes with the Highest Percentage of Population Employed in Architecture & Engineering in Denton, TX?
Top 5 Zip Codes with the Highest Percentage of Population Employed in Architecture & Engineering in Denton, TX are:
What zip code has the Highest Percentage of Population Employed in Architecture & Engineering in Denton, TX?
76207 has the Highest Percentage of Population Employed in Architecture & Engineering in Denton, TX with 3.9%.
What is the Percentage of Population Employed in Architecture & Engineering in Denton, TX?
Percentage of Population Employed in Architecture & Engineering in Denton is 2.1%.
What is the Percentage of Population Employed in Architecture & Engineering in Texas?
Percentage of Population Employed in Architecture & Engineering in Texas is 2.2%.
What is the Percentage of Population Employed in Architecture & Engineering in the United States?
Percentage of Population Employed in Architecture & Engineering in the United States is 2.1%.