Cinco Ranch, TX Map & Demographics
Cinco Ranch Map
Cinco Ranch Overview
$57,221
PER CAPITA INCOME
$165,268
AVG FAMILY INCOME
$152,074
AVG HOUSEHOLD INCOME
70.5%
WAGE / INCOME GAP [ % ]
29.5¢/ $1
WAGE / INCOME GAP [ $ ]
0.40
INEQUALITY / GINI INDEX
18,856
TOTAL POPULATION
9,145
MALE POPULATION
9,711
FEMALE POPULATION
94.17
MALES / 100 FEMALES
106.19
FEMALES / 100 MALES
38.6
MEDIAN AGE
3.4
AVG FAMILY SIZE
3.1
AVG HOUSEHOLD SIZE
8,725
LABOR FORCE [ PEOPLE ]
61.3%
PERCENT IN LABOR FORCE
4.6%
UNEMPLOYMENT RATE
Income in Cinco Ranch
Income Overview in Cinco Ranch
Per Capita Income in Cinco Ranch is $57,221, while median incomes of families and households are $165,268 and $152,074 respectively.
| Characteristic | Number | Measure |
| Per Capita Income | 18,856 | $57,221 |
| Median Family Income | 5,359 | $165,268 |
| Mean Family Income | 5,359 | $180,271 |
| Median Household Income | 6,161 | $152,074 |
| Mean Household Income | 6,161 | $174,193 |
| Income Deficit | 5,359 | $0 |
| Wage / Income Gap (%) | 18,856 | 70.52% |
| Wage / Income Gap ($) | 18,856 | 29.48¢ per $1 |
| Gini / Inequality Index | 18,856 | 0.40 |
Earnings by Sex in Cinco Ranch
Average Earnings in Cinco Ranch are $61,894, $111,357 for men and $32,833 for women, a difference of 70.5%.
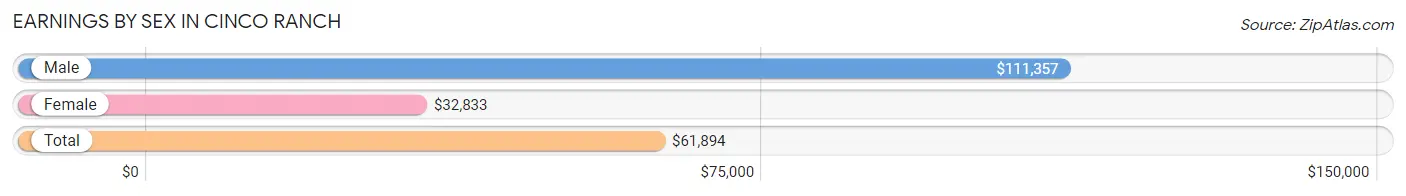
| Sex | Number | Average Earnings |
| Male | 5,220 (54.3%) | $111,357 |
| Female | 4,400 (45.7%) | $32,833 |
| Total | 9,620 (100.0%) | $61,894 |
Earnings by Sex by Income Bracket in Cinco Ranch
The most common earnings brackets in Cinco Ranch are $100,000+ for men (2,711 | 51.9%) and $2,500 to $4,999 for women (831 | 18.9%).
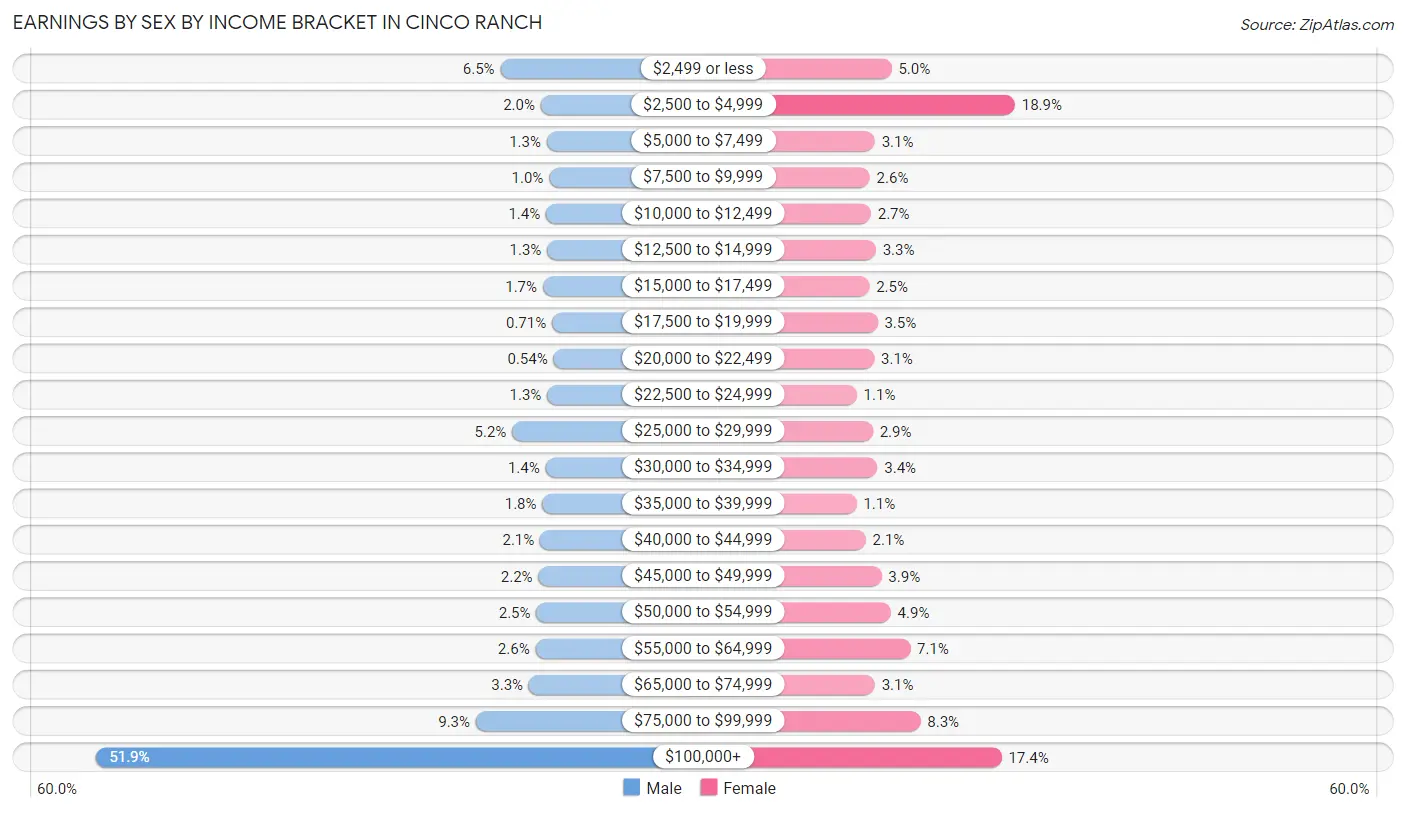
| Income | Male | Female |
| $2,499 or less | 340 (6.5%) | 221 (5.0%) |
| $2,500 to $4,999 | 103 (2.0%) | 831 (18.9%) |
| $5,000 to $7,499 | 68 (1.3%) | 138 (3.1%) |
| $7,500 to $9,999 | 54 (1.0%) | 113 (2.6%) |
| $10,000 to $12,499 | 72 (1.4%) | 119 (2.7%) |
| $12,500 to $14,999 | 66 (1.3%) | 143 (3.3%) |
| $15,000 to $17,499 | 91 (1.7%) | 111 (2.5%) |
| $17,500 to $19,999 | 37 (0.7%) | 152 (3.5%) |
| $20,000 to $22,499 | 28 (0.5%) | 135 (3.1%) |
| $22,500 to $24,999 | 66 (1.3%) | 49 (1.1%) |
| $25,000 to $29,999 | 271 (5.2%) | 128 (2.9%) |
| $30,000 to $34,999 | 75 (1.4%) | 151 (3.4%) |
| $35,000 to $39,999 | 94 (1.8%) | 48 (1.1%) |
| $40,000 to $44,999 | 107 (2.1%) | 93 (2.1%) |
| $45,000 to $49,999 | 117 (2.2%) | 171 (3.9%) |
| $50,000 to $54,999 | 129 (2.5%) | 217 (4.9%) |
| $55,000 to $64,999 | 134 (2.6%) | 313 (7.1%) |
| $65,000 to $74,999 | 173 (3.3%) | 138 (3.1%) |
| $75,000 to $99,999 | 484 (9.3%) | 364 (8.3%) |
| $100,000+ | 2,711 (51.9%) | 765 (17.4%) |
| Total | 5,220 (100.0%) | 4,400 (100.0%) |
Earnings by Sex by Educational Attainment in Cinco Ranch
Average earnings in Cinco Ranch are $130,076 for men and $41,927 for women, a difference of 67.8%. Men with an educational attainment of graduate degree enjoy the highest average annual earnings of $163,517, while those with high school diploma education earn the least with $29,028. Women with an educational attainment of bachelor's degree earn the most with the average annual earnings of $52,011, while those with high school diploma education have the smallest earnings of $42,500.
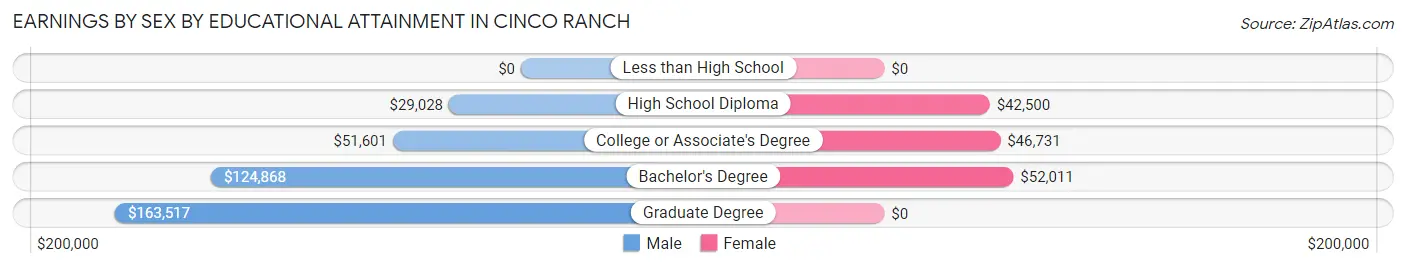
| Educational Attainment | Male Income | Female Income |
| Less than High School | - | - |
| High School Diploma | $29,028 | $42,500 |
| College or Associate's Degree | $51,601 | $46,731 |
| Bachelor's Degree | $124,868 | $52,011 |
| Graduate Degree | $163,517 | $0 |
| Total | $130,076 | $41,927 |
Family Income in Cinco Ranch
Family Income Brackets in Cinco Ranch
According to the Cinco Ranch family income data, there are 1,817 families falling into the $200,000+ income range, which is the most common income bracket and makes up 33.9% of all families. Conversely, the less than $10,000 income bracket is the least frequent group with only 21 families (0.4%) belonging to this category.
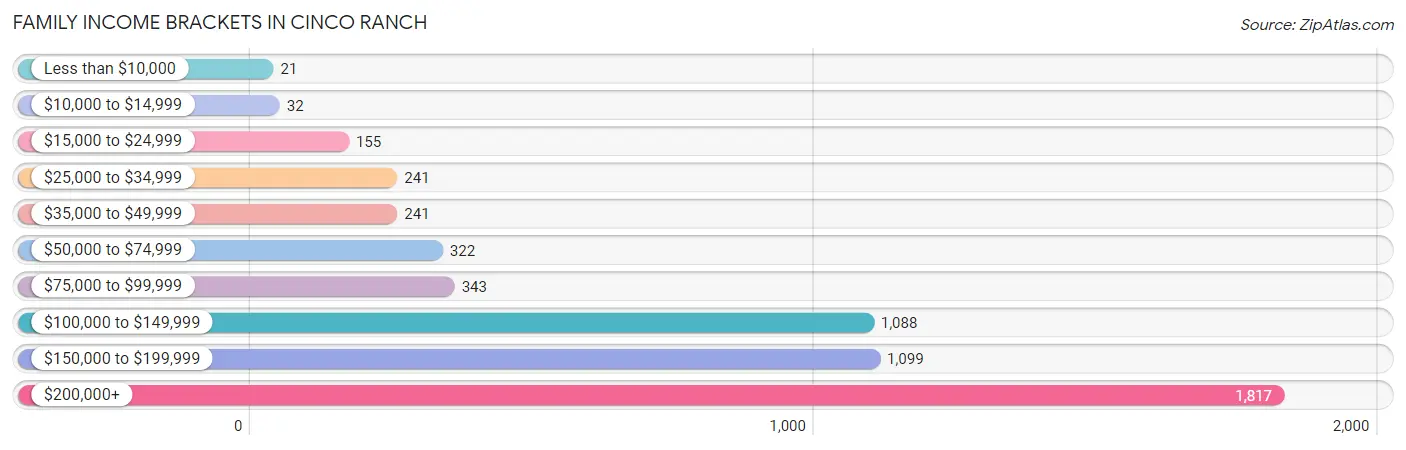
| Income Bracket | # Families | % Families |
| Less than $10,000 | 21 | 0.4% |
| $10,000 to $14,999 | 32 | 0.6% |
| $15,000 to $24,999 | 155 | 2.9% |
| $25,000 to $34,999 | 241 | 4.5% |
| $35,000 to $49,999 | 241 | 4.5% |
| $50,000 to $74,999 | 322 | 6.0% |
| $75,000 to $99,999 | 343 | 6.4% |
| $100,000 to $149,999 | 1,088 | 20.3% |
| $150,000 to $199,999 | 1,099 | 20.5% |
| $200,000+ | 1,817 | 33.9% |
Family Income by Famaliy Size in Cinco Ranch
6-person families (153 | 2.9%) account for the highest median family income in Cinco Ranch with $214,063 per family, while 2-person families (1,608 | 30.0%) have the highest median income of $57,458 per family member.
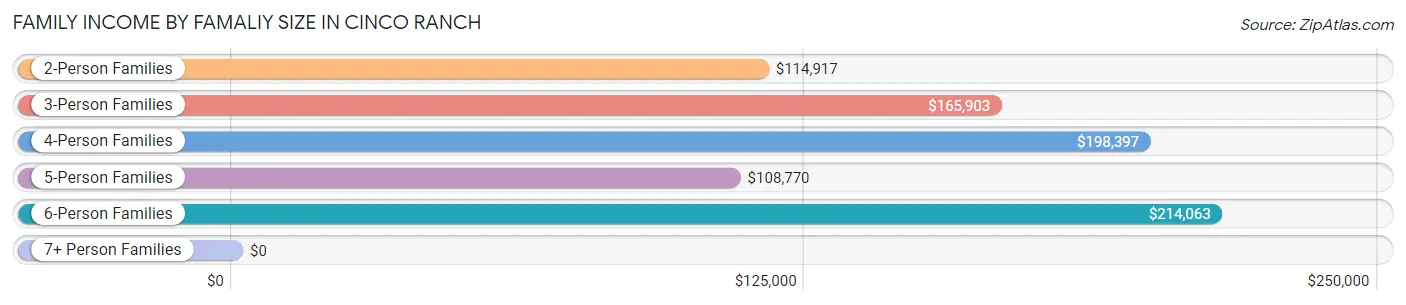
| Income Bracket | # Families | Median Income |
| 2-Person Families | 1,608 (30.0%) | $114,917 |
| 3-Person Families | 1,667 (31.1%) | $165,903 |
| 4-Person Families | 1,378 (25.7%) | $198,397 |
| 5-Person Families | 537 (10.0%) | $108,770 |
| 6-Person Families | 153 (2.9%) | $214,063 |
| 7+ Person Families | 16 (0.3%) | $0 |
| Total | 5,359 (100.0%) | $165,268 |
Family Income by Number of Earners in Cinco Ranch
The median family income in Cinco Ranch is $165,268, with families comprising 3+ earners (704) having the highest median family income of $222,027, while families with no earners (565) have the lowest median family income of $92,721, accounting for 13.1% and 10.5% of families, respectively.
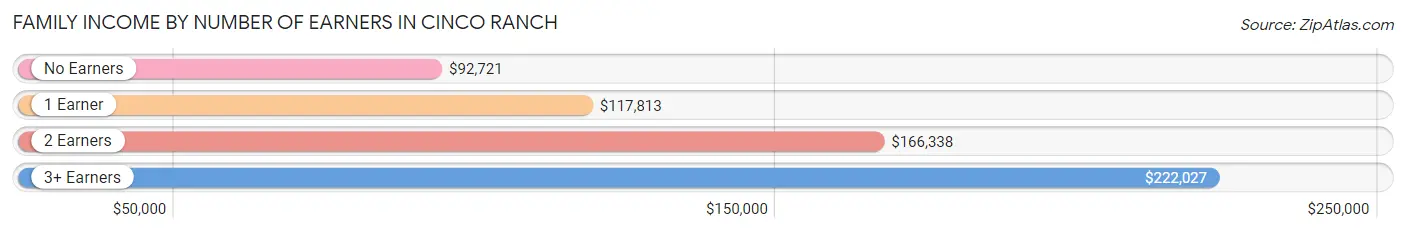
| Number of Earners | # Families | Median Income |
| No Earners | 565 (10.5%) | $92,721 |
| 1 Earner | 1,451 (27.1%) | $117,813 |
| 2 Earners | 2,639 (49.2%) | $166,338 |
| 3+ Earners | 704 (13.1%) | $222,027 |
| Total | 5,359 (100.0%) | $165,268 |
Household Income in Cinco Ranch
Household Income Brackets in Cinco Ranch
With 1,959 households falling in the category, the $200,000+ income range is the most frequent in Cinco Ranch, accounting for 31.8% of all households. In contrast, only 43 households (0.7%) fall into the $10,000 to $14,999 income bracket, making it the least populous group.
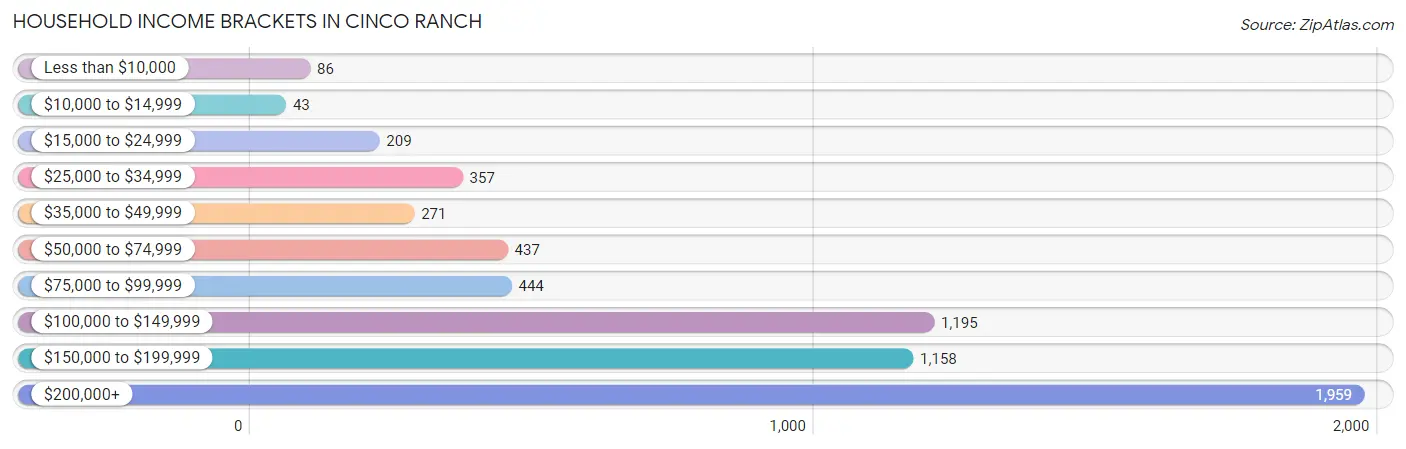
| Income Bracket | # Households | % Households |
| Less than $10,000 | 86 | 1.4% |
| $10,000 to $14,999 | 43 | 0.7% |
| $15,000 to $24,999 | 209 | 3.4% |
| $25,000 to $34,999 | 357 | 5.8% |
| $35,000 to $49,999 | 271 | 4.4% |
| $50,000 to $74,999 | 437 | 7.1% |
| $75,000 to $99,999 | 444 | 7.2% |
| $100,000 to $149,999 | 1,195 | 19.4% |
| $150,000 to $199,999 | 1,158 | 18.8% |
| $200,000+ | 1,959 | 31.8% |
Household Income by Householder Age in Cinco Ranch
The median household income in Cinco Ranch is $152,074, with the highest median household income of $182,951 found in the 45 to 64 years age bracket for the primary householder. A total of 2,543 households (41.3%) fall into this category. Meanwhile, the 15 to 24 years age bracket for the primary householder has the lowest median household income of $0, with 43 households (0.7%) in this group.
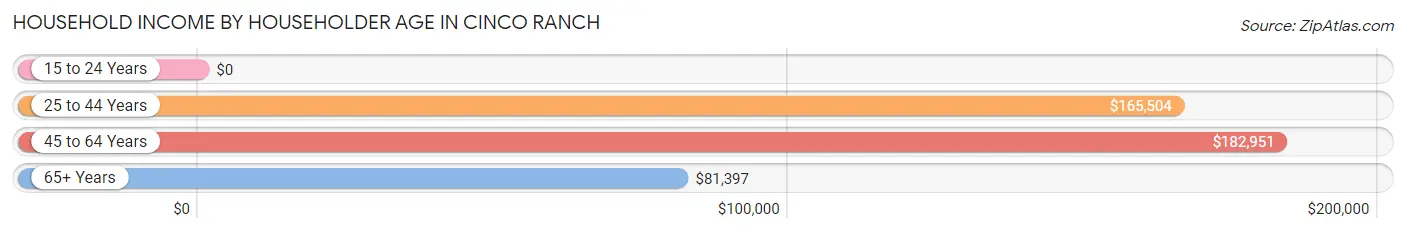
| Income Bracket | # Households | Median Income |
| 15 to 24 Years | 43 (0.7%) | $0 |
| 25 to 44 Years | 2,354 (38.2%) | $165,504 |
| 45 to 64 Years | 2,543 (41.3%) | $182,951 |
| 65+ Years | 1,221 (19.8%) | $81,397 |
| Total | 6,161 (100.0%) | $152,074 |
Poverty in Cinco Ranch
Income Below Poverty by Sex and Age in Cinco Ranch
With 6.0% poverty level for males and 7.7% for females among the residents of Cinco Ranch, under 5 year old males and under 5 year old females are the most vulnerable to poverty, with 149 males (24.6%) and 181 females (21.6%) in their respective age groups living below the poverty level.
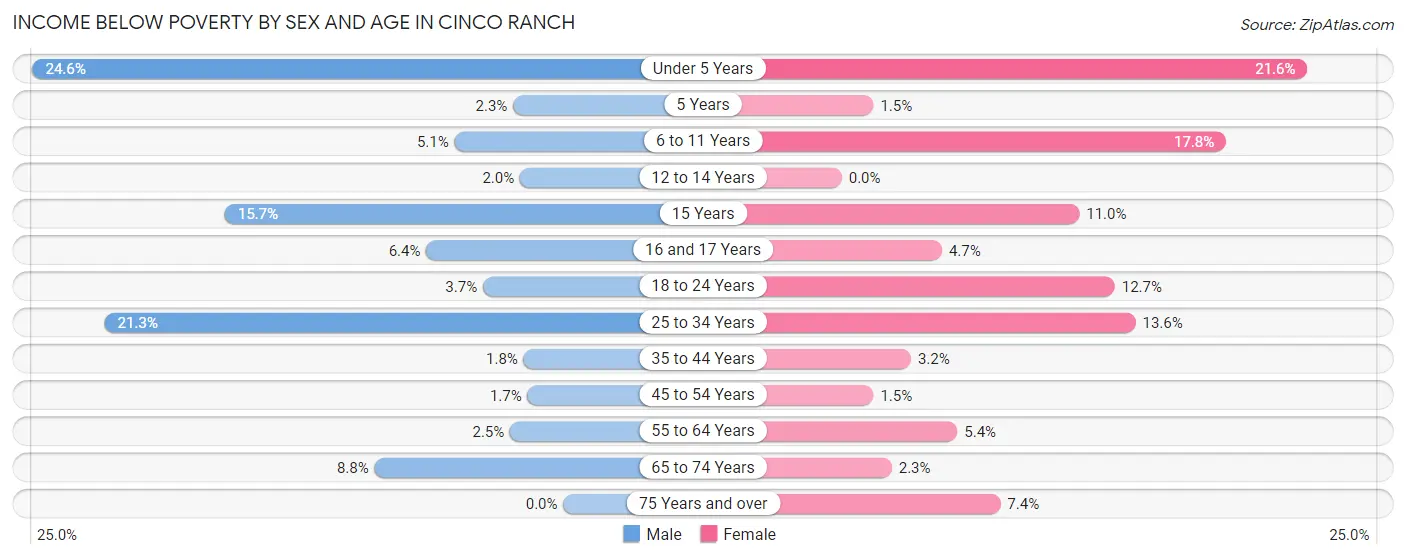
| Age Bracket | Male | Female |
| Under 5 Years | 149 (24.6%) | 181 (21.6%) |
| 5 Years | 10 (2.3%) | 3 (1.5%) |
| 6 to 11 Years | 40 (5.1%) | 138 (17.8%) |
| 12 to 14 Years | 7 (2.0%) | 0 (0.0%) |
| 15 Years | 11 (15.7%) | 14 (11.0%) |
| 16 and 17 Years | 26 (6.4%) | 27 (4.6%) |
| 18 to 24 Years | 18 (3.7%) | 64 (12.7%) |
| 25 to 34 Years | 145 (21.3%) | 137 (13.6%) |
| 35 to 44 Years | 28 (1.8%) | 58 (3.2%) |
| 45 to 54 Years | 23 (1.7%) | 17 (1.5%) |
| 55 to 64 Years | 31 (2.5%) | 60 (5.4%) |
| 65 to 74 Years | 64 (8.8%) | 15 (2.3%) |
| 75 Years and over | 0 (0.0%) | 38 (7.4%) |
| Total | 552 (6.0%) | 752 (7.7%) |
Income Above Poverty by Sex and Age in Cinco Ranch
According to the poverty statistics in Cinco Ranch, males aged 75 years and over and females aged 12 to 14 years are the age groups that are most secure financially, with 100.0% of males and 100.0% of females in these age groups living above the poverty line.
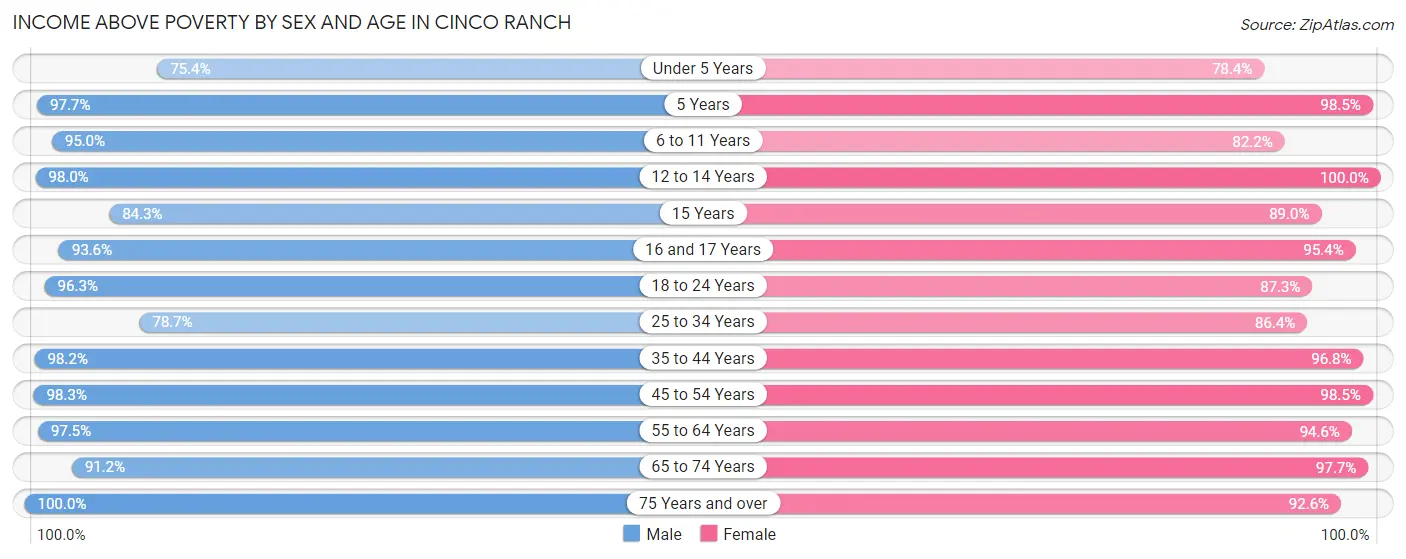
| Age Bracket | Male | Female |
| Under 5 Years | 456 (75.4%) | 657 (78.4%) |
| 5 Years | 419 (97.7%) | 201 (98.5%) |
| 6 to 11 Years | 752 (95.0%) | 636 (82.2%) |
| 12 to 14 Years | 342 (98.0%) | 435 (100.0%) |
| 15 Years | 59 (84.3%) | 113 (89.0%) |
| 16 and 17 Years | 383 (93.6%) | 554 (95.4%) |
| 18 to 24 Years | 464 (96.3%) | 441 (87.3%) |
| 25 to 34 Years | 536 (78.7%) | 868 (86.4%) |
| 35 to 44 Years | 1,497 (98.2%) | 1,749 (96.8%) |
| 45 to 54 Years | 1,364 (98.3%) | 1,137 (98.5%) |
| 55 to 64 Years | 1,226 (97.5%) | 1,059 (94.6%) |
| 65 to 74 Years | 667 (91.2%) | 631 (97.7%) |
| 75 Years and over | 428 (100.0%) | 478 (92.6%) |
| Total | 8,593 (94.0%) | 8,959 (92.3%) |
Income Below Poverty Among Married-Couple Families in Cinco Ranch
The poverty statistics for married-couple families in Cinco Ranch show that 4.1% or 206 of the total 4,981 families live below the poverty line. Families with 3 or 4 children have the highest poverty rate of 20.4%, comprising of 96 families. On the other hand, families with 1 or 2 children have the lowest poverty rate of 1.0%, which includes 25 families.
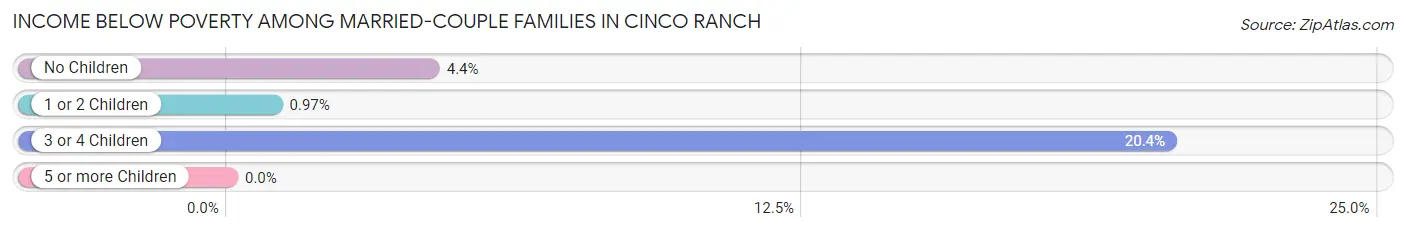
| Children | Above Poverty | Below Poverty |
| No Children | 1,853 (95.6%) | 85 (4.4%) |
| 1 or 2 Children | 2,548 (99.0%) | 25 (1.0%) |
| 3 or 4 Children | 374 (79.6%) | 96 (20.4%) |
| 5 or more Children | 0 (0.0%) | 0 (0.0%) |
| Total | 4,775 (95.9%) | 206 (4.1%) |
Income Below Poverty Among Single-Parent Households in Cinco Ranch
According to the poverty data in Cinco Ranch, 15.1% or 13 single-father households and 17.1% or 50 single-mother households are living below the poverty line. Among single-father households, those with no children have the highest poverty rate, with 13 households (18.1%) experiencing poverty. Likewise, among single-mother households, those with 3 or 4 children have the highest poverty rate, with 23 households (100.0%) falling below the poverty line.
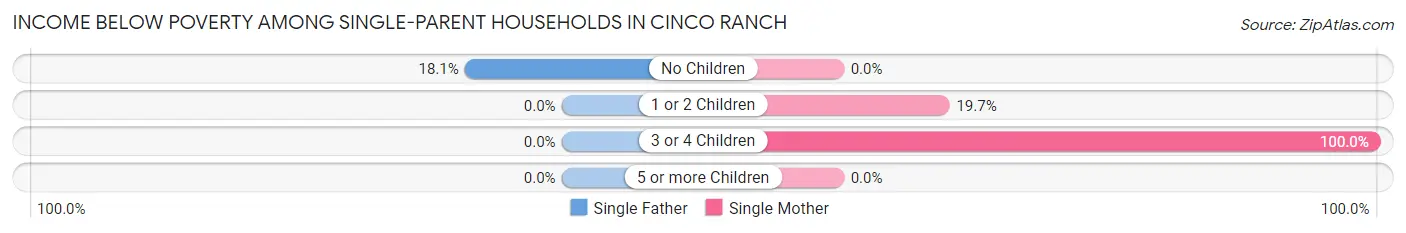
| Children | Single Father | Single Mother |
| No Children | 13 (18.1%) | 0 (0.0%) |
| 1 or 2 Children | 0 (0.0%) | 27 (19.7%) |
| 3 or 4 Children | 0 (0.0%) | 23 (100.0%) |
| 5 or more Children | 0 (0.0%) | 0 (0.0%) |
| Total | 13 (15.1%) | 50 (17.1%) |
Income Below Poverty Among Married-Couple vs Single-Parent Households in Cinco Ranch
The poverty data for Cinco Ranch shows that 206 of the married-couple family households (4.1%) and 63 of the single-parent households (16.7%) are living below the poverty level. Within the married-couple family households, those with 3 or 4 children have the highest poverty rate, with 96 households (20.4%) falling below the poverty line. Among the single-parent households, those with 3 or 4 children have the highest poverty rate, with 23 household (82.1%) living below poverty.
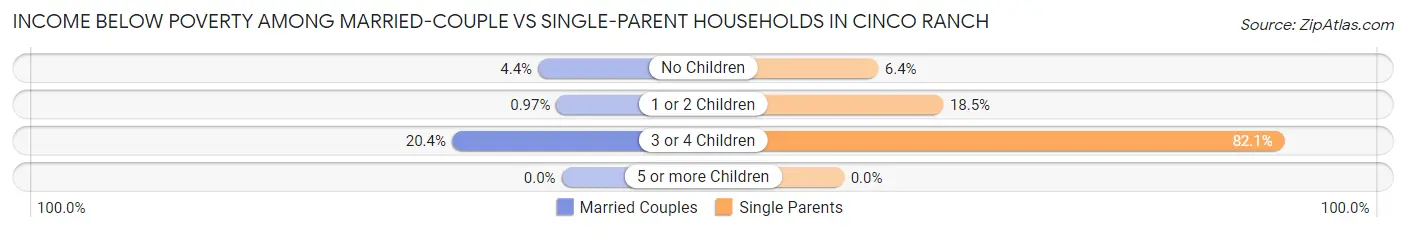
| Children | Married-Couple Families | Single-Parent Households |
| No Children | 85 (4.4%) | 13 (6.4%) |
| 1 or 2 Children | 25 (1.0%) | 27 (18.5%) |
| 3 or 4 Children | 96 (20.4%) | 23 (82.1%) |
| 5 or more Children | 0 (0.0%) | 0 (0.0%) |
| Total | 206 (4.1%) | 63 (16.7%) |
Race in Cinco Ranch
The most populous races in Cinco Ranch are White / Caucasian (11,556 | 61.3%), Hispanic or Latino (5,065 | 26.9%), and Two or more Races (2,832 | 15.0%).
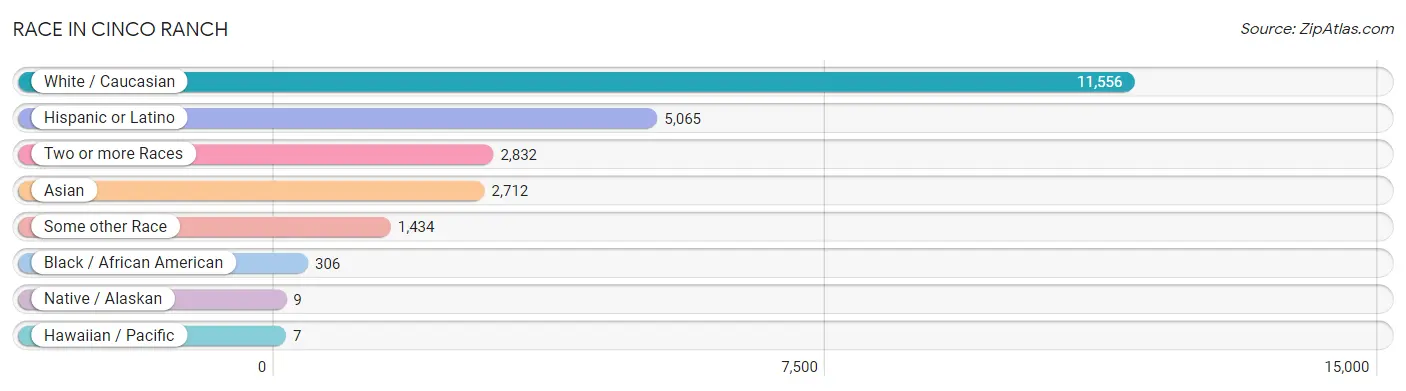
| Race | # Population | % Population |
| Asian | 2,712 | 14.4% |
| Black / African American | 306 | 1.6% |
| Hawaiian / Pacific | 7 | 0.0% |
| Hispanic or Latino | 5,065 | 26.9% |
| Native / Alaskan | 9 | 0.1% |
| White / Caucasian | 11,556 | 61.3% |
| Two or more Races | 2,832 | 15.0% |
| Some other Race | 1,434 | 7.6% |
| Total | 18,856 | 100.0% |
Ancestry in Cinco Ranch
The most populous ancestries reported in Cinco Ranch are German (2,281 | 12.1%), Mexican (1,673 | 8.9%), Irish (1,669 | 8.8%), English (1,551 | 8.2%), and South American (1,389 | 7.4%), together accounting for 45.4% of all Cinco Ranch residents.
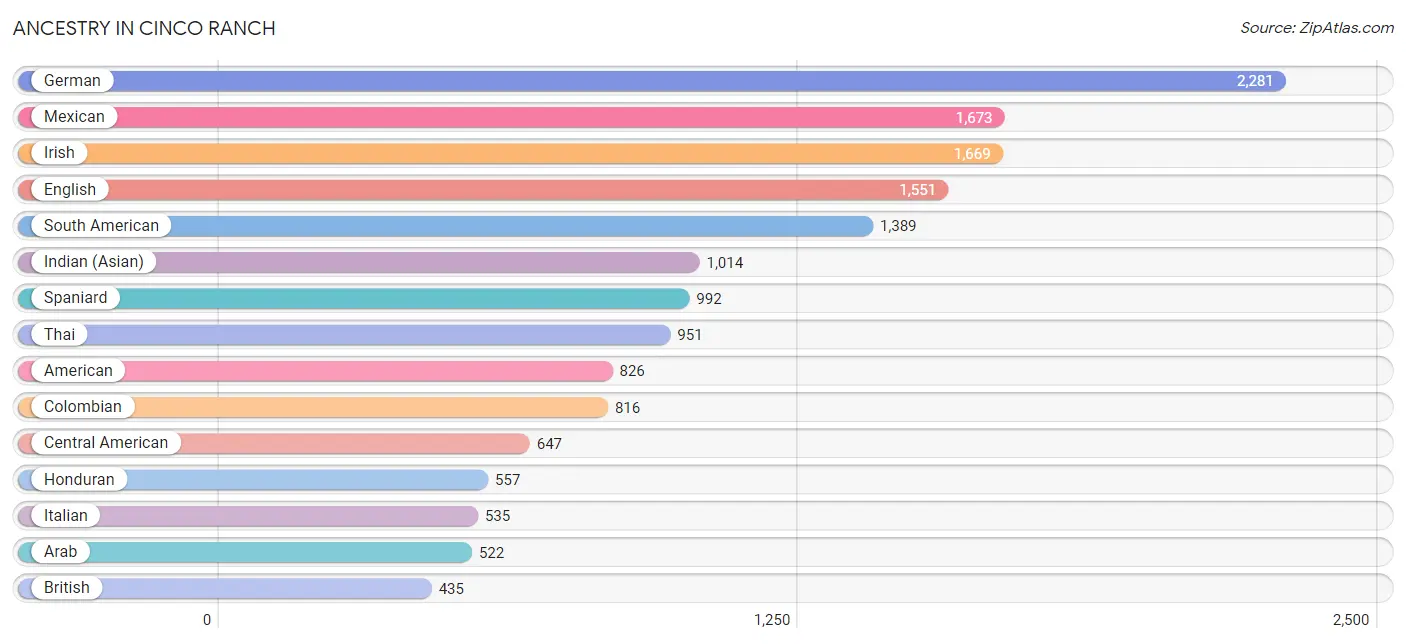
| Ancestry | # Population | % Population |
| African | 8 | 0.0% |
| American | 826 | 4.4% |
| Arab | 522 | 2.8% |
| Argentinean | 25 | 0.1% |
| Armenian | 48 | 0.3% |
| Austrian | 28 | 0.2% |
| Bhutanese | 143 | 0.8% |
| Brazilian | 100 | 0.5% |
| British | 435 | 2.3% |
| Burmese | 131 | 0.7% |
| Canadian | 133 | 0.7% |
| Central American | 647 | 3.4% |
| Cherokee | 8 | 0.0% |
| Chickasaw | 2 | 0.0% |
| Chilean | 42 | 0.2% |
| Choctaw | 7 | 0.0% |
| Colombian | 816 | 4.3% |
| Costa Rican | 77 | 0.4% |
| Cuban | 293 | 1.5% |
| Czech | 354 | 1.9% |
| Czechoslovakian | 16 | 0.1% |
| Danish | 115 | 0.6% |
| Dutch | 64 | 0.3% |
| Eastern European | 17 | 0.1% |
| Ecuadorian | 66 | 0.4% |
| English | 1,551 | 8.2% |
| European | 328 | 1.7% |
| Filipino | 99 | 0.5% |
| French | 387 | 2.1% |
| French Canadian | 142 | 0.7% |
| German | 2,281 | 12.1% |
| Greek | 70 | 0.4% |
| Guamanian / Chamorro | 36 | 0.2% |
| Guatemalan | 13 | 0.1% |
| Honduran | 557 | 2.9% |
| Hungarian | 155 | 0.8% |
| Icelander | 22 | 0.1% |
| Indian (Asian) | 1,014 | 5.4% |
| Iranian | 183 | 1.0% |
| Irish | 1,669 | 8.8% |
| Italian | 535 | 2.8% |
| Jamaican | 14 | 0.1% |
| Jordanian | 18 | 0.1% |
| Korean | 65 | 0.3% |
| Lebanese | 325 | 1.7% |
| Lithuanian | 9 | 0.1% |
| Mexican | 1,673 | 8.9% |
| Nigerian | 126 | 0.7% |
| Norwegian | 108 | 0.6% |
| Pakistani | 36 | 0.2% |
| Palestinian | 110 | 0.6% |
| Peruvian | 109 | 0.6% |
| Polish | 356 | 1.9% |
| Portuguese | 137 | 0.7% |
| Puerto Rican | 53 | 0.3% |
| Romanian | 16 | 0.1% |
| Russian | 94 | 0.5% |
| Samoan | 37 | 0.2% |
| Scandinavian | 59 | 0.3% |
| Scotch-Irish | 165 | 0.9% |
| Scottish | 422 | 2.2% |
| Serbian | 6 | 0.0% |
| Slavic | 17 | 0.1% |
| South African | 25 | 0.1% |
| South American | 1,389 | 7.4% |
| Spaniard | 992 | 5.3% |
| Spanish | 18 | 0.1% |
| Sri Lankan | 334 | 1.8% |
| Subsaharan African | 159 | 0.8% |
| Swedish | 260 | 1.4% |
| Swiss | 56 | 0.3% |
| Thai | 951 | 5.0% |
| Turkish | 6 | 0.0% |
| Ukrainian | 37 | 0.2% |
| Venezuelan | 331 | 1.8% |
| Welsh | 86 | 0.5% |
| Yugoslavian | 44 | 0.2% | View All 77 Rows |
Immigrants in Cinco Ranch
The most numerous immigrant groups reported in Cinco Ranch came from Asia (2,256 | 12.0%), Latin America (2,050 | 10.9%), Europe (1,995 | 10.6%), South America (1,148 | 6.1%), and South Central Asia (958 | 5.1%), together accounting for 44.6% of all Cinco Ranch residents.
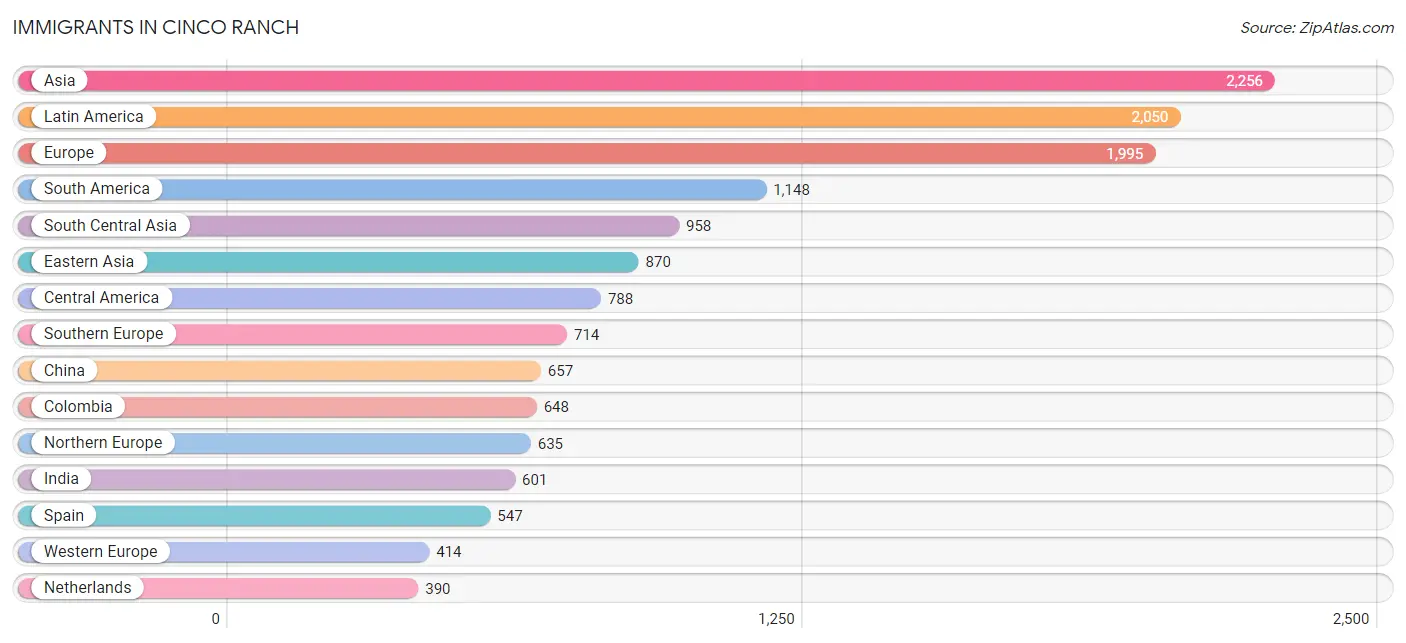
| Immigration Origin | # Population | % Population |
| Africa | 191 | 1.0% |
| Armenia | 18 | 0.1% |
| Asia | 2,256 | 12.0% |
| Austria | 7 | 0.0% |
| Belgium | 17 | 0.1% |
| Bosnia and Herzegovina | 14 | 0.1% |
| Brazil | 65 | 0.3% |
| Canada | 142 | 0.7% |
| Caribbean | 114 | 0.6% |
| Central America | 788 | 4.2% |
| Chile | 42 | 0.2% |
| China | 657 | 3.5% |
| Colombia | 648 | 3.4% |
| Costa Rica | 75 | 0.4% |
| Cuba | 114 | 0.6% |
| Eastern Asia | 870 | 4.6% |
| Eastern Europe | 232 | 1.2% |
| Ecuador | 48 | 0.3% |
| Egypt | 25 | 0.1% |
| El Salvador | 76 | 0.4% |
| England | 48 | 0.3% |
| Europe | 1,995 | 10.6% |
| Guatemala | 13 | 0.1% |
| Honduras | 243 | 1.3% |
| Hong Kong | 70 | 0.4% |
| Hungary | 119 | 0.6% |
| India | 601 | 3.2% |
| Iran | 153 | 0.8% |
| Ireland | 6 | 0.0% |
| Italy | 156 | 0.8% |
| Japan | 134 | 0.7% |
| Jordan | 18 | 0.1% |
| Kazakhstan | 6 | 0.0% |
| Korea | 79 | 0.4% |
| Kuwait | 14 | 0.1% |
| Latin America | 2,050 | 10.9% |
| Lebanon | 112 | 0.6% |
| Mexico | 381 | 2.0% |
| Netherlands | 390 | 2.1% |
| Nigeria | 126 | 0.7% |
| Northern Africa | 49 | 0.3% |
| Northern Europe | 635 | 3.4% |
| Norway | 11 | 0.1% |
| Oceania | 35 | 0.2% |
| Pakistan | 65 | 0.3% |
| Peru | 71 | 0.4% |
| Philippines | 5 | 0.0% |
| Poland | 13 | 0.1% |
| Portugal | 11 | 0.1% |
| Romania | 16 | 0.1% |
| Russia | 12 | 0.1% |
| Scotland | 265 | 1.4% |
| Sierra Leone | 8 | 0.0% |
| South Africa | 8 | 0.0% |
| South America | 1,148 | 6.1% |
| South Central Asia | 958 | 5.1% |
| South Eastern Asia | 116 | 0.6% |
| Southern Europe | 714 | 3.8% |
| Spain | 547 | 2.9% |
| Sri Lanka | 111 | 0.6% |
| Sweden | 12 | 0.1% |
| Syria | 12 | 0.1% |
| Taiwan | 42 | 0.2% |
| Uzbekistan | 22 | 0.1% |
| Venezuela | 274 | 1.5% |
| Vietnam | 111 | 0.6% |
| Western Africa | 134 | 0.7% |
| Western Asia | 220 | 1.2% |
| Western Europe | 414 | 2.2% | View All 69 Rows |
Sex and Age in Cinco Ranch
Sex and Age in Cinco Ranch
The most populous age groups in Cinco Ranch are 35 to 39 Years (1,065 | 11.7%) for men and 40 to 44 Years (1,206 | 12.4%) for women.
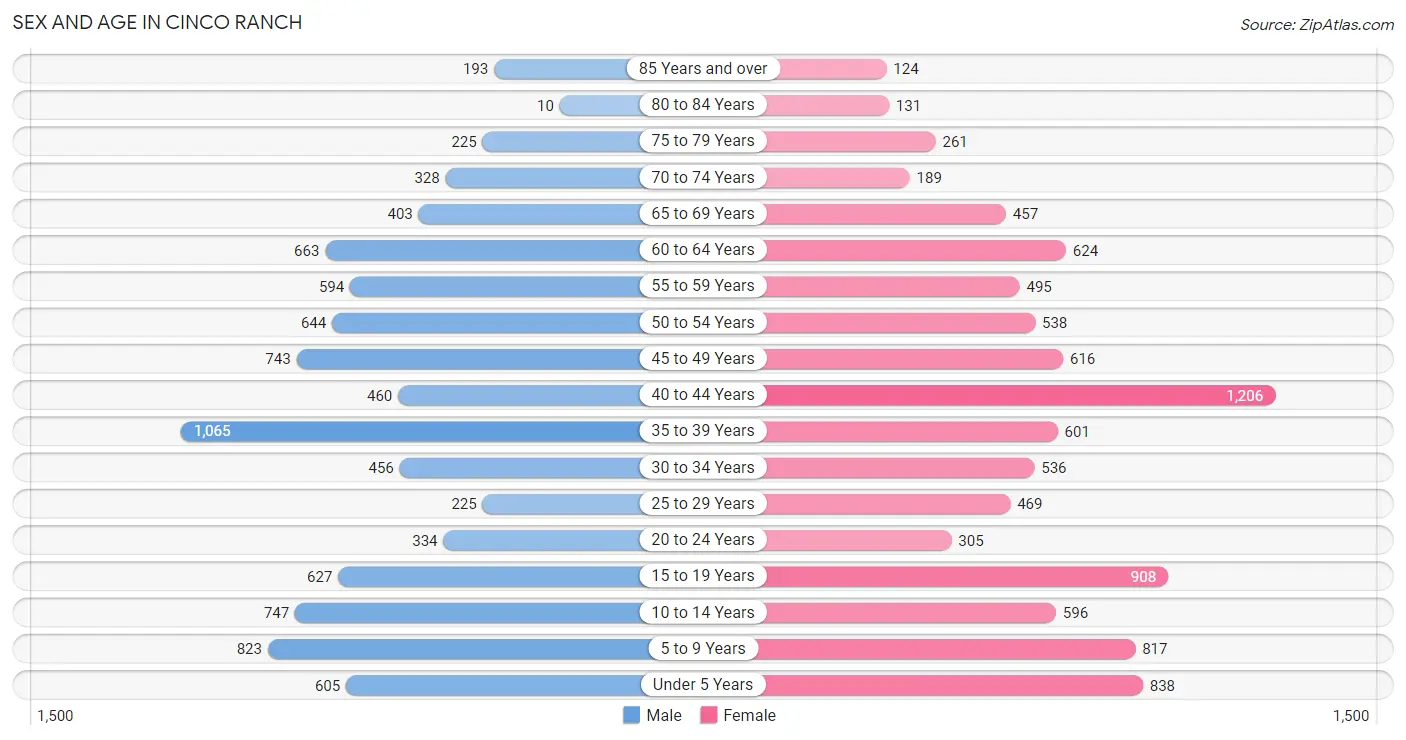
| Age Bracket | Male | Female |
| Under 5 Years | 605 (6.6%) | 838 (8.6%) |
| 5 to 9 Years | 823 (9.0%) | 817 (8.4%) |
| 10 to 14 Years | 747 (8.2%) | 596 (6.1%) |
| 15 to 19 Years | 627 (6.9%) | 908 (9.3%) |
| 20 to 24 Years | 334 (3.6%) | 305 (3.1%) |
| 25 to 29 Years | 225 (2.5%) | 469 (4.8%) |
| 30 to 34 Years | 456 (5.0%) | 536 (5.5%) |
| 35 to 39 Years | 1,065 (11.7%) | 601 (6.2%) |
| 40 to 44 Years | 460 (5.0%) | 1,206 (12.4%) |
| 45 to 49 Years | 743 (8.1%) | 616 (6.3%) |
| 50 to 54 Years | 644 (7.0%) | 538 (5.5%) |
| 55 to 59 Years | 594 (6.5%) | 495 (5.1%) |
| 60 to 64 Years | 663 (7.2%) | 624 (6.4%) |
| 65 to 69 Years | 403 (4.4%) | 457 (4.7%) |
| 70 to 74 Years | 328 (3.6%) | 189 (1.9%) |
| 75 to 79 Years | 225 (2.5%) | 261 (2.7%) |
| 80 to 84 Years | 10 (0.1%) | 131 (1.3%) |
| 85 Years and over | 193 (2.1%) | 124 (1.3%) |
| Total | 9,145 (100.0%) | 9,711 (100.0%) |
Families and Households in Cinco Ranch
Median Family Size in Cinco Ranch
The median family size in Cinco Ranch is 3.35 persons per family, with married-couple families (4,981 | 92.9%) accounting for the largest median family size of 3.4 persons per family. On the other hand, single male/father families (86 | 1.6%) represent the smallest median family size with 2.28 persons per family.
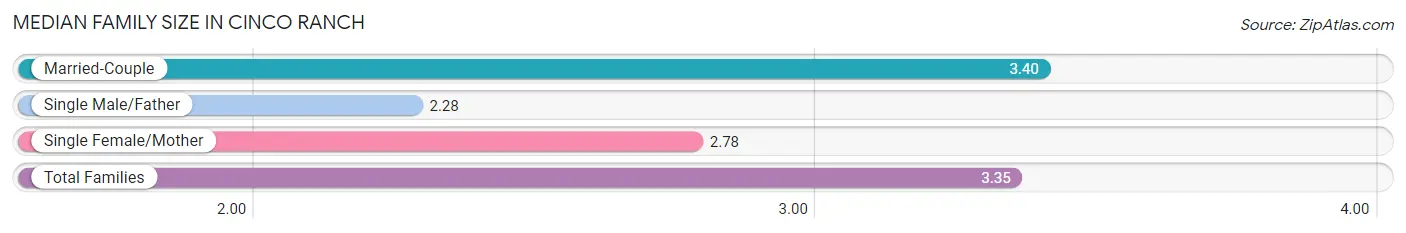
| Family Type | # Families | Family Size |
| Married-Couple | 4,981 (92.9%) | 3.40 |
| Single Male/Father | 86 (1.6%) | 2.28 |
| Single Female/Mother | 292 (5.4%) | 2.78 |
| Total Families | 5,359 (100.0%) | 3.35 |
Median Household Size in Cinco Ranch
The median household size in Cinco Ranch is 3.06 persons per household, with married-couple households (4,981 | 80.8%) accounting for the largest median household size of 3.4 persons per household. non-family households (802 | 13.0%) represent the smallest median household size with 1.09 persons per household.
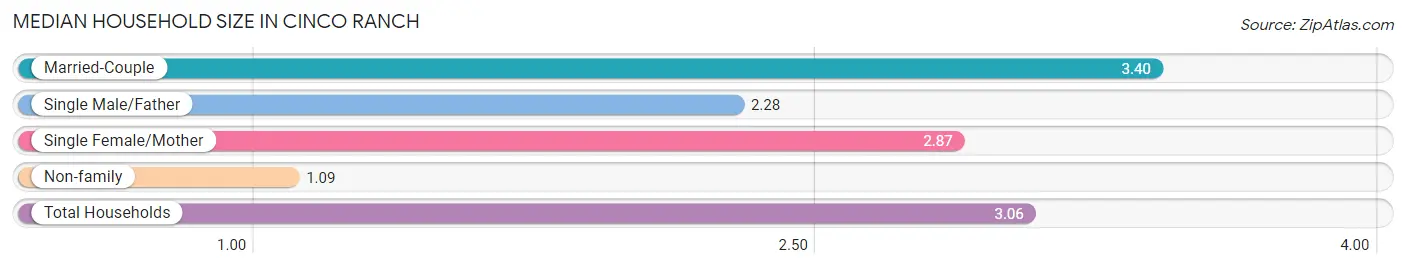
| Household Type | # Households | Household Size |
| Married-Couple | 4,981 (80.8%) | 3.40 |
| Single Male/Father | 86 (1.4%) | 2.28 |
| Single Female/Mother | 292 (4.7%) | 2.87 |
| Non-family | 802 (13.0%) | 1.09 |
| Total Households | 6,161 (100.0%) | 3.06 |
Household Size by Marriage Status in Cinco Ranch
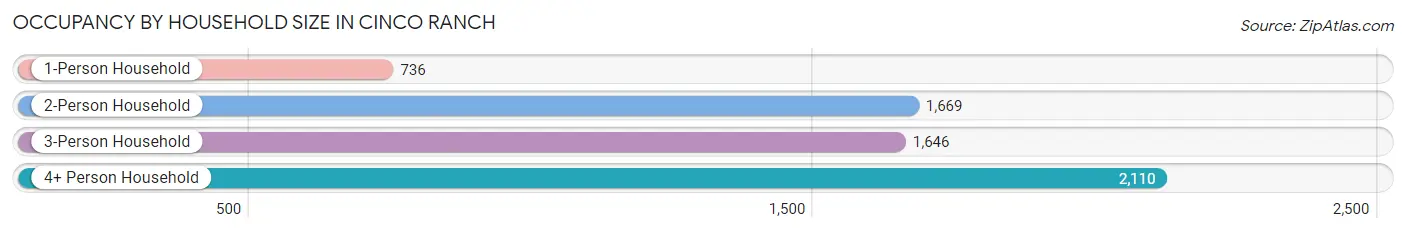
Out of a total of 6,161 households in Cinco Ranch, 5,359 (87.0%) are family households, while 802 (13.0%) are nonfamily households. The most numerous type of family households are 3-person households, comprising 1,646, and the most common type of nonfamily households are 1-person households, comprising 736.
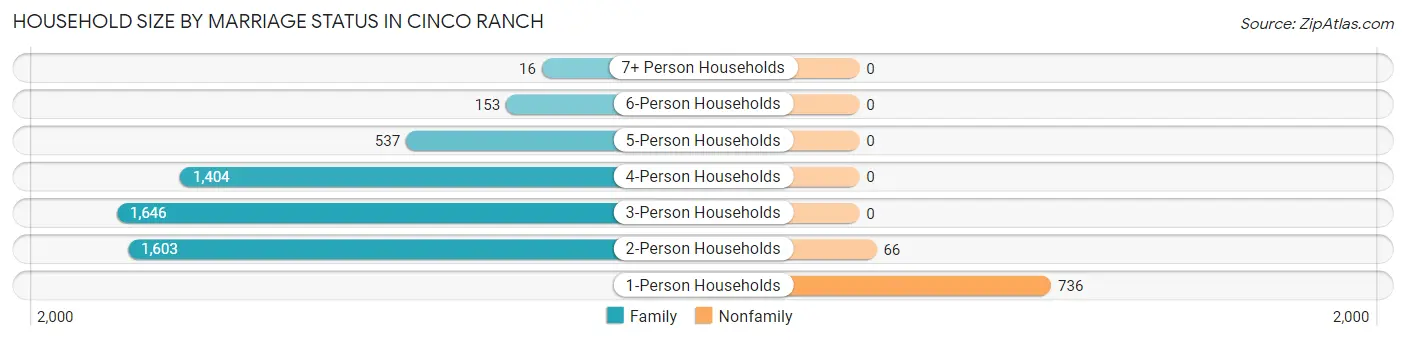
| Household Size | Family Households | Nonfamily Households |
| 1-Person Households | - | 736 (11.9%) |
| 2-Person Households | 1,603 (26.0%) | 66 (1.1%) |
| 3-Person Households | 1,646 (26.7%) | 0 (0.0%) |
| 4-Person Households | 1,404 (22.8%) | 0 (0.0%) |
| 5-Person Households | 537 (8.7%) | 0 (0.0%) |
| 6-Person Households | 153 (2.5%) | 0 (0.0%) |
| 7+ Person Households | 16 (0.3%) | 0 (0.0%) |
| Total | 5,359 (87.0%) | 802 (13.0%) |
Female Fertility in Cinco Ranch
Fertility by Age in Cinco Ranch
Average fertility rate in Cinco Ranch is 39.0 births per 1,000 women. Women in the age bracket of 20 to 34 years have the highest fertility rate with 113.0 births per 1,000 women. Women in the age bracket of 20 to 34 years acount for 80.4% of all women with births.
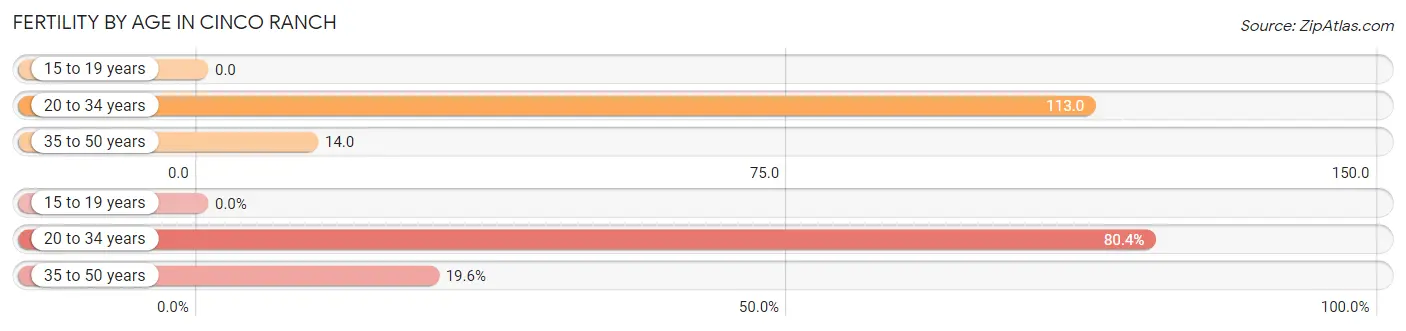
| Age Bracket | Women with Births | Births / 1,000 Women |
| 15 to 19 years | 0 (0.0%) | 0.0 |
| 20 to 34 years | 148 (80.4%) | 113.0 |
| 35 to 50 years | 36 (19.6%) | 14.0 |
| Total | 184 (100.0%) | 39.0 |
Fertility by Age by Marriage Status in Cinco Ranch
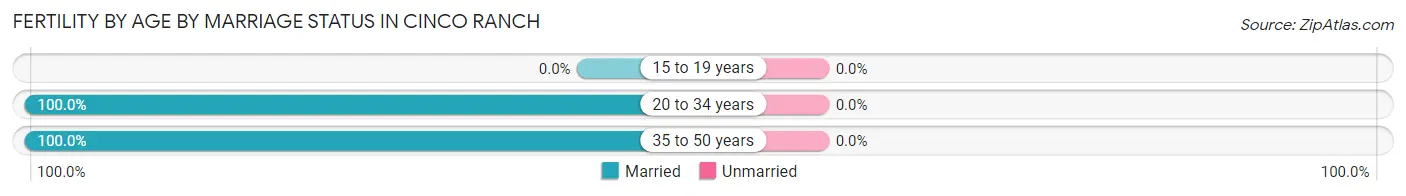
| Age Bracket | Married | Unmarried |
| 15 to 19 years | 0 (0.0%) | 0 (0.0%) |
| 20 to 34 years | 148 (100.0%) | 0 (0.0%) |
| 35 to 50 years | 36 (100.0%) | 0 (0.0%) |
| Total | 184 (100.0%) | 0 (0.0%) |
Fertility by Education in Cinco Ranch
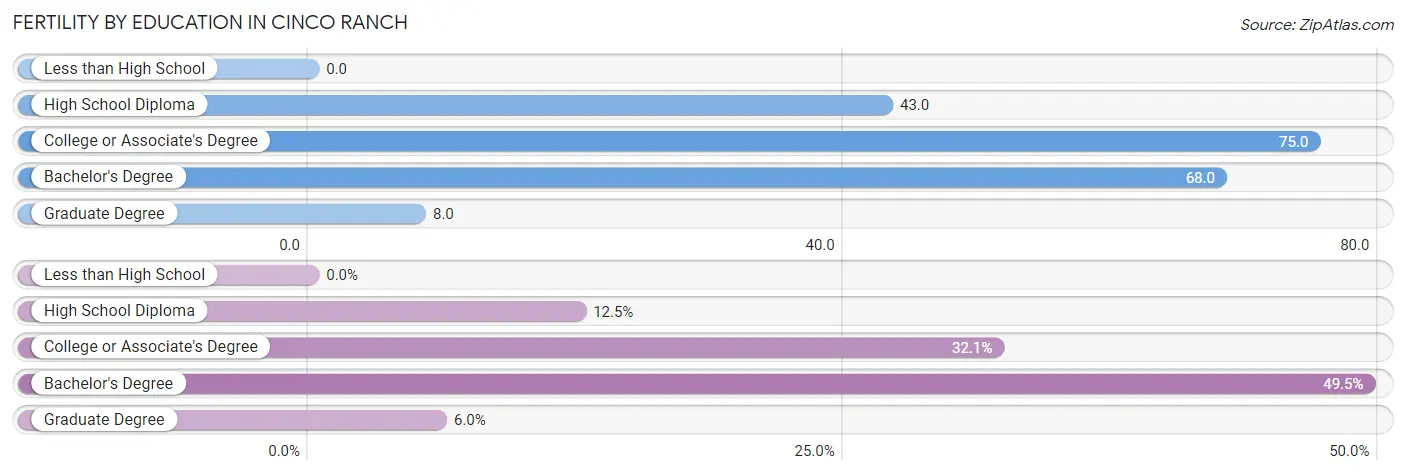
| Educational Attainment | Women with Births | Births / 1,000 Women |
| Less than High School | 0 (0.0%) | 0.0 |
| High School Diploma | 23 (12.5%) | 43.0 |
| College or Associate's Degree | 59 (32.1%) | 75.0 |
| Bachelor's Degree | 91 (49.5%) | 68.0 |
| Graduate Degree | 11 (6.0%) | 8.0 |
| Total | 184 (100.0%) | 39.0 |
Fertility by Education by Marriage Status in Cinco Ranch
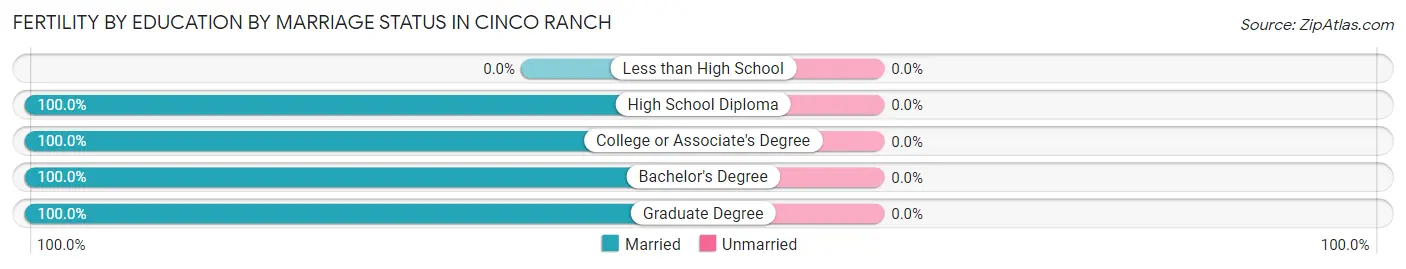
| Educational Attainment | Married | Unmarried |
| Less than High School | 0 (0.0%) | 0 (0.0%) |
| High School Diploma | 23 (100.0%) | 0 (0.0%) |
| College or Associate's Degree | 59 (100.0%) | 0 (0.0%) |
| Bachelor's Degree | 91 (100.0%) | 0 (0.0%) |
| Graduate Degree | 11 (100.0%) | 0 (0.0%) |
| Total | 184 (100.0%) | 0 (0.0%) |
Employment Characteristics in Cinco Ranch
Employment by Class of Employer in Cinco Ranch
Among the 8,243 employed individuals in Cinco Ranch, private company employees (5,896 | 71.5%), self-employed (not incorporated) (620 | 7.5%), and not-for-profit organizations (612 | 7.4%) make up the most common classes of employment.
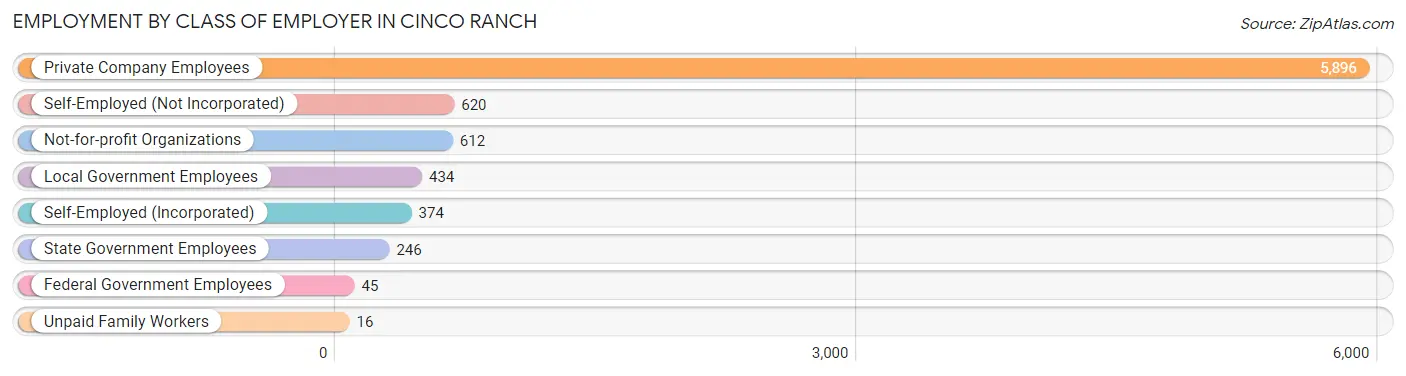
| Employer Class | # Employees | % Employees |
| Private Company Employees | 5,896 | 71.5% |
| Self-Employed (Incorporated) | 374 | 4.5% |
| Self-Employed (Not Incorporated) | 620 | 7.5% |
| Not-for-profit Organizations | 612 | 7.4% |
| Local Government Employees | 434 | 5.3% |
| State Government Employees | 246 | 3.0% |
| Federal Government Employees | 45 | 0.5% |
| Unpaid Family Workers | 16 | 0.2% |
| Total | 8,243 | 100.0% |
Employment Status by Age in Cinco Ranch
According to the labor force statistics for Cinco Ranch, out of the total population over 16 years of age (14,233), 61.3% or 8,725 individuals are in the labor force, with 4.6% or 401 of them unemployed. The age group with the highest labor force participation rate is 45 to 54 years, with 91.6% or 2,328 individuals in the labor force. Within the labor force, the 30 to 34 years age range has the highest percentage of unemployed individuals, with 16.4% or 123 of them being unemployed.
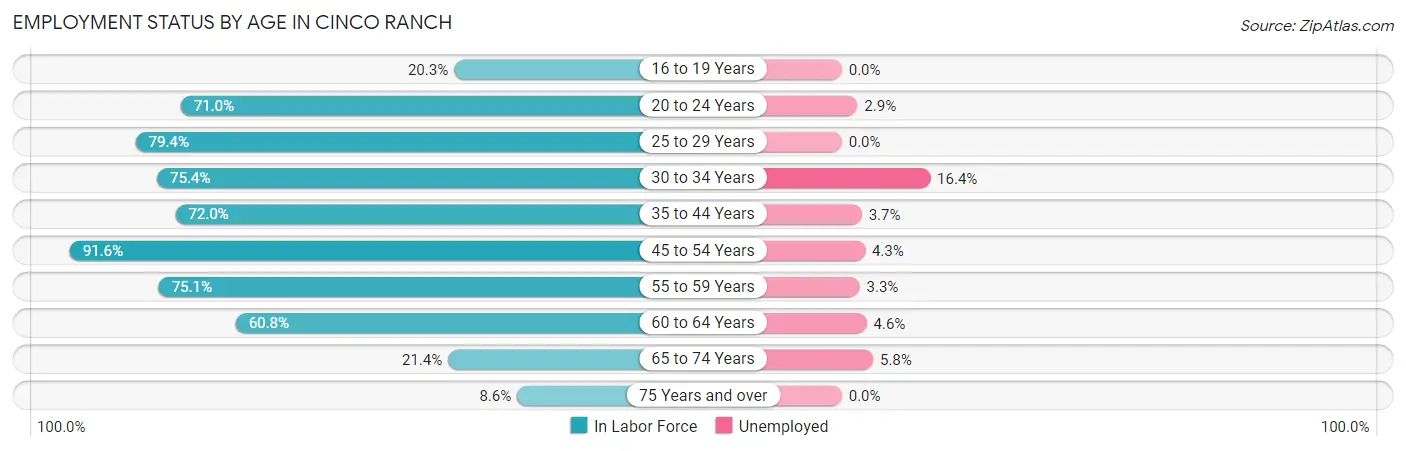
| Age Bracket | In Labor Force | Unemployed |
| 16 to 19 Years | 272 (20.3%) | 0 (0.0%) |
| 20 to 24 Years | 454 (71.0%) | 13 (2.9%) |
| 25 to 29 Years | 551 (79.4%) | 0 (0.0%) |
| 30 to 34 Years | 748 (75.4%) | 123 (16.4%) |
| 35 to 44 Years | 2,399 (72.0%) | 89 (3.7%) |
| 45 to 54 Years | 2,328 (91.6%) | 100 (4.3%) |
| 55 to 59 Years | 818 (75.1%) | 27 (3.3%) |
| 60 to 64 Years | 782 (60.8%) | 36 (4.6%) |
| 65 to 74 Years | 295 (21.4%) | 17 (5.8%) |
| 75 Years and over | 81 (8.6%) | 0 (0.0%) |
| Total | 8,725 (61.3%) | 401 (4.6%) |
Employment Status by Educational Attainment in Cinco Ranch
According to labor force statistics for Cinco Ranch, 76.8% of individuals (7,630) out of the total population between 25 and 64 years of age (9,935) are in the labor force, with 4.9% or 374 of them being unemployed. The group with the highest labor force participation rate are those with the educational attainment of college / associate degree, with 80.7% or 1,323 individuals in the labor force. Within the labor force, individuals with college / associate degree education have the highest percentage of unemployment, with 5.3% or 70 of them being unemployed.
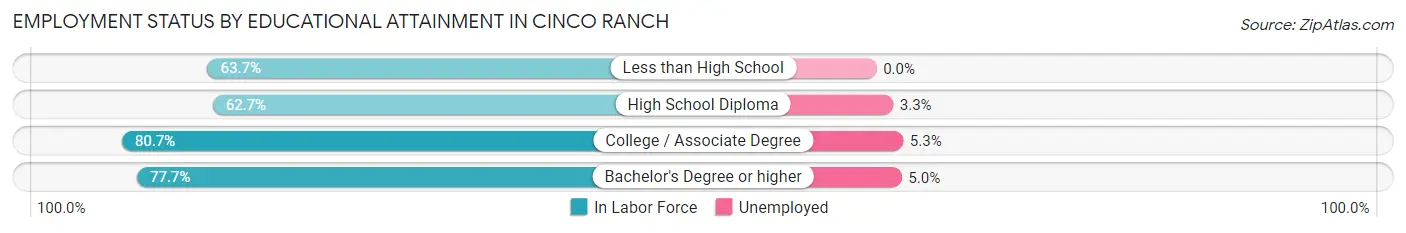
| Educational Attainment | In Labor Force | Unemployed |
| Less than High School | 93 (63.7%) | 0 (0.0%) |
| High School Diploma | 518 (62.7%) | 27 (3.3%) |
| College / Associate Degree | 1,323 (80.7%) | 87 (5.3%) |
| Bachelor's Degree or higher | 5,691 (77.7%) | 366 (5.0%) |
| Total | 7,630 (76.8%) | 487 (4.9%) |
Employment Occupations by Sex in Cinco Ranch
Management, Business, Science and Arts Occupations
The most common Management, Business, Science and Arts occupations in Cinco Ranch are Computers, Engineering & Science (1,558 | 18.7%), Management (1,321 | 15.9%), Architecture & Engineering (1,027 | 12.3%), Community & Social Service (917 | 11.0%), and Business & Financial (683 | 8.2%).
Management, Business, Science and Arts Occupations by Sex
Within the Management, Business, Science and Arts occupations in Cinco Ranch, the most male-oriented occupations are Architecture & Engineering (91.7%), Computers, Engineering & Science (87.0%), and Computers & Mathematics (81.7%), while the most female-oriented occupations are Education Instruction & Library (92.1%), Legal Services & Support (91.2%), and Community & Social Service (75.7%).
| Occupation | Male | Female |
| Management | 948 (71.8%) | 373 (28.2%) |
| Business & Financial | 417 (61.1%) | 266 (39.0%) |
| Computers, Engineering & Science | 1,356 (87.0%) | 202 (13.0%) |
| Computers & Mathematics | 376 (81.7%) | 84 (18.3%) |
| Architecture & Engineering | 942 (91.7%) | 85 (8.3%) |
| Life, Physical & Social Science | 38 (53.5%) | 33 (46.5%) |
| Community & Social Service | 223 (24.3%) | 694 (75.7%) |
| Education, Arts & Media | 125 (51.6%) | 117 (48.3%) |
| Legal Services & Support | 5 (8.8%) | 52 (91.2%) |
| Education Instruction & Library | 41 (7.9%) | 476 (92.1%) |
| Arts, Media & Entertainment | 52 (51.5%) | 49 (48.5%) |
| Health Diagnosing & Treating | 201 (41.1%) | 288 (58.9%) |
| Health Technologists | 163 (44.5%) | 203 (55.5%) |
| Total (Category) | 3,145 (63.3%) | 1,823 (36.7%) |
| Total (Overall) | 4,847 (58.2%) | 3,478 (41.8%) |
Services Occupations
The most common Services occupations in Cinco Ranch are Food Preparation & Serving (410 | 4.9%), Personal Care & Service (151 | 1.8%), Security & Protection (102 | 1.2%), Law Enforcement (96 | 1.1%), and Cleaning & Maintenance (77 | 0.9%).
Services Occupations by Sex
Within the Services occupations in Cinco Ranch, the most male-oriented occupations are Firefighting & Prevention (100.0%), Cleaning & Maintenance (68.8%), and Food Preparation & Serving (54.1%), while the most female-oriented occupations are Healthcare Support (100.0%), Personal Care & Service (100.0%), and Law Enforcement (74.0%).
| Occupation | Male | Female |
| Healthcare Support | 0 (0.0%) | 72 (100.0%) |
| Security & Protection | 31 (30.4%) | 71 (69.6%) |
| Firefighting & Prevention | 6 (100.0%) | 0 (0.0%) |
| Law Enforcement | 25 (26.0%) | 71 (74.0%) |
| Food Preparation & Serving | 222 (54.1%) | 188 (45.9%) |
| Cleaning & Maintenance | 53 (68.8%) | 24 (31.2%) |
| Personal Care & Service | 0 (0.0%) | 151 (100.0%) |
| Total (Category) | 306 (37.7%) | 506 (62.3%) |
| Total (Overall) | 4,847 (58.2%) | 3,478 (41.8%) |
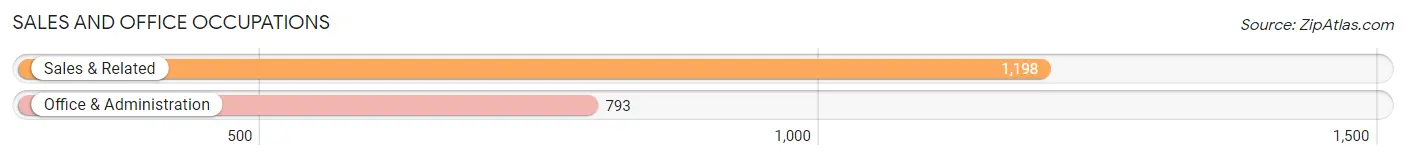
Sales and Office Occupations
The most common Sales and Office occupations in Cinco Ranch are Sales & Related (1,198 | 14.4%), and Office & Administration (793 | 9.5%).
Sales and Office Occupations by Sex
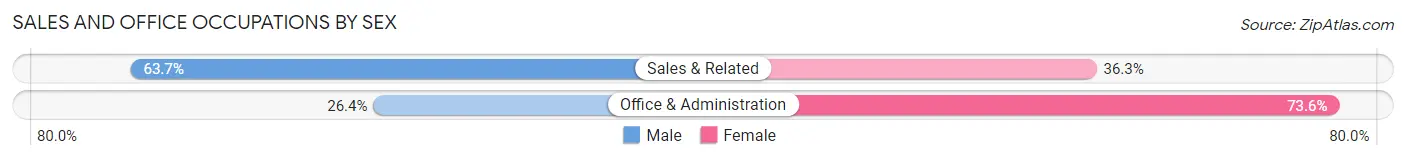
| Occupation | Male | Female |
| Sales & Related | 763 (63.7%) | 435 (36.3%) |
| Office & Administration | 209 (26.4%) | 584 (73.6%) |
| Total (Category) | 972 (48.8%) | 1,019 (51.2%) |
| Total (Overall) | 4,847 (58.2%) | 3,478 (41.8%) |
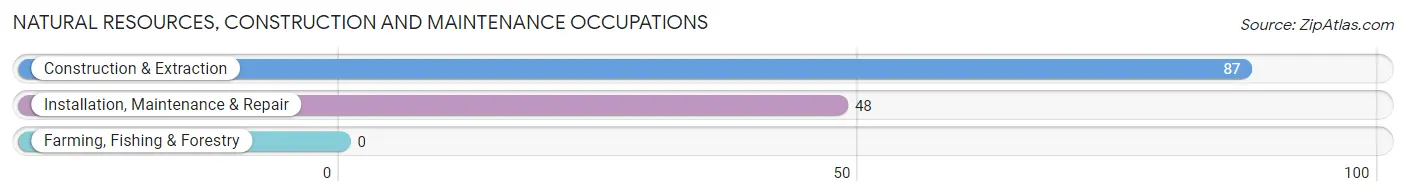
Natural Resources, Construction and Maintenance Occupations
The most common Natural Resources, Construction and Maintenance occupations in Cinco Ranch are Construction & Extraction (87 | 1.1%), and Installation, Maintenance & Repair (48 | 0.6%).
Natural Resources, Construction and Maintenance Occupations by Sex
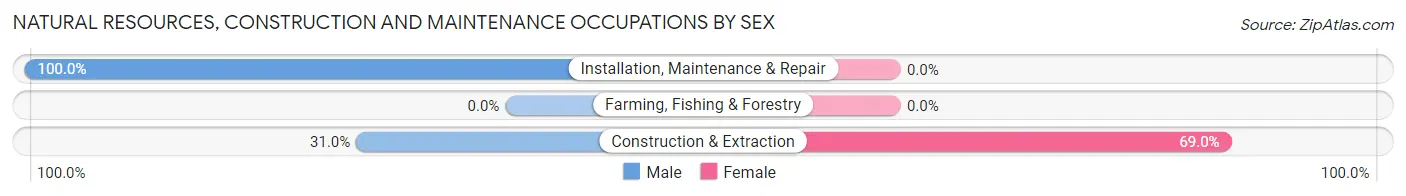
| Occupation | Male | Female |
| Farming, Fishing & Forestry | 0 (0.0%) | 0 (0.0%) |
| Construction & Extraction | 27 (31.0%) | 60 (69.0%) |
| Installation, Maintenance & Repair | 48 (100.0%) | 0 (0.0%) |
| Total (Category) | 75 (55.6%) | 60 (44.4%) |
| Total (Overall) | 4,847 (58.2%) | 3,478 (41.8%) |
Production, Transportation and Moving Occupations
The most common Production, Transportation and Moving occupations in Cinco Ranch are Production (203 | 2.4%), Transportation (173 | 2.1%), and Material Moving (43 | 0.5%).
Production, Transportation and Moving Occupations by Sex
| Occupation | Male | Female |
| Production | 145 (71.4%) | 58 (28.6%) |
| Transportation | 161 (93.1%) | 12 (6.9%) |
| Material Moving | 43 (100.0%) | 0 (0.0%) |
| Total (Category) | 349 (83.3%) | 70 (16.7%) |
| Total (Overall) | 4,847 (58.2%) | 3,478 (41.8%) |
Employment Industries by Sex in Cinco Ranch
Employment Industries in Cinco Ranch
The major employment industries in Cinco Ranch include Manufacturing (1,283 | 15.4%), Professional & Scientific (1,022 | 12.3%), Retail Trade (773 | 9.3%), Educational Services (717 | 8.6%), and Finance & Insurance (621 | 7.5%).
Employment Industries by Sex in Cinco Ranch
The Cinco Ranch industries that see more men than women are Agriculture, Fishing & Hunting (100.0%), Utilities (100.0%), and Information (85.4%), whereas the industries that tend to have a higher number of women are Enterprise Management (86.2%), Health Care & Social Assistance (84.2%), and Educational Services (83.5%).
| Industry | Male | Female |
| Agriculture, Fishing & Hunting | 11 (100.0%) | 0 (0.0%) |
| Mining, Quarrying, & Extraction | 435 (84.6%) | 79 (15.4%) |
| Construction | 165 (60.7%) | 107 (39.3%) |
| Manufacturing | 1,058 (82.5%) | 225 (17.5%) |
| Wholesale Trade | 194 (66.4%) | 98 (33.6%) |
| Retail Trade | 405 (52.4%) | 368 (47.6%) |
| Transportation & Warehousing | 269 (81.3%) | 62 (18.7%) |
| Utilities | 53 (100.0%) | 0 (0.0%) |
| Information | 82 (85.4%) | 14 (14.6%) |
| Finance & Insurance | 384 (61.8%) | 237 (38.2%) |
| Real Estate, Rental & Leasing | 76 (27.4%) | 201 (72.6%) |
| Professional & Scientific | 650 (63.6%) | 372 (36.4%) |
| Enterprise Management | 9 (13.9%) | 56 (86.2%) |
| Administrative & Support | 122 (78.2%) | 34 (21.8%) |
| Educational Services | 118 (16.5%) | 599 (83.5%) |
| Health Care & Social Assistance | 82 (15.8%) | 438 (84.2%) |
| Arts, Entertainment & Recreation | 92 (69.7%) | 40 (30.3%) |
| Accommodation & Food Services | 291 (59.6%) | 197 (40.4%) |
| Public Administration | 152 (55.5%) | 122 (44.5%) |
| Total | 4,847 (58.2%) | 3,478 (41.8%) |
Education in Cinco Ranch
School Enrollment in Cinco Ranch
The most common levels of schooling among the 5,706 students in Cinco Ranch are high school (1,395 | 24.4%), elementary school (1,164 | 20.4%), and middle school (868 | 15.2%).
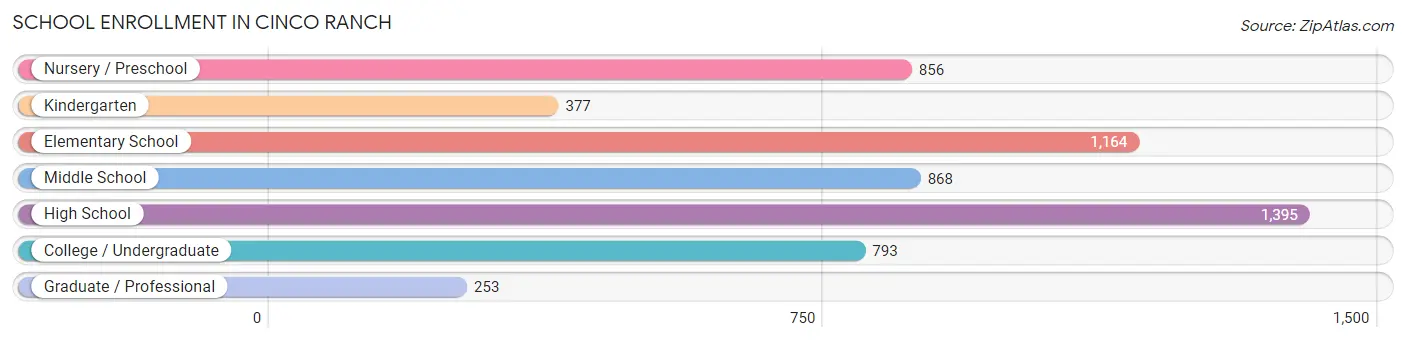
| School Level | # Students | % Students |
| Nursery / Preschool | 856 | 15.0% |
| Kindergarten | 377 | 6.6% |
| Elementary School | 1,164 | 20.4% |
| Middle School | 868 | 15.2% |
| High School | 1,395 | 24.4% |
| College / Undergraduate | 793 | 13.9% |
| Graduate / Professional | 253 | 4.4% |
| Total | 5,706 | 100.0% |
School Enrollment by Age by Funding Source in Cinco Ranch
Out of a total of 5,706 students who are enrolled in schools in Cinco Ranch, 1,232 (21.6%) attend a private institution, while the remaining 4,474 (78.4%) are enrolled in public schools. The age group of 25 to 34 year olds has the highest likelihood of being enrolled in private schools, with 59 (67.8% in the age bracket) enrolled. Conversely, the age group of 10 to 14 year olds has the lowest likelihood of being enrolled in a private school, with 1,245 (96.7% in the age bracket) attending a public institution.
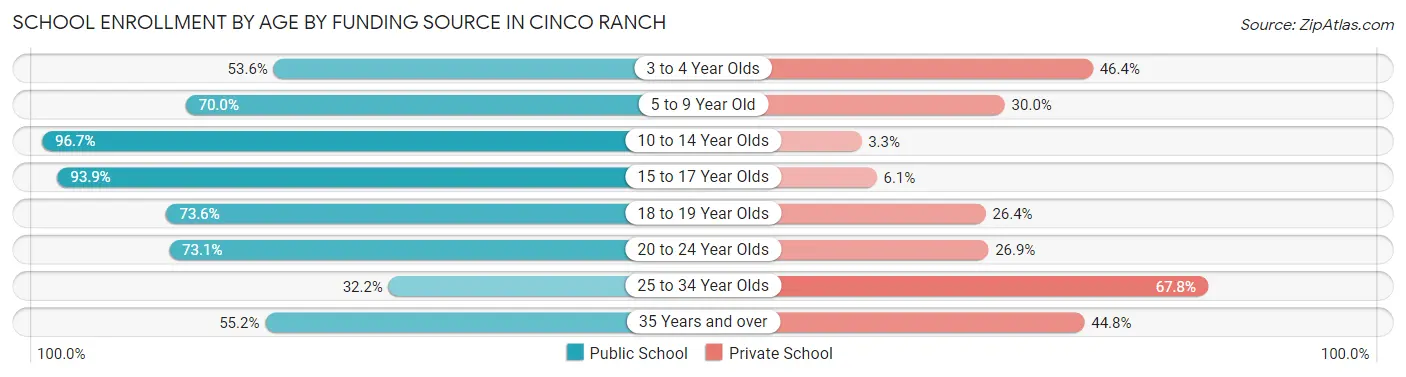
| Age Bracket | Public School | Private School |
| 3 to 4 Year Olds | 275 (53.6%) | 238 (46.4%) |
| 5 to 9 Year Old | 1,137 (70.0%) | 487 (30.0%) |
| 10 to 14 Year Olds | 1,245 (96.7%) | 42 (3.3%) |
| 15 to 17 Year Olds | 1,073 (93.9%) | 70 (6.1%) |
| 18 to 19 Year Olds | 248 (73.6%) | 89 (26.4%) |
| 20 to 24 Year Olds | 304 (73.1%) | 112 (26.9%) |
| 25 to 34 Year Olds | 28 (32.2%) | 59 (67.8%) |
| 35 Years and over | 165 (55.2%) | 134 (44.8%) |
| Total | 4,474 (78.4%) | 1,232 (21.6%) |
Educational Attainment by Field of Study in Cinco Ranch
Business (2,179 | 24.7%), engineering (2,135 | 24.2%), social sciences (1,049 | 11.9%), education (663 | 7.5%), and science & technology (449 | 5.1%) are the most common fields of study among 8,817 individuals in Cinco Ranch who have obtained a bachelor's degree or higher.
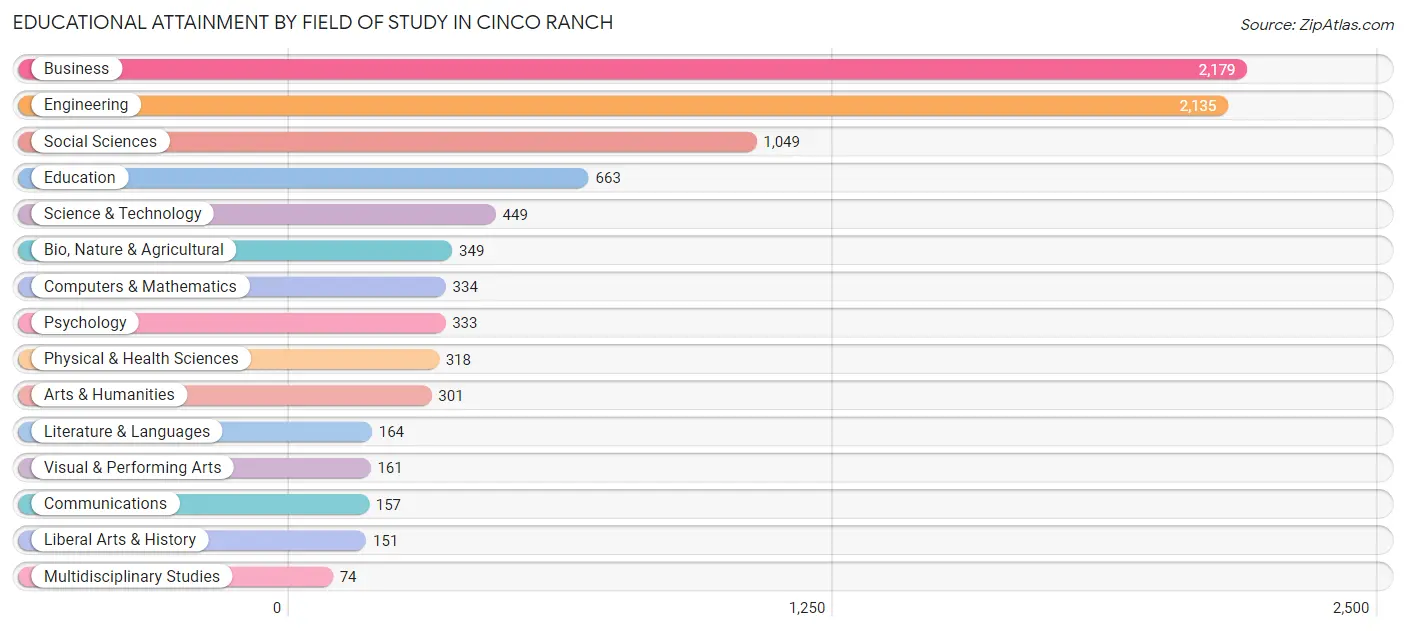
| Field of Study | # Graduates | % Graduates |
| Computers & Mathematics | 334 | 3.8% |
| Bio, Nature & Agricultural | 349 | 4.0% |
| Physical & Health Sciences | 318 | 3.6% |
| Psychology | 333 | 3.8% |
| Social Sciences | 1,049 | 11.9% |
| Engineering | 2,135 | 24.2% |
| Multidisciplinary Studies | 74 | 0.8% |
| Science & Technology | 449 | 5.1% |
| Business | 2,179 | 24.7% |
| Education | 663 | 7.5% |
| Literature & Languages | 164 | 1.9% |
| Liberal Arts & History | 151 | 1.7% |
| Visual & Performing Arts | 161 | 1.8% |
| Communications | 157 | 1.8% |
| Arts & Humanities | 301 | 3.4% |
| Total | 8,817 | 100.0% |
Transportation & Commute in Cinco Ranch
Vehicle Availability by Sex in Cinco Ranch
The most prevalent vehicle ownership categories in Cinco Ranch are males with 2 vehicles (2,603, accounting for 54.3%) and females with 2 vehicles (1,609, making up 75.5%).
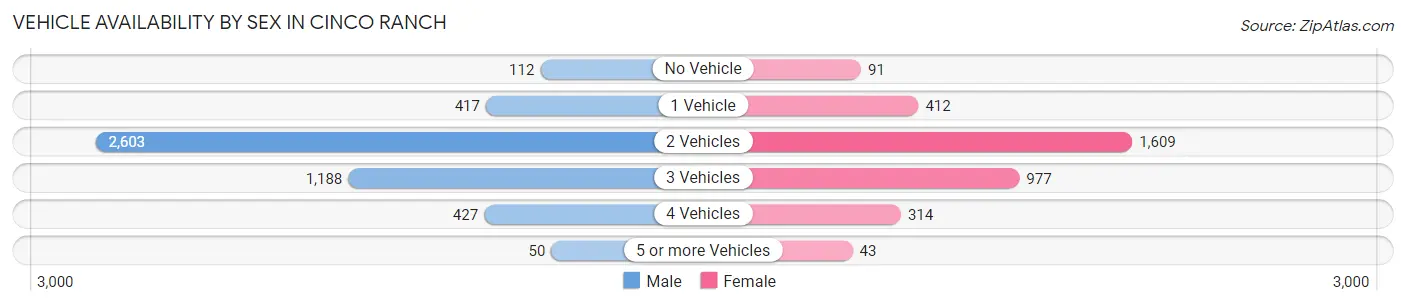
| Vehicles Available | Male | Female |
| No Vehicle | 112 (2.3%) | 91 (2.6%) |
| 1 Vehicle | 417 (8.7%) | 412 (12.0%) |
| 2 Vehicles | 2,603 (54.3%) | 1,609 (46.7%) |
| 3 Vehicles | 1,188 (24.8%) | 977 (28.3%) |
| 4 Vehicles | 427 (8.9%) | 314 (9.1%) |
| 5 or more Vehicles | 50 (1.0%) | 43 (1.3%) |
| Total | 4,797 (100.0%) | 3,446 (100.0%) |
Commute Time in Cinco Ranch
The most frequently occuring commute durations in Cinco Ranch are 30 to 34 minutes (1,174 commuters, 18.4%), 45 to 59 minutes (1,157 commuters, 18.2%), and 10 to 14 minutes (782 commuters, 12.3%).
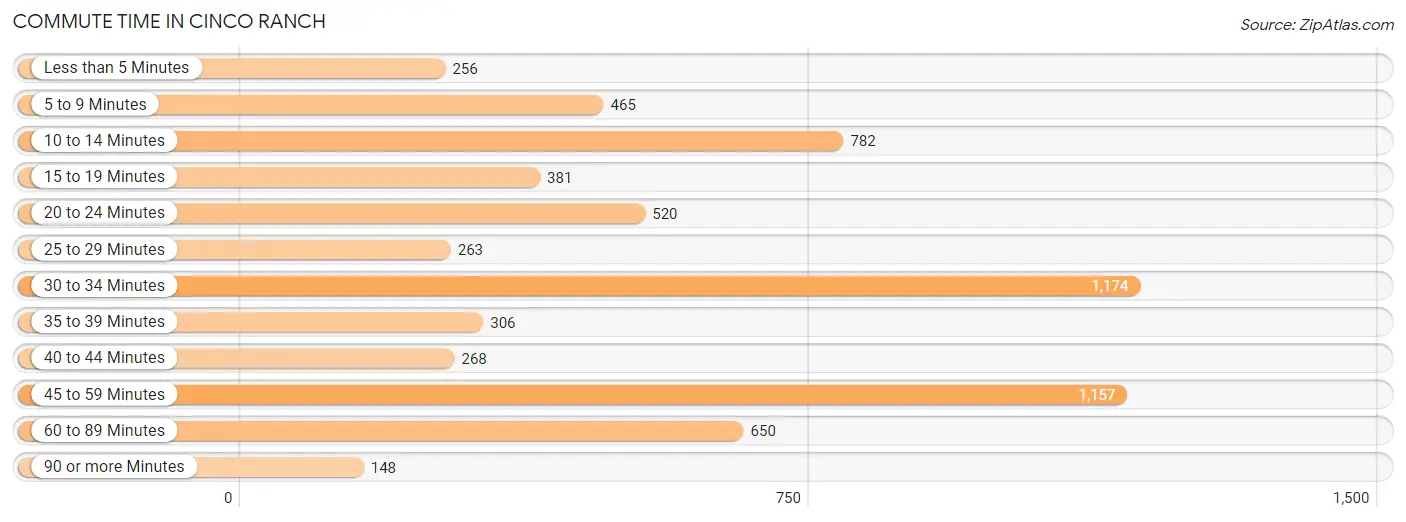
| Commute Time | # Commuters | % Commuters |
| Less than 5 Minutes | 256 | 4.0% |
| 5 to 9 Minutes | 465 | 7.3% |
| 10 to 14 Minutes | 782 | 12.3% |
| 15 to 19 Minutes | 381 | 6.0% |
| 20 to 24 Minutes | 520 | 8.2% |
| 25 to 29 Minutes | 263 | 4.1% |
| 30 to 34 Minutes | 1,174 | 18.4% |
| 35 to 39 Minutes | 306 | 4.8% |
| 40 to 44 Minutes | 268 | 4.2% |
| 45 to 59 Minutes | 1,157 | 18.2% |
| 60 to 89 Minutes | 650 | 10.2% |
| 90 or more Minutes | 148 | 2.3% |
Commute Time by Sex in Cinco Ranch
The most common commute times in Cinco Ranch are 30 to 34 minutes (773 commuters, 22.6%) for males and 45 to 59 minutes (470 commuters, 15.9%) for females.
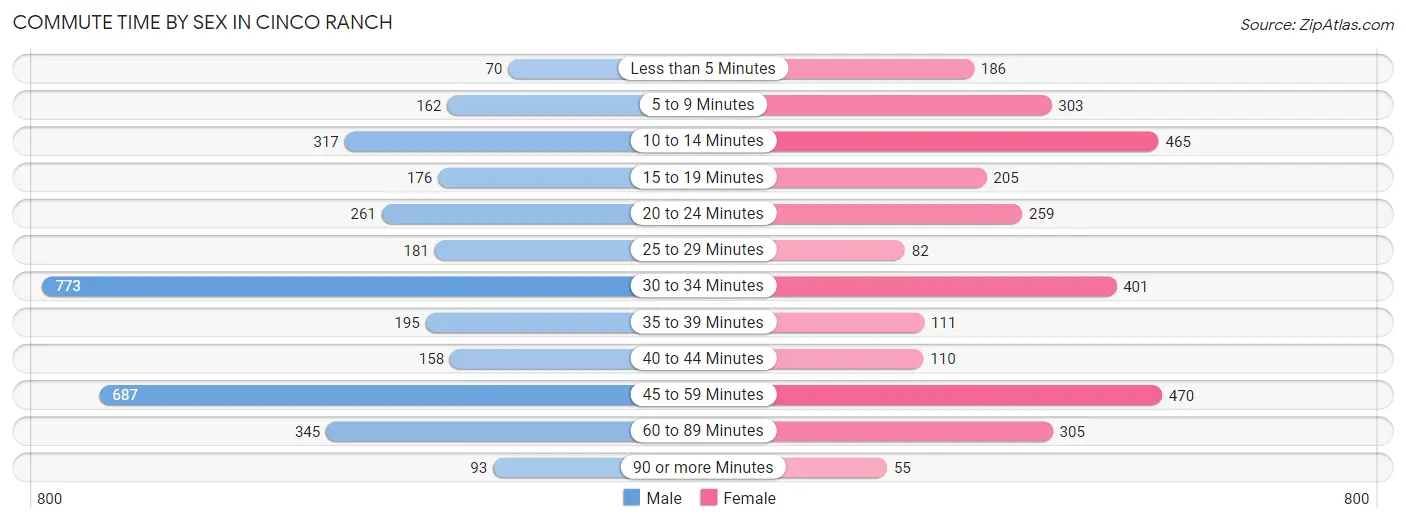
| Commute Time | Male | Female |
| Less than 5 Minutes | 70 (2.1%) | 186 (6.3%) |
| 5 to 9 Minutes | 162 (4.7%) | 303 (10.3%) |
| 10 to 14 Minutes | 317 (9.3%) | 465 (15.8%) |
| 15 to 19 Minutes | 176 (5.1%) | 205 (6.9%) |
| 20 to 24 Minutes | 261 (7.6%) | 259 (8.8%) |
| 25 to 29 Minutes | 181 (5.3%) | 82 (2.8%) |
| 30 to 34 Minutes | 773 (22.6%) | 401 (13.6%) |
| 35 to 39 Minutes | 195 (5.7%) | 111 (3.8%) |
| 40 to 44 Minutes | 158 (4.6%) | 110 (3.7%) |
| 45 to 59 Minutes | 687 (20.1%) | 470 (15.9%) |
| 60 to 89 Minutes | 345 (10.1%) | 305 (10.3%) |
| 90 or more Minutes | 93 (2.7%) | 55 (1.9%) |
Time of Departure to Work by Sex in Cinco Ranch
The most frequent times of departure to work in Cinco Ranch are 6:00 AM to 6:29 AM (480, 14.0%) for males and 7:00 AM to 7:29 AM (500, 16.9%) for females.
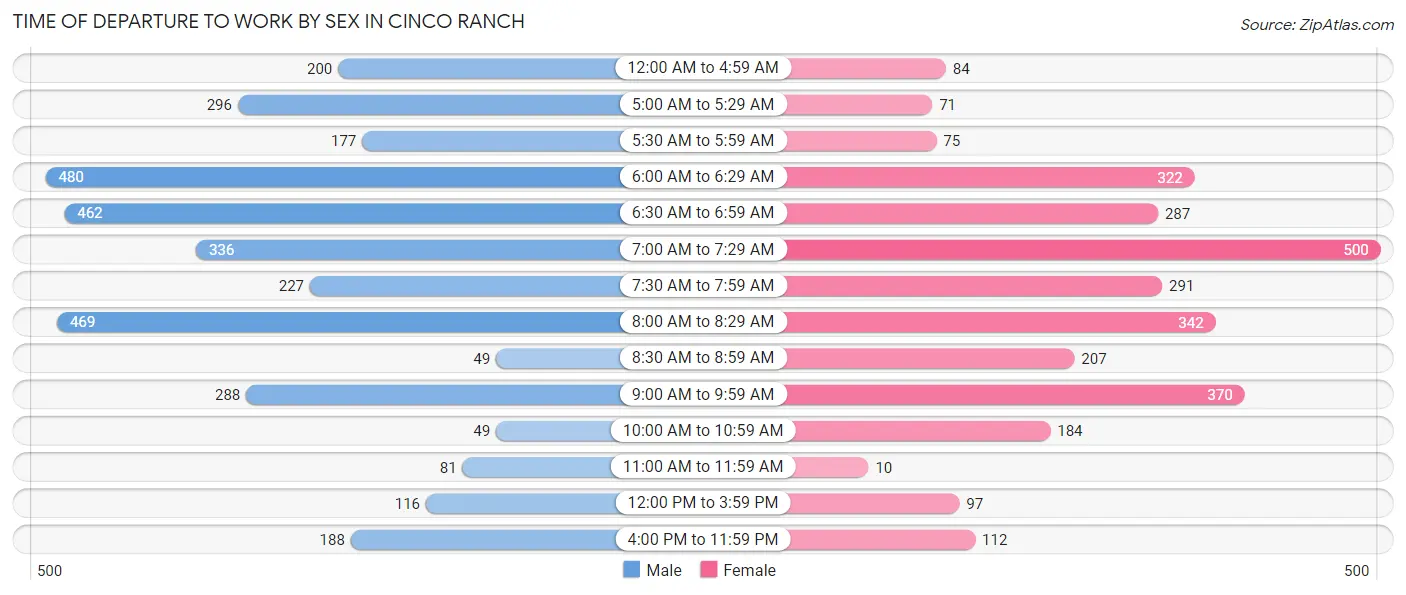
| Time of Departure | Male | Female |
| 12:00 AM to 4:59 AM | 200 (5.9%) | 84 (2.9%) |
| 5:00 AM to 5:29 AM | 296 (8.7%) | 71 (2.4%) |
| 5:30 AM to 5:59 AM | 177 (5.2%) | 75 (2.5%) |
| 6:00 AM to 6:29 AM | 480 (14.0%) | 322 (10.9%) |
| 6:30 AM to 6:59 AM | 462 (13.5%) | 287 (9.7%) |
| 7:00 AM to 7:29 AM | 336 (9.8%) | 500 (16.9%) |
| 7:30 AM to 7:59 AM | 227 (6.6%) | 291 (9.9%) |
| 8:00 AM to 8:29 AM | 469 (13.7%) | 342 (11.6%) |
| 8:30 AM to 8:59 AM | 49 (1.4%) | 207 (7.0%) |
| 9:00 AM to 9:59 AM | 288 (8.4%) | 370 (12.5%) |
| 10:00 AM to 10:59 AM | 49 (1.4%) | 184 (6.2%) |
| 11:00 AM to 11:59 AM | 81 (2.4%) | 10 (0.3%) |
| 12:00 PM to 3:59 PM | 116 (3.4%) | 97 (3.3%) |
| 4:00 PM to 11:59 PM | 188 (5.5%) | 112 (3.8%) |
| Total | 3,418 (100.0%) | 2,952 (100.0%) |
Housing Occupancy in Cinco Ranch
Occupancy by Ownership in Cinco Ranch
Of the total 6,161 dwellings in Cinco Ranch, owner-occupied units account for 4,323 (70.2%), while renter-occupied units make up 1,838 (29.8%).
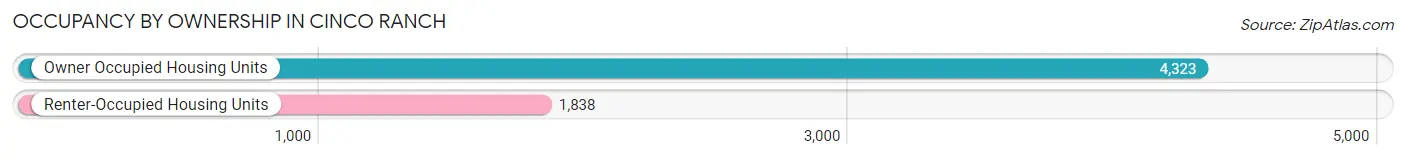
| Occupancy | # Housing Units | % Housing Units |
| Owner Occupied Housing Units | 4,323 | 70.2% |
| Renter-Occupied Housing Units | 1,838 | 29.8% |
| Total Occupied Housing Units | 6,161 | 100.0% |
Occupancy by Household Size in Cinco Ranch
| Household Size | # Housing Units | % Housing Units |
| 1-Person Household | 736 | 11.9% |
| 2-Person Household | 1,669 | 27.1% |
| 3-Person Household | 1,646 | 26.7% |
| 4+ Person Household | 2,110 | 34.3% |
| Total Housing Units | 6,161 | 100.0% |
Occupancy by Ownership by Household Size in Cinco Ranch
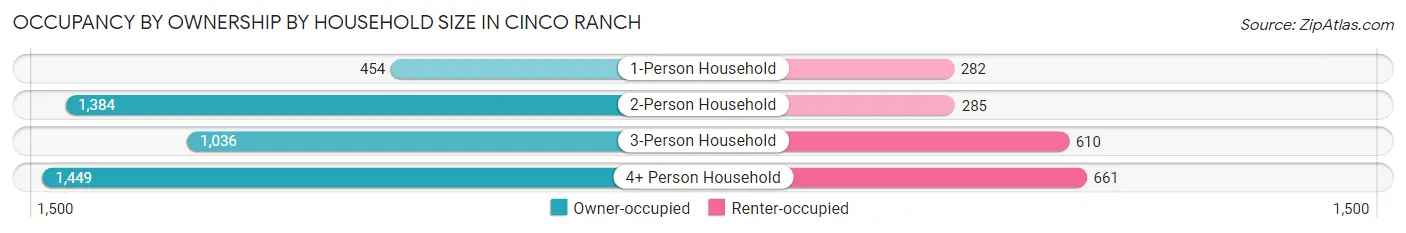
| Household Size | Owner-occupied | Renter-occupied |
| 1-Person Household | 454 (61.7%) | 282 (38.3%) |
| 2-Person Household | 1,384 (82.9%) | 285 (17.1%) |
| 3-Person Household | 1,036 (62.9%) | 610 (37.1%) |
| 4+ Person Household | 1,449 (68.7%) | 661 (31.3%) |
| Total Housing Units | 4,323 (70.2%) | 1,838 (29.8%) |
Occupancy by Educational Attainment in Cinco Ranch
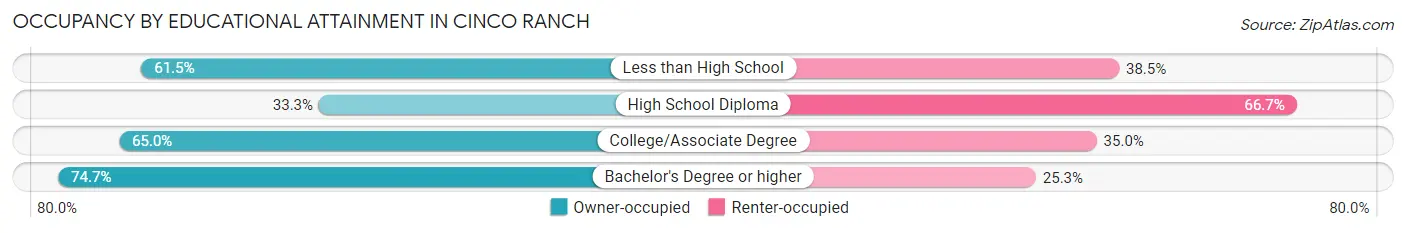
| Household Size | Owner-occupied | Renter-occupied |
| Less than High School | 75 (61.5%) | 47 (38.5%) |
| High School Diploma | 130 (33.3%) | 260 (66.7%) |
| College/Associate Degree | 675 (65.0%) | 363 (35.0%) |
| Bachelor's Degree or higher | 3,443 (74.7%) | 1,168 (25.3%) |
Occupancy by Age of Householder in Cinco Ranch
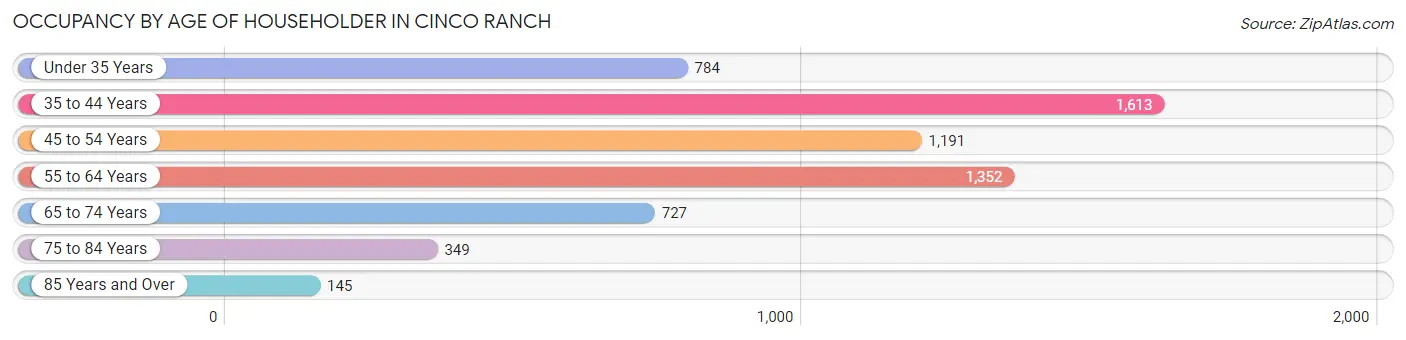
| Age Bracket | # Households | % Households |
| Under 35 Years | 784 | 12.7% |
| 35 to 44 Years | 1,613 | 26.2% |
| 45 to 54 Years | 1,191 | 19.3% |
| 55 to 64 Years | 1,352 | 21.9% |
| 65 to 74 Years | 727 | 11.8% |
| 75 to 84 Years | 349 | 5.7% |
| 85 Years and Over | 145 | 2.4% |
| Total | 6,161 | 100.0% |
Housing Finances in Cinco Ranch
Median Income by Occupancy in Cinco Ranch
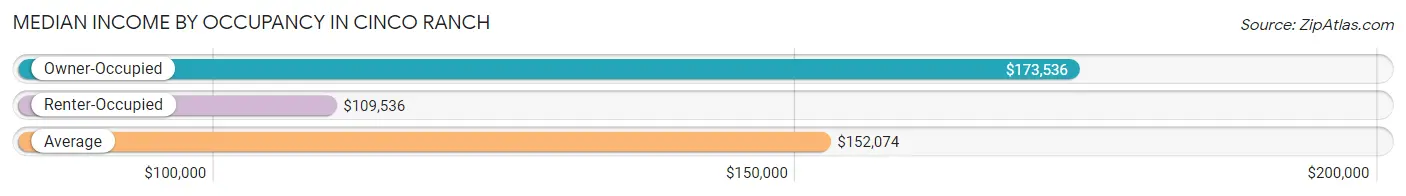
| Occupancy Type | # Households | Median Income |
| Owner-Occupied | 4,323 (70.2%) | $173,536 |
| Renter-Occupied | 1,838 (29.8%) | $109,536 |
| Average | 6,161 (100.0%) | $152,074 |
Occupancy by Householder Income Bracket in Cinco Ranch
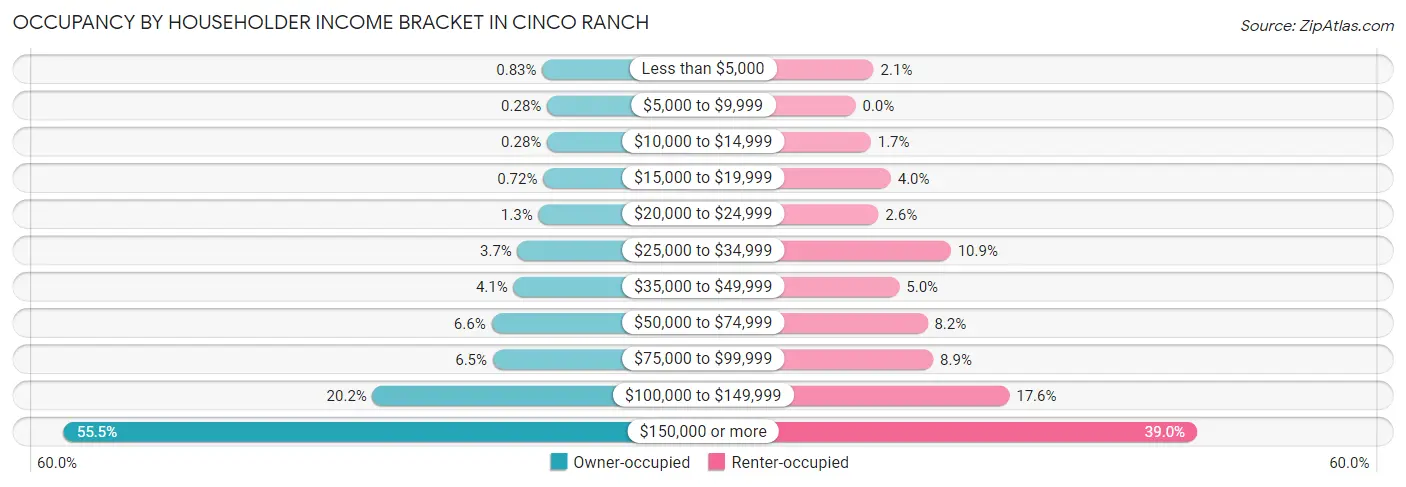
| Income Bracket | Owner-occupied | Renter-occupied |
| Less than $5,000 | 36 (0.8%) | 38 (2.1%) |
| $5,000 to $9,999 | 12 (0.3%) | 0 (0.0%) |
| $10,000 to $14,999 | 12 (0.3%) | 32 (1.7%) |
| $15,000 to $19,999 | 31 (0.7%) | 74 (4.0%) |
| $20,000 to $24,999 | 55 (1.3%) | 48 (2.6%) |
| $25,000 to $34,999 | 158 (3.6%) | 200 (10.9%) |
| $35,000 to $49,999 | 178 (4.1%) | 92 (5.0%) |
| $50,000 to $74,999 | 287 (6.6%) | 151 (8.2%) |
| $75,000 to $99,999 | 280 (6.5%) | 163 (8.9%) |
| $100,000 to $149,999 | 874 (20.2%) | 323 (17.6%) |
| $150,000 or more | 2,400 (55.5%) | 717 (39.0%) |
| Total | 4,323 (100.0%) | 1,838 (100.0%) |
Monthly Housing Cost Tiers in Cinco Ranch
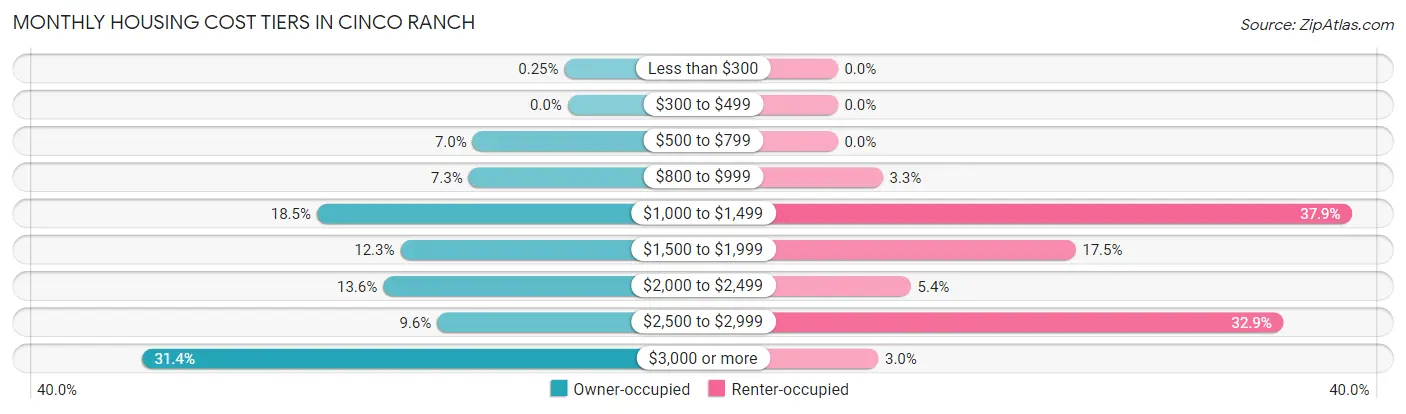
| Monthly Cost | Owner-occupied | Renter-occupied |
| Less than $300 | 11 (0.3%) | 0 (0.0%) |
| $300 to $499 | 0 (0.0%) | 0 (0.0%) |
| $500 to $799 | 303 (7.0%) | 0 (0.0%) |
| $800 to $999 | 316 (7.3%) | 61 (3.3%) |
| $1,000 to $1,499 | 799 (18.5%) | 697 (37.9%) |
| $1,500 to $1,999 | 533 (12.3%) | 322 (17.5%) |
| $2,000 to $2,499 | 588 (13.6%) | 99 (5.4%) |
| $2,500 to $2,999 | 416 (9.6%) | 604 (32.9%) |
| $3,000 or more | 1,357 (31.4%) | 55 (3.0%) |
| Total | 4,323 (100.0%) | 1,838 (100.0%) |
Physical Housing Characteristics in Cinco Ranch
Housing Structures in Cinco Ranch
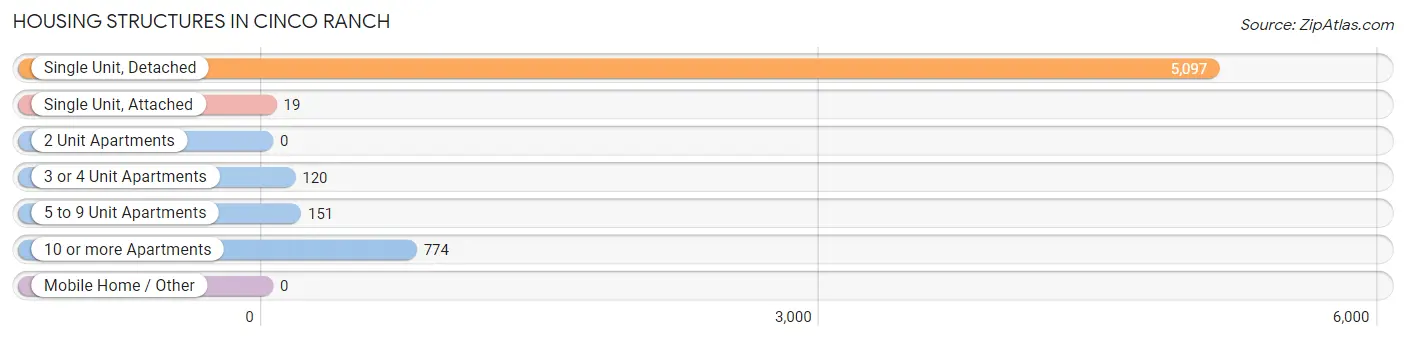
| Structure Type | # Housing Units | % Housing Units |
| Single Unit, Detached | 5,097 | 82.7% |
| Single Unit, Attached | 19 | 0.3% |
| 2 Unit Apartments | 0 | 0.0% |
| 3 or 4 Unit Apartments | 120 | 1.9% |
| 5 to 9 Unit Apartments | 151 | 2.5% |
| 10 or more Apartments | 774 | 12.6% |
| Mobile Home / Other | 0 | 0.0% |
| Total | 6,161 | 100.0% |
Housing Structures by Occupancy in Cinco Ranch
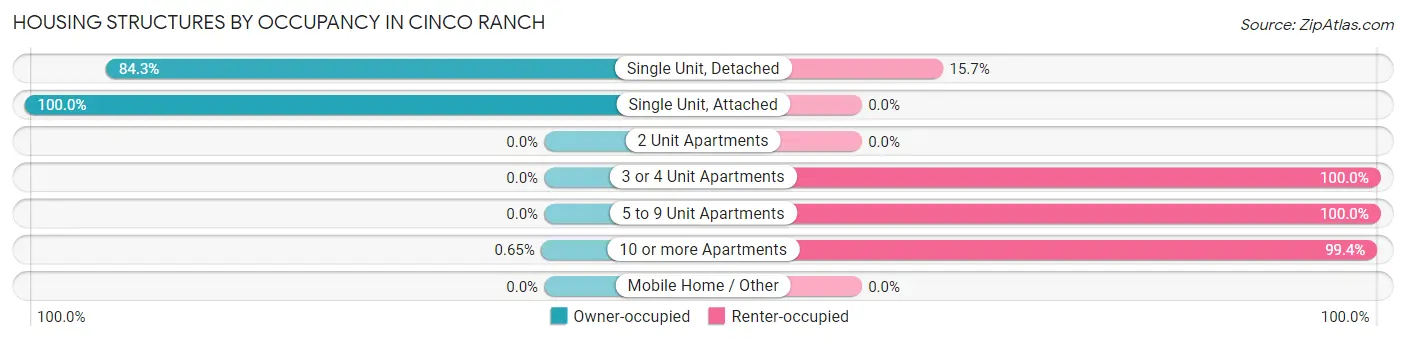
| Structure Type | Owner-occupied | Renter-occupied |
| Single Unit, Detached | 4,299 (84.3%) | 798 (15.7%) |
| Single Unit, Attached | 19 (100.0%) | 0 (0.0%) |
| 2 Unit Apartments | 0 (0.0%) | 0 (0.0%) |
| 3 or 4 Unit Apartments | 0 (0.0%) | 120 (100.0%) |
| 5 to 9 Unit Apartments | 0 (0.0%) | 151 (100.0%) |
| 10 or more Apartments | 5 (0.6%) | 769 (99.4%) |
| Mobile Home / Other | 0 (0.0%) | 0 (0.0%) |
| Total | 4,323 (70.2%) | 1,838 (29.8%) |
Housing Structures by Number of Rooms in Cinco Ranch
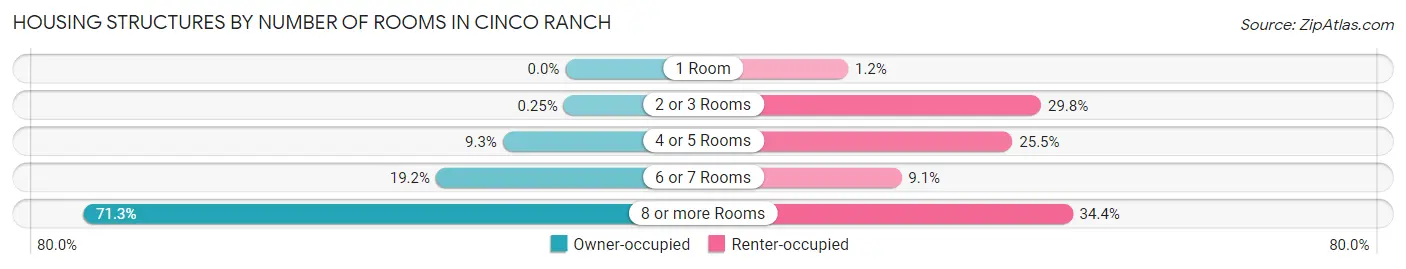
| Number of Rooms | Owner-occupied | Renter-occupied |
| 1 Room | 0 (0.0%) | 22 (1.2%) |
| 2 or 3 Rooms | 11 (0.3%) | 547 (29.8%) |
| 4 or 5 Rooms | 400 (9.2%) | 469 (25.5%) |
| 6 or 7 Rooms | 828 (19.2%) | 167 (9.1%) |
| 8 or more Rooms | 3,084 (71.3%) | 633 (34.4%) |
| Total | 4,323 (100.0%) | 1,838 (100.0%) |
Housing Structure by Heating Type in Cinco Ranch
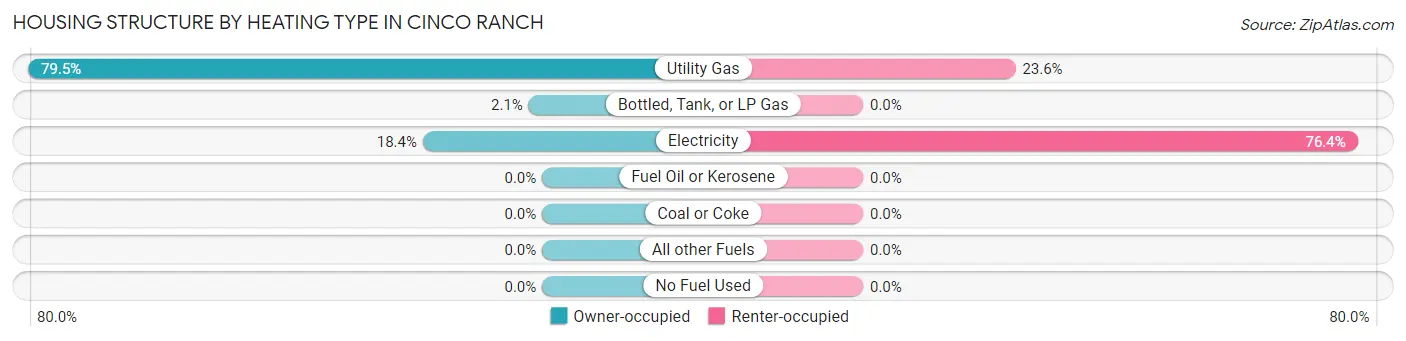
| Heating Type | Owner-occupied | Renter-occupied |
| Utility Gas | 3,436 (79.5%) | 433 (23.6%) |
| Bottled, Tank, or LP Gas | 90 (2.1%) | 0 (0.0%) |
| Electricity | 797 (18.4%) | 1,405 (76.4%) |
| Fuel Oil or Kerosene | 0 (0.0%) | 0 (0.0%) |
| Coal or Coke | 0 (0.0%) | 0 (0.0%) |
| All other Fuels | 0 (0.0%) | 0 (0.0%) |
| No Fuel Used | 0 (0.0%) | 0 (0.0%) |
| Total | 4,323 (100.0%) | 1,838 (100.0%) |
Household Vehicle Usage in Cinco Ranch
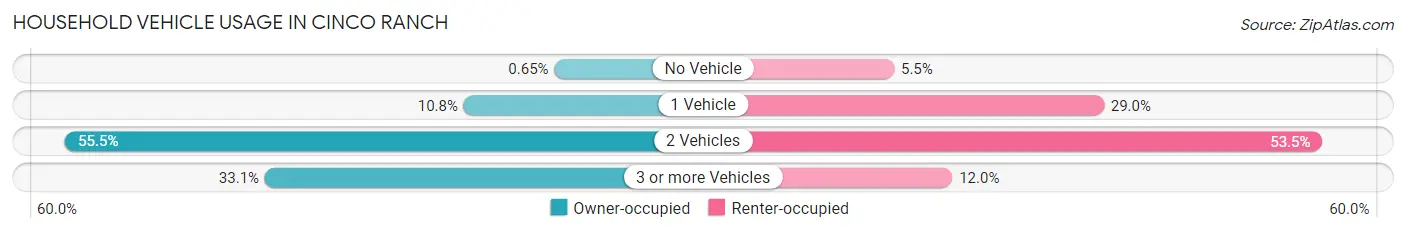
| Vehicles per Household | Owner-occupied | Renter-occupied |
| No Vehicle | 28 (0.6%) | 101 (5.5%) |
| 1 Vehicle | 467 (10.8%) | 533 (29.0%) |
| 2 Vehicles | 2,398 (55.5%) | 983 (53.5%) |
| 3 or more Vehicles | 1,430 (33.1%) | 221 (12.0%) |
| Total | 4,323 (100.0%) | 1,838 (100.0%) |
Real Estate & Mortgages in Cinco Ranch
Real Estate and Mortgage Overview in Cinco Ranch
| Characteristic | Without Mortgage | With Mortgage |
| Housing Units | 1,803 | 2,520 |
| Median Property Value | $386,500 | $458,800 |
| Median Household Income | $145,795 | $1,547 |
| Monthly Housing Costs | $1,206 | $1,357 |
| Real Estate Taxes | $8,467 | $76 |
Property Value by Mortgage Status in Cinco Ranch
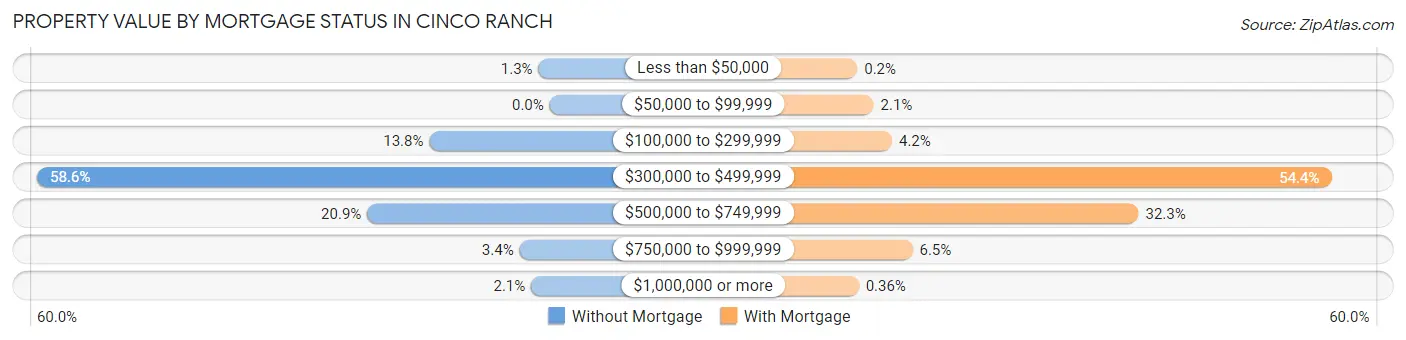
| Property Value | Without Mortgage | With Mortgage |
| Less than $50,000 | 23 (1.3%) | 5 (0.2%) |
| $50,000 to $99,999 | 0 (0.0%) | 52 (2.1%) |
| $100,000 to $299,999 | 248 (13.8%) | 105 (4.2%) |
| $300,000 to $499,999 | 1,056 (58.6%) | 1,370 (54.4%) |
| $500,000 to $749,999 | 376 (20.8%) | 815 (32.3%) |
| $750,000 to $999,999 | 62 (3.4%) | 164 (6.5%) |
| $1,000,000 or more | 38 (2.1%) | 9 (0.4%) |
| Total | 1,803 (100.0%) | 2,520 (100.0%) |
Household Income by Mortgage Status in Cinco Ranch
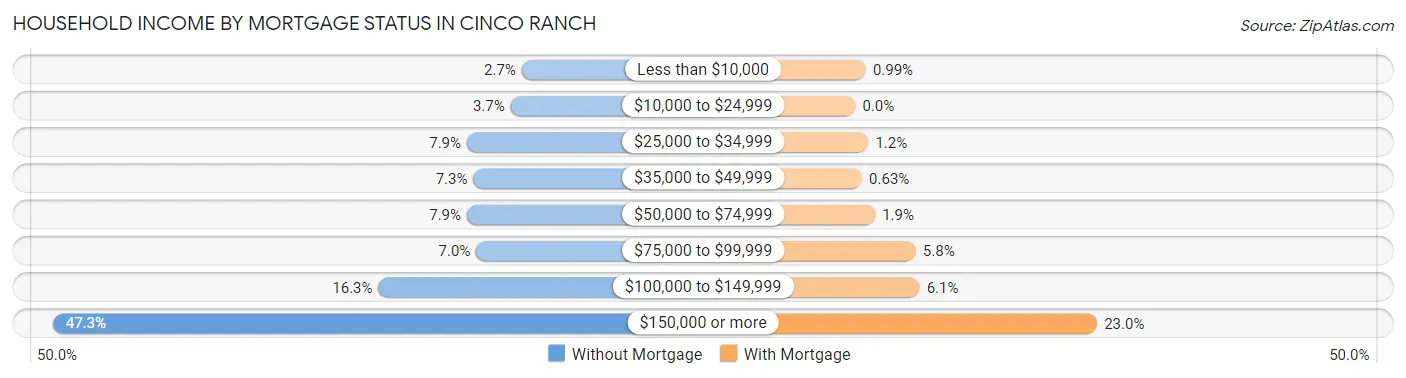
| Household Income | Without Mortgage | With Mortgage |
| Less than $10,000 | 48 (2.7%) | 25 (1.0%) |
| $10,000 to $24,999 | 67 (3.7%) | 0 (0.0%) |
| $25,000 to $34,999 | 142 (7.9%) | 31 (1.2%) |
| $35,000 to $49,999 | 131 (7.3%) | 16 (0.6%) |
| $50,000 to $74,999 | 142 (7.9%) | 47 (1.9%) |
| $75,000 to $99,999 | 126 (7.0%) | 145 (5.8%) |
| $100,000 to $149,999 | 294 (16.3%) | 154 (6.1%) |
| $150,000 or more | 853 (47.3%) | 580 (23.0%) |
| Total | 1,803 (100.0%) | 2,520 (100.0%) |
Property Value to Household Income Ratio in Cinco Ranch
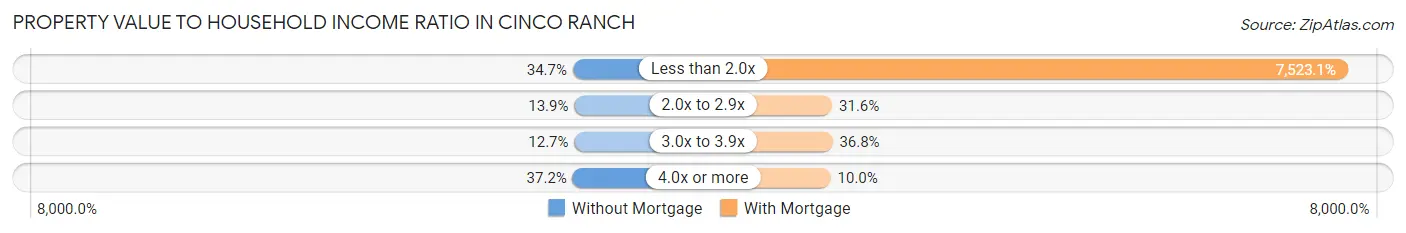
| Value-to-Income Ratio | Without Mortgage | With Mortgage |
| Less than 2.0x | 626 (34.7%) | 189,583 (7,523.1%) |
| 2.0x to 2.9x | 250 (13.9%) | 795 (31.6%) |
| 3.0x to 3.9x | 229 (12.7%) | 927 (36.8%) |
| 4.0x or more | 670 (37.2%) | 251 (10.0%) |
| Total | 1,803 (100.0%) | 2,520 (100.0%) |
Real Estate Taxes by Mortgage Status in Cinco Ranch
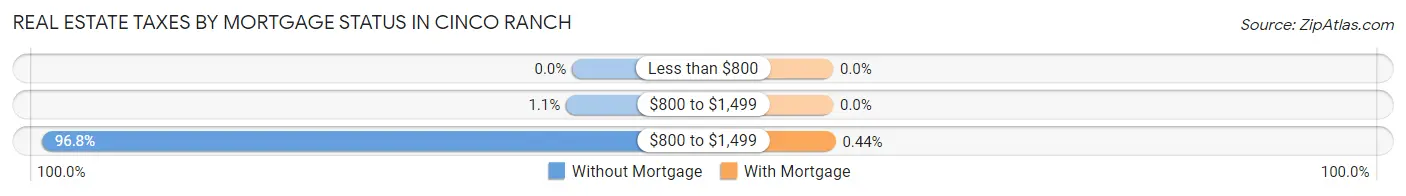
| Property Taxes | Without Mortgage | With Mortgage |
| Less than $800 | 0 (0.0%) | 0 (0.0%) |
| $800 to $1,499 | 20 (1.1%) | 0 (0.0%) |
| $800 to $1,499 | 1,746 (96.8%) | 11 (0.4%) |
| Total | 1,803 (100.0%) | 2,520 (100.0%) |
Health & Disability in Cinco Ranch
Health Insurance Coverage by Age in Cinco Ranch
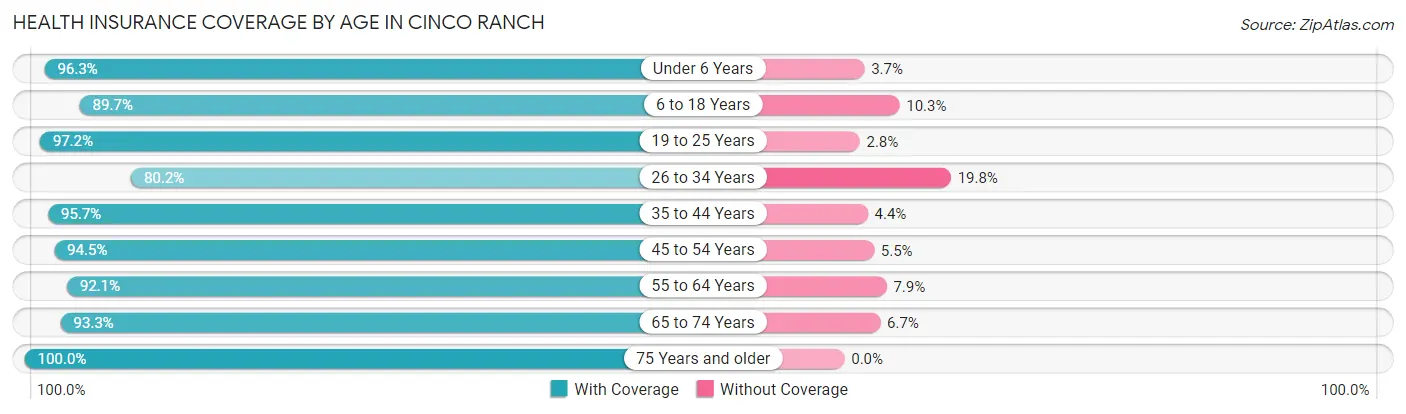
| Age Bracket | With Coverage | Without Coverage |
| Under 6 Years | 1,999 (96.3%) | 77 (3.7%) |
| 6 to 18 Years | 3,349 (89.7%) | 383 (10.3%) |
| 19 to 25 Years | 855 (97.2%) | 25 (2.8%) |
| 26 to 34 Years | 1,281 (80.2%) | 317 (19.8%) |
| 35 to 44 Years | 3,187 (95.7%) | 145 (4.3%) |
| 45 to 54 Years | 2,401 (94.5%) | 140 (5.5%) |
| 55 to 64 Years | 2,189 (92.1%) | 187 (7.9%) |
| 65 to 74 Years | 1,285 (93.3%) | 92 (6.7%) |
| 75 Years and older | 944 (100.0%) | 0 (0.0%) |
| Total | 17,490 (92.8%) | 1,366 (7.2%) |
Health Insurance Coverage by Citizenship Status in Cinco Ranch
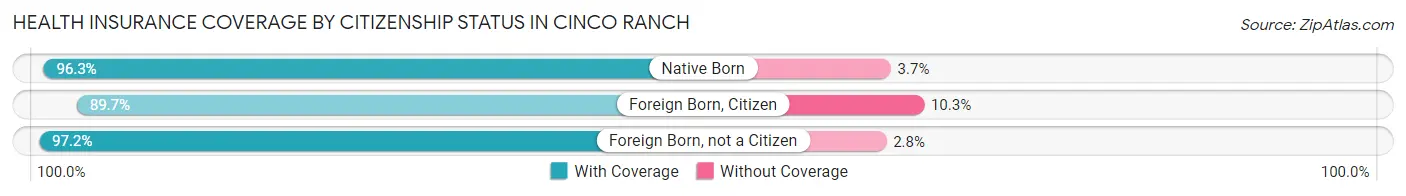
| Citizenship Status | With Coverage | Without Coverage |
| Native Born | 1,999 (96.3%) | 77 (3.7%) |
| Foreign Born, Citizen | 3,349 (89.7%) | 383 (10.3%) |
| Foreign Born, not a Citizen | 855 (97.2%) | 25 (2.8%) |
Health Insurance Coverage by Household Income in Cinco Ranch
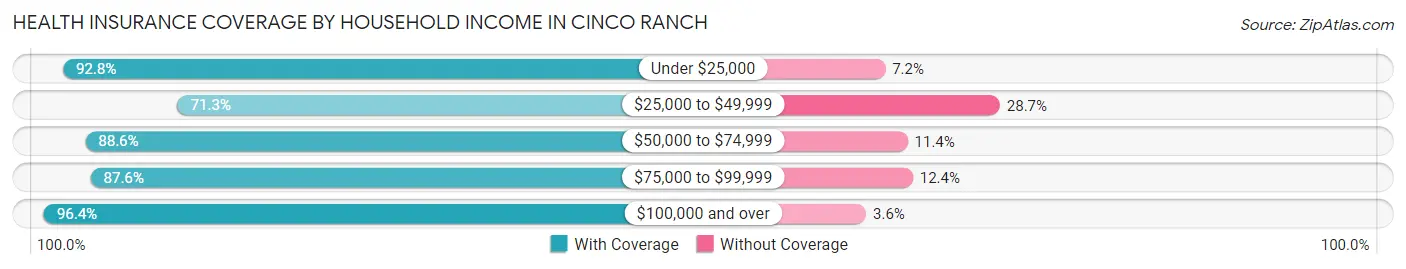
| Household Income | With Coverage | Without Coverage |
| Under $25,000 | 619 (92.8%) | 48 (7.2%) |
| $25,000 to $49,999 | 1,318 (71.3%) | 530 (28.7%) |
| $50,000 to $74,999 | 1,019 (88.6%) | 131 (11.4%) |
| $75,000 to $99,999 | 1,077 (87.6%) | 152 (12.4%) |
| $100,000 and over | 13,457 (96.4%) | 505 (3.6%) |
Public vs Private Health Insurance Coverage by Age in Cinco Ranch
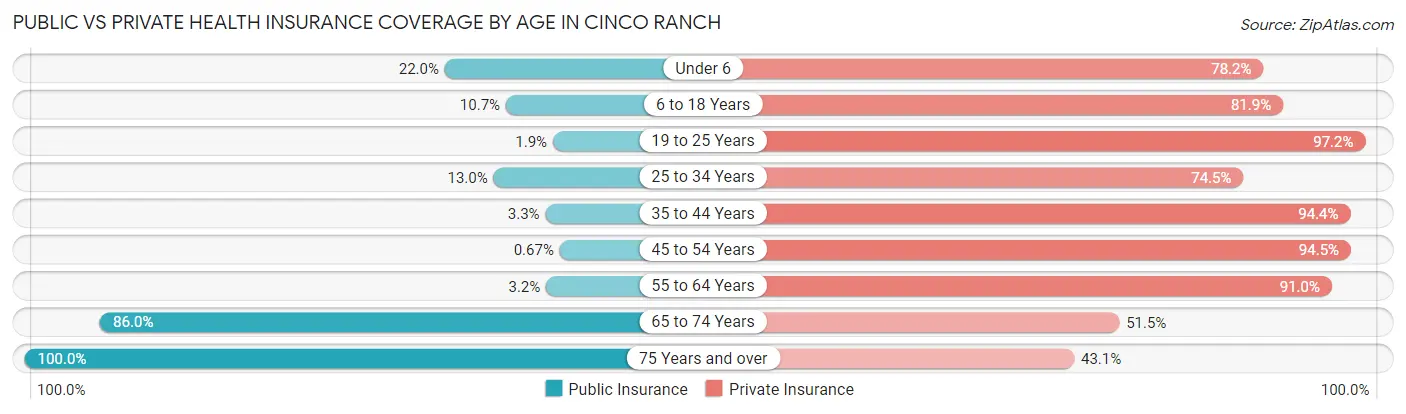
| Age Bracket | Public Insurance | Private Insurance |
| Under 6 | 457 (22.0%) | 1,624 (78.2%) |
| 6 to 18 Years | 398 (10.7%) | 3,056 (81.9%) |
| 19 to 25 Years | 17 (1.9%) | 855 (97.2%) |
| 25 to 34 Years | 207 (13.0%) | 1,191 (74.5%) |
| 35 to 44 Years | 111 (3.3%) | 3,145 (94.4%) |
| 45 to 54 Years | 17 (0.7%) | 2,401 (94.5%) |
| 55 to 64 Years | 76 (3.2%) | 2,161 (90.9%) |
| 65 to 74 Years | 1,184 (86.0%) | 709 (51.5%) |
| 75 Years and over | 944 (100.0%) | 407 (43.1%) |
| Total | 3,411 (18.1%) | 15,549 (82.5%) |
Disability Status by Sex by Age in Cinco Ranch
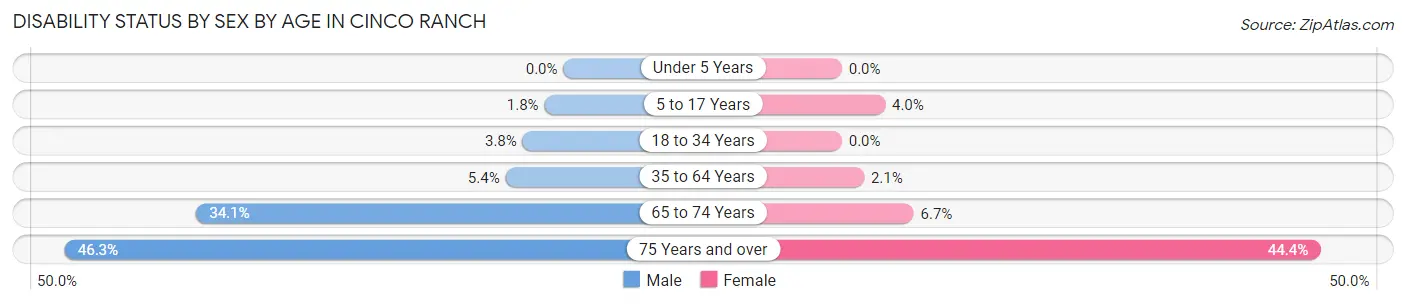
| Age Bracket | Male | Female |
| Under 5 Years | 0 (0.0%) | 0 (0.0%) |
| 5 to 17 Years | 36 (1.8%) | 85 (4.0%) |
| 18 to 34 Years | 44 (3.8%) | 0 (0.0%) |
| 35 to 64 Years | 224 (5.4%) | 84 (2.1%) |
| 65 to 74 Years | 249 (34.1%) | 43 (6.7%) |
| 75 Years and over | 198 (46.3%) | 229 (44.4%) |
Disability Class by Sex by Age in Cinco Ranch
Disability Class: Hearing Difficulty
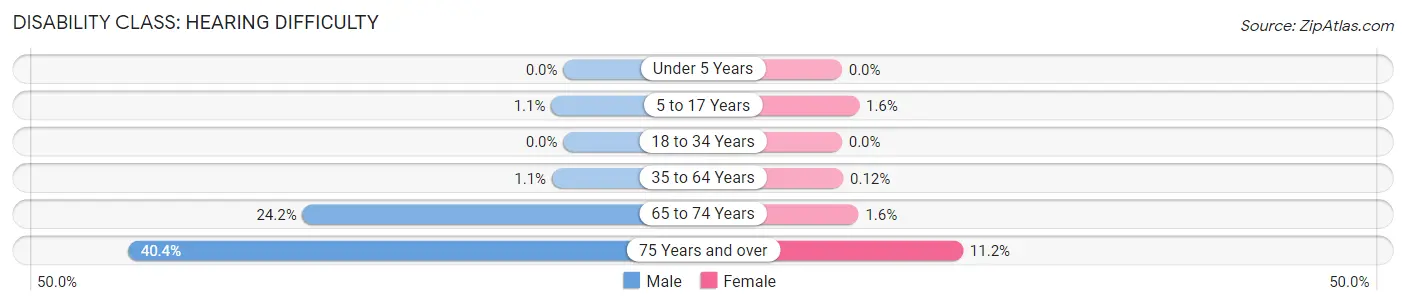
| Age Bracket | Male | Female |
| Under 5 Years | 0 (0.0%) | 0 (0.0%) |
| 5 to 17 Years | 23 (1.1%) | 34 (1.6%) |
| 18 to 34 Years | 0 (0.0%) | 0 (0.0%) |
| 35 to 64 Years | 44 (1.1%) | 5 (0.1%) |
| 65 to 74 Years | 177 (24.2%) | 10 (1.5%) |
| 75 Years and over | 173 (40.4%) | 58 (11.2%) |
Disability Class: Vision Difficulty
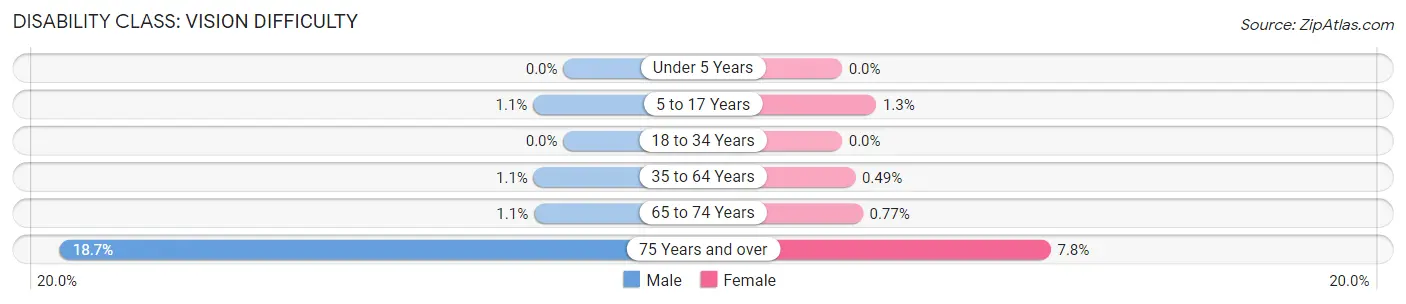
| Age Bracket | Male | Female |
| Under 5 Years | 0 (0.0%) | 0 (0.0%) |
| 5 to 17 Years | 23 (1.1%) | 27 (1.3%) |
| 18 to 34 Years | 0 (0.0%) | 0 (0.0%) |
| 35 to 64 Years | 46 (1.1%) | 20 (0.5%) |
| 65 to 74 Years | 8 (1.1%) | 5 (0.8%) |
| 75 Years and over | 80 (18.7%) | 40 (7.7%) |
Disability Class: Cognitive Difficulty
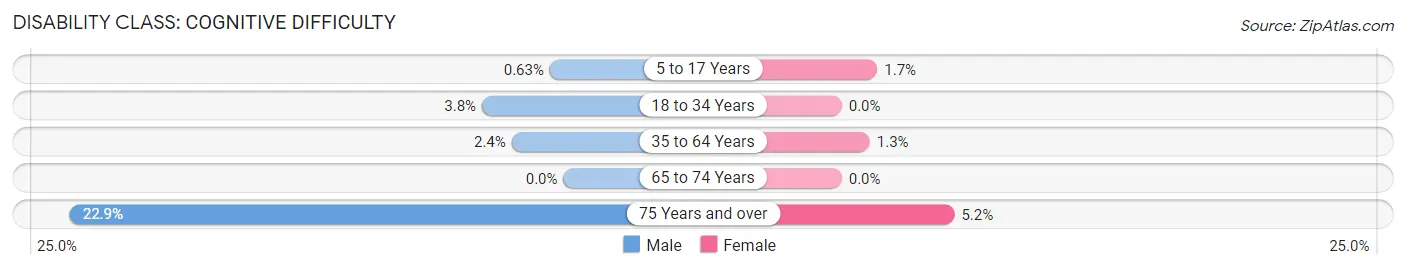
| Age Bracket | Male | Female |
| 5 to 17 Years | 13 (0.6%) | 35 (1.7%) |
| 18 to 34 Years | 44 (3.8%) | 0 (0.0%) |
| 35 to 64 Years | 100 (2.4%) | 53 (1.3%) |
| 65 to 74 Years | 0 (0.0%) | 0 (0.0%) |
| 75 Years and over | 98 (22.9%) | 27 (5.2%) |
Disability Class: Ambulatory Difficulty
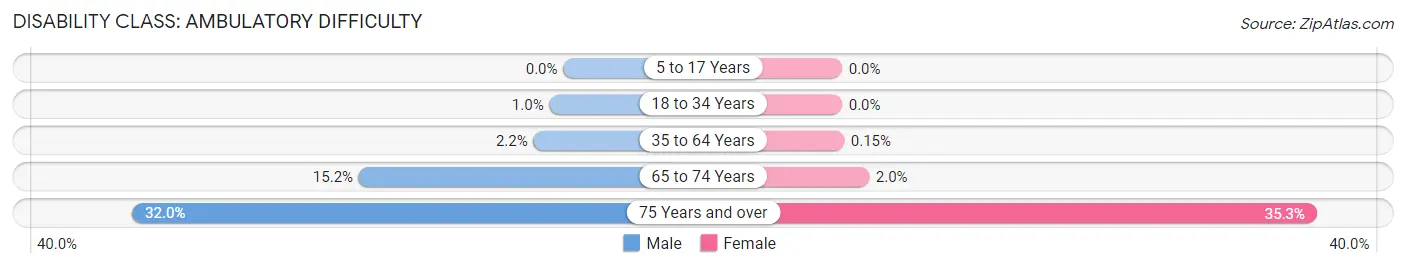
| Age Bracket | Male | Female |
| 5 to 17 Years | 0 (0.0%) | 0 (0.0%) |
| 18 to 34 Years | 12 (1.0%) | 0 (0.0%) |
| 35 to 64 Years | 92 (2.2%) | 6 (0.2%) |
| 65 to 74 Years | 111 (15.2%) | 13 (2.0%) |
| 75 Years and over | 137 (32.0%) | 182 (35.3%) |
Disability Class: Self-Care Difficulty
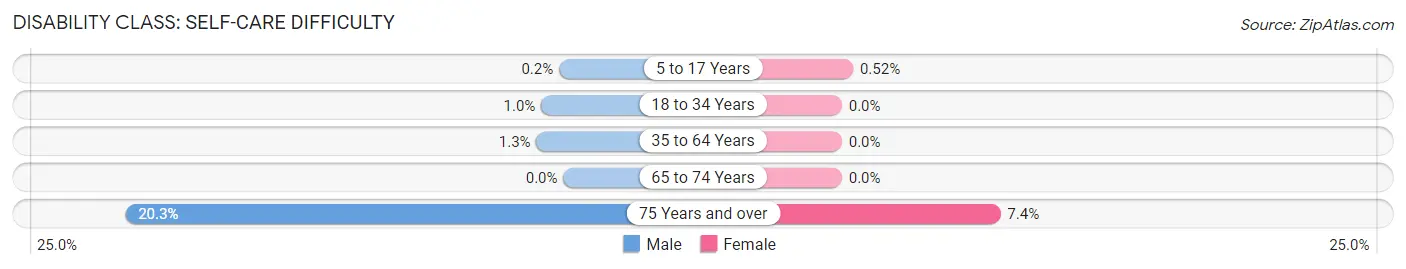
| Age Bracket | Male | Female |
| 5 to 17 Years | 4 (0.2%) | 11 (0.5%) |
| 18 to 34 Years | 12 (1.0%) | 0 (0.0%) |
| 35 to 64 Years | 52 (1.3%) | 0 (0.0%) |
| 65 to 74 Years | 0 (0.0%) | 0 (0.0%) |
| 75 Years and over | 87 (20.3%) | 38 (7.4%) |
Technology Access in Cinco Ranch
Computing Device Access in Cinco Ranch
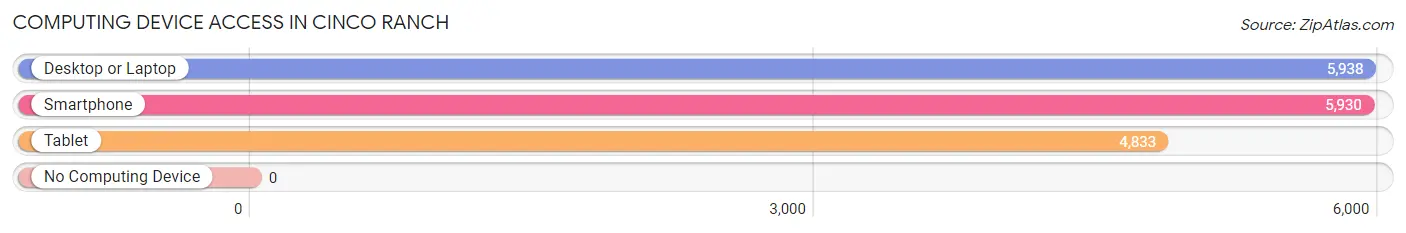
| Device Type | # Households | % Households |
| Desktop or Laptop | 5,938 | 96.4% |
| Smartphone | 5,930 | 96.3% |
| Tablet | 4,833 | 78.4% |
| No Computing Device | 0 | 0.0% |
| Total | 6,161 | 100.0% |
Internet Access in Cinco Ranch
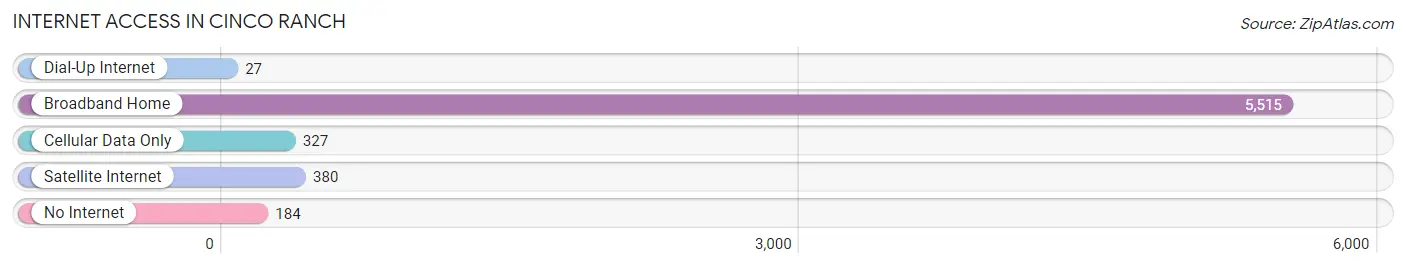
| Internet Type | # Households | % Households |
| Dial-Up Internet | 27 | 0.4% |
| Broadband Home | 5,515 | 89.5% |
| Cellular Data Only | 327 | 5.3% |
| Satellite Internet | 380 | 6.2% |
| No Internet | 184 | 3.0% |
| Total | 6,161 | 100.0% |
Cinco Ranch Summary
Cinco Ranch is a master-planned community located in the Greater Houston area of Fort Bend County, Texas. It is located about 25 miles west of downtown Houston and is part of the Katy Independent School District. The community was developed in the late 1990s and is now home to over 20,000 residents.
Geography
Cinco Ranch is located in the western part of Fort Bend County, Texas. It is situated between the Brazos River and the Katy Freeway, and is bordered by the cities of Katy, Fulshear, and Richmond. The community is located in the Houston-The Woodlands-Sugar Land metropolitan area and is part of the Katy Independent School District.
The community is divided into several distinct neighborhoods, each with its own unique style and amenities. The neighborhoods are connected by a network of trails and greenbelts, which provide residents with access to parks, playgrounds, and other recreational areas.
The climate in Cinco Ranch is humid subtropical, with hot summers and mild winters. The average annual temperature is around 70 degrees Fahrenheit, with temperatures reaching as high as 95 degrees in the summer and as low as 40 degrees in the winter.
Economy
Cinco Ranch is home to a variety of businesses, including retail stores, restaurants, and professional services. The community is also home to several corporate headquarters, including Schlumberger, Halliburton, and Baker Hughes.
The community is served by the Fort Bend County Airport, which provides access to the Houston area. The airport is located just a few miles from Cinco Ranch and offers flights to major cities throughout the United States.
Demographics
As of the 2010 census, the population of Cinco Ranch was 20,226. The racial makeup of the community was 79.3% White, 8.2% African American, 0.3% Native American, 5.2% Asian, and 6.9% from other races. Hispanic or Latino of any race were 16.3% of the population.
The median household income in Cinco Ranch was $107,845, and the median family income was $118,845. The per capita income was $41,845. About 4.3% of families and 5.2% of the population were below the poverty line.
Conclusion
Cinco Ranch is a master-planned community located in the Greater Houston area of Fort Bend County, Texas. It is home to over 20,000 residents and is served by the Fort Bend County Airport. The community is divided into several distinct neighborhoods, each with its own unique style and amenities. The economy of Cinco Ranch is diverse, with a variety of businesses, including retail stores, restaurants, and professional services. The population of Cinco Ranch is diverse, with a majority of White, African American, Asian, and Hispanic or Latino residents. The median household income in Cinco Ranch is higher than the national average, and the per capita income is also higher than the national average.
Common Questions
What is Per Capita Income in Cinco Ranch?
Per Capita income in Cinco Ranch is $57,221.
What is the Median Family Income in Cinco Ranch?
Median Family Income in Cinco Ranch is $165,268.
What is the Median Household income in Cinco Ranch?
Median Household Income in Cinco Ranch is $152,074.
What is Income or Wage Gap in Cinco Ranch?
Income or Wage Gap in Cinco Ranch is 70.5%.
Women in Cinco Ranch earn 29.5 cents for every dollar earned by a man.
What is Inequality or Gini Index in Cinco Ranch?
Inequality or Gini Index in Cinco Ranch is 0.40.
What is the Total Population of Cinco Ranch?
Total Population of Cinco Ranch is 18,856.
What is the Total Male Population of Cinco Ranch?
Total Male Population of Cinco Ranch is 9,145.
What is the Total Female Population of Cinco Ranch?
Total Female Population of Cinco Ranch is 9,711.
What is the Ratio of Males per 100 Females in Cinco Ranch?
There are 94.17 Males per 100 Females in Cinco Ranch.
What is the Ratio of Females per 100 Males in Cinco Ranch?
There are 106.19 Females per 100 Males in Cinco Ranch.
What is the Median Population Age in Cinco Ranch?
Median Population Age in Cinco Ranch is 38.6 Years.
What is the Average Family Size in Cinco Ranch
Average Family Size in Cinco Ranch is 3.4 People.
What is the Average Household Size in Cinco Ranch
Average Household Size in Cinco Ranch is 3.1 People.
How Large is the Labor Force in Cinco Ranch?
There are 8,725 People in the Labor Forcein in Cinco Ranch.
What is the Percentage of People in the Labor Force in Cinco Ranch?
61.3% of People are in the Labor Force in Cinco Ranch.
What is the Unemployment Rate in Cinco Ranch?
Unemployment Rate in Cinco Ranch is 4.6%.