Rangerville, TX Map & Demographics
Rangerville Map
Rangerville Overview
$15,883
PER CAPITA INCOME
$27,361
AVG FAMILY INCOME
$24,324
AVG HOUSEHOLD INCOME
0.22
INEQUALITY / GINI INDEX
106
TOTAL POPULATION
75
MALE POPULATION
31
FEMALE POPULATION
241.94
MALES / 100 FEMALES
41.33
FEMALES / 100 MALES
43.5
MEDIAN AGE
3.6
AVG FAMILY SIZE
2.0
AVG HOUSEHOLD SIZE
53
LABOR FORCE [ PEOPLE ]
76.8%
PERCENT IN LABOR FORCE
Income in Rangerville
Income Overview in Rangerville
Per Capita Income in Rangerville is $15,883, while median incomes of families and households are $27,361 and $24,324 respectively.
| Characteristic | Number | Measure |
| Per Capita Income | 106 | $15,883 |
| Median Family Income | 17 | $27,361 |
| Mean Family Income | 17 | $32,688 |
| Median Household Income | 54 | $24,324 |
| Mean Household Income | 54 | $32,580 |
| Income Deficit | 17 | $0 |
| Wage / Income Gap (%) | 106 | 0.00% |
| Wage / Income Gap ($) | 106 | 100.00¢ per $1 |
| Gini / Inequality Index | 106 | 0.22 |
Earnings by Sex in Rangerville
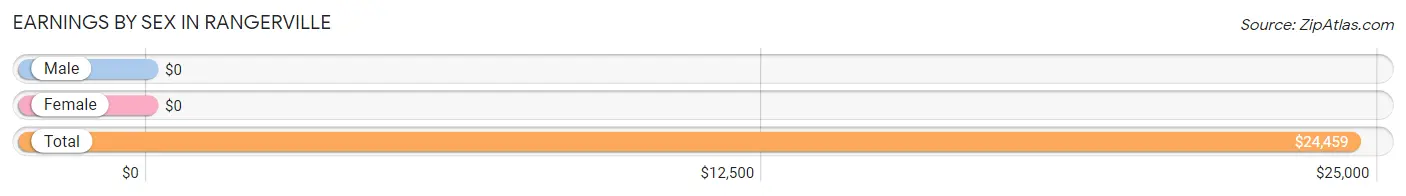
| Sex | Number | Average Earnings |
| Male | 46 (79.3%) | $0 |
| Female | 12 (20.7%) | $0 |
| Total | 58 (100.0%) | $24,459 |
Earnings by Sex by Income Bracket in Rangerville
The most common earnings brackets in Rangerville are $22,500 to $24,999 for men (37 | 80.4%) and $30,000 to $34,999 for women (12 | 100.0%).
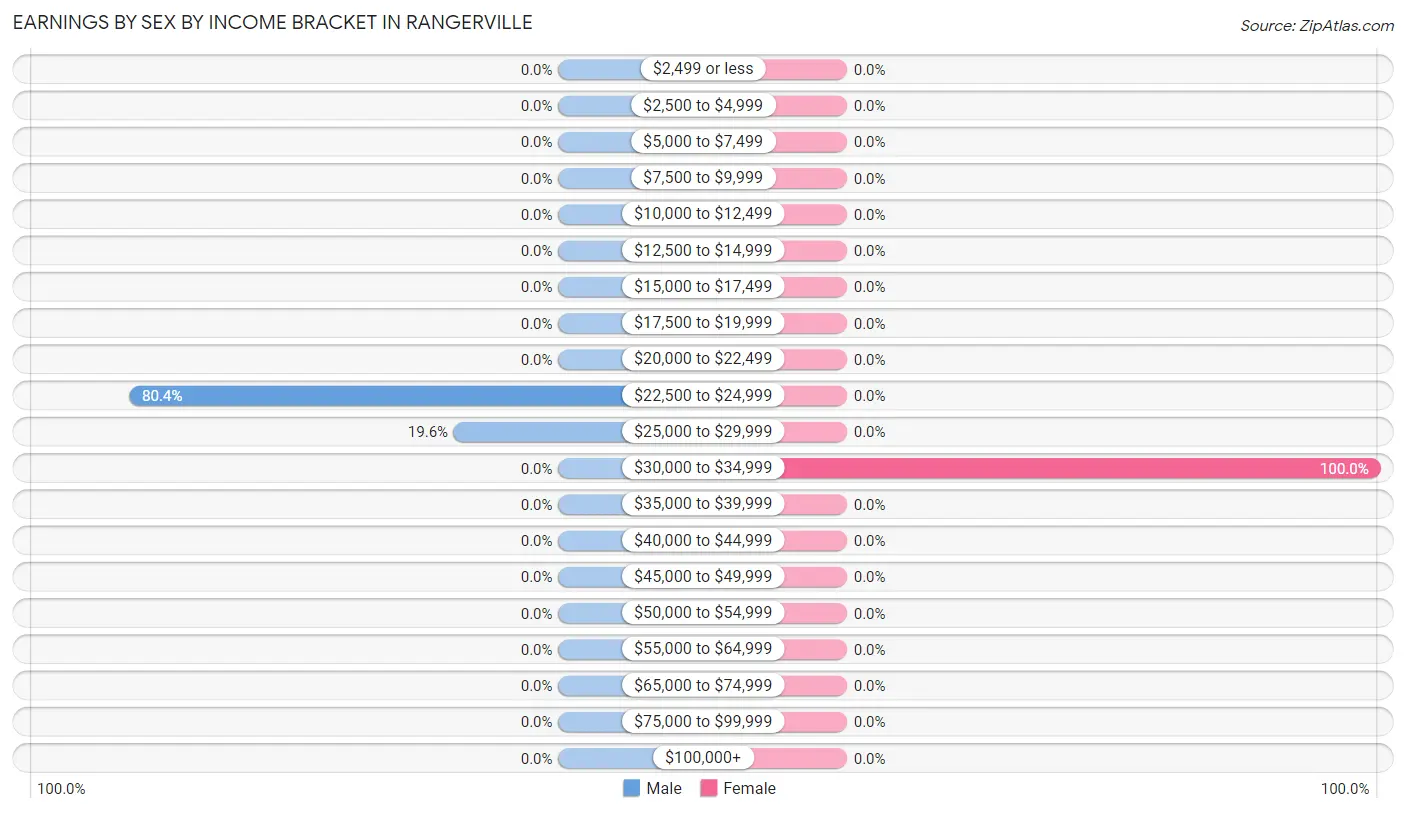
| Income | Male | Female |
| $2,499 or less | 0 (0.0%) | 0 (0.0%) |
| $2,500 to $4,999 | 0 (0.0%) | 0 (0.0%) |
| $5,000 to $7,499 | 0 (0.0%) | 0 (0.0%) |
| $7,500 to $9,999 | 0 (0.0%) | 0 (0.0%) |
| $10,000 to $12,499 | 0 (0.0%) | 0 (0.0%) |
| $12,500 to $14,999 | 0 (0.0%) | 0 (0.0%) |
| $15,000 to $17,499 | 0 (0.0%) | 0 (0.0%) |
| $17,500 to $19,999 | 0 (0.0%) | 0 (0.0%) |
| $20,000 to $22,499 | 0 (0.0%) | 0 (0.0%) |
| $22,500 to $24,999 | 37 (80.4%) | 0 (0.0%) |
| $25,000 to $29,999 | 9 (19.6%) | 0 (0.0%) |
| $30,000 to $34,999 | 0 (0.0%) | 12 (100.0%) |
| $35,000 to $39,999 | 0 (0.0%) | 0 (0.0%) |
| $40,000 to $44,999 | 0 (0.0%) | 0 (0.0%) |
| $45,000 to $49,999 | 0 (0.0%) | 0 (0.0%) |
| $50,000 to $54,999 | 0 (0.0%) | 0 (0.0%) |
| $55,000 to $64,999 | 0 (0.0%) | 0 (0.0%) |
| $65,000 to $74,999 | 0 (0.0%) | 0 (0.0%) |
| $75,000 to $99,999 | 0 (0.0%) | 0 (0.0%) |
| $100,000+ | 0 (0.0%) | 0 (0.0%) |
| Total | 46 (100.0%) | 12 (100.0%) |
Earnings by Sex by Educational Attainment in Rangerville
| Educational Attainment | Male Income | Female Income |
| Less than High School | - | - |
| High School Diploma | - | - |
| College or Associate's Degree | - | - |
| Bachelor's Degree | - | - |
| Graduate Degree | - | - |
| Total | - | - |
Family Income in Rangerville
Family Income Brackets in Rangerville
According to the Rangerville family income data, there are 12 families falling into the $25,000 to $34,999 income range, which is the most common income bracket and makes up 70.6% of all families.
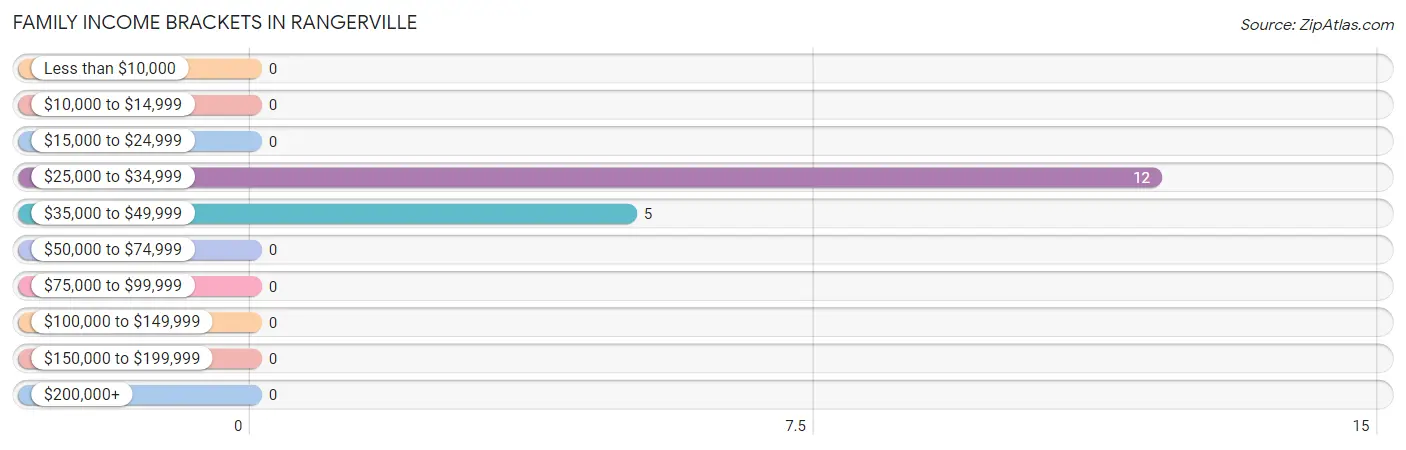
| Income Bracket | # Families | % Families |
| Less than $10,000 | 0 | 0.0% |
| $10,000 to $14,999 | 0 | 0.0% |
| $15,000 to $24,999 | 0 | 0.0% |
| $25,000 to $34,999 | 12 | 70.6% |
| $35,000 to $49,999 | 5 | 29.4% |
| $50,000 to $74,999 | 0 | 0.0% |
| $75,000 to $99,999 | 0 | 0.0% |
| $100,000 to $149,999 | 0 | 0.0% |
| $150,000 to $199,999 | 0 | 0.0% |
| $200,000+ | 0 | 0.0% |
Family Income by Famaliy Size in Rangerville
| Income Bracket | # Families | Median Income |
| 2-Person Families | 8 (47.1%) | $0 |
| 3-Person Families | 0 (0.0%) | $0 |
| 4-Person Families | 0 (0.0%) | $0 |
| 5-Person Families | 0 (0.0%) | $0 |
| 6-Person Families | 9 (52.9%) | $0 |
| 7+ Person Families | 0 (0.0%) | $0 |
| Total | 17 (100.0%) | $27,361 |
Family Income by Number of Earners in Rangerville
| Number of Earners | # Families | Median Income |
| No Earners | 3 (17.6%) | $0 |
| 1 Earner | 14 (82.4%) | $0 |
| 2 Earners | 0 (0.0%) | $0 |
| 3+ Earners | 0 (0.0%) | $0 |
| Total | 17 (100.0%) | $27,361 |
Household Income in Rangerville
Household Income Brackets in Rangerville
With 37 households falling in the category, the $15,000 to $24,999 income range is the most frequent in Rangerville, accounting for 68.5% of all households.
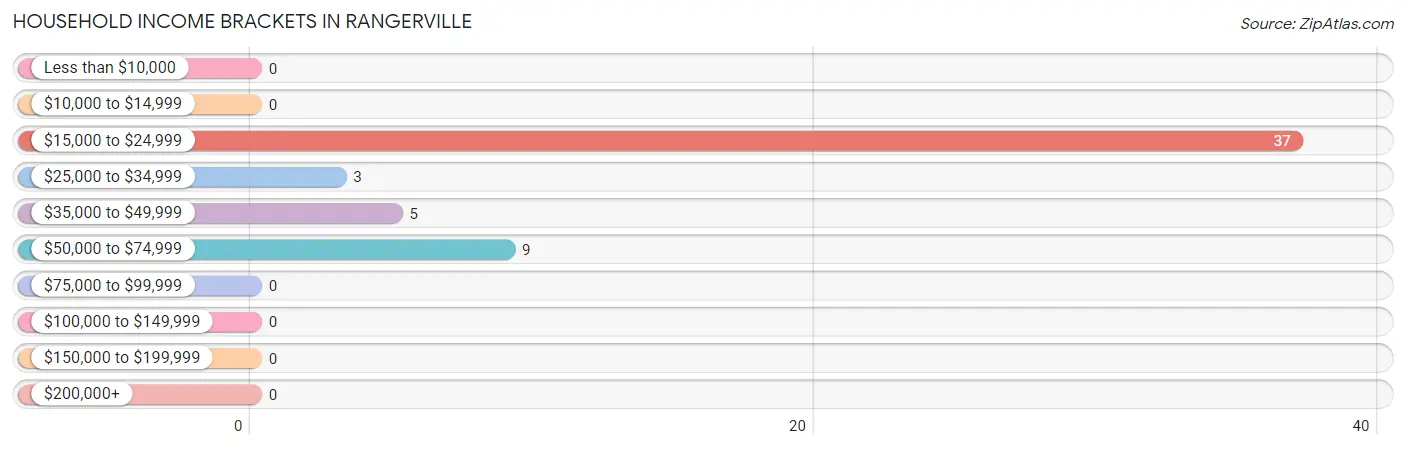
| Income Bracket | # Households | % Households |
| Less than $10,000 | 0 | 0.0% |
| $10,000 to $14,999 | 0 | 0.0% |
| $15,000 to $24,999 | 37 | 68.5% |
| $25,000 to $34,999 | 3 | 5.6% |
| $35,000 to $49,999 | 5 | 9.3% |
| $50,000 to $74,999 | 9 | 16.7% |
| $75,000 to $99,999 | 0 | 0.0% |
| $100,000 to $149,999 | 0 | 0.0% |
| $150,000 to $199,999 | 0 | 0.0% |
| $200,000+ | 0 | 0.0% |
Household Income by Householder Age in Rangerville
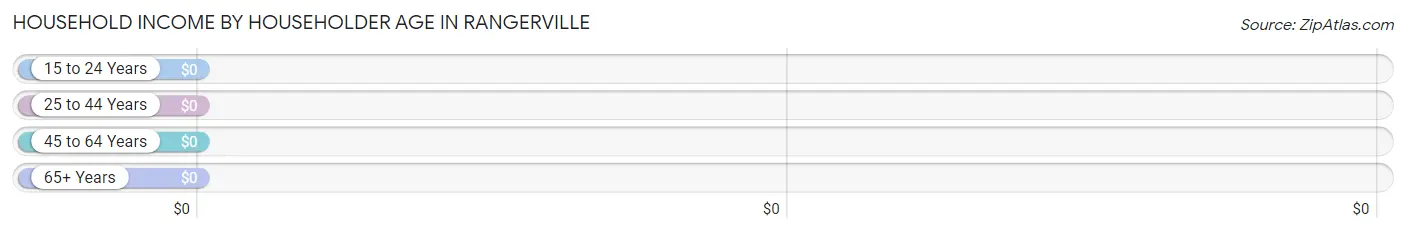
| Income Bracket | # Households | Median Income |
| 15 to 24 Years | 0 (0.0%) | $0 |
| 25 to 44 Years | 9 (16.7%) | $0 |
| 45 to 64 Years | 37 (68.5%) | $0 |
| 65+ Years | 8 (14.8%) | $0 |
| Total | 54 (100.0%) | $24,324 |
Poverty in Rangerville
Income Below Poverty by Sex and Age in Rangerville
With 40.0% poverty level for males and 51.6% for females among the residents of Rangerville, 5 year old males and 6 to 11 year old females are the most vulnerable to poverty, with 7 males (100.0%) and 8 females (100.0%) in their respective age groups living below the poverty level.
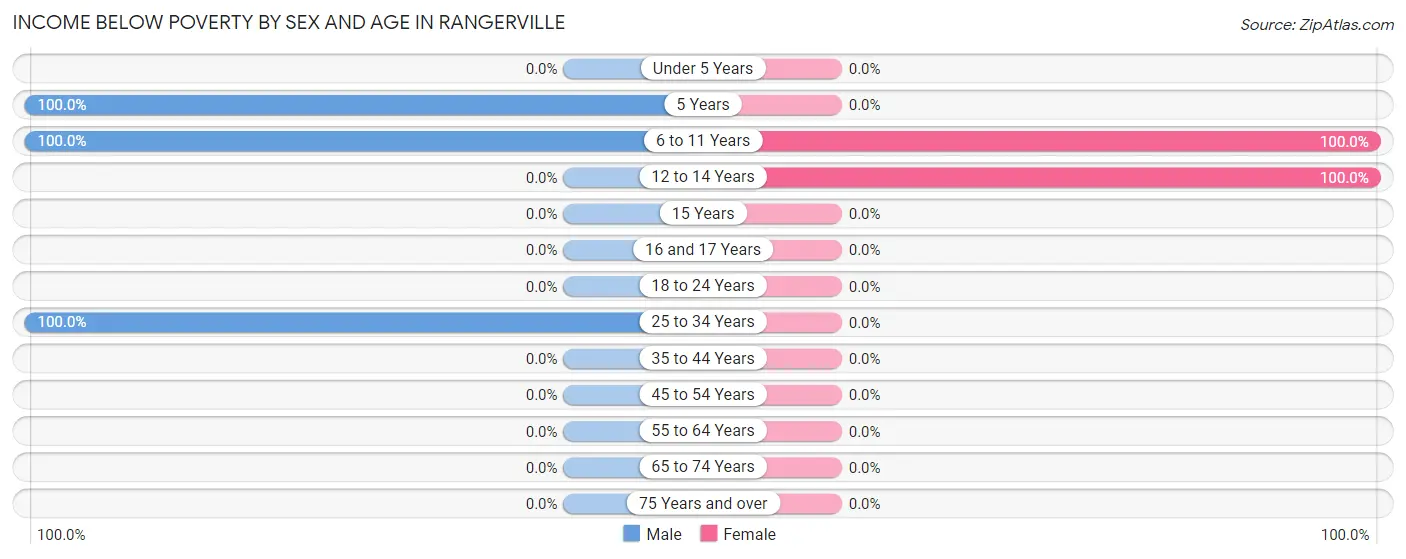
| Age Bracket | Male | Female |
| Under 5 Years | 0 (0.0%) | 0 (0.0%) |
| 5 Years | 7 (100.0%) | 0 (0.0%) |
| 6 to 11 Years | 14 (100.0%) | 8 (100.0%) |
| 12 to 14 Years | 0 (0.0%) | 8 (100.0%) |
| 15 Years | 0 (0.0%) | 0 (0.0%) |
| 16 and 17 Years | 0 (0.0%) | 0 (0.0%) |
| 18 to 24 Years | 0 (0.0%) | 0 (0.0%) |
| 25 to 34 Years | 9 (100.0%) | 0 (0.0%) |
| 35 to 44 Years | 0 (0.0%) | 0 (0.0%) |
| 45 to 54 Years | 0 (0.0%) | 0 (0.0%) |
| 55 to 64 Years | 0 (0.0%) | 0 (0.0%) |
| 65 to 74 Years | 0 (0.0%) | 0 (0.0%) |
| 75 Years and over | 0 (0.0%) | 0 (0.0%) |
| Total | 30 (40.0%) | 16 (51.6%) |
Income Above Poverty by Sex and Age in Rangerville
According to the poverty statistics in Rangerville, males aged 55 to 64 years and females aged 25 to 34 years are the age groups that are most secure financially, with 100.0% of males and 100.0% of females in these age groups living above the poverty line.
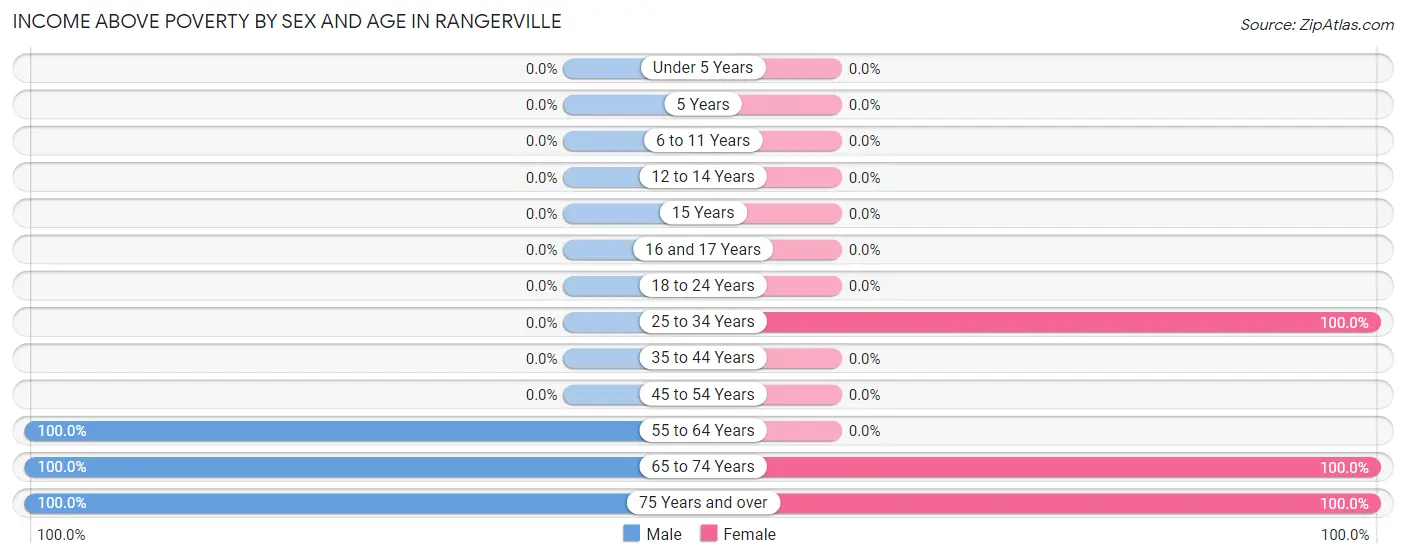
| Age Bracket | Male | Female |
| Under 5 Years | 0 (0.0%) | 0 (0.0%) |
| 5 Years | 0 (0.0%) | 0 (0.0%) |
| 6 to 11 Years | 0 (0.0%) | 0 (0.0%) |
| 12 to 14 Years | 0 (0.0%) | 0 (0.0%) |
| 15 Years | 0 (0.0%) | 0 (0.0%) |
| 16 and 17 Years | 0 (0.0%) | 0 (0.0%) |
| 18 to 24 Years | 0 (0.0%) | 0 (0.0%) |
| 25 to 34 Years | 0 (0.0%) | 7 (100.0%) |
| 35 to 44 Years | 0 (0.0%) | 0 (0.0%) |
| 45 to 54 Years | 0 (0.0%) | 0 (0.0%) |
| 55 to 64 Years | 37 (100.0%) | 0 (0.0%) |
| 65 to 74 Years | 5 (100.0%) | 5 (100.0%) |
| 75 Years and over | 3 (100.0%) | 3 (100.0%) |
| Total | 45 (60.0%) | 15 (48.4%) |
Income Below Poverty Among Married-Couple Families in Rangerville
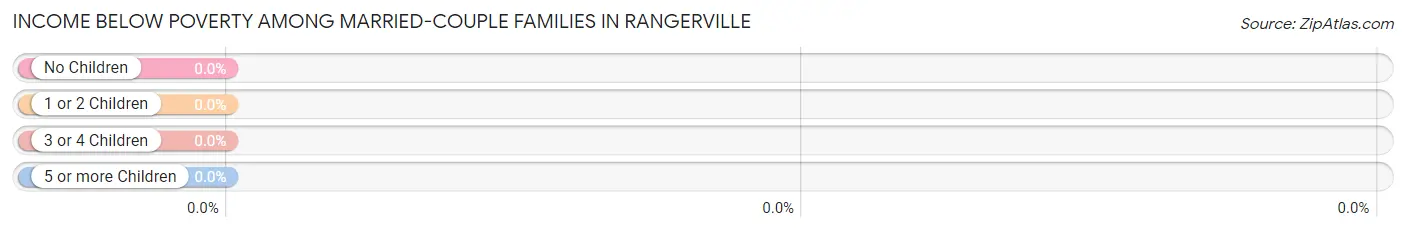
| Children | Above Poverty | Below Poverty |
| No Children | 8 (100.0%) | 0 (0.0%) |
| 1 or 2 Children | 0 (0.0%) | 0 (0.0%) |
| 3 or 4 Children | 0 (0.0%) | 0 (0.0%) |
| 5 or more Children | 0 (0.0%) | 0 (0.0%) |
| Total | 8 (100.0%) | 0 (0.0%) |
Income Below Poverty Among Single-Parent Households in Rangerville
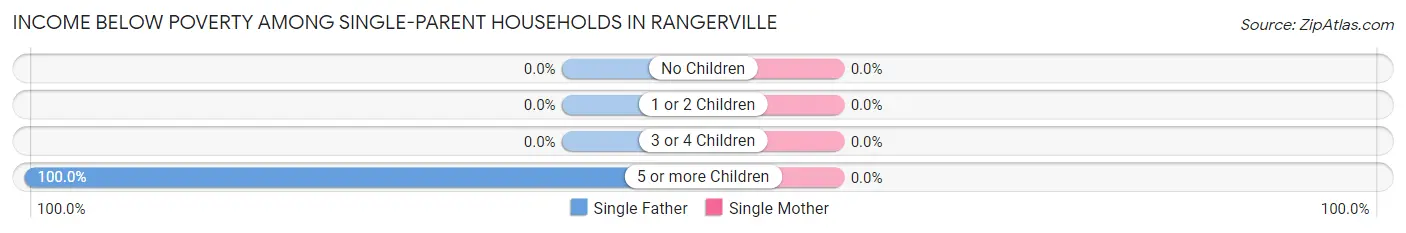
| Children | Single Father | Single Mother |
| No Children | 0 (0.0%) | 0 (0.0%) |
| 1 or 2 Children | 0 (0.0%) | 0 (0.0%) |
| 3 or 4 Children | 0 (0.0%) | 0 (0.0%) |
| 5 or more Children | 9 (100.0%) | 0 (0.0%) |
| Total | 9 (100.0%) | 0 (0.0%) |
Income Below Poverty Among Married-Couple vs Single-Parent Households in Rangerville
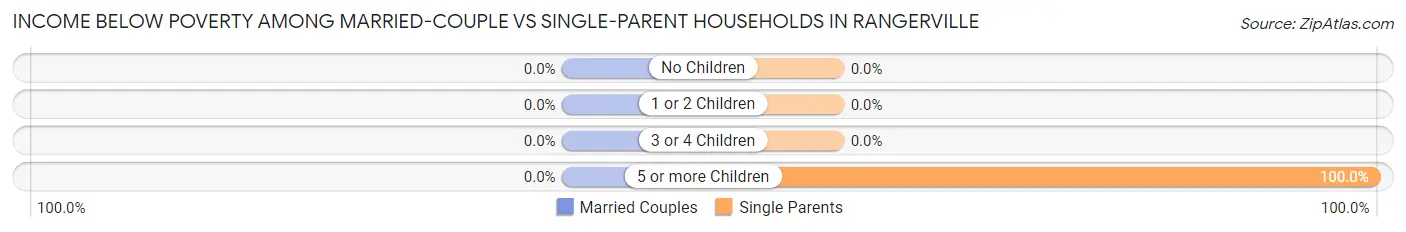
| Children | Married-Couple Families | Single-Parent Households |
| No Children | 0 (0.0%) | 0 (0.0%) |
| 1 or 2 Children | 0 (0.0%) | 0 (0.0%) |
| 3 or 4 Children | 0 (0.0%) | 0 (0.0%) |
| 5 or more Children | 0 (0.0%) | 9 (100.0%) |
| Total | 0 (0.0%) | 9 (100.0%) |
Race in Rangerville
The most populous races in Rangerville are White / Caucasian (106 | 100.0%), and Hispanic or Latino (69 | 65.1%).
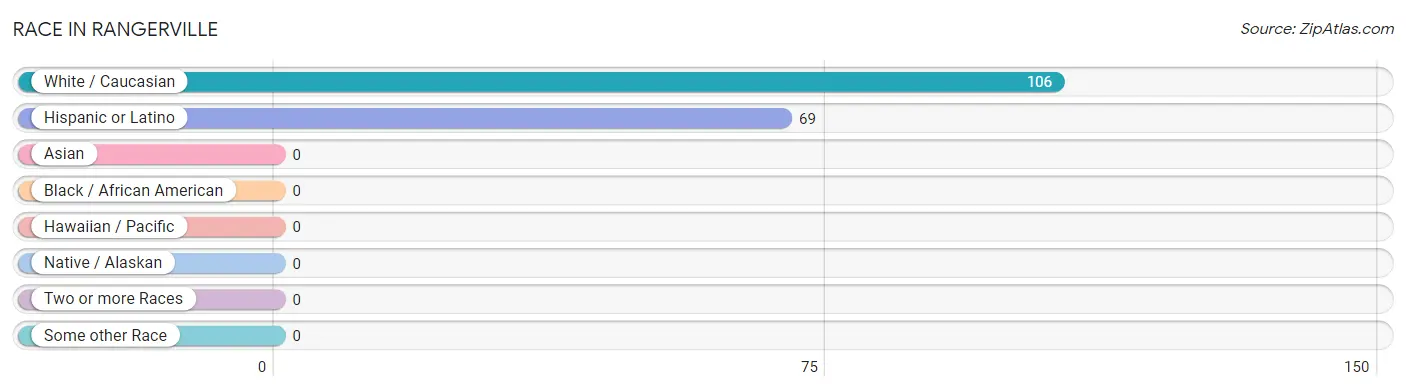
| Race | # Population | % Population |
| Asian | 0 | 0.0% |
| Black / African American | 0 | 0.0% |
| Hawaiian / Pacific | 0 | 0.0% |
| Hispanic or Latino | 69 | 65.1% |
| Native / Alaskan | 0 | 0.0% |
| White / Caucasian | 106 | 100.0% |
| Two or more Races | 0 | 0.0% |
| Some other Race | 0 | 0.0% |
| Total | 106 | 100.0% |
Ancestry in Rangerville
The most populous ancestries reported in Rangerville are Mexican (59 | 55.7%), and German (37 | 34.9%), together accounting for 90.6% of all Rangerville residents.
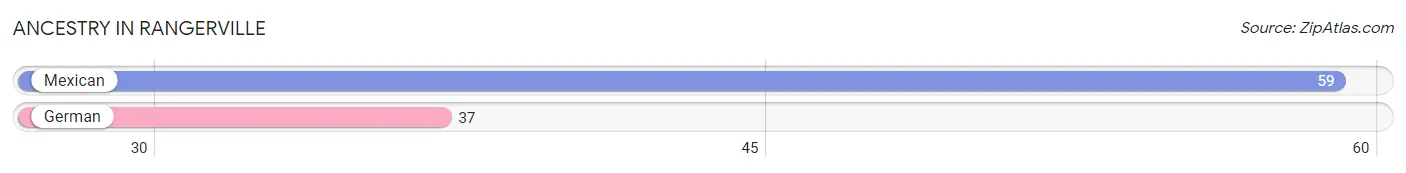
| Ancestry | # Population | % Population |
| German | 37 | 34.9% |
| Mexican | 59 | 55.7% | View All 2 Rows |
Immigrants in Rangerville
The most numerous immigrant groups reported in Rangerville came from Central America (6 | 5.7%), Latin America (6 | 5.7%), and Mexico (6 | 5.7%), together accounting for 17.0% of all Rangerville residents.
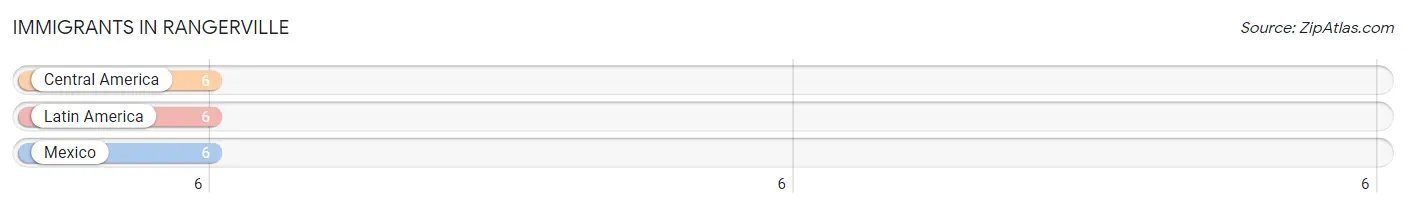
| Immigration Origin | # Population | % Population |
| Central America | 6 | 5.7% |
| Latin America | 6 | 5.7% |
| Mexico | 6 | 5.7% | View All 3 Rows |
Sex and Age in Rangerville
Sex and Age in Rangerville
The most populous age groups in Rangerville are 55 to 59 Years (37 | 49.3%) for men and 10 to 14 Years (16 | 51.6%) for women.
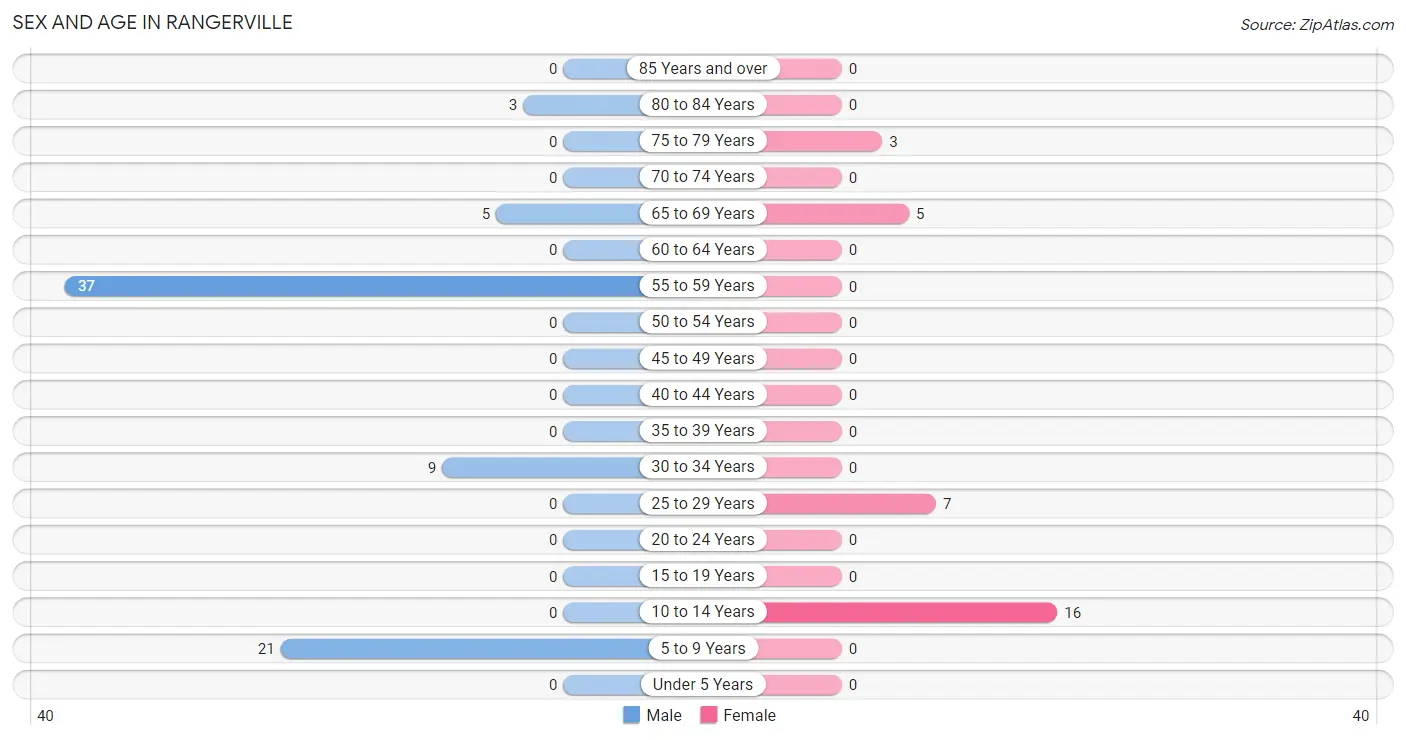
| Age Bracket | Male | Female |
| Under 5 Years | 0 (0.0%) | 0 (0.0%) |
| 5 to 9 Years | 21 (28.0%) | 0 (0.0%) |
| 10 to 14 Years | 0 (0.0%) | 16 (51.6%) |
| 15 to 19 Years | 0 (0.0%) | 0 (0.0%) |
| 20 to 24 Years | 0 (0.0%) | 0 (0.0%) |
| 25 to 29 Years | 0 (0.0%) | 7 (22.6%) |
| 30 to 34 Years | 9 (12.0%) | 0 (0.0%) |
| 35 to 39 Years | 0 (0.0%) | 0 (0.0%) |
| 40 to 44 Years | 0 (0.0%) | 0 (0.0%) |
| 45 to 49 Years | 0 (0.0%) | 0 (0.0%) |
| 50 to 54 Years | 0 (0.0%) | 0 (0.0%) |
| 55 to 59 Years | 37 (49.3%) | 0 (0.0%) |
| 60 to 64 Years | 0 (0.0%) | 0 (0.0%) |
| 65 to 69 Years | 5 (6.7%) | 5 (16.1%) |
| 70 to 74 Years | 0 (0.0%) | 0 (0.0%) |
| 75 to 79 Years | 0 (0.0%) | 3 (9.7%) |
| 80 to 84 Years | 3 (4.0%) | 0 (0.0%) |
| 85 Years and over | 0 (0.0%) | 0 (0.0%) |
| Total | 75 (100.0%) | 31 (100.0%) |
Families and Households in Rangerville
Median Family Size in Rangerville
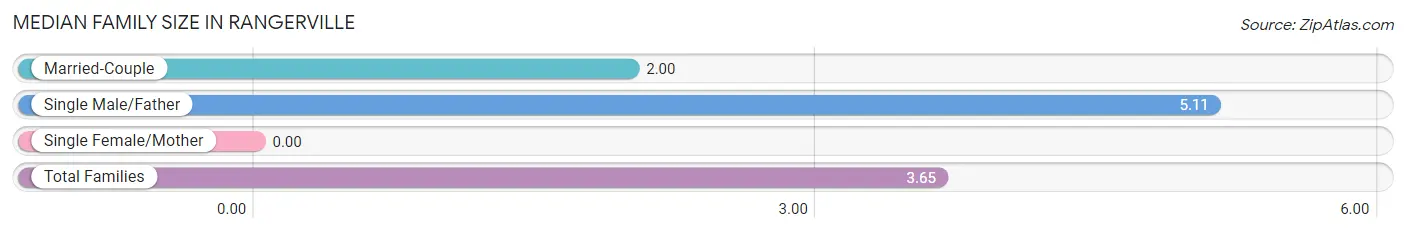
| Family Type | # Families | Family Size |
| Married-Couple | 8 (47.1%) | 2.00 |
| Single Male/Father | 9 (52.9%) | 5.11 |
| Single Female/Mother | 0 (0.0%) | - |
| Total Families | 17 (100.0%) | 3.65 |
Median Household Size in Rangerville
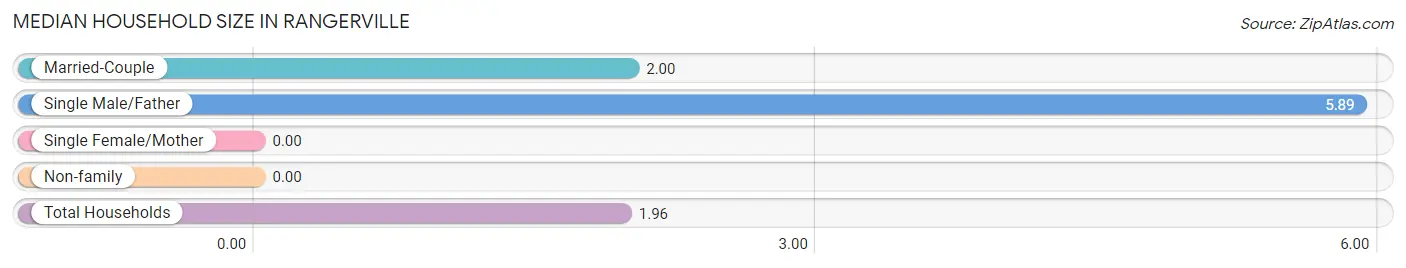
| Household Type | # Households | Household Size |
| Married-Couple | 8 (14.8%) | 2.00 |
| Single Male/Father | 9 (16.7%) | 5.89 |
| Single Female/Mother | 0 (0.0%) | - |
| Non-family | 37 (68.5%) | - |
| Total Households | 54 (100.0%) | 1.96 |
Household Size by Marriage Status in Rangerville
Out of a total of 54 households in Rangerville, 17 (31.5%) are family households, while 37 (68.5%) are nonfamily households. The most numerous type of family households are 7+ person households, comprising 9, and the most common type of nonfamily households are 1-person households, comprising 37.
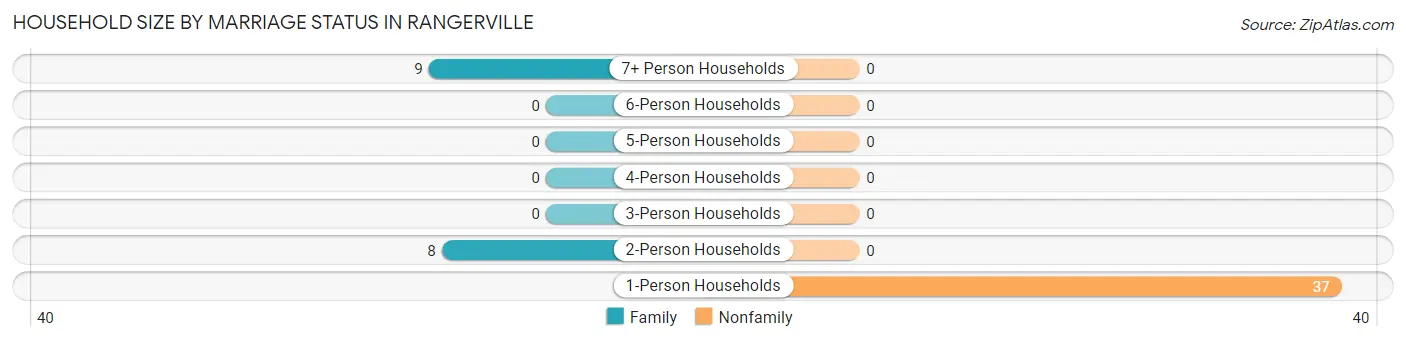
| Household Size | Family Households | Nonfamily Households |
| 1-Person Households | - | 37 (68.5%) |
| 2-Person Households | 8 (14.8%) | 0 (0.0%) |
| 3-Person Households | 0 (0.0%) | 0 (0.0%) |
| 4-Person Households | 0 (0.0%) | 0 (0.0%) |
| 5-Person Households | 0 (0.0%) | 0 (0.0%) |
| 6-Person Households | 0 (0.0%) | 0 (0.0%) |
| 7+ Person Households | 9 (16.7%) | 0 (0.0%) |
| Total | 17 (31.5%) | 37 (68.5%) |
Female Fertility in Rangerville
Fertility by Age in Rangerville
| Age Bracket | Women with Births | Births / 1,000 Women |
| 15 to 19 years | 0 (0.0%) | 0.0 |
| 20 to 34 years | 0 (0.0%) | 0.0 |
| 35 to 50 years | 0 (0.0%) | 0.0 |
| Total | 0 (0.0%) | 0.0 |
Fertility by Age by Marriage Status in Rangerville
| Age Bracket | Married | Unmarried |
| 15 to 19 years | 0 (0.0%) | 0 (0.0%) |
| 20 to 34 years | 0 (0.0%) | 0 (0.0%) |
| 35 to 50 years | 0 (0.0%) | 0 (0.0%) |
| Total | 0 (0.0%) | 0 (0.0%) |
Fertility by Education in Rangerville
| Educational Attainment | Women with Births | Births / 1,000 Women |
| Less than High School | 0 (0.0%) | 0.0 |
| High School Diploma | 0 (0.0%) | 0.0 |
| College or Associate's Degree | 0 (0.0%) | 0.0 |
| Bachelor's Degree | 0 (0.0%) | 0.0 |
| Graduate Degree | 0 (0.0%) | 0.0 |
| Total | 0 (0.0%) | 0.0 |
Fertility by Education by Marriage Status in Rangerville
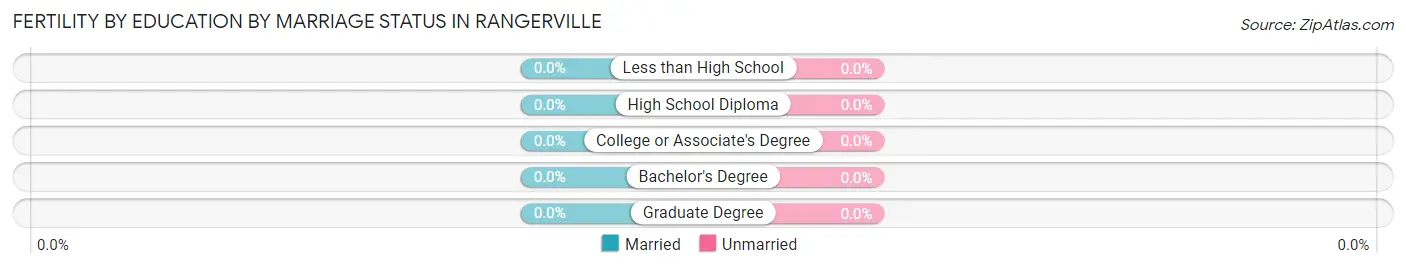
| Educational Attainment | Married | Unmarried |
| Less than High School | 0 (0.0%) | 0 (0.0%) |
| High School Diploma | 0 (0.0%) | 0 (0.0%) |
| College or Associate's Degree | 0 (0.0%) | 0 (0.0%) |
| Bachelor's Degree | 0 (0.0%) | 0 (0.0%) |
| Graduate Degree | 0 (0.0%) | 0 (0.0%) |
| Total | 0 (0.0%) | 0 (0.0%) |
Employment Characteristics in Rangerville
Employment by Class of Employer in Rangerville
Among the 53 employed individuals in Rangerville, , and private company employees (53 | 100.0%) make up the most common classes of employment.
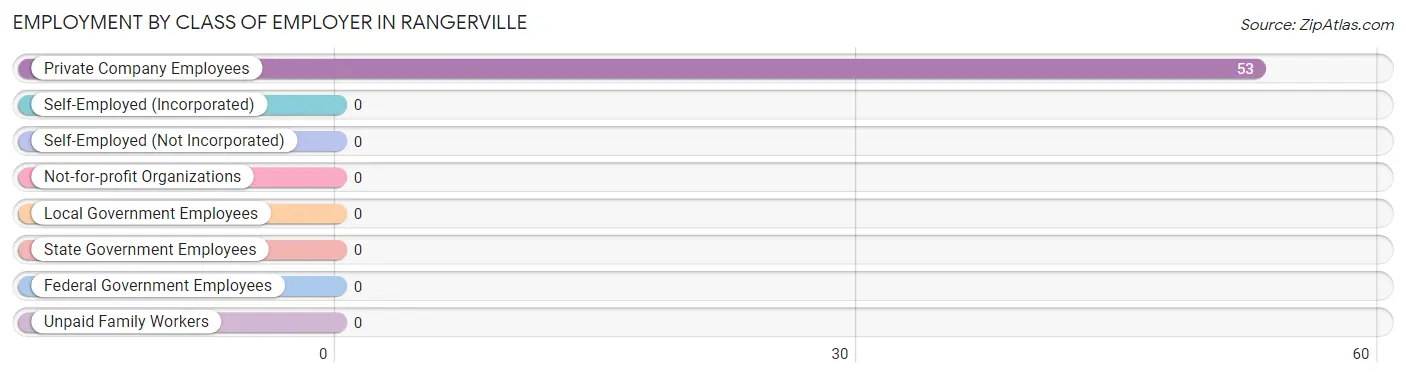
| Employer Class | # Employees | % Employees |
| Private Company Employees | 53 | 100.0% |
| Self-Employed (Incorporated) | 0 | 0.0% |
| Self-Employed (Not Incorporated) | 0 | 0.0% |
| Not-for-profit Organizations | 0 | 0.0% |
| Local Government Employees | 0 | 0.0% |
| State Government Employees | 0 | 0.0% |
| Federal Government Employees | 0 | 0.0% |
| Unpaid Family Workers | 0 | 0.0% |
| Total | 53 | 100.0% |
Employment Status by Age in Rangerville
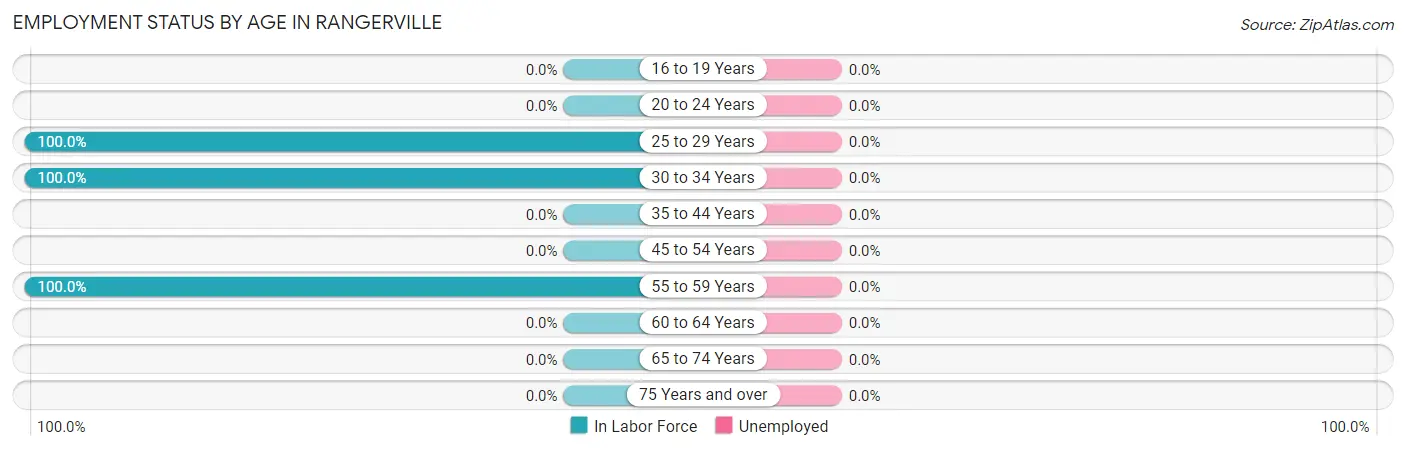
| Age Bracket | In Labor Force | Unemployed |
| 16 to 19 Years | 0 (0.0%) | 0 (0.0%) |
| 20 to 24 Years | 0 (0.0%) | 0 (0.0%) |
| 25 to 29 Years | 7 (100.0%) | 0 (0.0%) |
| 30 to 34 Years | 9 (100.0%) | 0 (0.0%) |
| 35 to 44 Years | 0 (0.0%) | 0 (0.0%) |
| 45 to 54 Years | 0 (0.0%) | 0 (0.0%) |
| 55 to 59 Years | 37 (100.0%) | 0 (0.0%) |
| 60 to 64 Years | 0 (0.0%) | 0 (0.0%) |
| 65 to 74 Years | 0 (0.0%) | 0 (0.0%) |
| 75 Years and over | 0 (0.0%) | 0 (0.0%) |
| Total | 53 (76.8%) | 0 (0.0%) |
Employment Status by Educational Attainment in Rangerville
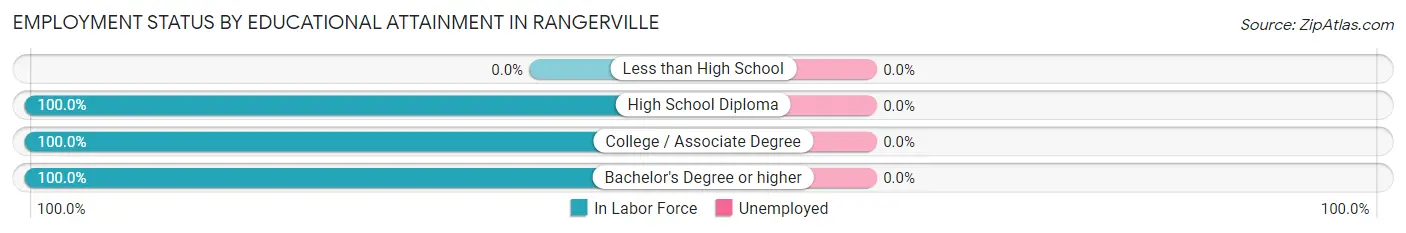
| Educational Attainment | In Labor Force | Unemployed |
| Less than High School | 0 (0.0%) | 0 (0.0%) |
| High School Diploma | 37 (100.0%) | 0 (0.0%) |
| College / Associate Degree | 7 (100.0%) | 0 (0.0%) |
| Bachelor's Degree or higher | 9 (100.0%) | 0 (0.0%) |
| Total | 53 (100.0%) | 0 (0.0%) |
Employment Occupations by Sex in Rangerville
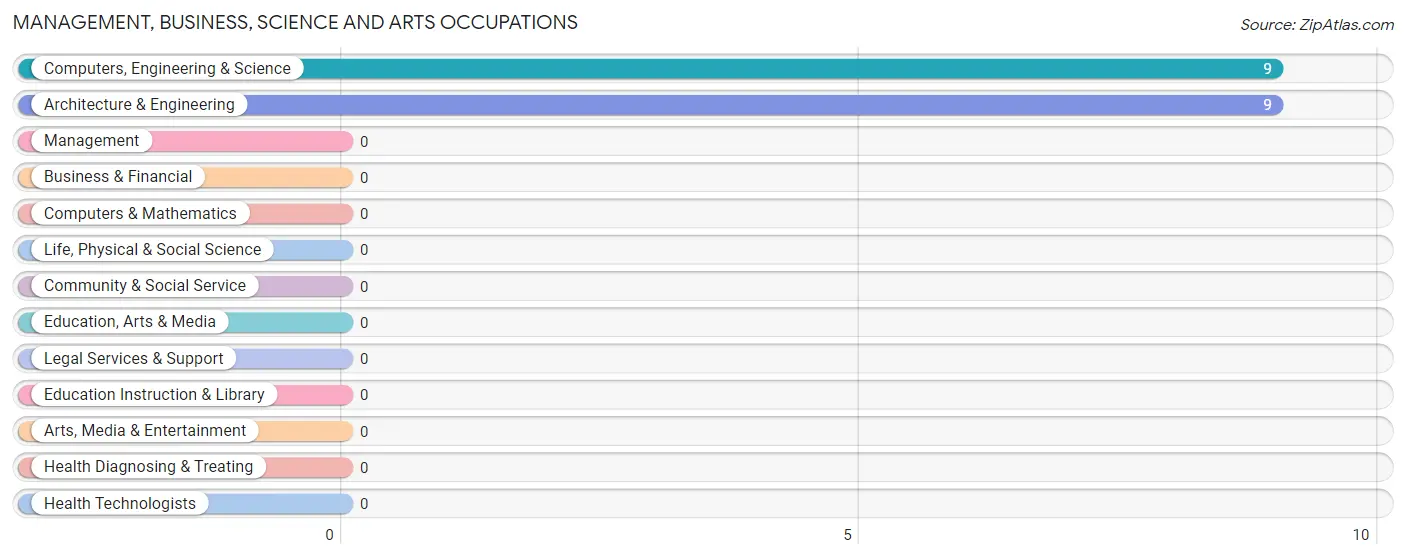
Management, Business, Science and Arts Occupations
The most common Management, Business, Science and Arts occupations in Rangerville are Computers, Engineering & Science (9 | 17.0%), and Architecture & Engineering (9 | 17.0%).
Management, Business, Science and Arts Occupations by Sex
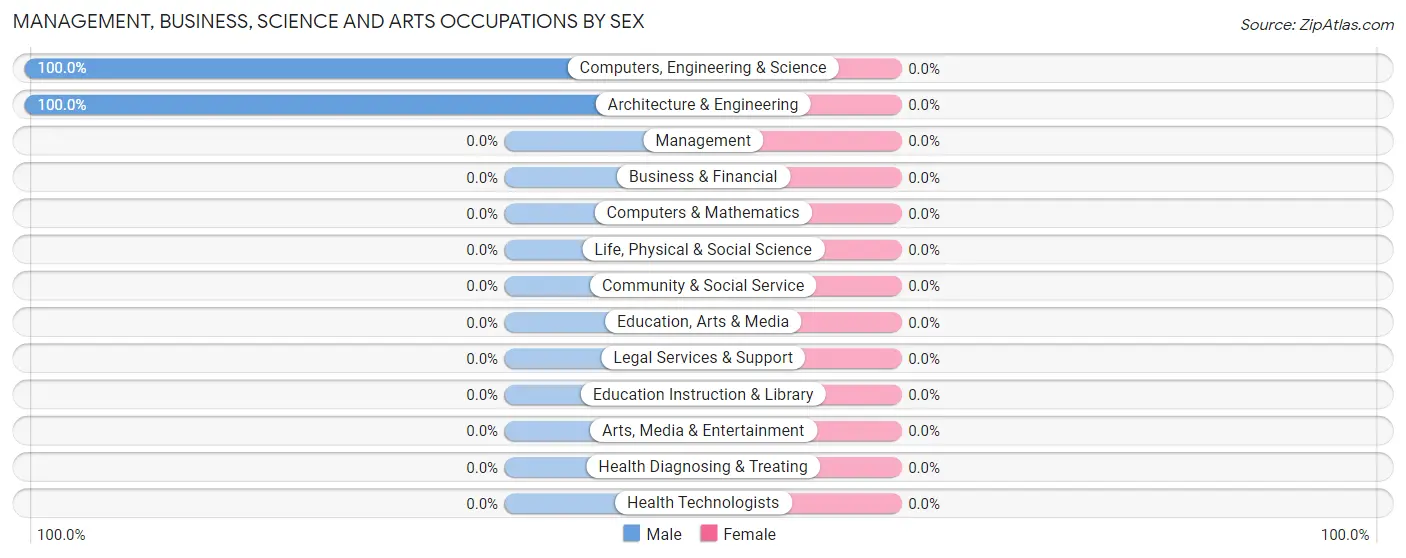
| Occupation | Male | Female |
| Management | 0 (0.0%) | 0 (0.0%) |
| Business & Financial | 0 (0.0%) | 0 (0.0%) |
| Computers, Engineering & Science | 9 (100.0%) | 0 (0.0%) |
| Computers & Mathematics | 0 (0.0%) | 0 (0.0%) |
| Architecture & Engineering | 9 (100.0%) | 0 (0.0%) |
| Life, Physical & Social Science | 0 (0.0%) | 0 (0.0%) |
| Community & Social Service | 0 (0.0%) | 0 (0.0%) |
| Education, Arts & Media | 0 (0.0%) | 0 (0.0%) |
| Legal Services & Support | 0 (0.0%) | 0 (0.0%) |
| Education Instruction & Library | 0 (0.0%) | 0 (0.0%) |
| Arts, Media & Entertainment | 0 (0.0%) | 0 (0.0%) |
| Health Diagnosing & Treating | 0 (0.0%) | 0 (0.0%) |
| Health Technologists | 0 (0.0%) | 0 (0.0%) |
| Total (Category) | 9 (100.0%) | 0 (0.0%) |
| Total (Overall) | 46 (86.8%) | 7 (13.2%) |
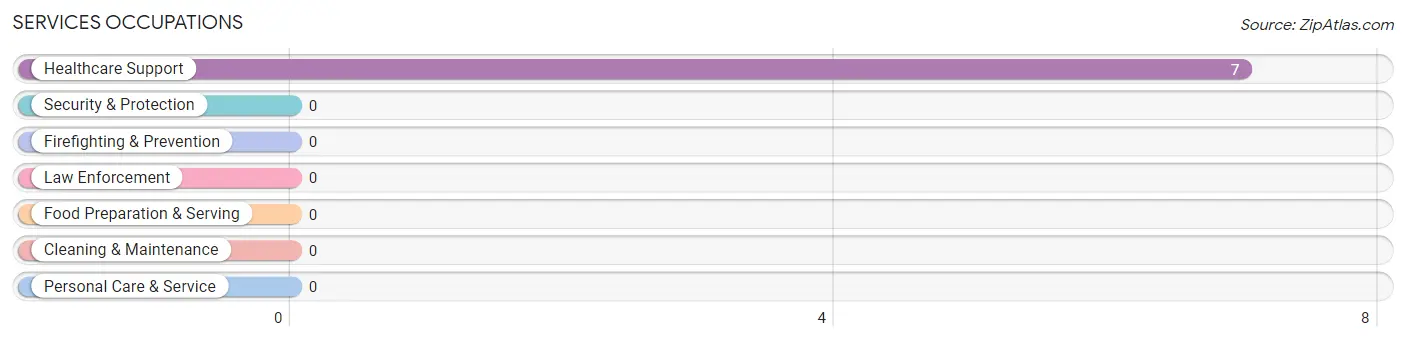
Services Occupations
The most common Services occupations in Rangerville are , and Healthcare Support (7 | 13.2%).
Services Occupations by Sex
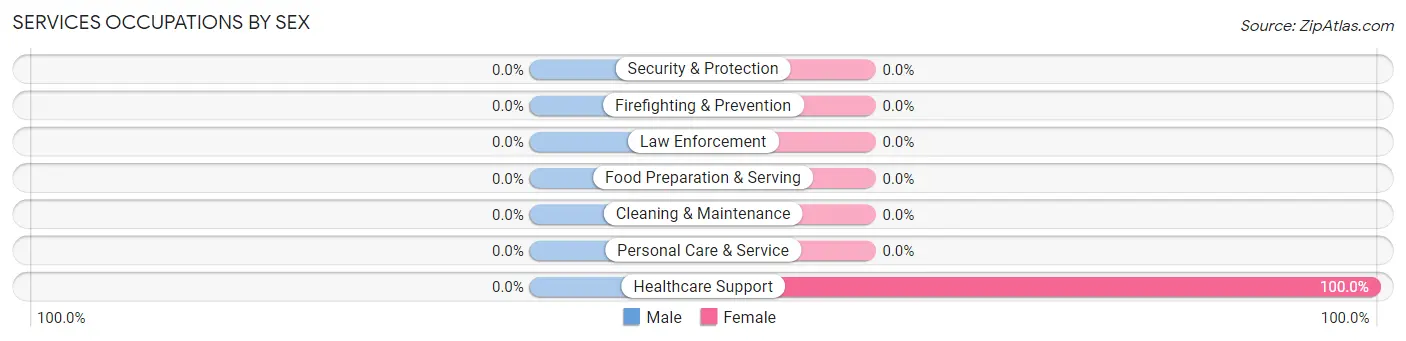
| Occupation | Male | Female |
| Healthcare Support | 0 (0.0%) | 7 (100.0%) |
| Security & Protection | 0 (0.0%) | 0 (0.0%) |
| Firefighting & Prevention | 0 (0.0%) | 0 (0.0%) |
| Law Enforcement | 0 (0.0%) | 0 (0.0%) |
| Food Preparation & Serving | 0 (0.0%) | 0 (0.0%) |
| Cleaning & Maintenance | 0 (0.0%) | 0 (0.0%) |
| Personal Care & Service | 0 (0.0%) | 0 (0.0%) |
| Total (Category) | 0 (0.0%) | 7 (100.0%) |
| Total (Overall) | 46 (86.8%) | 7 (13.2%) |
Sales and Office Occupations
The most common Sales and Office occupations in Rangerville are , and Office & Administration (37 | 69.8%).
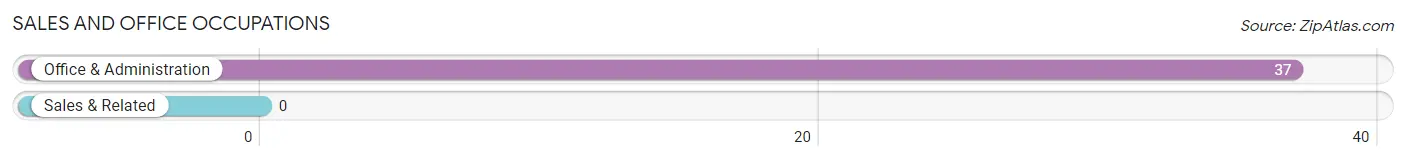
Sales and Office Occupations by Sex

| Occupation | Male | Female |
| Sales & Related | 0 (0.0%) | 0 (0.0%) |
| Office & Administration | 37 (100.0%) | 0 (0.0%) |
| Total (Category) | 37 (100.0%) | 0 (0.0%) |
| Total (Overall) | 46 (86.8%) | 7 (13.2%) |
Natural Resources, Construction and Maintenance Occupations
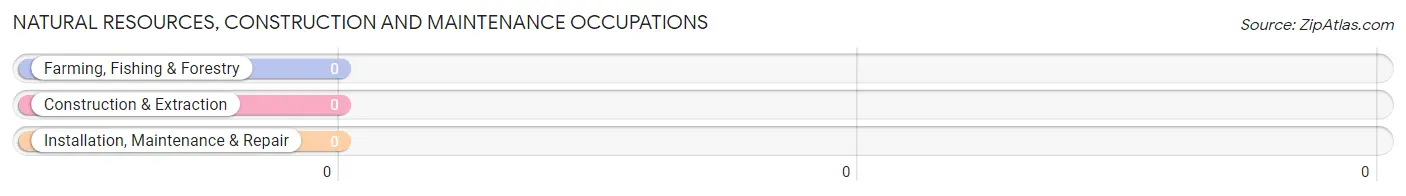
Natural Resources, Construction and Maintenance Occupations by Sex
| Occupation | Male | Female |
| Farming, Fishing & Forestry | 0 (0.0%) | 0 (0.0%) |
| Construction & Extraction | 0 (0.0%) | 0 (0.0%) |
| Installation, Maintenance & Repair | 0 (0.0%) | 0 (0.0%) |
| Total (Category) | 0 (0.0%) | 0 (0.0%) |
| Total (Overall) | 46 (86.8%) | 7 (13.2%) |
Production, Transportation and Moving Occupations
Production, Transportation and Moving Occupations by Sex
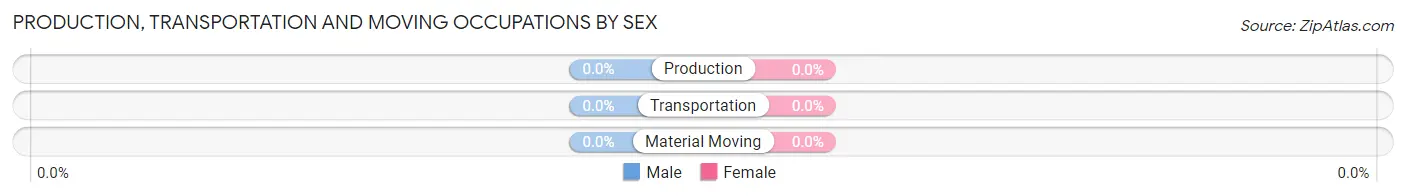
| Occupation | Male | Female |
| Production | 0 (0.0%) | 0 (0.0%) |
| Transportation | 0 (0.0%) | 0 (0.0%) |
| Material Moving | 0 (0.0%) | 0 (0.0%) |
| Total (Category) | 0 (0.0%) | 0 (0.0%) |
| Total (Overall) | 46 (86.8%) | 7 (13.2%) |
Employment Industries by Sex in Rangerville
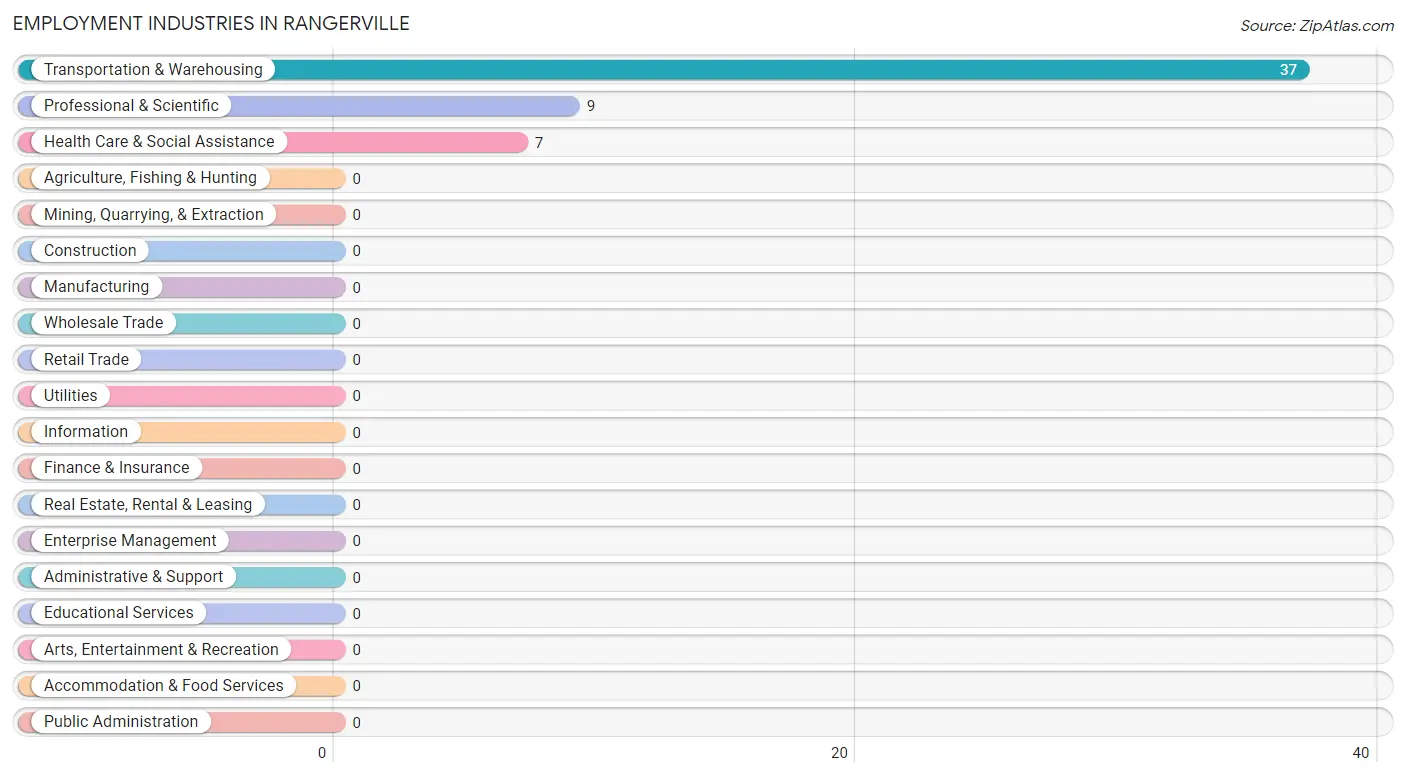
Employment Industries in Rangerville
The major employment industries in Rangerville include Transportation & Warehousing (37 | 69.8%), Professional & Scientific (9 | 17.0%), and Health Care & Social Assistance (7 | 13.2%).
Employment Industries by Sex in Rangerville
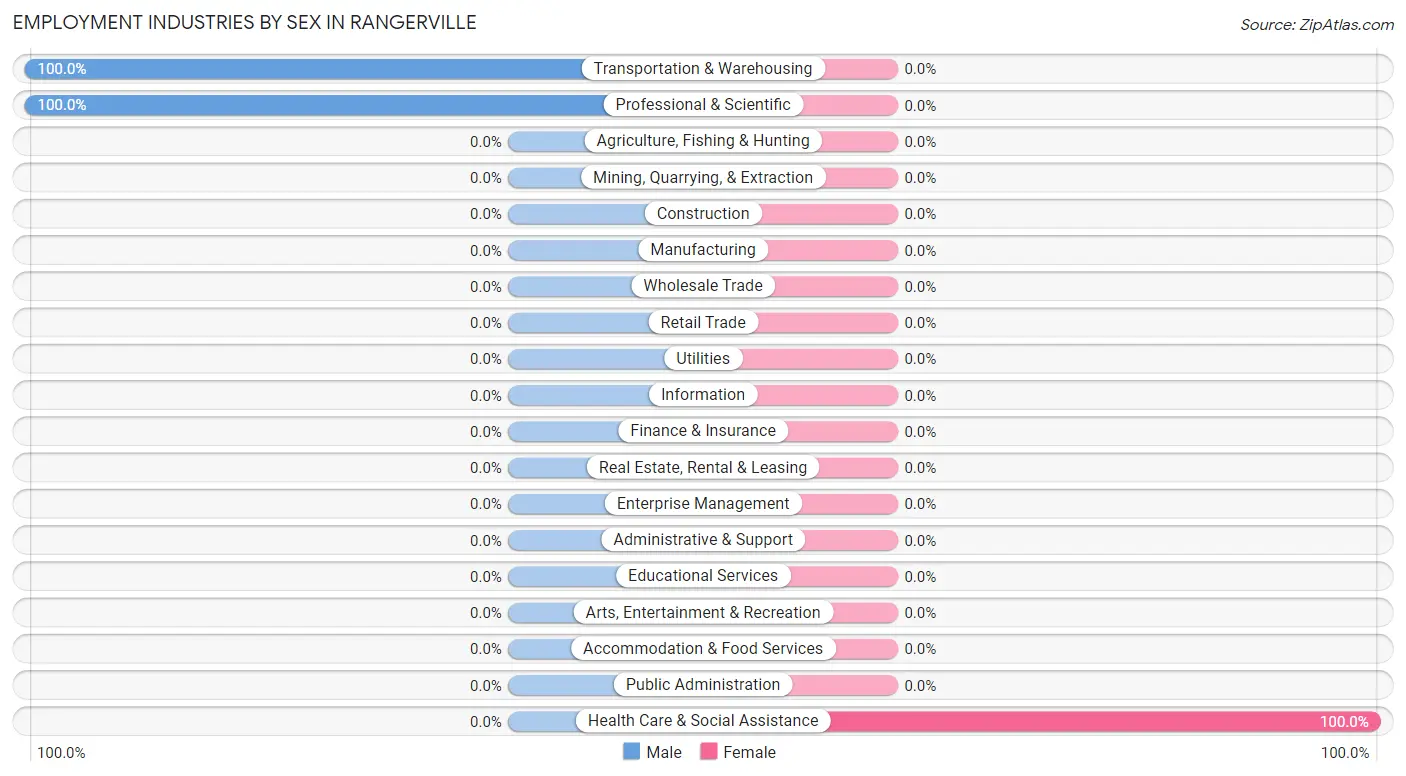
| Industry | Male | Female |
| Agriculture, Fishing & Hunting | 0 (0.0%) | 0 (0.0%) |
| Mining, Quarrying, & Extraction | 0 (0.0%) | 0 (0.0%) |
| Construction | 0 (0.0%) | 0 (0.0%) |
| Manufacturing | 0 (0.0%) | 0 (0.0%) |
| Wholesale Trade | 0 (0.0%) | 0 (0.0%) |
| Retail Trade | 0 (0.0%) | 0 (0.0%) |
| Transportation & Warehousing | 37 (100.0%) | 0 (0.0%) |
| Utilities | 0 (0.0%) | 0 (0.0%) |
| Information | 0 (0.0%) | 0 (0.0%) |
| Finance & Insurance | 0 (0.0%) | 0 (0.0%) |
| Real Estate, Rental & Leasing | 0 (0.0%) | 0 (0.0%) |
| Professional & Scientific | 9 (100.0%) | 0 (0.0%) |
| Enterprise Management | 0 (0.0%) | 0 (0.0%) |
| Administrative & Support | 0 (0.0%) | 0 (0.0%) |
| Educational Services | 0 (0.0%) | 0 (0.0%) |
| Health Care & Social Assistance | 0 (0.0%) | 7 (100.0%) |
| Arts, Entertainment & Recreation | 0 (0.0%) | 0 (0.0%) |
| Accommodation & Food Services | 0 (0.0%) | 0 (0.0%) |
| Public Administration | 0 (0.0%) | 0 (0.0%) |
| Total | 46 (86.8%) | 7 (13.2%) |
Education in Rangerville
School Enrollment in Rangerville
The most common levels of schooling among the 44 students in Rangerville are middle school (16 | 36.4%), elementary school (14 | 31.8%), and kindergarten (7 | 15.9%).
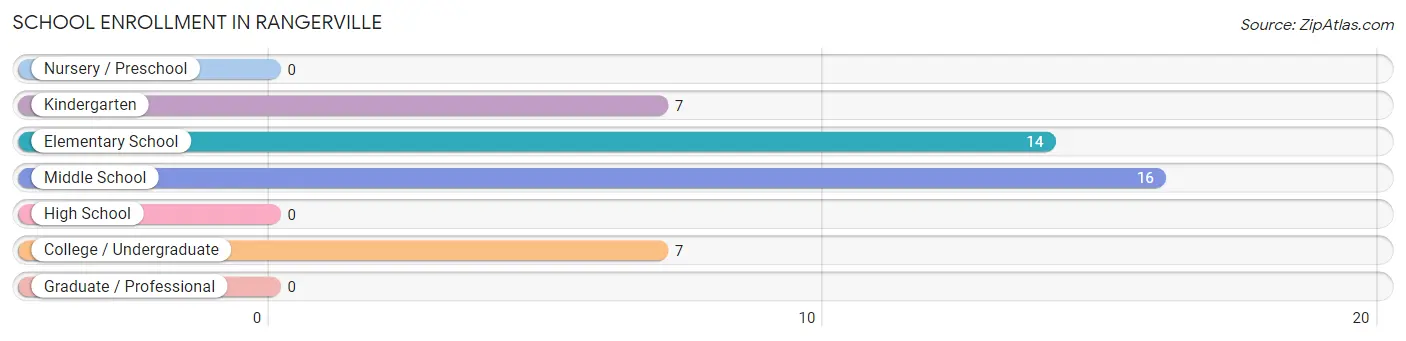
| School Level | # Students | % Students |
| Nursery / Preschool | 0 | 0.0% |
| Kindergarten | 7 | 15.9% |
| Elementary School | 14 | 31.8% |
| Middle School | 16 | 36.4% |
| High School | 0 | 0.0% |
| College / Undergraduate | 7 | 15.9% |
| Graduate / Professional | 0 | 0.0% |
| Total | 44 | 100.0% |
School Enrollment by Age by Funding Source in Rangerville
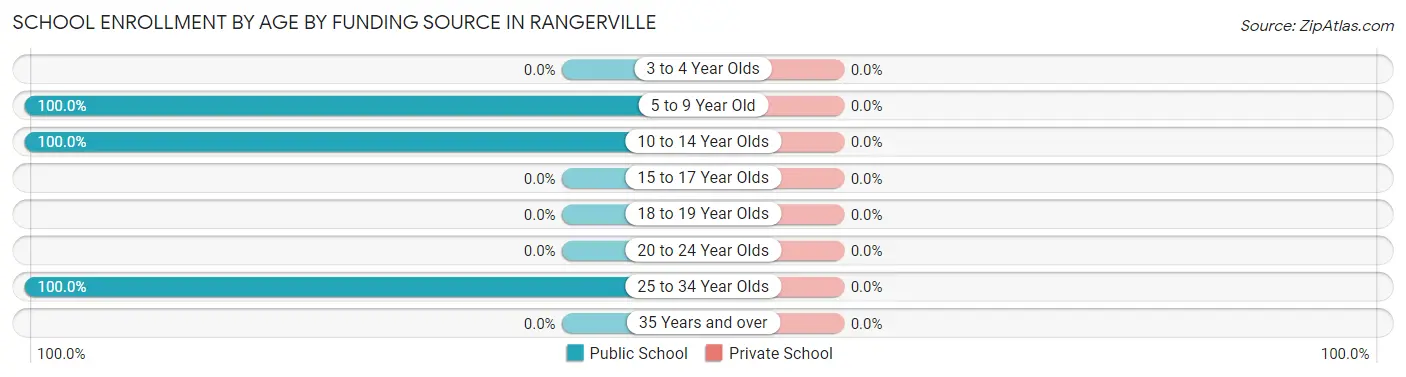
| Age Bracket | Public School | Private School |
| 3 to 4 Year Olds | 0 (0.0%) | 0 (0.0%) |
| 5 to 9 Year Old | 21 (100.0%) | 0 (0.0%) |
| 10 to 14 Year Olds | 16 (100.0%) | 0 (0.0%) |
| 15 to 17 Year Olds | 0 (0.0%) | 0 (0.0%) |
| 18 to 19 Year Olds | 0 (0.0%) | 0 (0.0%) |
| 20 to 24 Year Olds | 0 (0.0%) | 0 (0.0%) |
| 25 to 34 Year Olds | 7 (100.0%) | 0 (0.0%) |
| 35 Years and over | 0 (0.0%) | 0 (0.0%) |
| Total | 44 (100.0%) | 0 (0.0%) |
Educational Attainment by Field of Study in Rangerville
Multidisciplinary studies (9 | 64.3%), and education (5 | 35.7%) are the most common fields of study among 14 individuals in Rangerville who have obtained a bachelor's degree or higher.
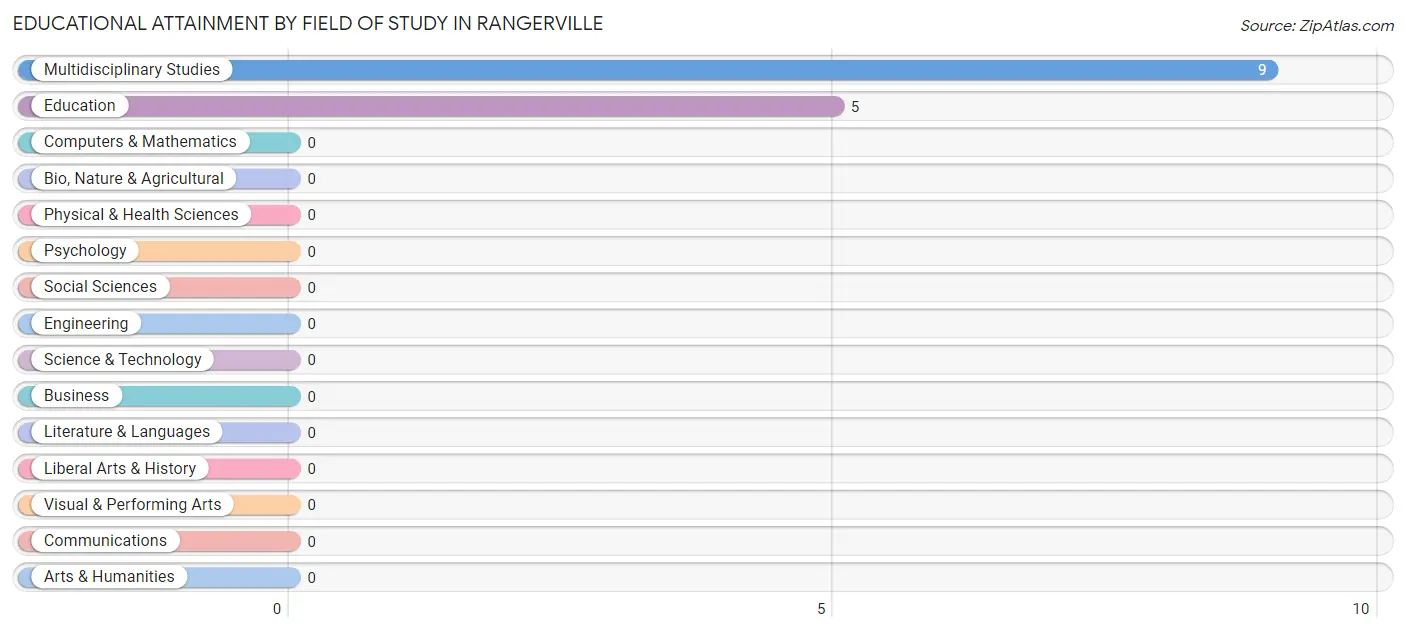
| Field of Study | # Graduates | % Graduates |
| Computers & Mathematics | 0 | 0.0% |
| Bio, Nature & Agricultural | 0 | 0.0% |
| Physical & Health Sciences | 0 | 0.0% |
| Psychology | 0 | 0.0% |
| Social Sciences | 0 | 0.0% |
| Engineering | 0 | 0.0% |
| Multidisciplinary Studies | 9 | 64.3% |
| Science & Technology | 0 | 0.0% |
| Business | 0 | 0.0% |
| Education | 5 | 35.7% |
| Literature & Languages | 0 | 0.0% |
| Liberal Arts & History | 0 | 0.0% |
| Visual & Performing Arts | 0 | 0.0% |
| Communications | 0 | 0.0% |
| Arts & Humanities | 0 | 0.0% |
| Total | 14 | 100.0% |
Transportation & Commute in Rangerville
Vehicle Availability by Sex in Rangerville
The most prevalent vehicle ownership categories in Rangerville are males with 2 vehicles (46, accounting for 100.0%) and females with 2 vehicles (7, making up 657.1%).
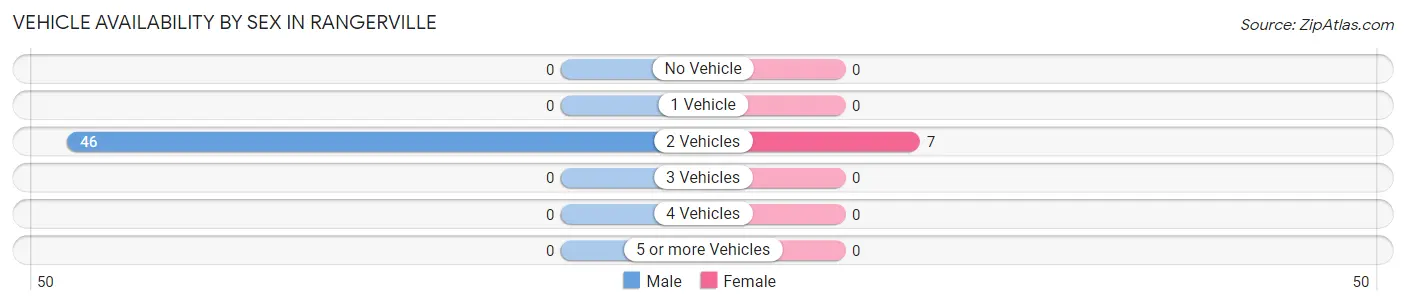
| Vehicles Available | Male | Female |
| No Vehicle | 0 (0.0%) | 0 (0.0%) |
| 1 Vehicle | 0 (0.0%) | 0 (0.0%) |
| 2 Vehicles | 46 (100.0%) | 7 (100.0%) |
| 3 Vehicles | 0 (0.0%) | 0 (0.0%) |
| 4 Vehicles | 0 (0.0%) | 0 (0.0%) |
| 5 or more Vehicles | 0 (0.0%) | 0 (0.0%) |
| Total | 46 (100.0%) | 7 (100.0%) |
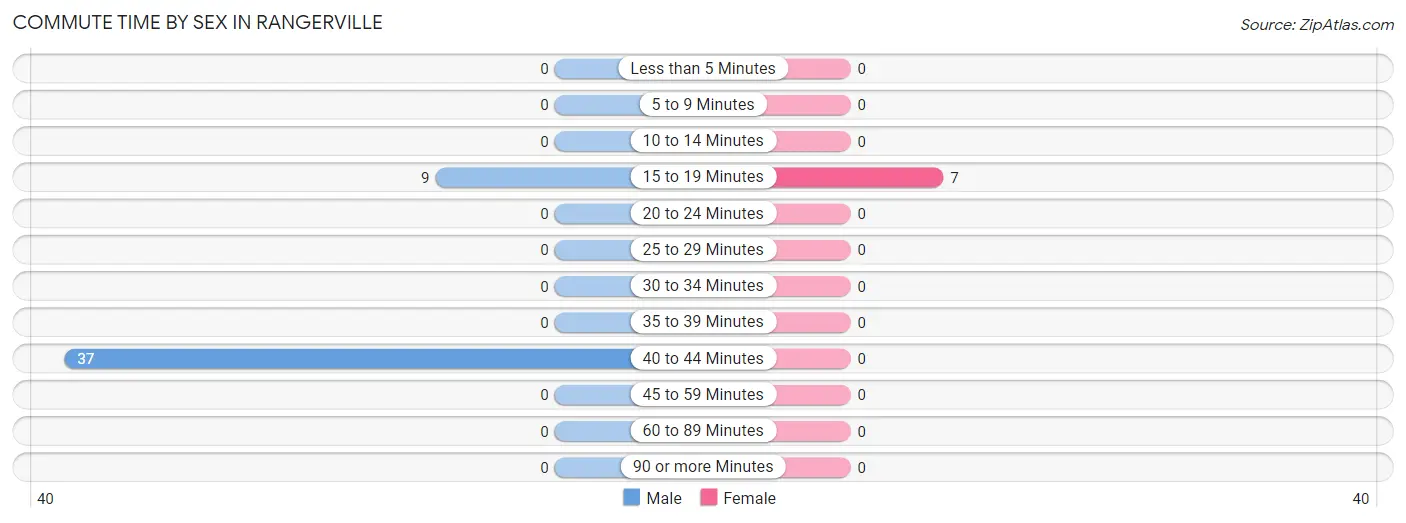
Commute Time in Rangerville
The most frequently occuring commute durations in Rangerville are 40 to 44 minutes (37 commuters, 69.8%), 15 to 19 minutes (16 commuters, 30.2%), and less than 5 minutes (0 commuters, 0.0%).
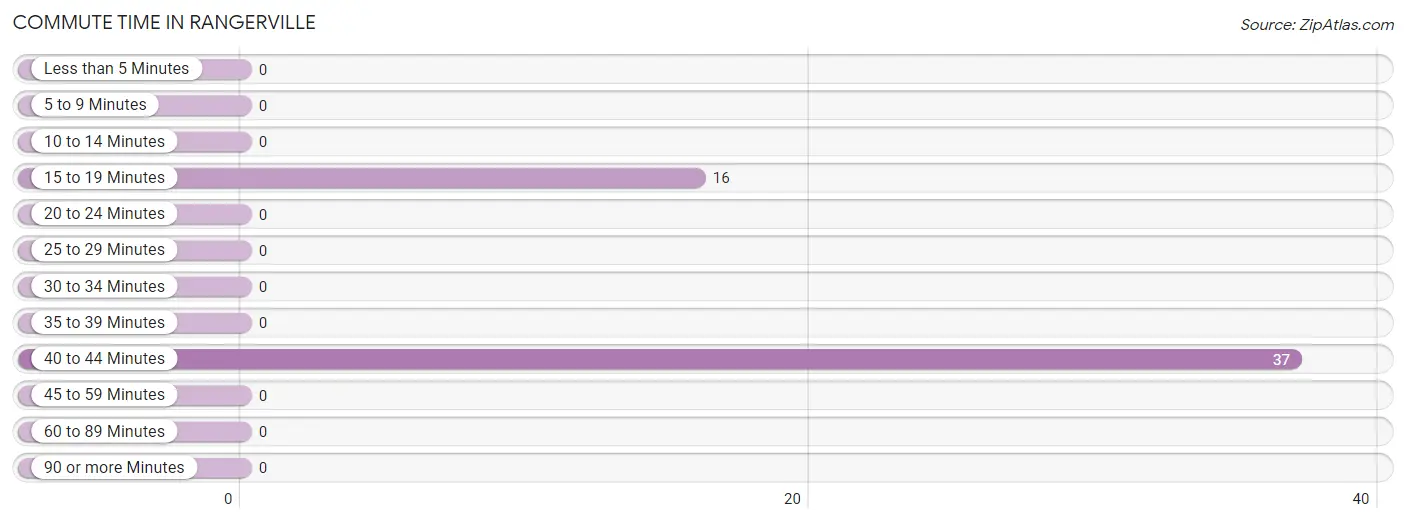
| Commute Time | # Commuters | % Commuters |
| Less than 5 Minutes | 0 | 0.0% |
| 5 to 9 Minutes | 0 | 0.0% |
| 10 to 14 Minutes | 0 | 0.0% |
| 15 to 19 Minutes | 16 | 30.2% |
| 20 to 24 Minutes | 0 | 0.0% |
| 25 to 29 Minutes | 0 | 0.0% |
| 30 to 34 Minutes | 0 | 0.0% |
| 35 to 39 Minutes | 0 | 0.0% |
| 40 to 44 Minutes | 37 | 69.8% |
| 45 to 59 Minutes | 0 | 0.0% |
| 60 to 89 Minutes | 0 | 0.0% |
| 90 or more Minutes | 0 | 0.0% |
Commute Time by Sex in Rangerville
The most common commute times in Rangerville are 40 to 44 minutes (37 commuters, 80.4%) for males and 15 to 19 minutes (7 commuters, 100.0%) for females.
| Commute Time | Male | Female |
| Less than 5 Minutes | 0 (0.0%) | 0 (0.0%) |
| 5 to 9 Minutes | 0 (0.0%) | 0 (0.0%) |
| 10 to 14 Minutes | 0 (0.0%) | 0 (0.0%) |
| 15 to 19 Minutes | 9 (19.6%) | 7 (100.0%) |
| 20 to 24 Minutes | 0 (0.0%) | 0 (0.0%) |
| 25 to 29 Minutes | 0 (0.0%) | 0 (0.0%) |
| 30 to 34 Minutes | 0 (0.0%) | 0 (0.0%) |
| 35 to 39 Minutes | 0 (0.0%) | 0 (0.0%) |
| 40 to 44 Minutes | 37 (80.4%) | 0 (0.0%) |
| 45 to 59 Minutes | 0 (0.0%) | 0 (0.0%) |
| 60 to 89 Minutes | 0 (0.0%) | 0 (0.0%) |
| 90 or more Minutes | 0 (0.0%) | 0 (0.0%) |
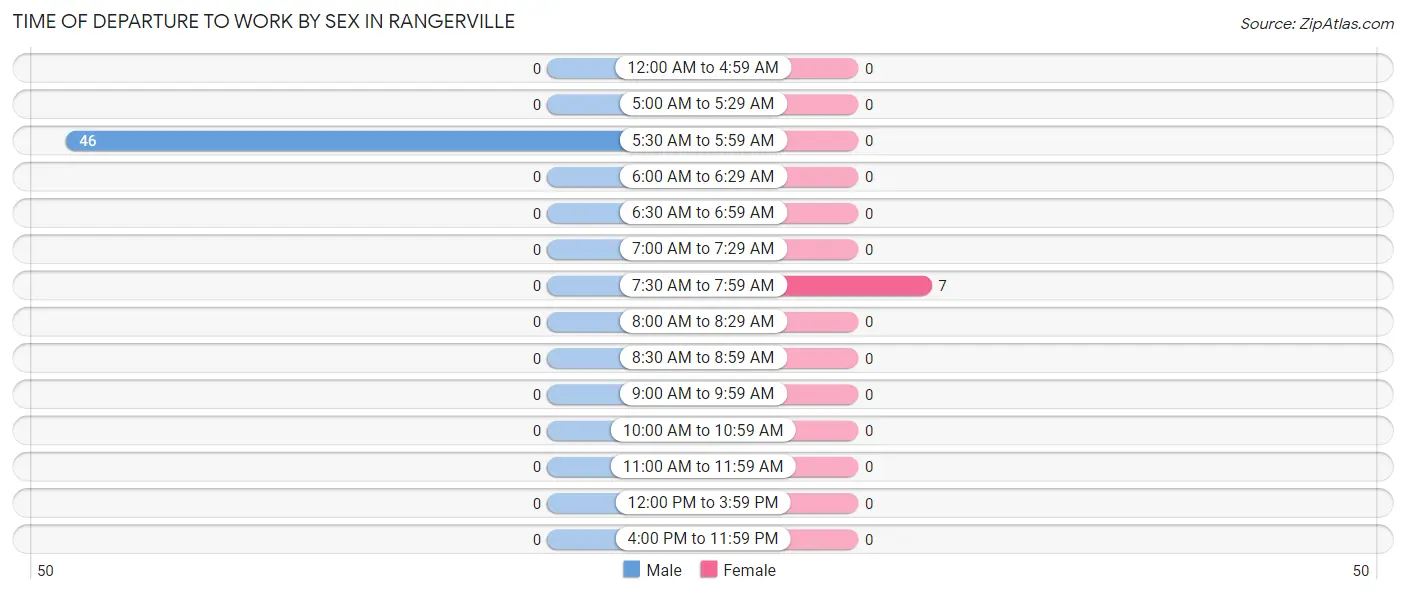
Time of Departure to Work by Sex in Rangerville
The most frequent times of departure to work in Rangerville are 5:30 AM to 5:59 AM (46, 100.0%) for males and 7:30 AM to 7:59 AM (7, 100.0%) for females.
| Time of Departure | Male | Female |
| 12:00 AM to 4:59 AM | 0 (0.0%) | 0 (0.0%) |
| 5:00 AM to 5:29 AM | 0 (0.0%) | 0 (0.0%) |
| 5:30 AM to 5:59 AM | 46 (100.0%) | 0 (0.0%) |
| 6:00 AM to 6:29 AM | 0 (0.0%) | 0 (0.0%) |
| 6:30 AM to 6:59 AM | 0 (0.0%) | 0 (0.0%) |
| 7:00 AM to 7:29 AM | 0 (0.0%) | 0 (0.0%) |
| 7:30 AM to 7:59 AM | 0 (0.0%) | 7 (100.0%) |
| 8:00 AM to 8:29 AM | 0 (0.0%) | 0 (0.0%) |
| 8:30 AM to 8:59 AM | 0 (0.0%) | 0 (0.0%) |
| 9:00 AM to 9:59 AM | 0 (0.0%) | 0 (0.0%) |
| 10:00 AM to 10:59 AM | 0 (0.0%) | 0 (0.0%) |
| 11:00 AM to 11:59 AM | 0 (0.0%) | 0 (0.0%) |
| 12:00 PM to 3:59 PM | 0 (0.0%) | 0 (0.0%) |
| 4:00 PM to 11:59 PM | 0 (0.0%) | 0 (0.0%) |
| Total | 46 (100.0%) | 7 (100.0%) |
Housing Occupancy in Rangerville
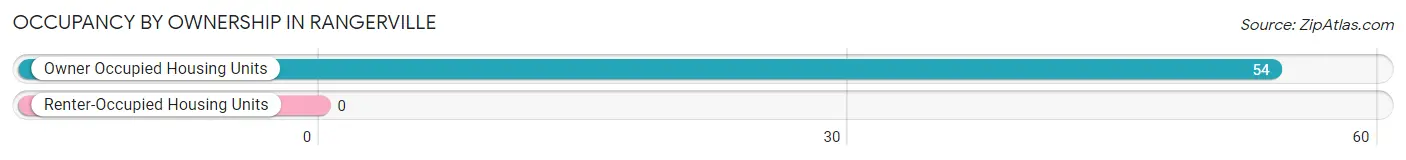
Occupancy by Ownership in Rangerville
Of the total 54 dwellings in Rangerville, owner-occupied units account for 54 (100.0%), while renter-occupied units make up 0 (0.0%).
| Occupancy | # Housing Units | % Housing Units |
| Owner Occupied Housing Units | 54 | 100.0% |
| Renter-Occupied Housing Units | 0 | 0.0% |
| Total Occupied Housing Units | 54 | 100.0% |
Occupancy by Household Size in Rangerville
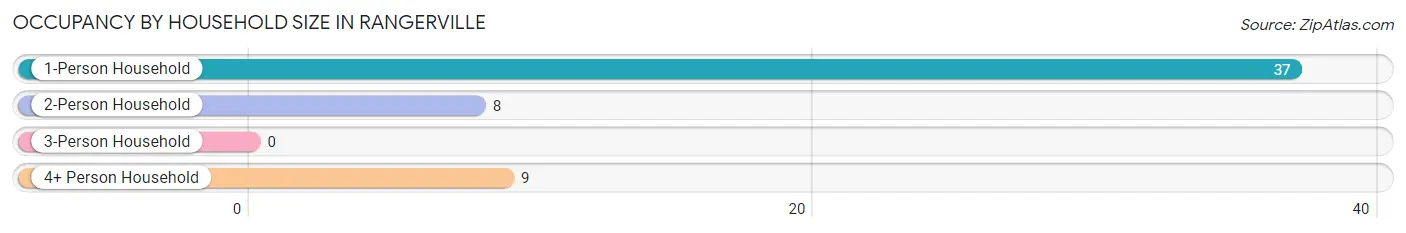
| Household Size | # Housing Units | % Housing Units |
| 1-Person Household | 37 | 68.5% |
| 2-Person Household | 8 | 14.8% |
| 3-Person Household | 0 | 0.0% |
| 4+ Person Household | 9 | 16.7% |
| Total Housing Units | 54 | 100.0% |
Occupancy by Ownership by Household Size in Rangerville
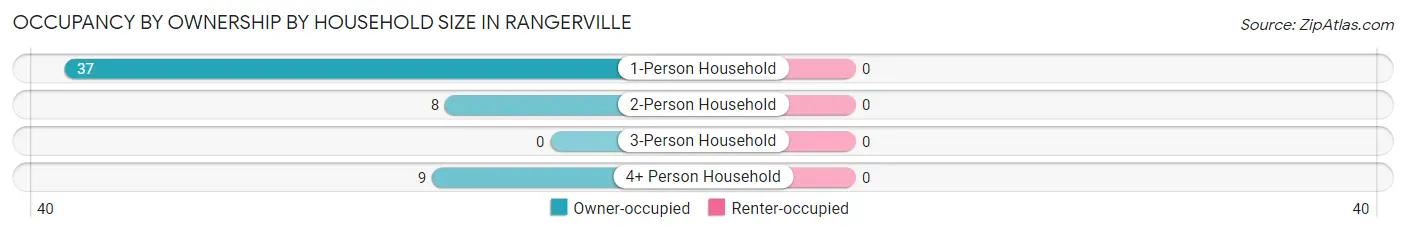
| Household Size | Owner-occupied | Renter-occupied |
| 1-Person Household | 37 (100.0%) | 0 (0.0%) |
| 2-Person Household | 8 (100.0%) | 0 (0.0%) |
| 3-Person Household | 0 (0.0%) | 0 (0.0%) |
| 4+ Person Household | 9 (100.0%) | 0 (0.0%) |
| Total Housing Units | 54 (100.0%) | 0 (0.0%) |
Occupancy by Educational Attainment in Rangerville
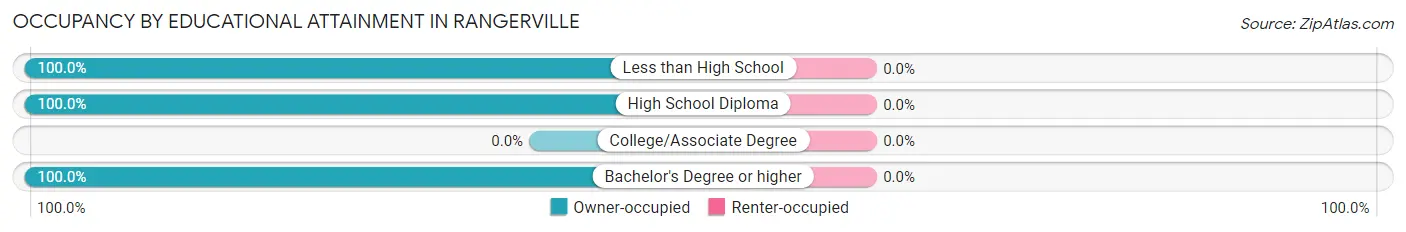
| Household Size | Owner-occupied | Renter-occupied |
| Less than High School | 3 (100.0%) | 0 (0.0%) |
| High School Diploma | 37 (100.0%) | 0 (0.0%) |
| College/Associate Degree | 0 (0.0%) | 0 (0.0%) |
| Bachelor's Degree or higher | 14 (100.0%) | 0 (0.0%) |
Occupancy by Age of Householder in Rangerville
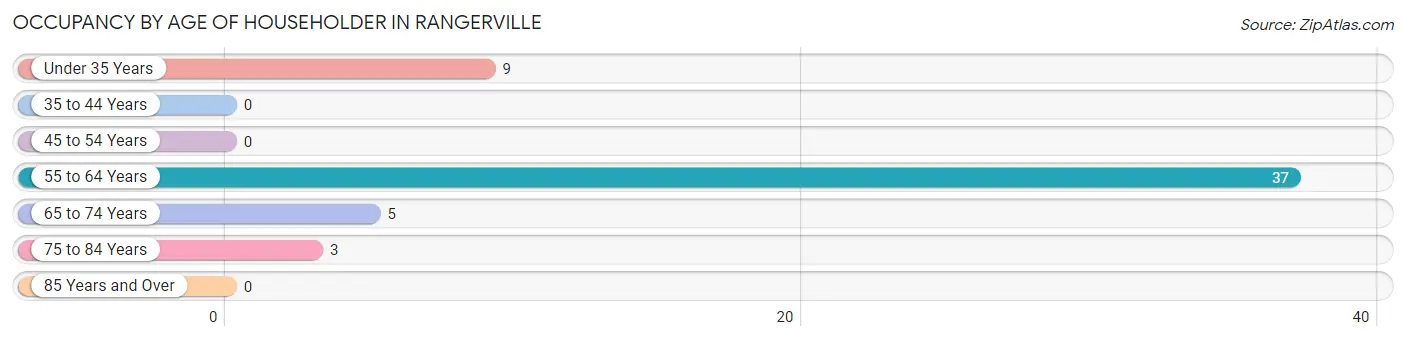
| Age Bracket | # Households | % Households |
| Under 35 Years | 9 | 16.7% |
| 35 to 44 Years | 0 | 0.0% |
| 45 to 54 Years | 0 | 0.0% |
| 55 to 64 Years | 37 | 68.5% |
| 65 to 74 Years | 5 | 9.3% |
| 75 to 84 Years | 3 | 5.6% |
| 85 Years and Over | 0 | 0.0% |
| Total | 54 | 100.0% |
Housing Finances in Rangerville
Median Income by Occupancy in Rangerville
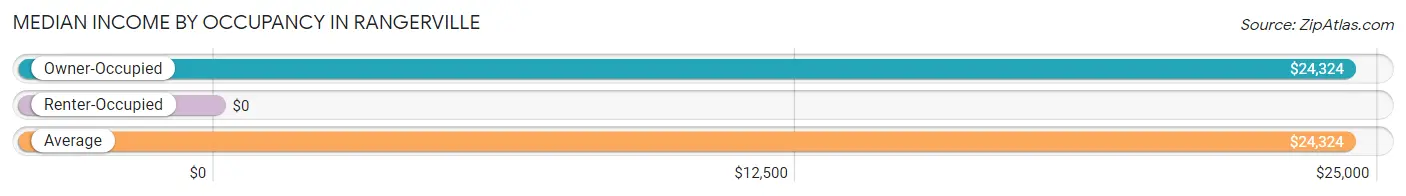
| Occupancy Type | # Households | Median Income |
| Owner-Occupied | 54 (100.0%) | $24,324 |
| Renter-Occupied | 0 (0.0%) | $0 |
| Average | 54 (100.0%) | $24,324 |
Occupancy by Householder Income Bracket in Rangerville
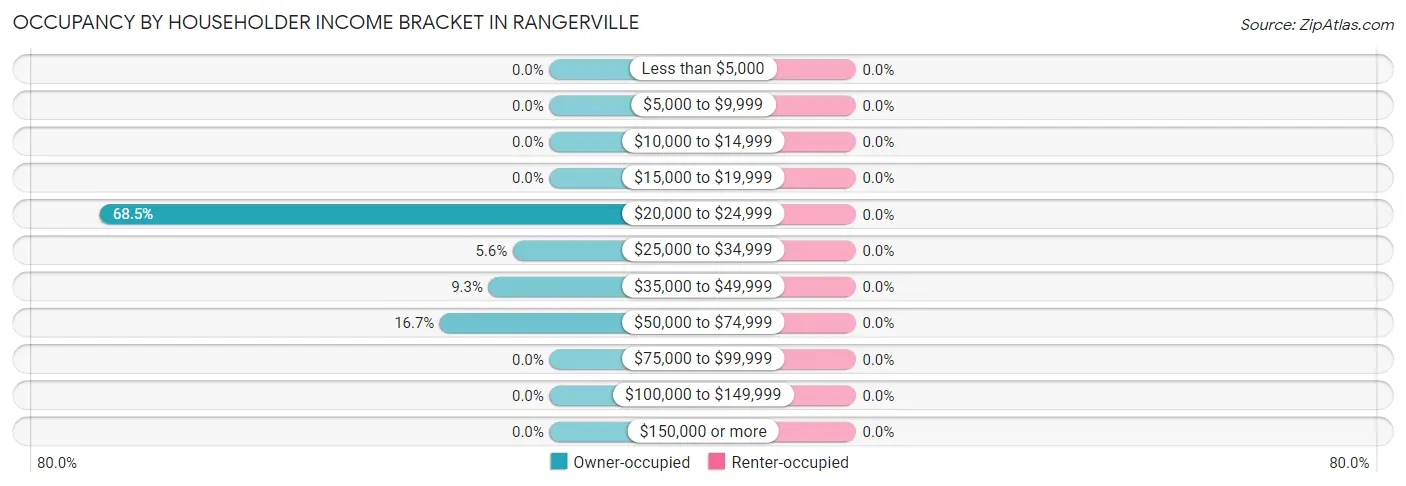
| Income Bracket | Owner-occupied | Renter-occupied |
| Less than $5,000 | 0 (0.0%) | 0 (0.0%) |
| $5,000 to $9,999 | 0 (0.0%) | 0 (0.0%) |
| $10,000 to $14,999 | 0 (0.0%) | 0 (0.0%) |
| $15,000 to $19,999 | 0 (0.0%) | 0 (0.0%) |
| $20,000 to $24,999 | 37 (68.5%) | 0 (0.0%) |
| $25,000 to $34,999 | 3 (5.6%) | 0 (0.0%) |
| $35,000 to $49,999 | 5 (9.3%) | 0 (0.0%) |
| $50,000 to $74,999 | 9 (16.7%) | 0 (0.0%) |
| $75,000 to $99,999 | 0 (0.0%) | 0 (0.0%) |
| $100,000 to $149,999 | 0 (0.0%) | 0 (0.0%) |
| $150,000 or more | 0 (0.0%) | 0 (0.0%) |
| Total | 54 (100.0%) | 0 (0.0%) |
Monthly Housing Cost Tiers in Rangerville
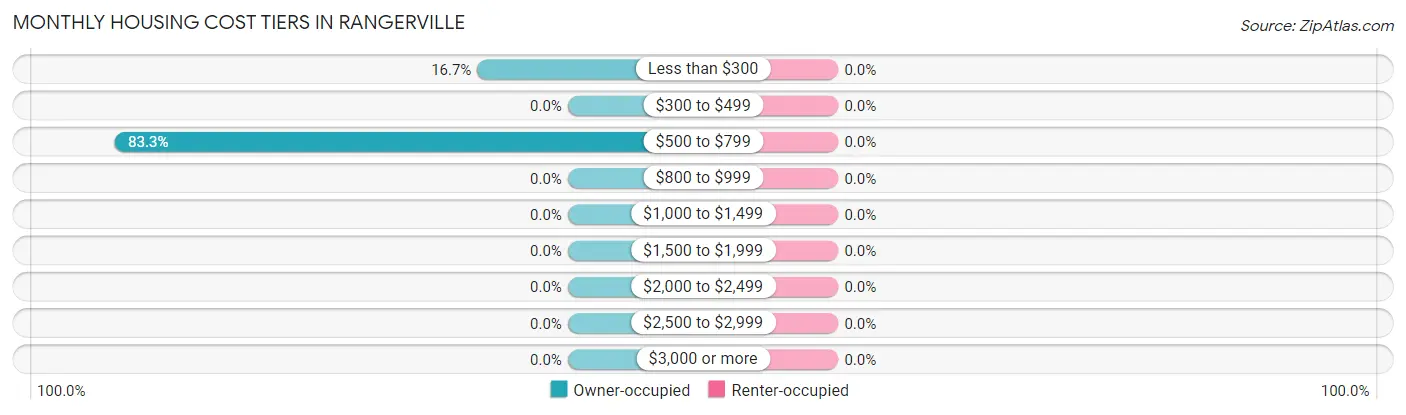
| Monthly Cost | Owner-occupied | Renter-occupied |
| Less than $300 | 9 (16.7%) | 0 (0.0%) |
| $300 to $499 | 0 (0.0%) | 0 (0.0%) |
| $500 to $799 | 45 (83.3%) | 0 (0.0%) |
| $800 to $999 | 0 (0.0%) | 0 (0.0%) |
| $1,000 to $1,499 | 0 (0.0%) | 0 (0.0%) |
| $1,500 to $1,999 | 0 (0.0%) | 0 (0.0%) |
| $2,000 to $2,499 | 0 (0.0%) | 0 (0.0%) |
| $2,500 to $2,999 | 0 (0.0%) | 0 (0.0%) |
| $3,000 or more | 0 (0.0%) | 0 (0.0%) |
| Total | 54 (100.0%) | 0 (0.0%) |
Physical Housing Characteristics in Rangerville
Housing Structures in Rangerville
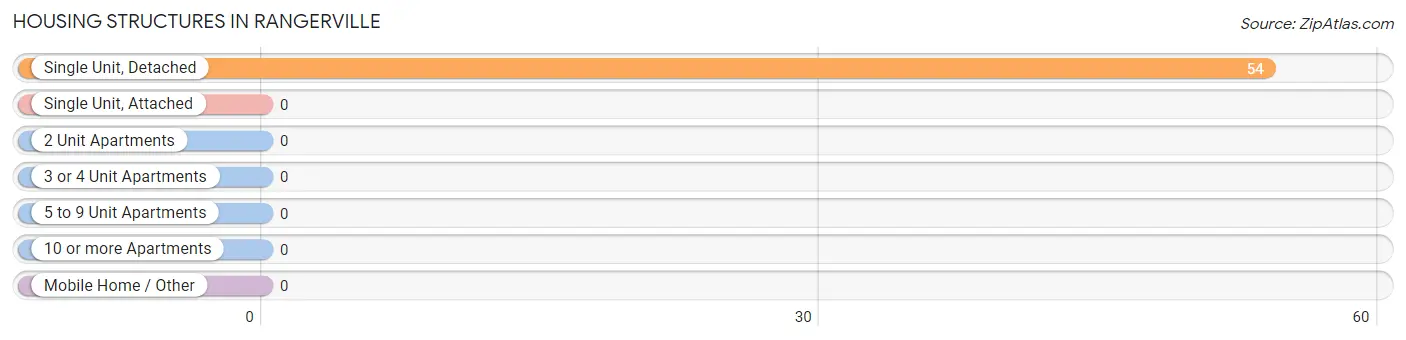
| Structure Type | # Housing Units | % Housing Units |
| Single Unit, Detached | 54 | 100.0% |
| Single Unit, Attached | 0 | 0.0% |
| 2 Unit Apartments | 0 | 0.0% |
| 3 or 4 Unit Apartments | 0 | 0.0% |
| 5 to 9 Unit Apartments | 0 | 0.0% |
| 10 or more Apartments | 0 | 0.0% |
| Mobile Home / Other | 0 | 0.0% |
| Total | 54 | 100.0% |
Housing Structures by Occupancy in Rangerville
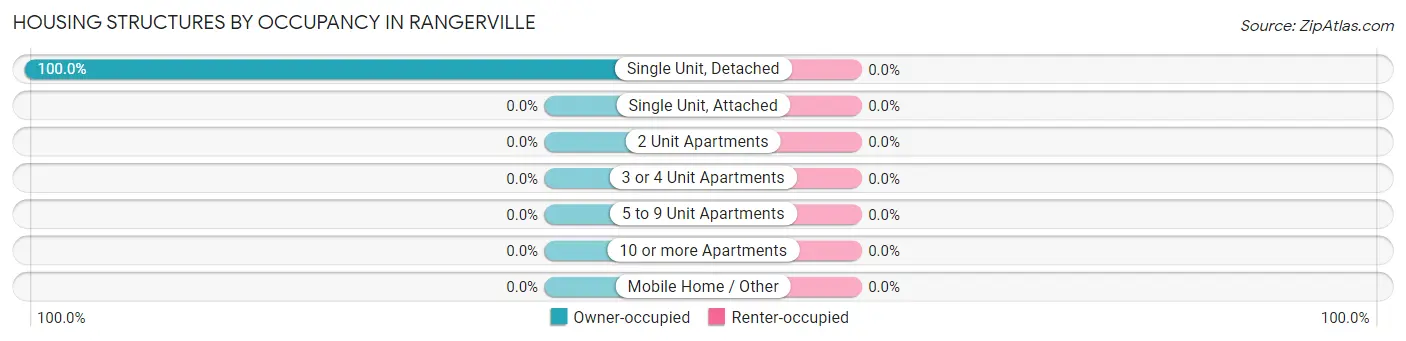
| Structure Type | Owner-occupied | Renter-occupied |
| Single Unit, Detached | 54 (100.0%) | 0 (0.0%) |
| Single Unit, Attached | 0 (0.0%) | 0 (0.0%) |
| 2 Unit Apartments | 0 (0.0%) | 0 (0.0%) |
| 3 or 4 Unit Apartments | 0 (0.0%) | 0 (0.0%) |
| 5 to 9 Unit Apartments | 0 (0.0%) | 0 (0.0%) |
| 10 or more Apartments | 0 (0.0%) | 0 (0.0%) |
| Mobile Home / Other | 0 (0.0%) | 0 (0.0%) |
| Total | 54 (100.0%) | 0 (0.0%) |
Housing Structures by Number of Rooms in Rangerville
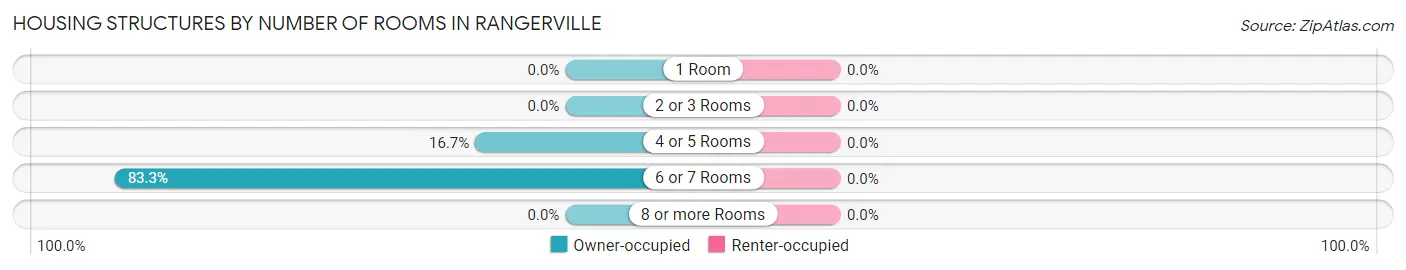
| Number of Rooms | Owner-occupied | Renter-occupied |
| 1 Room | 0 (0.0%) | 0 (0.0%) |
| 2 or 3 Rooms | 0 (0.0%) | 0 (0.0%) |
| 4 or 5 Rooms | 9 (16.7%) | 0 (0.0%) |
| 6 or 7 Rooms | 45 (83.3%) | 0 (0.0%) |
| 8 or more Rooms | 0 (0.0%) | 0 (0.0%) |
| Total | 54 (100.0%) | 0 (0.0%) |
Housing Structure by Heating Type in Rangerville
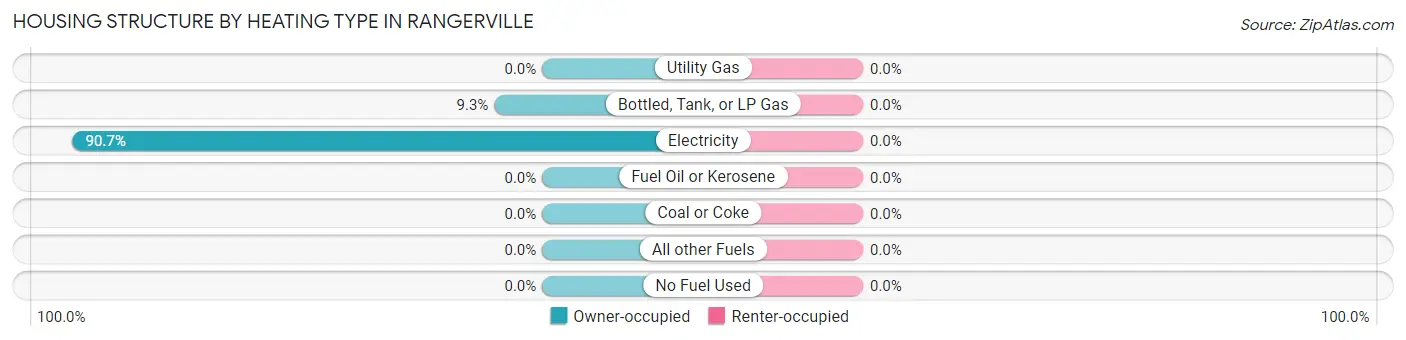
| Heating Type | Owner-occupied | Renter-occupied |
| Utility Gas | 0 (0.0%) | 0 (0.0%) |
| Bottled, Tank, or LP Gas | 5 (9.3%) | 0 (0.0%) |
| Electricity | 49 (90.7%) | 0 (0.0%) |
| Fuel Oil or Kerosene | 0 (0.0%) | 0 (0.0%) |
| Coal or Coke | 0 (0.0%) | 0 (0.0%) |
| All other Fuels | 0 (0.0%) | 0 (0.0%) |
| No Fuel Used | 0 (0.0%) | 0 (0.0%) |
| Total | 54 (100.0%) | 0 (0.0%) |
Household Vehicle Usage in Rangerville
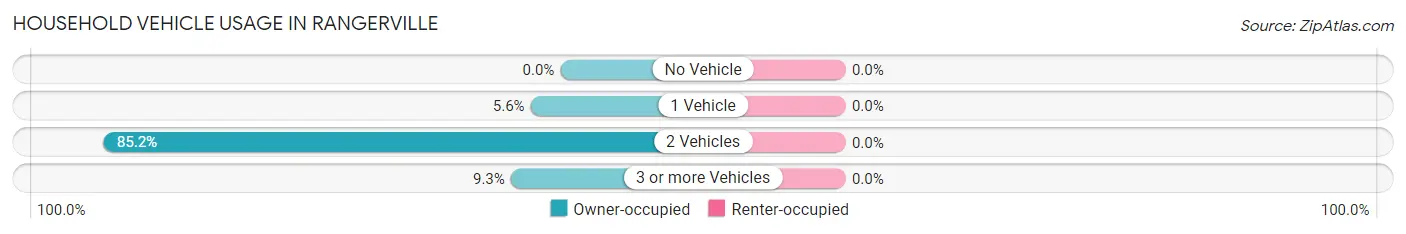
| Vehicles per Household | Owner-occupied | Renter-occupied |
| No Vehicle | 0 (0.0%) | 0 (0.0%) |
| 1 Vehicle | 3 (5.6%) | 0 (0.0%) |
| 2 Vehicles | 46 (85.2%) | 0 (0.0%) |
| 3 or more Vehicles | 5 (9.3%) | 0 (0.0%) |
| Total | 54 (100.0%) | 0 (0.0%) |
Real Estate & Mortgages in Rangerville
Real Estate and Mortgage Overview in Rangerville
| Characteristic | Without Mortgage | With Mortgage |
| Housing Units | 54 | 0 |
| Median Property Value | $54,300 | $0 |
| Median Household Income | $24,324 | $0 |
| Monthly Housing Costs | $636 | $0 |
| Real Estate Taxes | $1,768 | $0 |
Property Value by Mortgage Status in Rangerville
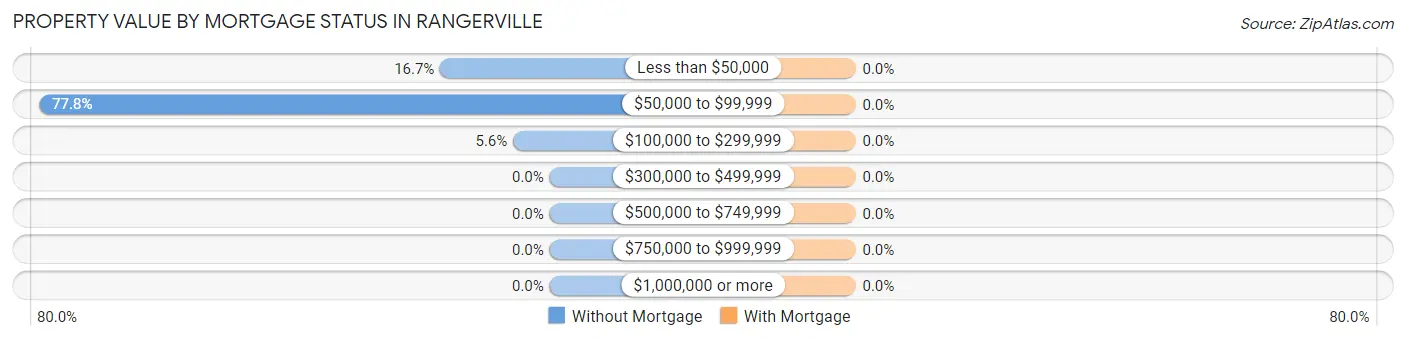
| Property Value | Without Mortgage | With Mortgage |
| Less than $50,000 | 9 (16.7%) | 0 (0.0%) |
| $50,000 to $99,999 | 42 (77.8%) | 0 (0.0%) |
| $100,000 to $299,999 | 3 (5.6%) | 0 (0.0%) |
| $300,000 to $499,999 | 0 (0.0%) | 0 (0.0%) |
| $500,000 to $749,999 | 0 (0.0%) | 0 (0.0%) |
| $750,000 to $999,999 | 0 (0.0%) | 0 (0.0%) |
| $1,000,000 or more | 0 (0.0%) | 0 (0.0%) |
| Total | 54 (100.0%) | 0 (0.0%) |
Household Income by Mortgage Status in Rangerville
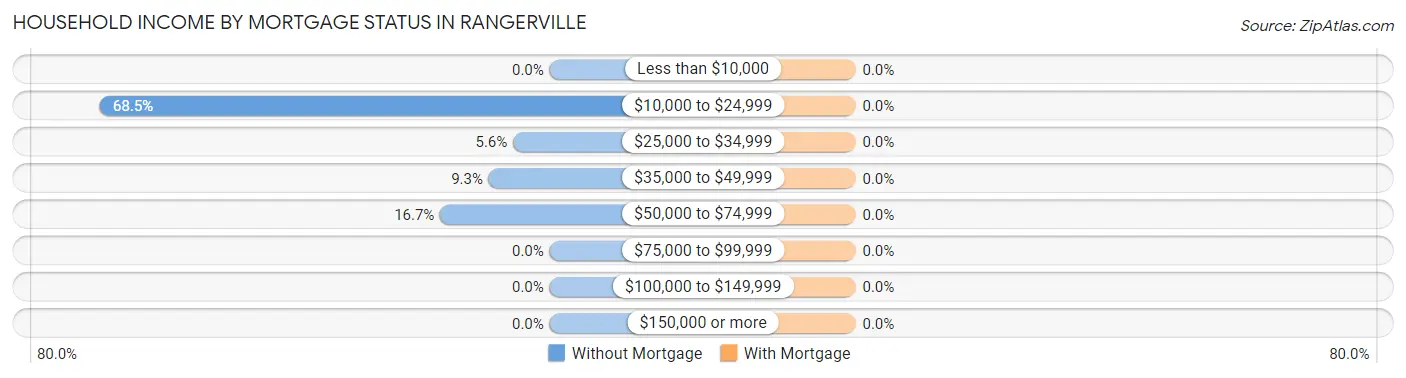
| Household Income | Without Mortgage | With Mortgage |
| Less than $10,000 | 0 (0.0%) | 0 (0.0%) |
| $10,000 to $24,999 | 37 (68.5%) | 0 (0.0%) |
| $25,000 to $34,999 | 3 (5.6%) | 0 (0.0%) |
| $35,000 to $49,999 | 5 (9.3%) | 0 (0.0%) |
| $50,000 to $74,999 | 9 (16.7%) | 0 (0.0%) |
| $75,000 to $99,999 | 0 (0.0%) | 0 (0.0%) |
| $100,000 to $149,999 | 0 (0.0%) | 0 (0.0%) |
| $150,000 or more | 0 (0.0%) | 0 (0.0%) |
| Total | 54 (100.0%) | 0 (0.0%) |
Property Value to Household Income Ratio in Rangerville
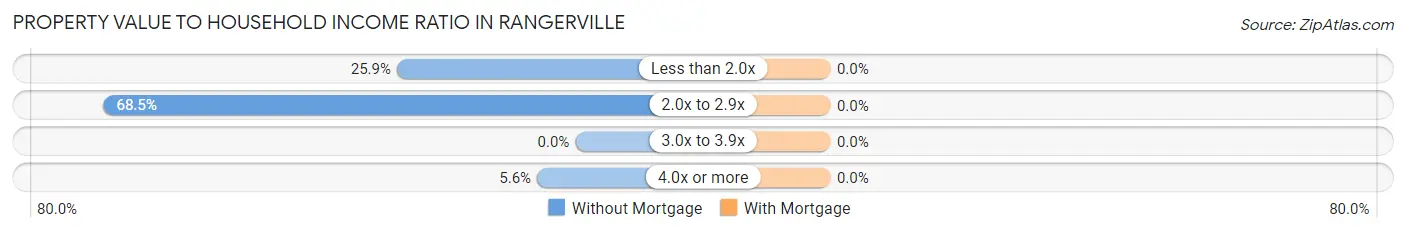
| Value-to-Income Ratio | Without Mortgage | With Mortgage |
| Less than 2.0x | 14 (25.9%) | 0 (0.0%) |
| 2.0x to 2.9x | 37 (68.5%) | 0 (0.0%) |
| 3.0x to 3.9x | 0 (0.0%) | 0 (0.0%) |
| 4.0x or more | 3 (5.6%) | 0 (0.0%) |
| Total | 54 (100.0%) | 0 (0.0%) |
Real Estate Taxes by Mortgage Status in Rangerville
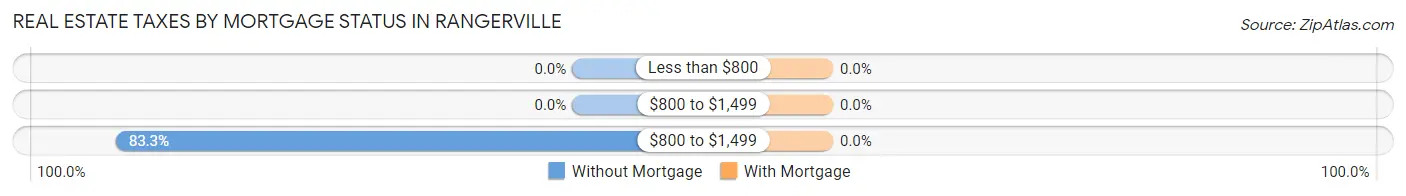
| Property Taxes | Without Mortgage | With Mortgage |
| Less than $800 | 0 (0.0%) | 0 (0.0%) |
| $800 to $1,499 | 0 (0.0%) | 0 (0.0%) |
| $800 to $1,499 | 45 (83.3%) | 0 (0.0%) |
| Total | 54 (100.0%) | 0 (0.0%) |
Health & Disability in Rangerville
Health Insurance Coverage by Age in Rangerville
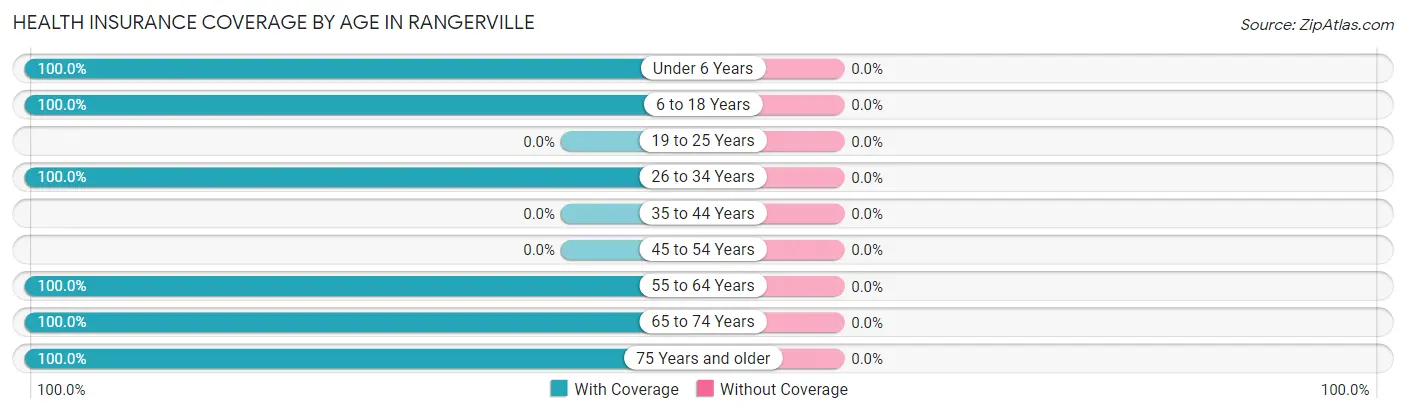
| Age Bracket | With Coverage | Without Coverage |
| Under 6 Years | 7 (100.0%) | 0 (0.0%) |
| 6 to 18 Years | 30 (100.0%) | 0 (0.0%) |
| 19 to 25 Years | 0 (0.0%) | 0 (0.0%) |
| 26 to 34 Years | 16 (100.0%) | 0 (0.0%) |
| 35 to 44 Years | 0 (0.0%) | 0 (0.0%) |
| 45 to 54 Years | 0 (0.0%) | 0 (0.0%) |
| 55 to 64 Years | 37 (100.0%) | 0 (0.0%) |
| 65 to 74 Years | 10 (100.0%) | 0 (0.0%) |
| 75 Years and older | 6 (100.0%) | 0 (0.0%) |
| Total | 106 (100.0%) | 0 (0.0%) |
Health Insurance Coverage by Citizenship Status in Rangerville
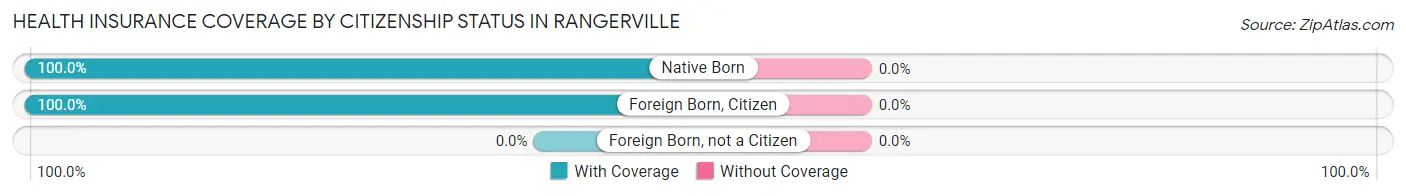
| Citizenship Status | With Coverage | Without Coverage |
| Native Born | 7 (100.0%) | 0 (0.0%) |
| Foreign Born, Citizen | 30 (100.0%) | 0 (0.0%) |
| Foreign Born, not a Citizen | 0 (0.0%) | 0 (0.0%) |
Health Insurance Coverage by Household Income in Rangerville
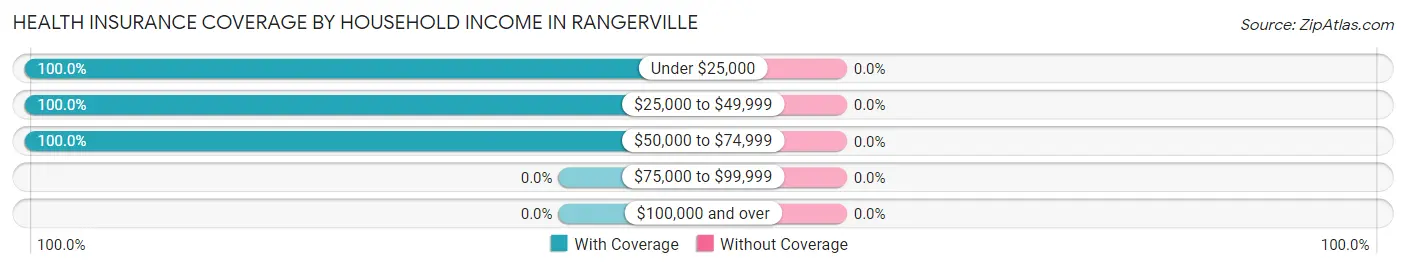
| Household Income | With Coverage | Without Coverage |
| Under $25,000 | 37 (100.0%) | 0 (0.0%) |
| $25,000 to $49,999 | 16 (100.0%) | 0 (0.0%) |
| $50,000 to $74,999 | 53 (100.0%) | 0 (0.0%) |
| $75,000 to $99,999 | 0 (0.0%) | 0 (0.0%) |
| $100,000 and over | 0 (0.0%) | 0 (0.0%) |
Public vs Private Health Insurance Coverage by Age in Rangerville
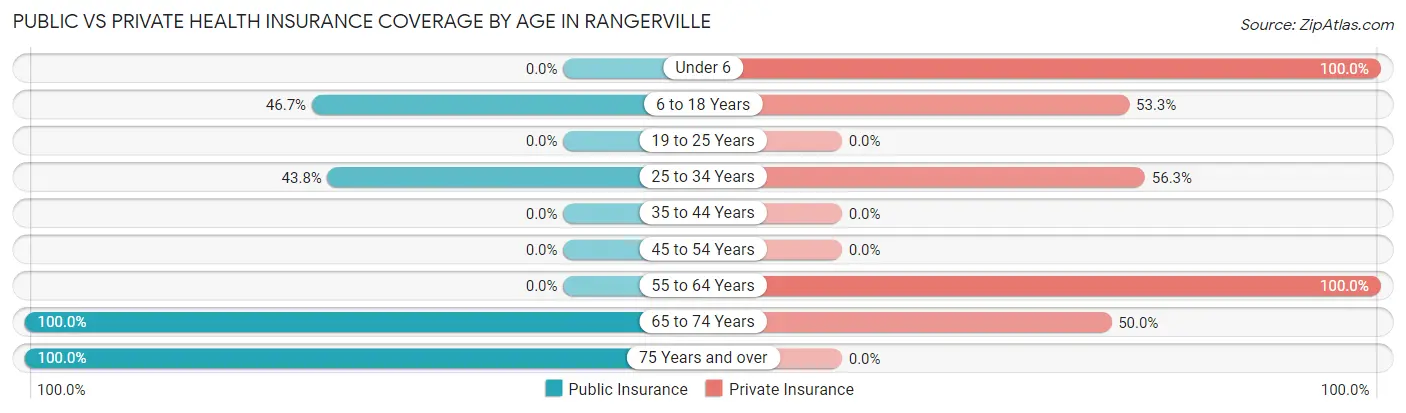
| Age Bracket | Public Insurance | Private Insurance |
| Under 6 | 0 (0.0%) | 7 (100.0%) |
| 6 to 18 Years | 14 (46.7%) | 16 (53.3%) |
| 19 to 25 Years | 0 (0.0%) | 0 (0.0%) |
| 25 to 34 Years | 7 (43.8%) | 9 (56.2%) |
| 35 to 44 Years | 0 (0.0%) | 0 (0.0%) |
| 45 to 54 Years | 0 (0.0%) | 0 (0.0%) |
| 55 to 64 Years | 0 (0.0%) | 37 (100.0%) |
| 65 to 74 Years | 10 (100.0%) | 5 (50.0%) |
| 75 Years and over | 6 (100.0%) | 0 (0.0%) |
| Total | 37 (34.9%) | 74 (69.8%) |
Disability Status by Sex by Age in Rangerville
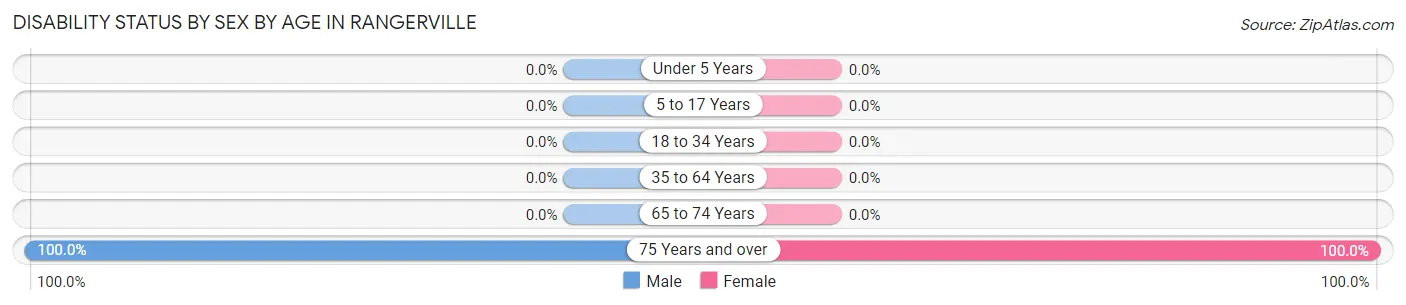
| Age Bracket | Male | Female |
| Under 5 Years | 0 (0.0%) | 0 (0.0%) |
| 5 to 17 Years | 0 (0.0%) | 0 (0.0%) |
| 18 to 34 Years | 0 (0.0%) | 0 (0.0%) |
| 35 to 64 Years | 0 (0.0%) | 0 (0.0%) |
| 65 to 74 Years | 0 (0.0%) | 0 (0.0%) |
| 75 Years and over | 3 (100.0%) | 3 (100.0%) |
Disability Class by Sex by Age in Rangerville
Disability Class: Hearing Difficulty
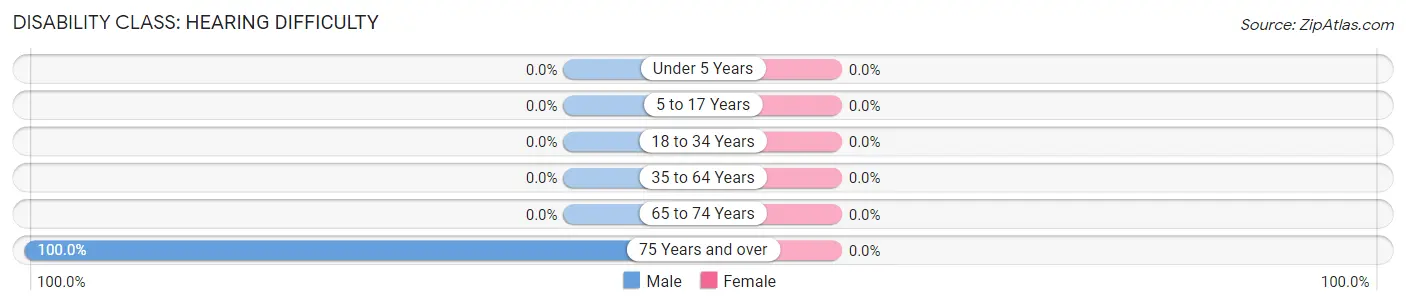
| Age Bracket | Male | Female |
| Under 5 Years | 0 (0.0%) | 0 (0.0%) |
| 5 to 17 Years | 0 (0.0%) | 0 (0.0%) |
| 18 to 34 Years | 0 (0.0%) | 0 (0.0%) |
| 35 to 64 Years | 0 (0.0%) | 0 (0.0%) |
| 65 to 74 Years | 0 (0.0%) | 0 (0.0%) |
| 75 Years and over | 3 (100.0%) | 0 (0.0%) |
Disability Class: Vision Difficulty
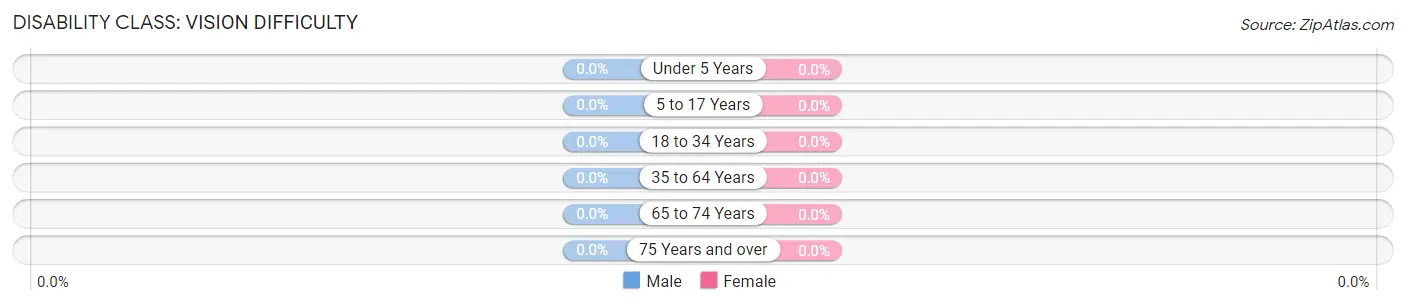
| Age Bracket | Male | Female |
| Under 5 Years | 0 (0.0%) | 0 (0.0%) |
| 5 to 17 Years | 0 (0.0%) | 0 (0.0%) |
| 18 to 34 Years | 0 (0.0%) | 0 (0.0%) |
| 35 to 64 Years | 0 (0.0%) | 0 (0.0%) |
| 65 to 74 Years | 0 (0.0%) | 0 (0.0%) |
| 75 Years and over | 0 (0.0%) | 0 (0.0%) |
Disability Class: Cognitive Difficulty
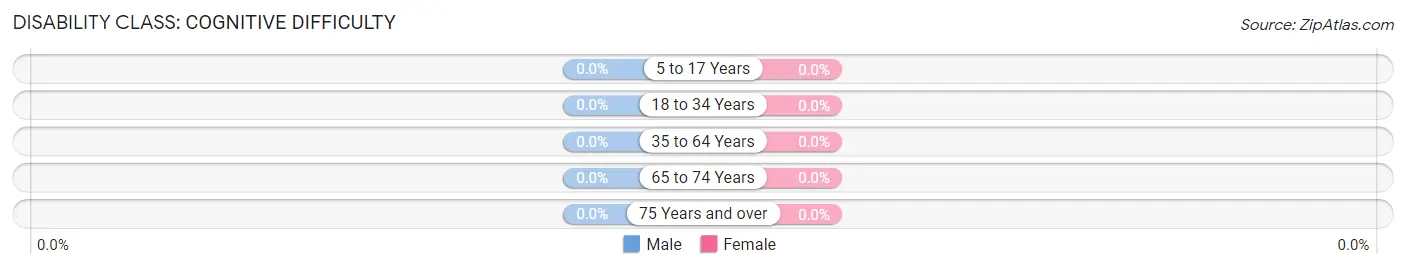
| Age Bracket | Male | Female |
| 5 to 17 Years | 0 (0.0%) | 0 (0.0%) |
| 18 to 34 Years | 0 (0.0%) | 0 (0.0%) |
| 35 to 64 Years | 0 (0.0%) | 0 (0.0%) |
| 65 to 74 Years | 0 (0.0%) | 0 (0.0%) |
| 75 Years and over | 0 (0.0%) | 0 (0.0%) |
Disability Class: Ambulatory Difficulty
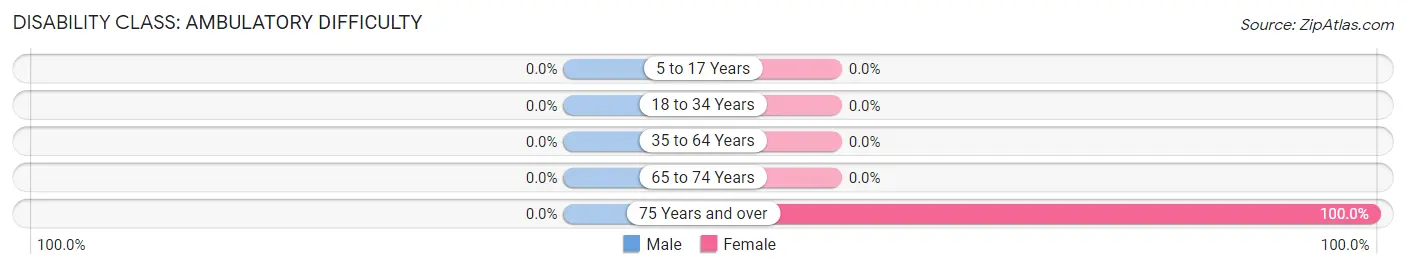
| Age Bracket | Male | Female |
| 5 to 17 Years | 0 (0.0%) | 0 (0.0%) |
| 18 to 34 Years | 0 (0.0%) | 0 (0.0%) |
| 35 to 64 Years | 0 (0.0%) | 0 (0.0%) |
| 65 to 74 Years | 0 (0.0%) | 0 (0.0%) |
| 75 Years and over | 0 (0.0%) | 3 (100.0%) |
Disability Class: Self-Care Difficulty
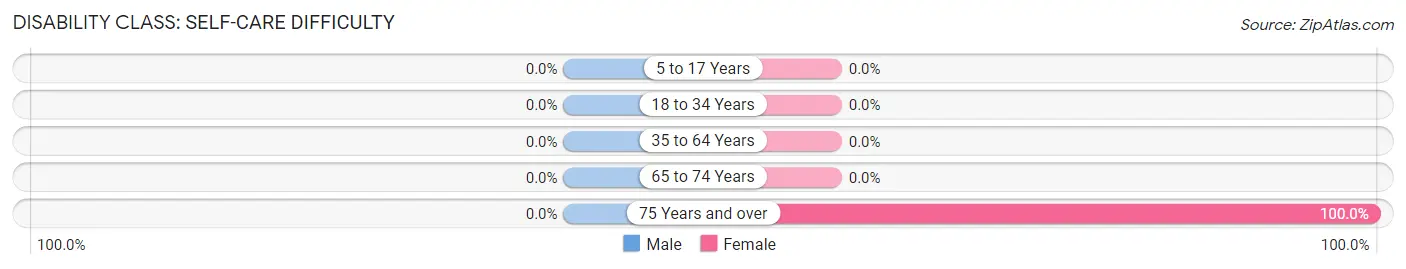
| Age Bracket | Male | Female |
| 5 to 17 Years | 0 (0.0%) | 0 (0.0%) |
| 18 to 34 Years | 0 (0.0%) | 0 (0.0%) |
| 35 to 64 Years | 0 (0.0%) | 0 (0.0%) |
| 65 to 74 Years | 0 (0.0%) | 0 (0.0%) |
| 75 Years and over | 0 (0.0%) | 3 (100.0%) |
Technology Access in Rangerville
Computing Device Access in Rangerville
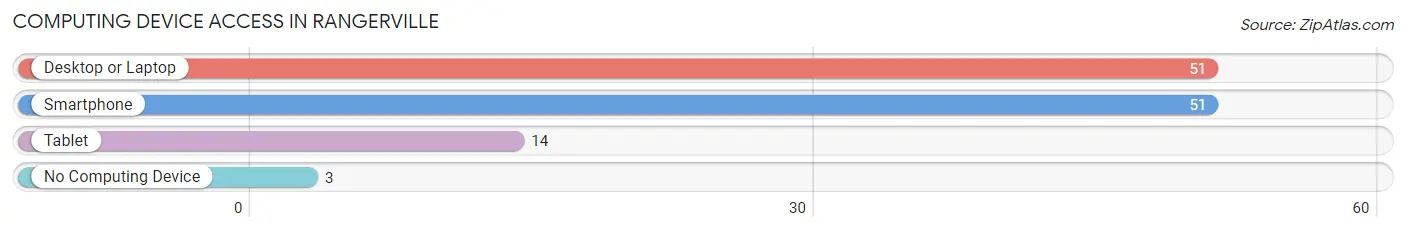
| Device Type | # Households | % Households |
| Desktop or Laptop | 51 | 94.4% |
| Smartphone | 51 | 94.4% |
| Tablet | 14 | 25.9% |
| No Computing Device | 3 | 5.6% |
| Total | 54 | 100.0% |
Internet Access in Rangerville
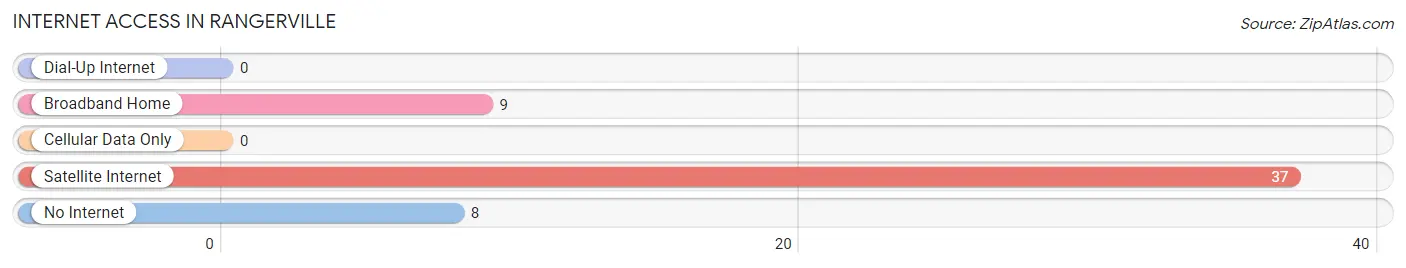
| Internet Type | # Households | % Households |
| Dial-Up Internet | 0 | 0.0% |
| Broadband Home | 9 | 16.7% |
| Cellular Data Only | 0 | 0.0% |
| Satellite Internet | 37 | 68.5% |
| No Internet | 8 | 14.8% |
| Total | 54 | 100.0% |
Rangerville Summary
Rangerville is a small town located in the state of Texas, United States. It is situated in the county of Collin, and is part of the Dallas-Fort Worth-Arlington metropolitan area. The town has a population of approximately 1,000 people, and is located about 30 miles north of Dallas.
History
Rangerville was founded in 1845 by a group of settlers from Tennessee. The town was named after the nearby Rangerville Creek, which was named after a local Native American tribe. The settlers were attracted to the area due to its fertile soil and abundant wildlife. The town quickly grew and by the late 1800s, it had become a thriving agricultural community.
In the early 1900s, the town began to experience a period of growth and development. The population increased and new businesses were established. The town also became a popular destination for tourists, who were drawn to the area’s natural beauty and recreational opportunities.
In the mid-1900s, the town experienced a period of decline. Many of the businesses closed and the population decreased. However, in recent years, the town has experienced a resurgence. New businesses have opened and the population has increased.
Geography
Rangerville is located in the northeast corner of Collin County, Texas. It is situated on the banks of the Rangerville Creek, which flows through the town. The town is surrounded by rolling hills and is located about 30 miles north of Dallas.
The climate in Rangerville is generally mild and humid. The average temperature in the summer is around 80 degrees Fahrenheit, while the average temperature in the winter is around 50 degrees Fahrenheit. The town receives an average of 40 inches of rain per year.
Economy
The economy of Rangerville is largely based on agriculture. The town is home to several farms, which produce a variety of crops, including corn, wheat, and soybeans. The town also has several small businesses, including restaurants, retail stores, and service providers.
The town is also home to a number of manufacturing companies, which produce a variety of products, including furniture, clothing, and electronics. The town is also home to a number of oil and gas companies, which are involved in the exploration and production of oil and gas in the area.
Demographics
As of the 2010 census, the population of Rangerville was 1,000 people. The racial makeup of the town was 94.2% White, 1.2% African American, 0.2% Native American, 0.2% Asian, 0.2% Pacific Islander, and 3.2% from other races. The median household income was $45,000, and the median age was 37 years.
Rangerville is a small town with a rich history and a bright future. The town is home to a diverse population and a thriving economy. The town is also home to a variety of recreational opportunities, making it an ideal place to live and work.
Common Questions
What is Per Capita Income in Rangerville?
Per Capita income in Rangerville is $15,883.
What is the Median Family Income in Rangerville?
Median Family Income in Rangerville is $27,361.
What is the Median Household income in Rangerville?
Median Household Income in Rangerville is $24,324.
What is Inequality or Gini Index in Rangerville?
Inequality or Gini Index in Rangerville is 0.22.
What is the Total Population of Rangerville?
Total Population of Rangerville is 106.
What is the Total Male Population of Rangerville?
Total Male Population of Rangerville is 75.
What is the Total Female Population of Rangerville?
Total Female Population of Rangerville is 31.
What is the Ratio of Males per 100 Females in Rangerville?
There are 241.94 Males per 100 Females in Rangerville.
What is the Ratio of Females per 100 Males in Rangerville?
There are 41.33 Females per 100 Males in Rangerville.
What is the Median Population Age in Rangerville?
Median Population Age in Rangerville is 43.5 Years.
What is the Average Family Size in Rangerville
Average Family Size in Rangerville is 3.6 People.
What is the Average Household Size in Rangerville
Average Household Size in Rangerville is 2.0 People.
How Large is the Labor Force in Rangerville?
There are 53 People in the Labor Forcein in Rangerville.
What is the Percentage of People in the Labor Force in Rangerville?
76.8% of People are in the Labor Force in Rangerville.