Sun Valley, TX Map & Demographics
Sun Valley Map
Sun Valley Overview
$23,643
PER CAPITA INCOME
$40,625
AVG HOUSEHOLD INCOME
2.4%
WAGE / INCOME GAP [ % ]
97.6¢/ $1
WAGE / INCOME GAP [ $ ]
0.21
INEQUALITY / GINI INDEX
75
TOTAL POPULATION
47
MALE POPULATION
28
FEMALE POPULATION
167.86
MALES / 100 FEMALES
59.57
FEMALES / 100 MALES
28.6
MEDIAN AGE
3.5
AVG FAMILY SIZE
2.3
AVG HOUSEHOLD SIZE
44
LABOR FORCE [ PEOPLE ]
84.6%
PERCENT IN LABOR FORCE
Income in Sun Valley
Income Overview in Sun Valley
| Characteristic | Number | Measure |
| Per Capita Income | 75 | $23,643 |
| Median Family Income | 13 | $0 |
| Mean Family Income | 13 | $55,400 |
| Median Household Income | 32 | $40,625 |
| Mean Household Income | 32 | $51,913 |
| Income Deficit | 13 | $0 |
| Wage / Income Gap (%) | 75 | 2.41% |
| Wage / Income Gap ($) | 75 | 97.59¢ per $1 |
| Gini / Inequality Index | 75 | 0.21 |
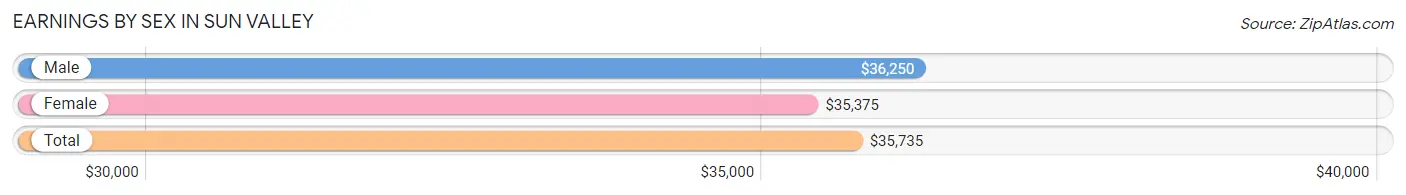
Earnings by Sex in Sun Valley
Average Earnings in Sun Valley are $35,735, $36,250 for men and $35,375 for women, a difference of 2.4%.
| Sex | Number | Average Earnings |
| Male | 23 (52.3%) | $36,250 |
| Female | 21 (47.7%) | $35,375 |
| Total | 44 (100.0%) | $35,735 |
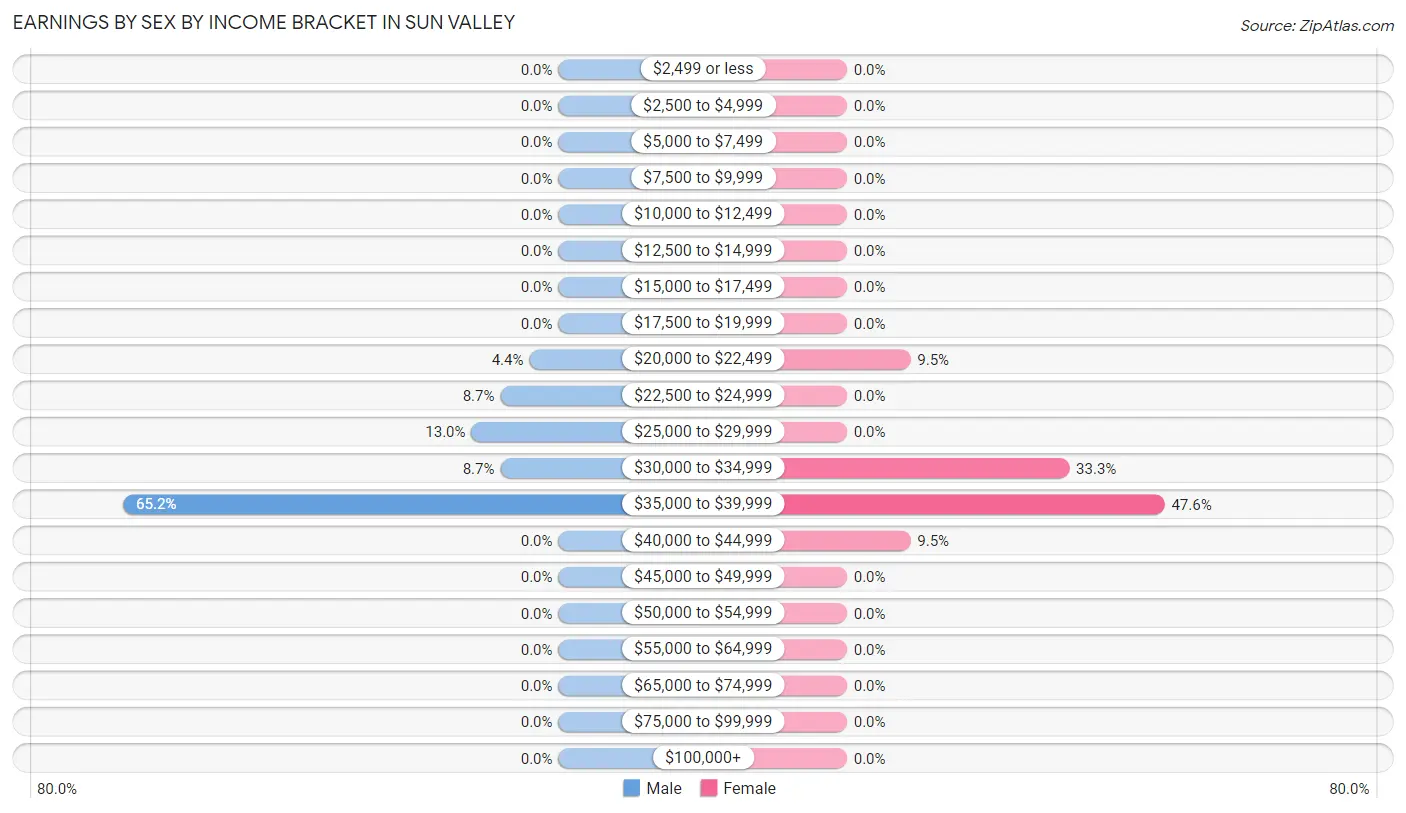
Earnings by Sex by Income Bracket in Sun Valley
The most common earnings brackets in Sun Valley are $35,000 to $39,999 for men (15 | 65.2%) and $35,000 to $39,999 for women (10 | 47.6%).
| Income | Male | Female |
| $2,499 or less | 0 (0.0%) | 0 (0.0%) |
| $2,500 to $4,999 | 0 (0.0%) | 0 (0.0%) |
| $5,000 to $7,499 | 0 (0.0%) | 0 (0.0%) |
| $7,500 to $9,999 | 0 (0.0%) | 0 (0.0%) |
| $10,000 to $12,499 | 0 (0.0%) | 0 (0.0%) |
| $12,500 to $14,999 | 0 (0.0%) | 0 (0.0%) |
| $15,000 to $17,499 | 0 (0.0%) | 0 (0.0%) |
| $17,500 to $19,999 | 0 (0.0%) | 0 (0.0%) |
| $20,000 to $22,499 | 1 (4.3%) | 2 (9.5%) |
| $22,500 to $24,999 | 2 (8.7%) | 0 (0.0%) |
| $25,000 to $29,999 | 3 (13.0%) | 0 (0.0%) |
| $30,000 to $34,999 | 2 (8.7%) | 7 (33.3%) |
| $35,000 to $39,999 | 15 (65.2%) | 10 (47.6%) |
| $40,000 to $44,999 | 0 (0.0%) | 2 (9.5%) |
| $45,000 to $49,999 | 0 (0.0%) | 0 (0.0%) |
| $50,000 to $54,999 | 0 (0.0%) | 0 (0.0%) |
| $55,000 to $64,999 | 0 (0.0%) | 0 (0.0%) |
| $65,000 to $74,999 | 0 (0.0%) | 0 (0.0%) |
| $75,000 to $99,999 | 0 (0.0%) | 0 (0.0%) |
| $100,000+ | 0 (0.0%) | 0 (0.0%) |
| Total | 23 (100.0%) | 21 (100.0%) |
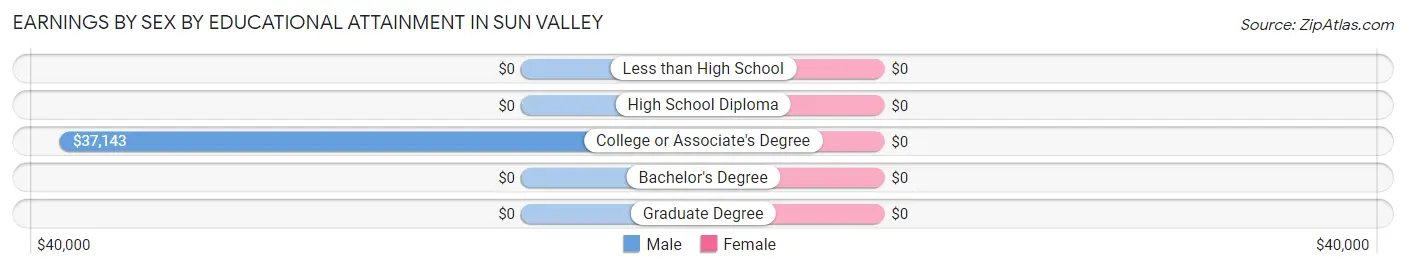
Earnings by Sex by Educational Attainment in Sun Valley
| Educational Attainment | Male Income | Female Income |
| Less than High School | - | - |
| High School Diploma | - | - |
| College or Associate's Degree | $37,143 | $0 |
| Bachelor's Degree | - | - |
| Graduate Degree | - | - |
| Total | $36,607 | $36,250 |
Family Income in Sun Valley
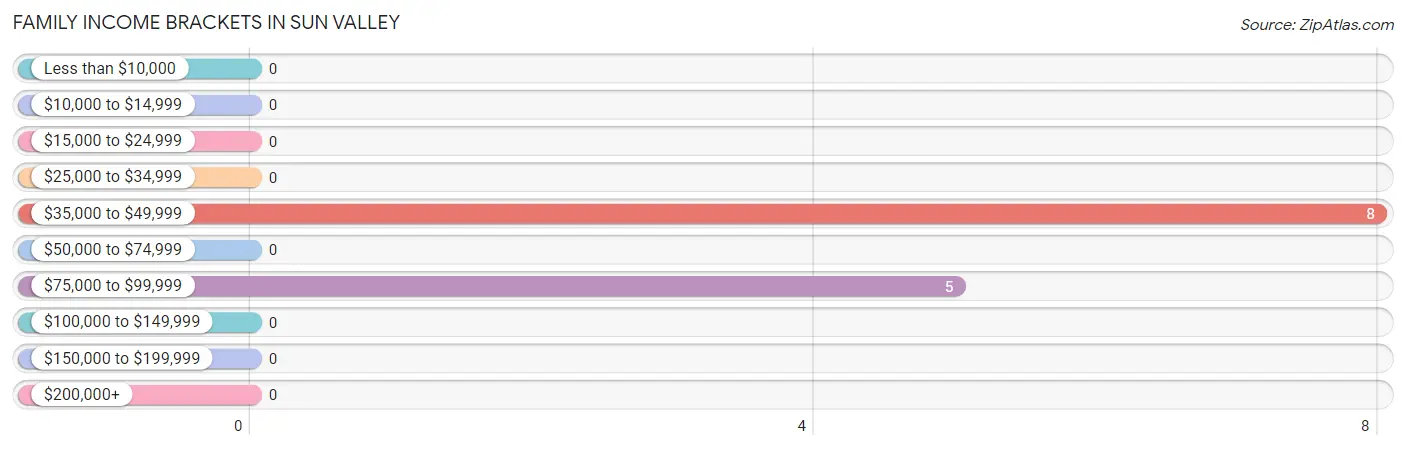
Family Income Brackets in Sun Valley
According to the Sun Valley family income data, there are 8 families falling into the $35,000 to $49,999 income range, which is the most common income bracket and makes up 61.5% of all families.
| Income Bracket | # Families | % Families |
| Less than $10,000 | 0 | 0.0% |
| $10,000 to $14,999 | 0 | 0.0% |
| $15,000 to $24,999 | 0 | 0.0% |
| $25,000 to $34,999 | 0 | 0.0% |
| $35,000 to $49,999 | 8 | 61.5% |
| $50,000 to $74,999 | 0 | 0.0% |
| $75,000 to $99,999 | 5 | 38.5% |
| $100,000 to $149,999 | 0 | 0.0% |
| $150,000 to $199,999 | 0 | 0.0% |
| $200,000+ | 0 | 0.0% |
Family Income by Famaliy Size in Sun Valley
| Income Bracket | # Families | Median Income |
| 2-Person Families | 5 (38.5%) | $0 |
| 3-Person Families | 0 (0.0%) | $0 |
| 4-Person Families | 7 (53.8%) | $0 |
| 5-Person Families | 0 (0.0%) | $0 |
| 6-Person Families | 1 (7.7%) | $0 |
| 7+ Person Families | 0 (0.0%) | $0 |
| Total | 13 (100.0%) | $0 |
Family Income by Number of Earners in Sun Valley
| Number of Earners | # Families | Median Income |
| No Earners | 0 (0.0%) | $0 |
| 1 Earner | 12 (92.3%) | $0 |
| 2 Earners | 1 (7.7%) | $0 |
| 3+ Earners | 0 (0.0%) | $0 |
| Total | 13 (100.0%) | $0 |
Household Income in Sun Valley
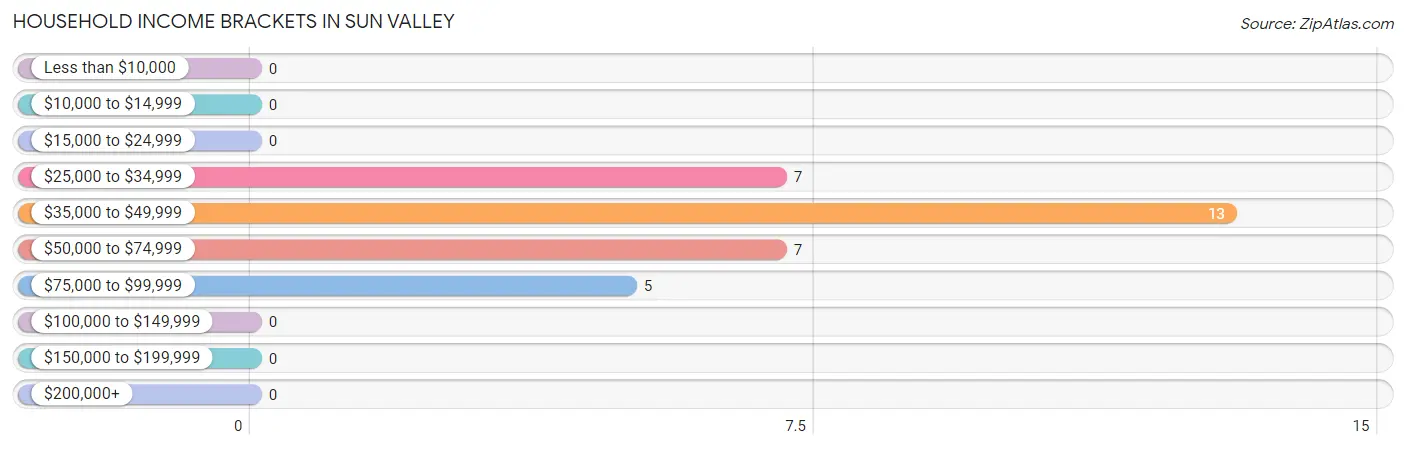
Household Income Brackets in Sun Valley
With 13 households falling in the category, the $35,000 to $49,999 income range is the most frequent in Sun Valley, accounting for 40.6% of all households.
| Income Bracket | # Households | % Households |
| Less than $10,000 | 0 | 0.0% |
| $10,000 to $14,999 | 0 | 0.0% |
| $15,000 to $24,999 | 0 | 0.0% |
| $25,000 to $34,999 | 7 | 21.9% |
| $35,000 to $49,999 | 13 | 40.6% |
| $50,000 to $74,999 | 7 | 21.9% |
| $75,000 to $99,999 | 5 | 15.6% |
| $100,000 to $149,999 | 0 | 0.0% |
| $150,000 to $199,999 | 0 | 0.0% |
| $200,000+ | 0 | 0.0% |
Household Income by Householder Age in Sun Valley
The median household income in Sun Valley is $40,625, with the highest median household income of $76,250 found in the 65+ years age bracket for the primary householder. A total of 7 households (21.9%) fall into this category. Meanwhile, the 15 to 24 years age bracket for the primary householder has the lowest median household income of $0, with 7 households (21.9%) in this group.
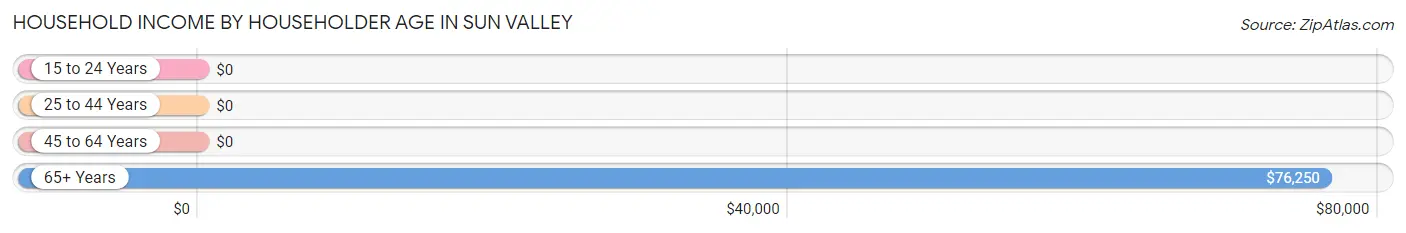
| Income Bracket | # Households | Median Income |
| 15 to 24 Years | 7 (21.9%) | $0 |
| 25 to 44 Years | 17 (53.1%) | $0 |
| 45 to 64 Years | 1 (3.1%) | $0 |
| 65+ Years | 7 (21.9%) | $76,250 |
| Total | 32 (100.0%) | $40,625 |
Poverty in Sun Valley
Income Below Poverty by Sex and Age in Sun Valley
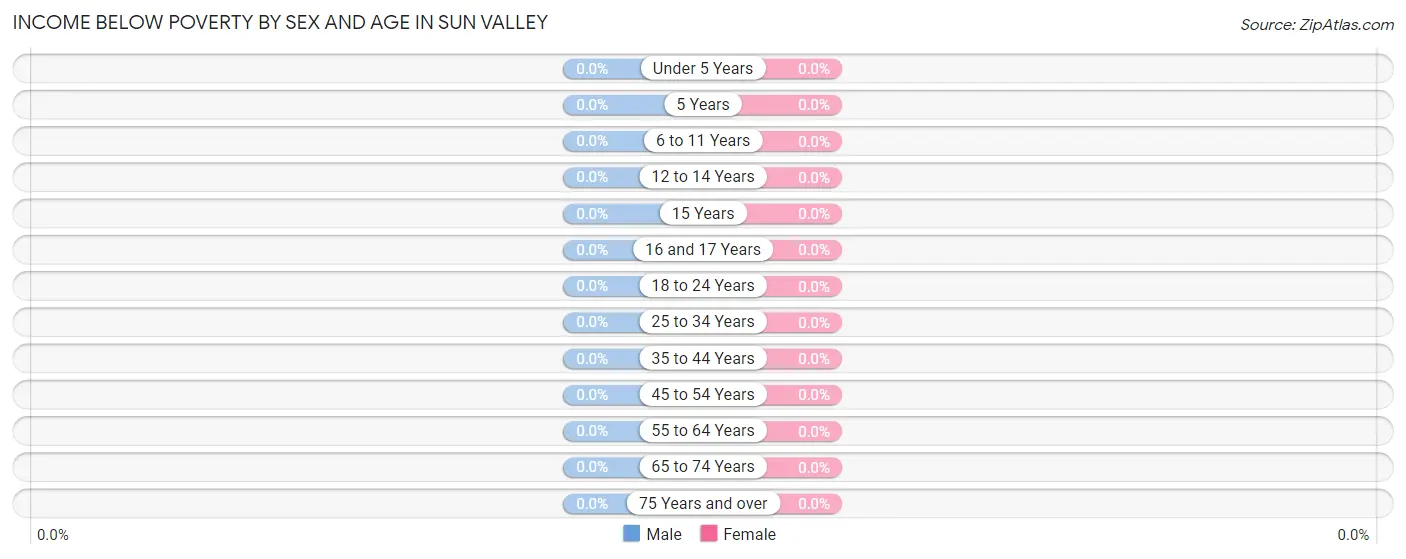
| Age Bracket | Male | Female |
| Under 5 Years | 0 (0.0%) | 0 (0.0%) |
| 5 Years | 0 (0.0%) | 0 (0.0%) |
| 6 to 11 Years | 0 (0.0%) | 0 (0.0%) |
| 12 to 14 Years | 0 (0.0%) | 0 (0.0%) |
| 15 Years | 0 (0.0%) | 0 (0.0%) |
| 16 and 17 Years | 0 (0.0%) | 0 (0.0%) |
| 18 to 24 Years | 0 (0.0%) | 0 (0.0%) |
| 25 to 34 Years | 0 (0.0%) | 0 (0.0%) |
| 35 to 44 Years | 0 (0.0%) | 0 (0.0%) |
| 45 to 54 Years | 0 (0.0%) | 0 (0.0%) |
| 55 to 64 Years | 0 (0.0%) | 0 (0.0%) |
| 65 to 74 Years | 0 (0.0%) | 0 (0.0%) |
| 75 Years and over | 0 (0.0%) | 0 (0.0%) |
| Total | 0 (0.0%) | 0 (0.0%) |
Income Above Poverty by Sex and Age in Sun Valley
According to the poverty statistics in Sun Valley, males aged 6 to 11 years and females aged 18 to 24 years are the age groups that are most secure financially, with 100.0% of males and 100.0% of females in these age groups living above the poverty line.
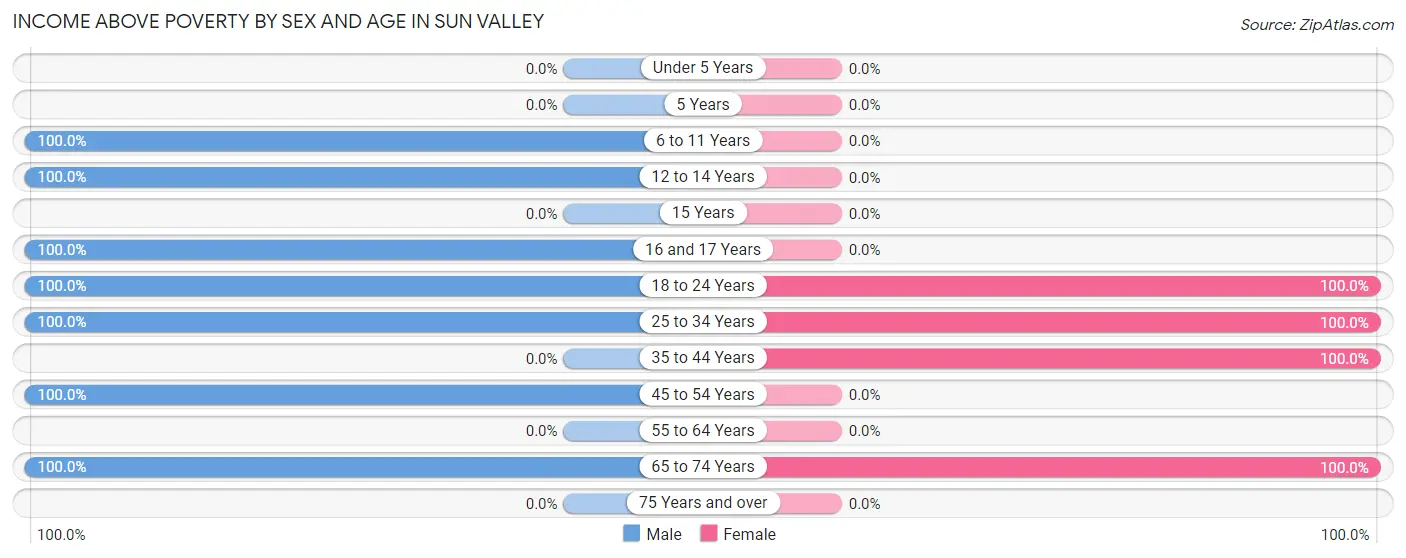
| Age Bracket | Male | Female |
| Under 5 Years | 0 (0.0%) | 0 (0.0%) |
| 5 Years | 0 (0.0%) | 0 (0.0%) |
| 6 to 11 Years | 16 (100.0%) | 0 (0.0%) |
| 12 to 14 Years | 7 (100.0%) | 0 (0.0%) |
| 15 Years | 0 (0.0%) | 0 (0.0%) |
| 16 and 17 Years | 1 (100.0%) | 0 (0.0%) |
| 18 to 24 Years | 2 (100.0%) | 7 (100.0%) |
| 25 to 34 Years | 15 (100.0%) | 10 (100.0%) |
| 35 to 44 Years | 0 (0.0%) | 5 (100.0%) |
| 45 to 54 Years | 1 (100.0%) | 0 (0.0%) |
| 55 to 64 Years | 0 (0.0%) | 0 (0.0%) |
| 65 to 74 Years | 5 (100.0%) | 6 (100.0%) |
| 75 Years and over | 0 (0.0%) | 0 (0.0%) |
| Total | 47 (100.0%) | 28 (100.0%) |
Income Below Poverty Among Married-Couple Families in Sun Valley
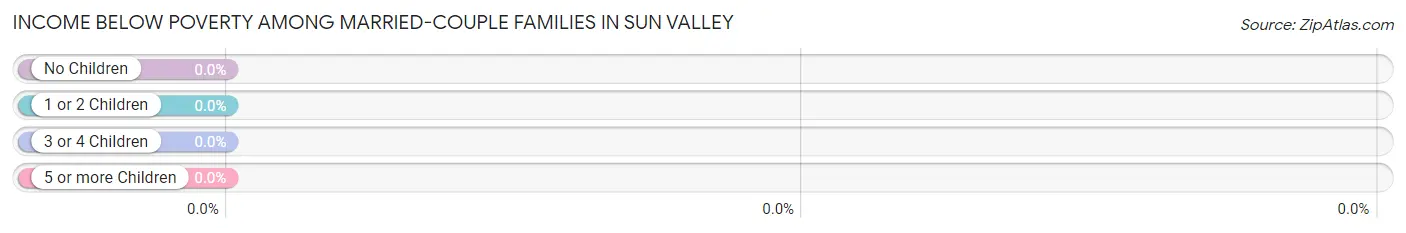
| Children | Above Poverty | Below Poverty |
| No Children | 3 (100.0%) | 0 (0.0%) |
| 1 or 2 Children | 0 (0.0%) | 0 (0.0%) |
| 3 or 4 Children | 1 (100.0%) | 0 (0.0%) |
| 5 or more Children | 0 (0.0%) | 0 (0.0%) |
| Total | 4 (100.0%) | 0 (0.0%) |
Income Below Poverty Among Single-Parent Households in Sun Valley
| Children | Single Father | Single Mother |
| No Children | 0 (0.0%) | 0 (0.0%) |
| 1 or 2 Children | 0 (0.0%) | 0 (0.0%) |
| 3 or 4 Children | 0 (0.0%) | 0 (0.0%) |
| 5 or more Children | 0 (0.0%) | 0 (0.0%) |
| Total | 0 (0.0%) | 0 (0.0%) |
Income Below Poverty Among Married-Couple vs Single-Parent Households in Sun Valley
| Children | Married-Couple Families | Single-Parent Households |
| No Children | 0 (0.0%) | 0 (0.0%) |
| 1 or 2 Children | 0 (0.0%) | 0 (0.0%) |
| 3 or 4 Children | 0 (0.0%) | 0 (0.0%) |
| 5 or more Children | 0 (0.0%) | 0 (0.0%) |
| Total | 0 (0.0%) | 0 (0.0%) |
Race in Sun Valley
The most populous races in Sun Valley are White / Caucasian (65 | 86.7%), Hispanic or Latino (50 | 66.7%), and Some other Race (8 | 10.7%).
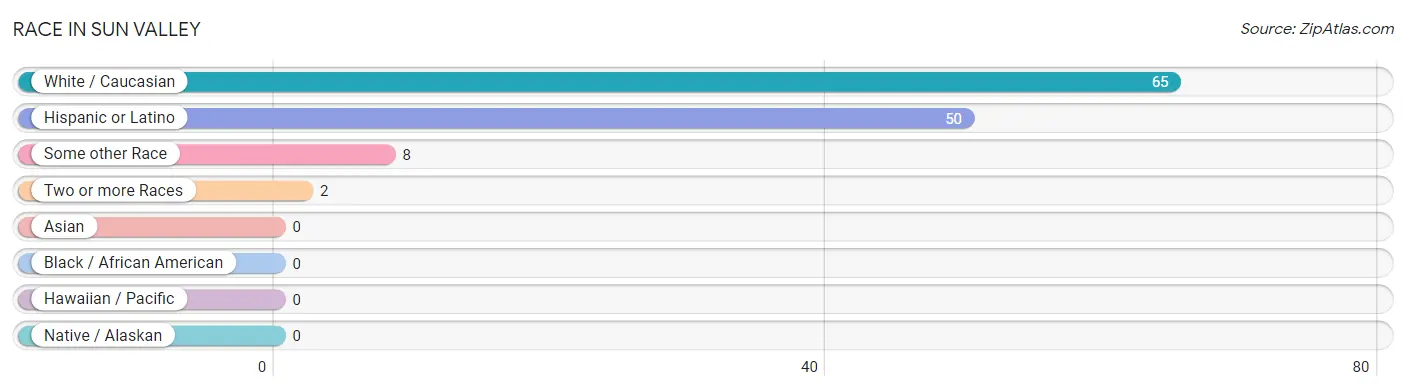
| Race | # Population | % Population |
| Asian | 0 | 0.0% |
| Black / African American | 0 | 0.0% |
| Hawaiian / Pacific | 0 | 0.0% |
| Hispanic or Latino | 50 | 66.7% |
| Native / Alaskan | 0 | 0.0% |
| White / Caucasian | 65 | 86.7% |
| Two or more Races | 2 | 2.7% |
| Some other Race | 8 | 10.7% |
| Total | 75 | 100.0% |
Ancestry in Sun Valley
The most populous ancestries reported in Sun Valley are Mexican (47 | 62.7%), American (15 | 20.0%), Irish (3 | 4.0%), Spaniard (3 | 4.0%), and Canadian (2 | 2.7%), together accounting for 93.3% of all Sun Valley residents.
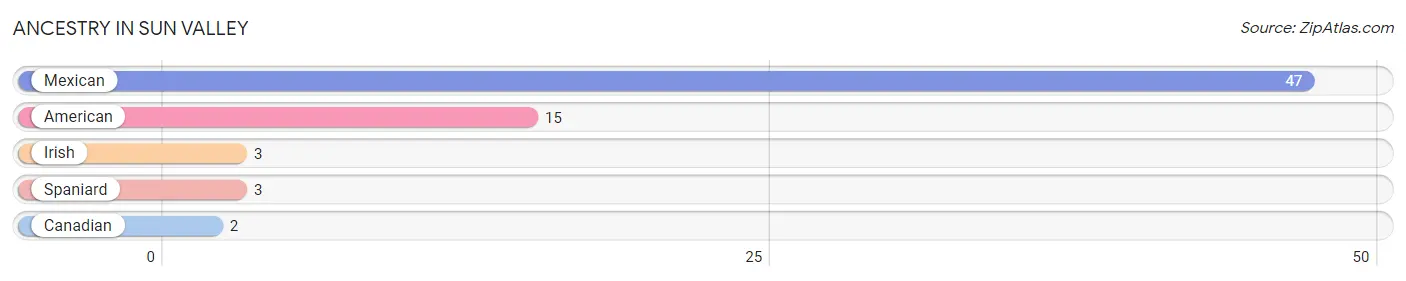
| Ancestry | # Population | % Population |
| American | 15 | 20.0% |
| Canadian | 2 | 2.7% |
| Irish | 3 | 4.0% |
| Mexican | 47 | 62.7% |
| Spaniard | 3 | 4.0% | View All 5 Rows |
Immigrants in Sun Valley
The most numerous immigrant groups reported in Sun Valley came from Central America (33 | 44.0%), Latin America (33 | 44.0%), Mexico (33 | 44.0%), and Canada (7 | 9.3%), together accounting for 141.3% of all Sun Valley residents.
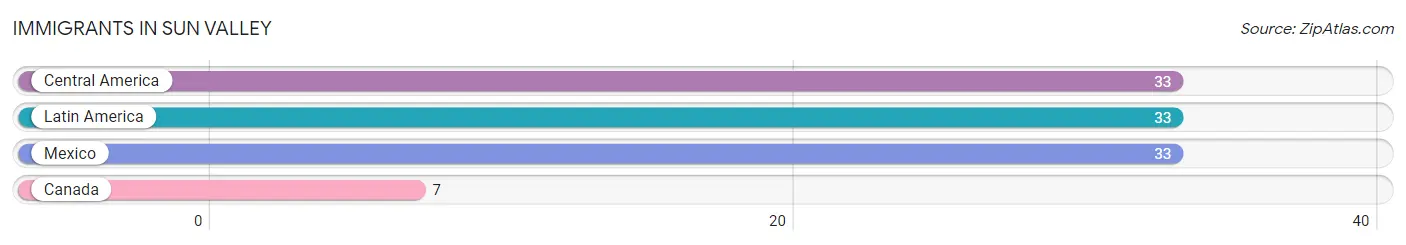
| Immigration Origin | # Population | % Population |
| Canada | 7 | 9.3% |
| Central America | 33 | 44.0% |
| Latin America | 33 | 44.0% |
| Mexico | 33 | 44.0% | View All 4 Rows |
Sex and Age in Sun Valley
Sex and Age in Sun Valley
The most populous age groups in Sun Valley are 5 to 9 Years (15 | 31.9%) for men and 30 to 34 Years (10 | 35.7%) for women.
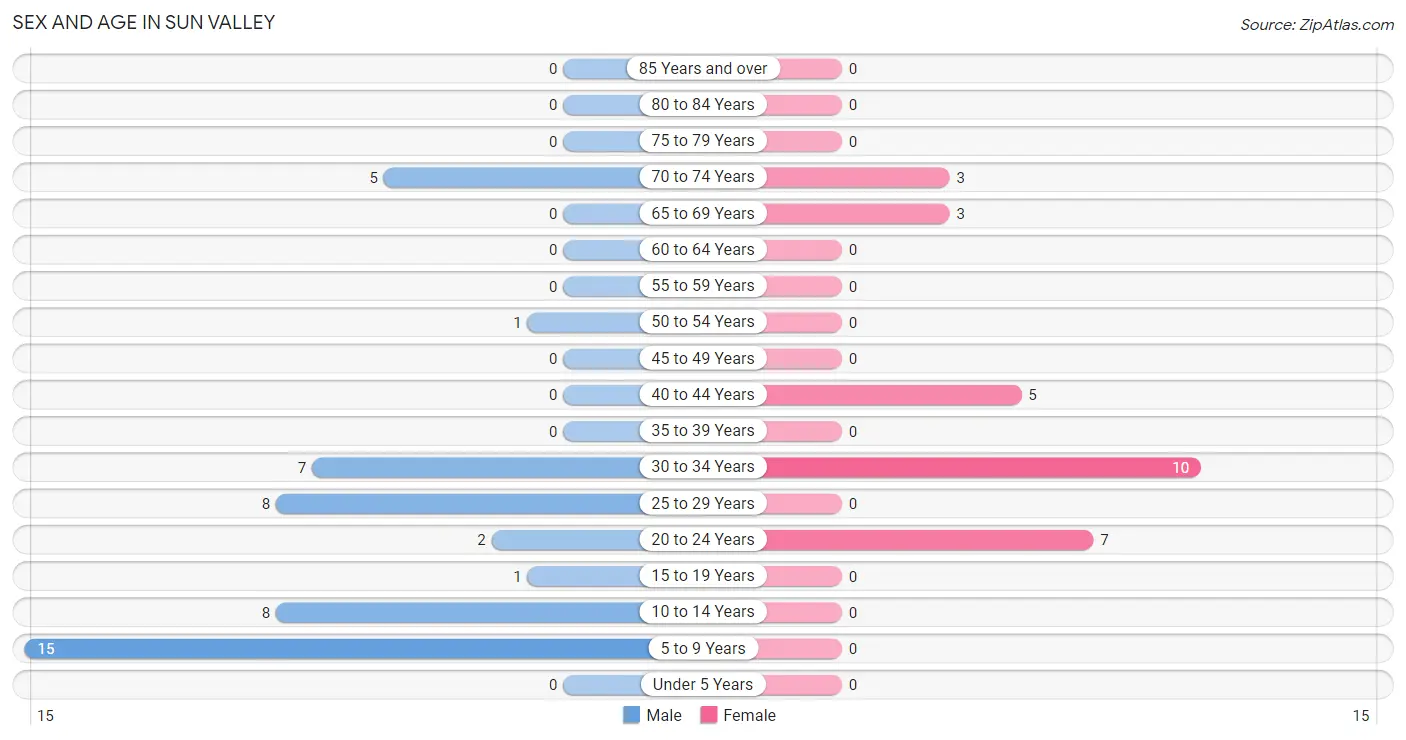
| Age Bracket | Male | Female |
| Under 5 Years | 0 (0.0%) | 0 (0.0%) |
| 5 to 9 Years | 15 (31.9%) | 0 (0.0%) |
| 10 to 14 Years | 8 (17.0%) | 0 (0.0%) |
| 15 to 19 Years | 1 (2.1%) | 0 (0.0%) |
| 20 to 24 Years | 2 (4.3%) | 7 (25.0%) |
| 25 to 29 Years | 8 (17.0%) | 0 (0.0%) |
| 30 to 34 Years | 7 (14.9%) | 10 (35.7%) |
| 35 to 39 Years | 0 (0.0%) | 0 (0.0%) |
| 40 to 44 Years | 0 (0.0%) | 5 (17.9%) |
| 45 to 49 Years | 0 (0.0%) | 0 (0.0%) |
| 50 to 54 Years | 1 (2.1%) | 0 (0.0%) |
| 55 to 59 Years | 0 (0.0%) | 0 (0.0%) |
| 60 to 64 Years | 0 (0.0%) | 0 (0.0%) |
| 65 to 69 Years | 0 (0.0%) | 3 (10.7%) |
| 70 to 74 Years | 5 (10.6%) | 3 (10.7%) |
| 75 to 79 Years | 0 (0.0%) | 0 (0.0%) |
| 80 to 84 Years | 0 (0.0%) | 0 (0.0%) |
| 85 Years and over | 0 (0.0%) | 0 (0.0%) |
| Total | 47 (100.0%) | 28 (100.0%) |
Families and Households in Sun Valley
Median Family Size in Sun Valley
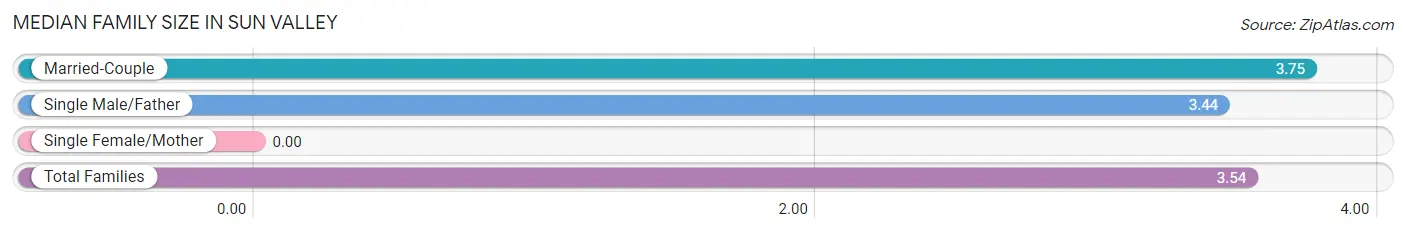
| Family Type | # Families | Family Size |
| Married-Couple | 4 (30.8%) | 3.75 |
| Single Male/Father | 9 (69.2%) | 3.44 |
| Single Female/Mother | 0 (0.0%) | - |
| Total Families | 13 (100.0%) | 3.54 |
Median Household Size in Sun Valley
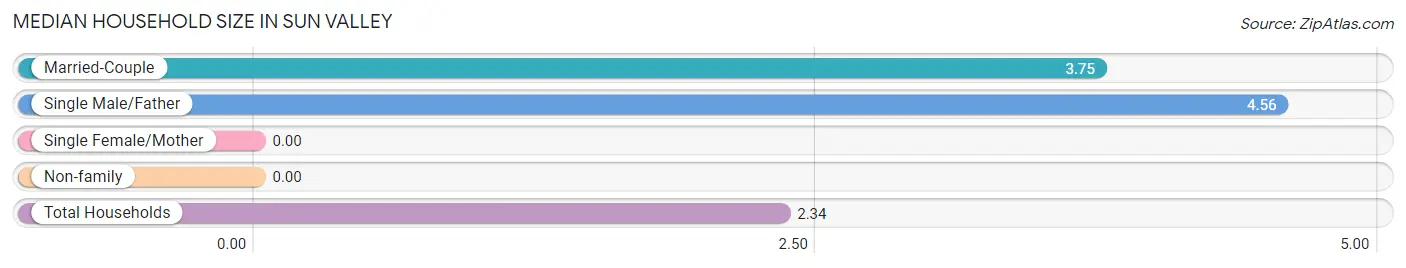
| Household Type | # Households | Household Size |
| Married-Couple | 4 (12.5%) | 3.75 |
| Single Male/Father | 9 (28.1%) | 4.56 |
| Single Female/Mother | 0 (0.0%) | - |
| Non-family | 19 (59.4%) | - |
| Total Households | 32 (100.0%) | 2.34 |
Household Size by Marriage Status in Sun Valley
Out of a total of 32 households in Sun Valley, 13 (40.6%) are family households, while 19 (59.4%) are nonfamily households. The most numerous type of family households are 5-person households, comprising 7, and the most common type of nonfamily households are 1-person households, comprising 19.
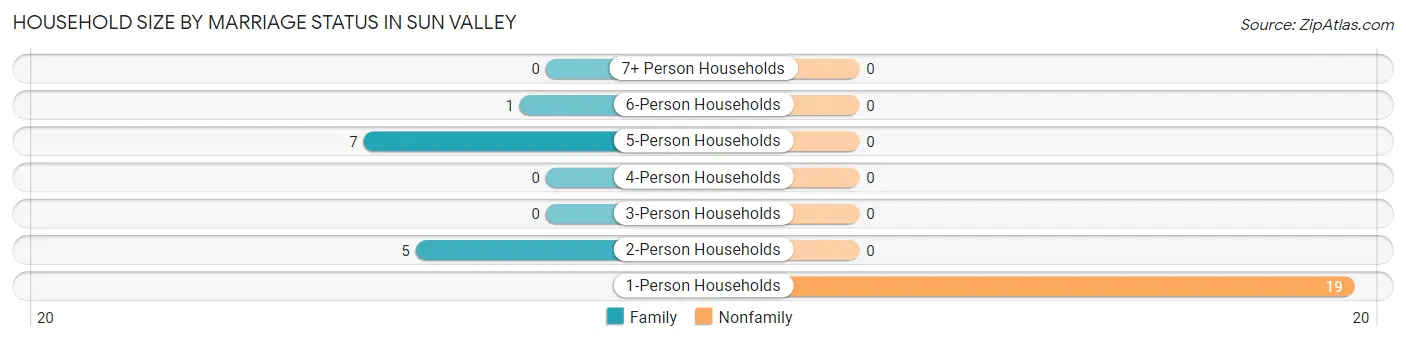
| Household Size | Family Households | Nonfamily Households |
| 1-Person Households | - | 19 (59.4%) |
| 2-Person Households | 5 (15.6%) | 0 (0.0%) |
| 3-Person Households | 0 (0.0%) | 0 (0.0%) |
| 4-Person Households | 0 (0.0%) | 0 (0.0%) |
| 5-Person Households | 7 (21.9%) | 0 (0.0%) |
| 6-Person Households | 1 (3.1%) | 0 (0.0%) |
| 7+ Person Households | 0 (0.0%) | 0 (0.0%) |
| Total | 13 (40.6%) | 19 (59.4%) |
Female Fertility in Sun Valley
Fertility by Age in Sun Valley
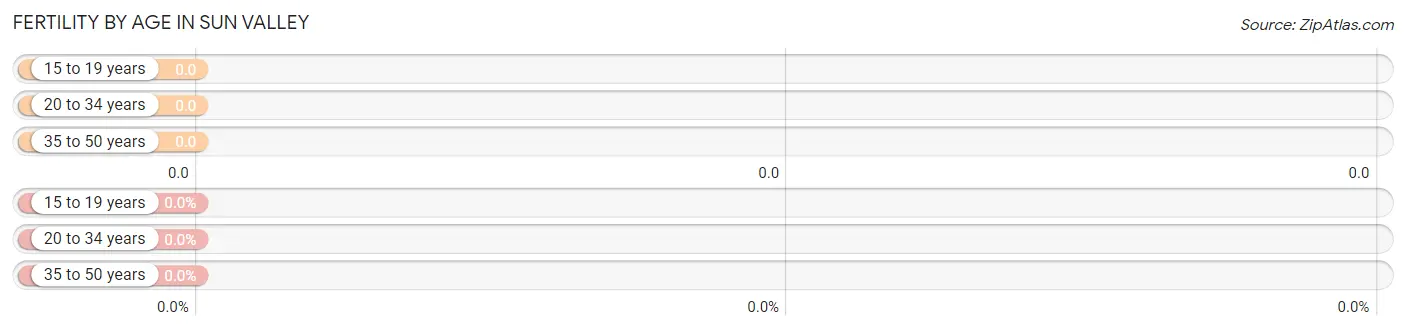
| Age Bracket | Women with Births | Births / 1,000 Women |
| 15 to 19 years | 0 (0.0%) | 0.0 |
| 20 to 34 years | 0 (0.0%) | 0.0 |
| 35 to 50 years | 0 (0.0%) | 0.0 |
| Total | 0 (0.0%) | 0.0 |
Fertility by Age by Marriage Status in Sun Valley
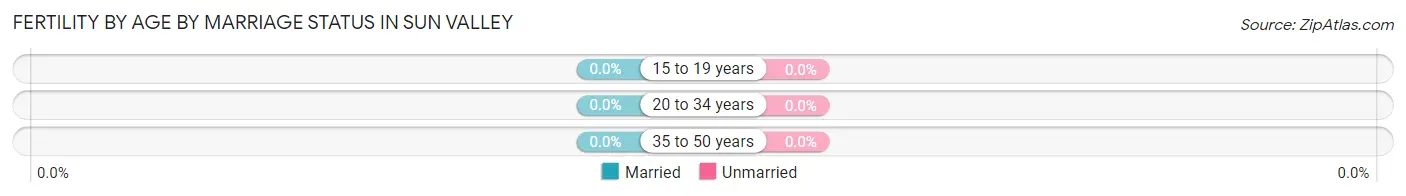
| Age Bracket | Married | Unmarried |
| 15 to 19 years | 0 (0.0%) | 0 (0.0%) |
| 20 to 34 years | 0 (0.0%) | 0 (0.0%) |
| 35 to 50 years | 0 (0.0%) | 0 (0.0%) |
| Total | 0 (0.0%) | 0 (0.0%) |
Fertility by Education in Sun Valley
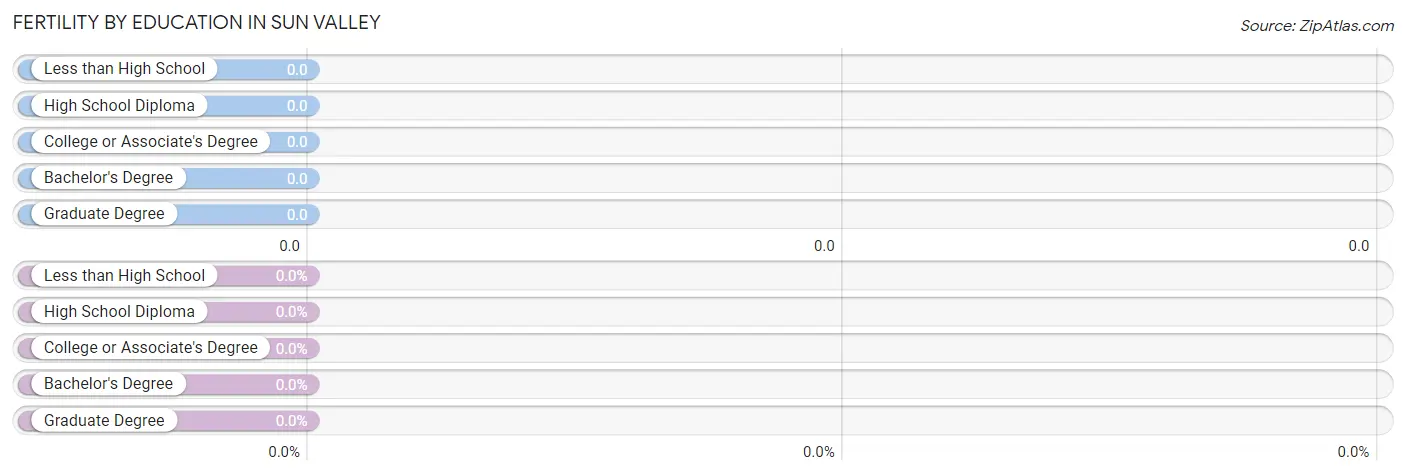
| Educational Attainment | Women with Births | Births / 1,000 Women |
| Less than High School | 0 (0.0%) | 0.0 |
| High School Diploma | 0 (0.0%) | 0.0 |
| College or Associate's Degree | 0 (0.0%) | 0.0 |
| Bachelor's Degree | 0 (0.0%) | 0.0 |
| Graduate Degree | 0 (0.0%) | 0.0 |
| Total | 0 (0.0%) | 0.0 |
Fertility by Education by Marriage Status in Sun Valley
| Educational Attainment | Married | Unmarried |
| Less than High School | 0 (0.0%) | 0 (0.0%) |
| High School Diploma | 0 (0.0%) | 0 (0.0%) |
| College or Associate's Degree | 0 (0.0%) | 0 (0.0%) |
| Bachelor's Degree | 0 (0.0%) | 0 (0.0%) |
| Graduate Degree | 0 (0.0%) | 0 (0.0%) |
| Total | 0 (0.0%) | 0 (0.0%) |
Employment Characteristics in Sun Valley
Employment by Class of Employer in Sun Valley
Among the 44 employed individuals in Sun Valley, private company employees (32 | 72.7%), state government employees (7 | 15.9%), and self-employed (not incorporated) (3 | 6.8%) make up the most common classes of employment.
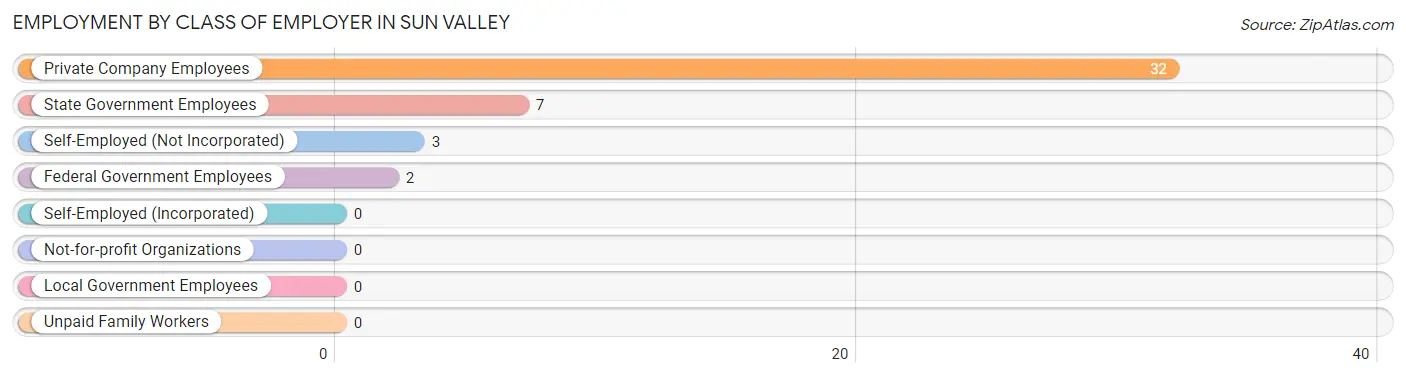
| Employer Class | # Employees | % Employees |
| Private Company Employees | 32 | 72.7% |
| Self-Employed (Incorporated) | 0 | 0.0% |
| Self-Employed (Not Incorporated) | 3 | 6.8% |
| Not-for-profit Organizations | 0 | 0.0% |
| Local Government Employees | 0 | 0.0% |
| State Government Employees | 7 | 15.9% |
| Federal Government Employees | 2 | 4.5% |
| Unpaid Family Workers | 0 | 0.0% |
| Total | 44 | 100.0% |
Employment Status by Age in Sun Valley
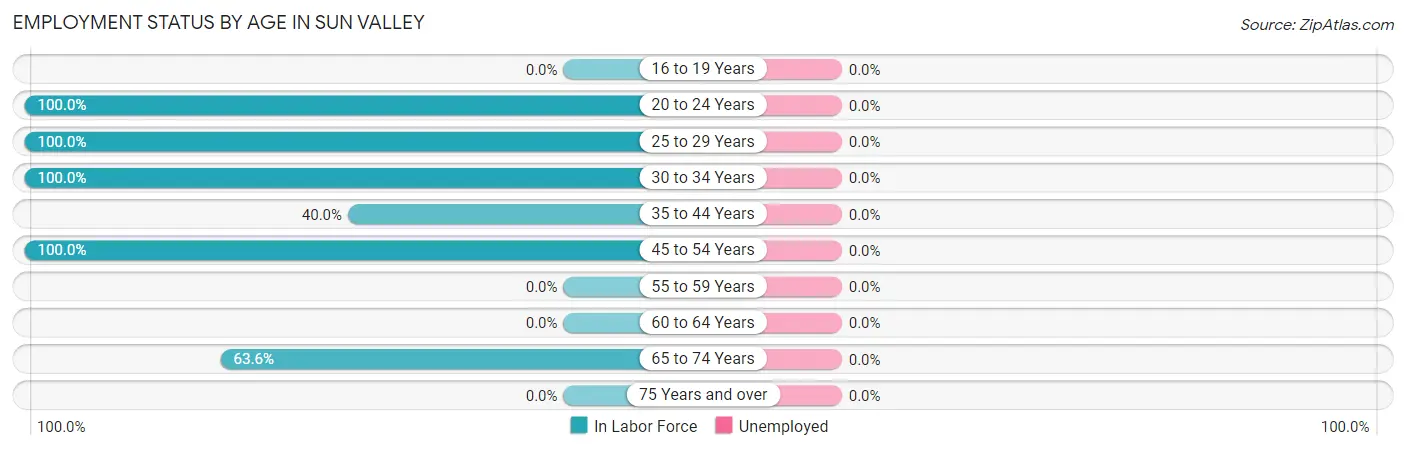
| Age Bracket | In Labor Force | Unemployed |
| 16 to 19 Years | 0 (0.0%) | 0 (0.0%) |
| 20 to 24 Years | 9 (100.0%) | 0 (0.0%) |
| 25 to 29 Years | 8 (100.0%) | 0 (0.0%) |
| 30 to 34 Years | 17 (100.0%) | 0 (0.0%) |
| 35 to 44 Years | 2 (40.0%) | 0 (0.0%) |
| 45 to 54 Years | 1 (100.0%) | 0 (0.0%) |
| 55 to 59 Years | 0 (0.0%) | 0 (0.0%) |
| 60 to 64 Years | 0 (0.0%) | 0 (0.0%) |
| 65 to 74 Years | 7 (63.6%) | 0 (0.0%) |
| 75 Years and over | 0 (0.0%) | 0 (0.0%) |
| Total | 44 (84.6%) | 0 (0.0%) |
Employment Status by Educational Attainment in Sun Valley
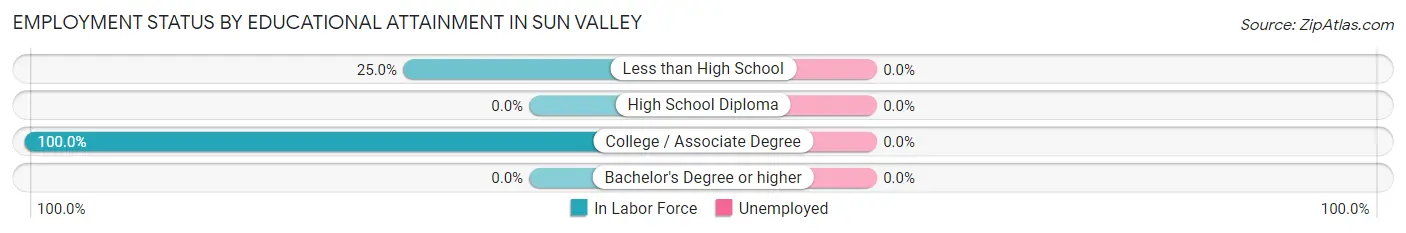
| Educational Attainment | In Labor Force | Unemployed |
| Less than High School | 1 (25.0%) | 0 (0.0%) |
| High School Diploma | 0 (0.0%) | 0 (0.0%) |
| College / Associate Degree | 27 (100.0%) | 0 (0.0%) |
| Bachelor's Degree or higher | 0 (0.0%) | 0 (0.0%) |
| Total | 28 (90.3%) | 0 (0.0%) |
Employment Occupations by Sex in Sun Valley
Management, Business, Science and Arts Occupations
The most common Management, Business, Science and Arts occupations in Sun Valley are Computers, Engineering & Science (7 | 15.9%), and Architecture & Engineering (7 | 15.9%).
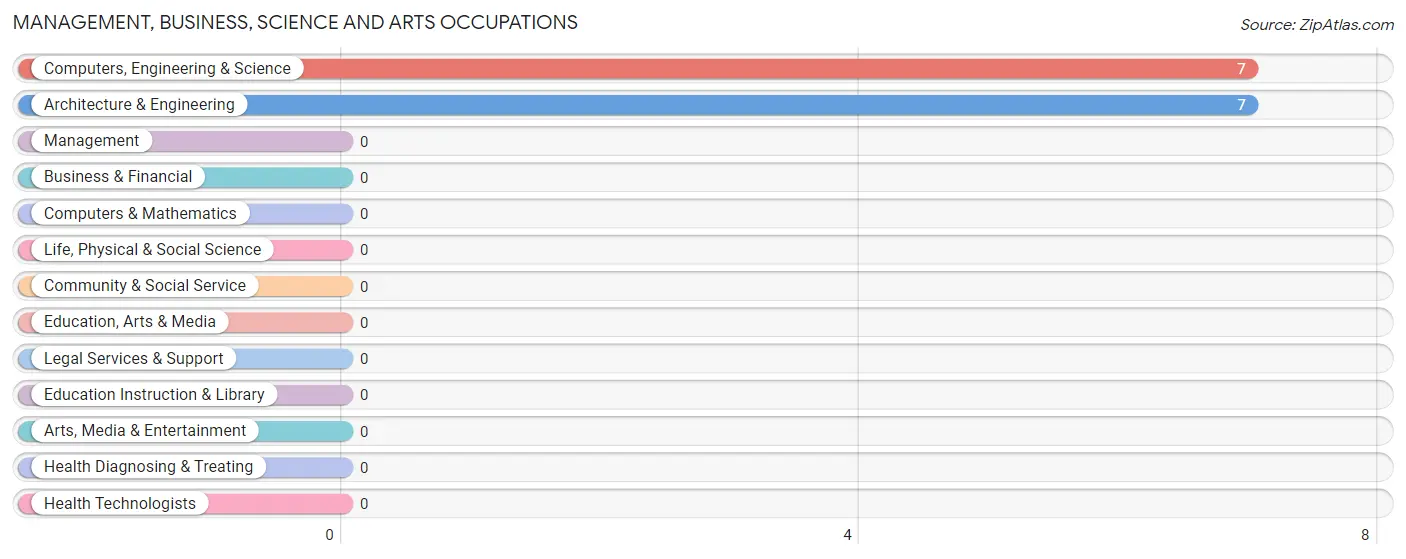
Management, Business, Science and Arts Occupations by Sex
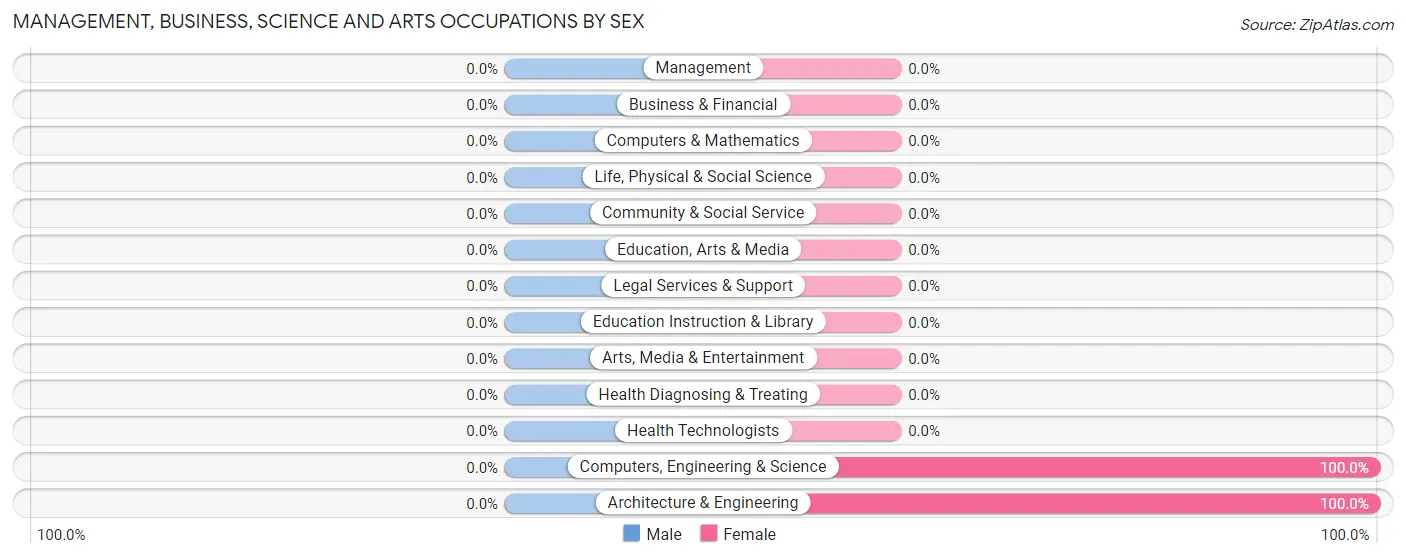
| Occupation | Male | Female |
| Management | 0 (0.0%) | 0 (0.0%) |
| Business & Financial | 0 (0.0%) | 0 (0.0%) |
| Computers, Engineering & Science | 0 (0.0%) | 7 (100.0%) |
| Computers & Mathematics | 0 (0.0%) | 0 (0.0%) |
| Architecture & Engineering | 0 (0.0%) | 7 (100.0%) |
| Life, Physical & Social Science | 0 (0.0%) | 0 (0.0%) |
| Community & Social Service | 0 (0.0%) | 0 (0.0%) |
| Education, Arts & Media | 0 (0.0%) | 0 (0.0%) |
| Legal Services & Support | 0 (0.0%) | 0 (0.0%) |
| Education Instruction & Library | 0 (0.0%) | 0 (0.0%) |
| Arts, Media & Entertainment | 0 (0.0%) | 0 (0.0%) |
| Health Diagnosing & Treating | 0 (0.0%) | 0 (0.0%) |
| Health Technologists | 0 (0.0%) | 0 (0.0%) |
| Total (Category) | 0 (0.0%) | 7 (100.0%) |
| Total (Overall) | 23 (52.3%) | 21 (47.7%) |
Services Occupations
The most common Services occupations in Sun Valley are Healthcare Support (12 | 27.3%), and Cleaning & Maintenance (10 | 22.7%).
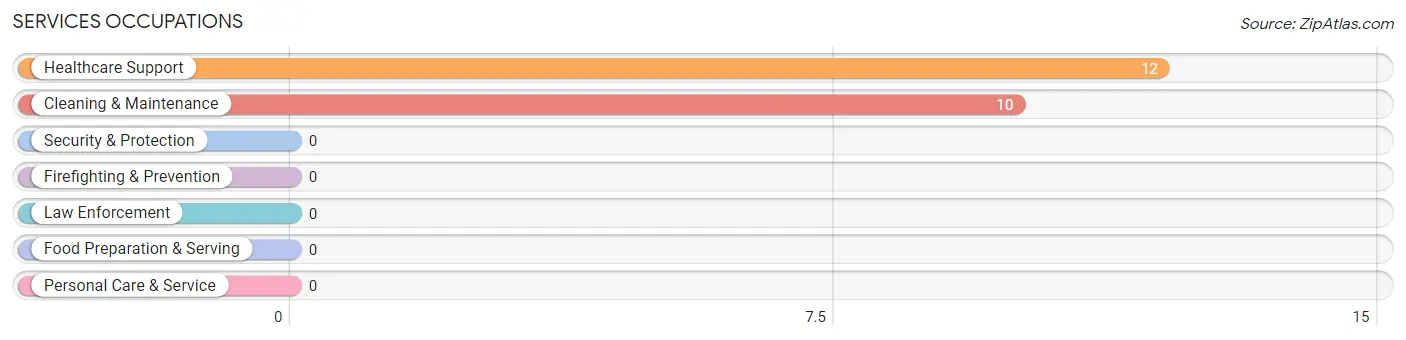
Services Occupations by Sex
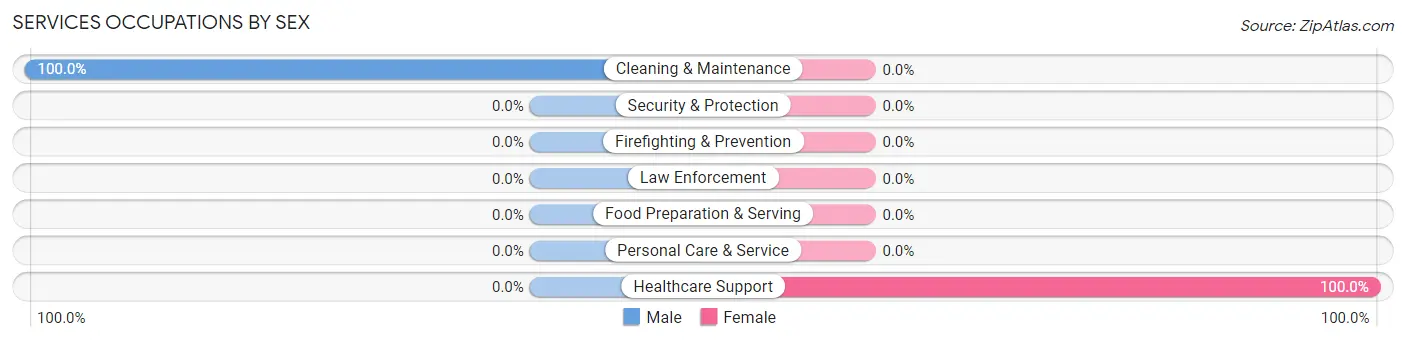
| Occupation | Male | Female |
| Healthcare Support | 0 (0.0%) | 12 (100.0%) |
| Security & Protection | 0 (0.0%) | 0 (0.0%) |
| Firefighting & Prevention | 0 (0.0%) | 0 (0.0%) |
| Law Enforcement | 0 (0.0%) | 0 (0.0%) |
| Food Preparation & Serving | 0 (0.0%) | 0 (0.0%) |
| Cleaning & Maintenance | 10 (100.0%) | 0 (0.0%) |
| Personal Care & Service | 0 (0.0%) | 0 (0.0%) |
| Total (Category) | 10 (45.5%) | 12 (54.5%) |
| Total (Overall) | 23 (52.3%) | 21 (47.7%) |
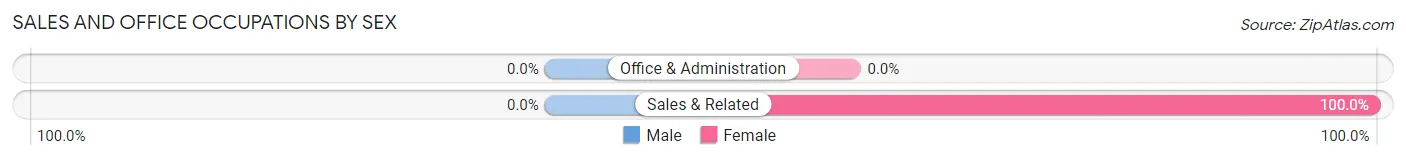
Sales and Office Occupations
The most common Sales and Office occupations in Sun Valley are , and Sales & Related (2 | 4.5%).
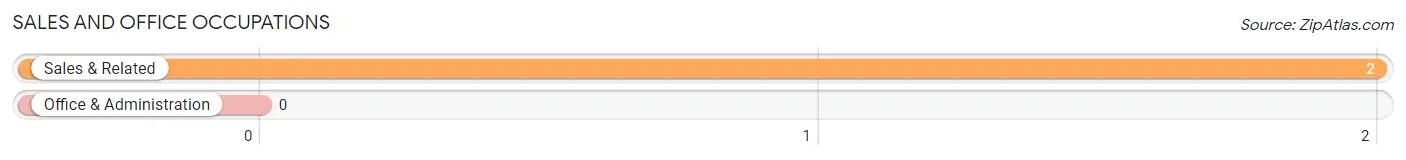
Sales and Office Occupations by Sex
| Occupation | Male | Female |
| Sales & Related | 0 (0.0%) | 2 (100.0%) |
| Office & Administration | 0 (0.0%) | 0 (0.0%) |
| Total (Category) | 0 (0.0%) | 2 (100.0%) |
| Total (Overall) | 23 (52.3%) | 21 (47.7%) |
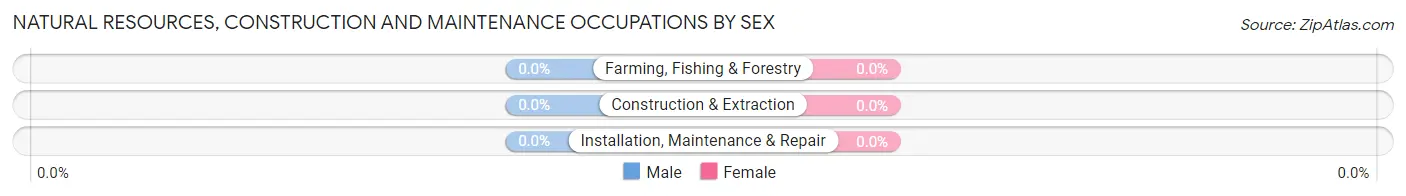
Natural Resources, Construction and Maintenance Occupations
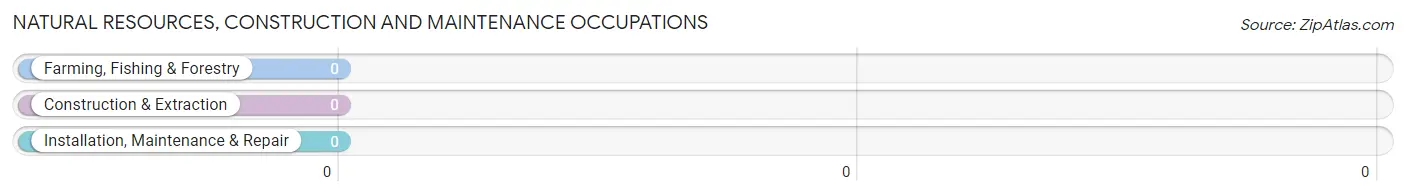
Natural Resources, Construction and Maintenance Occupations by Sex
| Occupation | Male | Female |
| Farming, Fishing & Forestry | 0 (0.0%) | 0 (0.0%) |
| Construction & Extraction | 0 (0.0%) | 0 (0.0%) |
| Installation, Maintenance & Repair | 0 (0.0%) | 0 (0.0%) |
| Total (Category) | 0 (0.0%) | 0 (0.0%) |
| Total (Overall) | 23 (52.3%) | 21 (47.7%) |
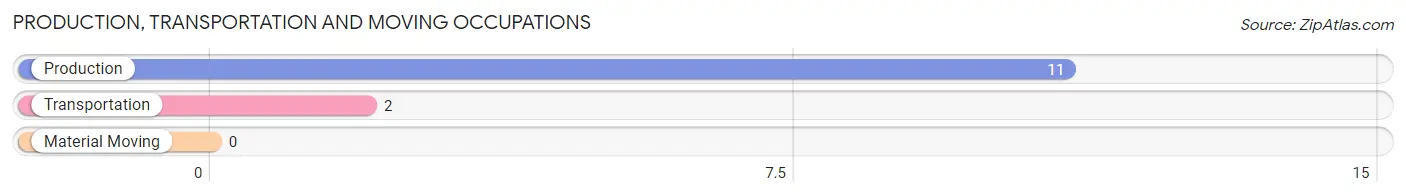
Production, Transportation and Moving Occupations
The most common Production, Transportation and Moving occupations in Sun Valley are Production (11 | 25.0%), and Transportation (2 | 4.5%).
Production, Transportation and Moving Occupations by Sex
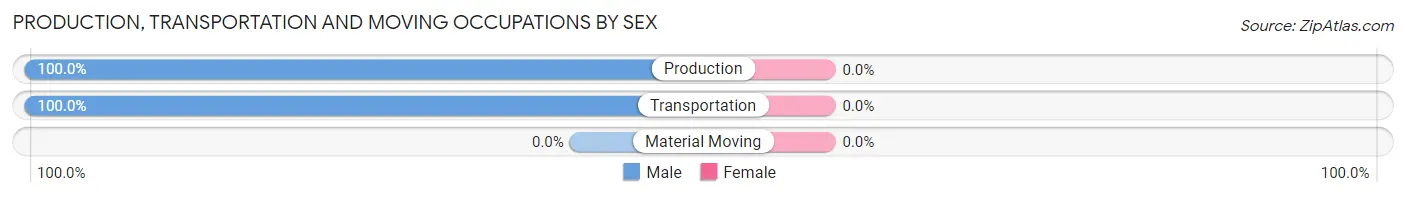
| Occupation | Male | Female |
| Production | 11 (100.0%) | 0 (0.0%) |
| Transportation | 2 (100.0%) | 0 (0.0%) |
| Material Moving | 0 (0.0%) | 0 (0.0%) |
| Total (Category) | 13 (100.0%) | 0 (0.0%) |
| Total (Overall) | 23 (52.3%) | 21 (47.7%) |
Employment Industries by Sex in Sun Valley
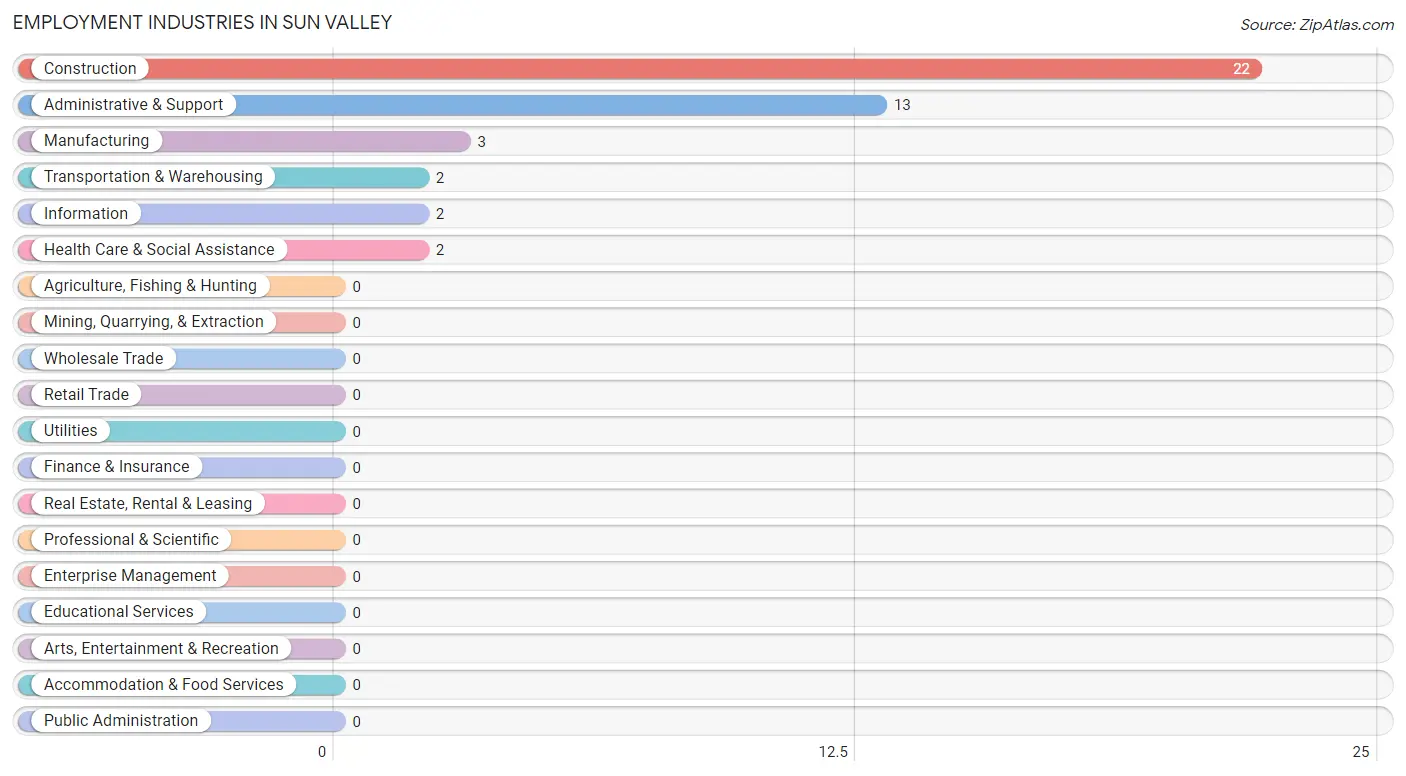
Employment Industries in Sun Valley
The major employment industries in Sun Valley include Construction (22 | 50.0%), Administrative & Support (13 | 29.5%), Manufacturing (3 | 6.8%), Transportation & Warehousing (2 | 4.5%), and Information (2 | 4.5%).
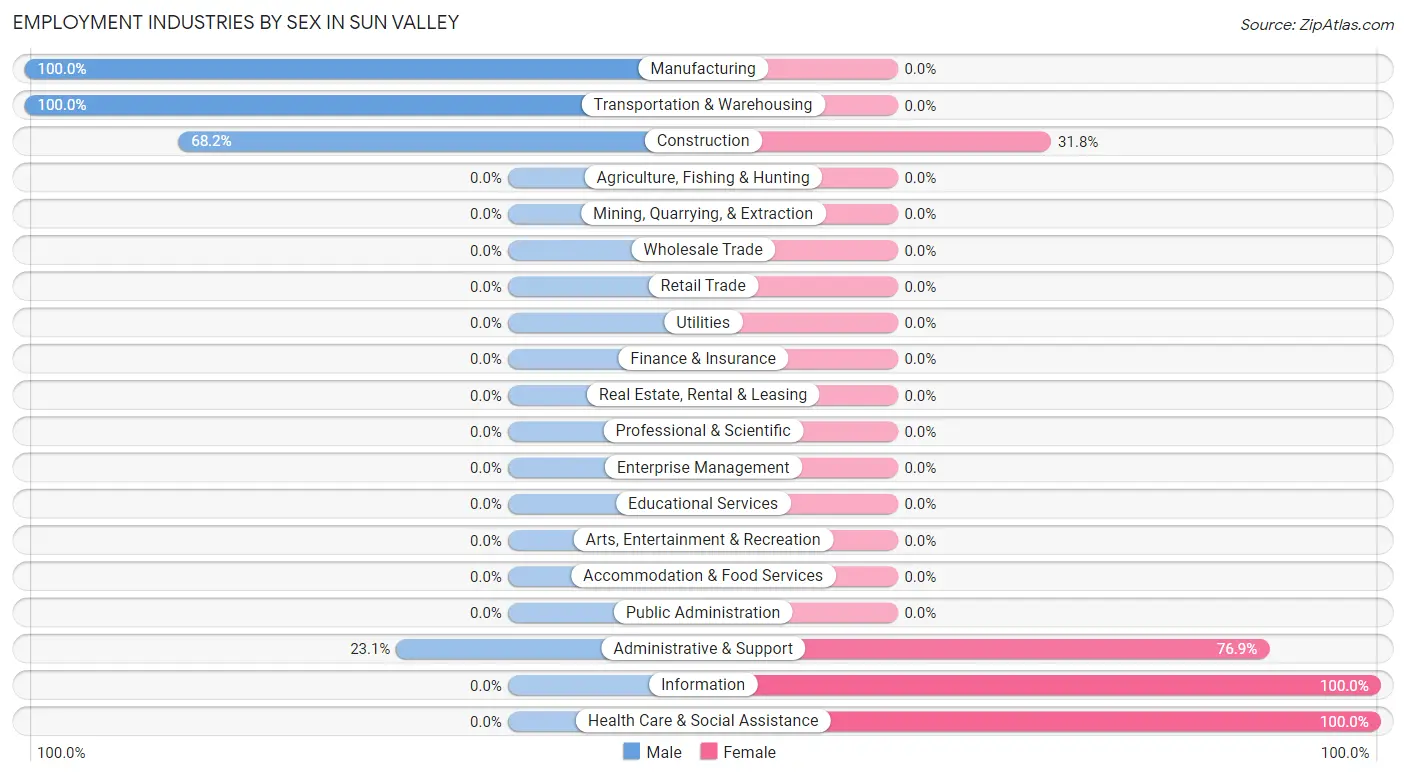
Employment Industries by Sex in Sun Valley
The Sun Valley industries that see more men than women are Manufacturing (100.0%), Transportation & Warehousing (100.0%), and Construction (68.2%), whereas the industries that tend to have a higher number of women are Information (100.0%), Health Care & Social Assistance (100.0%), and Administrative & Support (76.9%).
| Industry | Male | Female |
| Agriculture, Fishing & Hunting | 0 (0.0%) | 0 (0.0%) |
| Mining, Quarrying, & Extraction | 0 (0.0%) | 0 (0.0%) |
| Construction | 15 (68.2%) | 7 (31.8%) |
| Manufacturing | 3 (100.0%) | 0 (0.0%) |
| Wholesale Trade | 0 (0.0%) | 0 (0.0%) |
| Retail Trade | 0 (0.0%) | 0 (0.0%) |
| Transportation & Warehousing | 2 (100.0%) | 0 (0.0%) |
| Utilities | 0 (0.0%) | 0 (0.0%) |
| Information | 0 (0.0%) | 2 (100.0%) |
| Finance & Insurance | 0 (0.0%) | 0 (0.0%) |
| Real Estate, Rental & Leasing | 0 (0.0%) | 0 (0.0%) |
| Professional & Scientific | 0 (0.0%) | 0 (0.0%) |
| Enterprise Management | 0 (0.0%) | 0 (0.0%) |
| Administrative & Support | 3 (23.1%) | 10 (76.9%) |
| Educational Services | 0 (0.0%) | 0 (0.0%) |
| Health Care & Social Assistance | 0 (0.0%) | 2 (100.0%) |
| Arts, Entertainment & Recreation | 0 (0.0%) | 0 (0.0%) |
| Accommodation & Food Services | 0 (0.0%) | 0 (0.0%) |
| Public Administration | 0 (0.0%) | 0 (0.0%) |
| Total | 23 (52.3%) | 21 (47.7%) |
Education in Sun Valley
School Enrollment in Sun Valley
The most common levels of schooling among the 34 students in Sun Valley are elementary school (15 | 44.1%), college / undergraduate (10 | 29.4%), and middle school (8 | 23.5%).
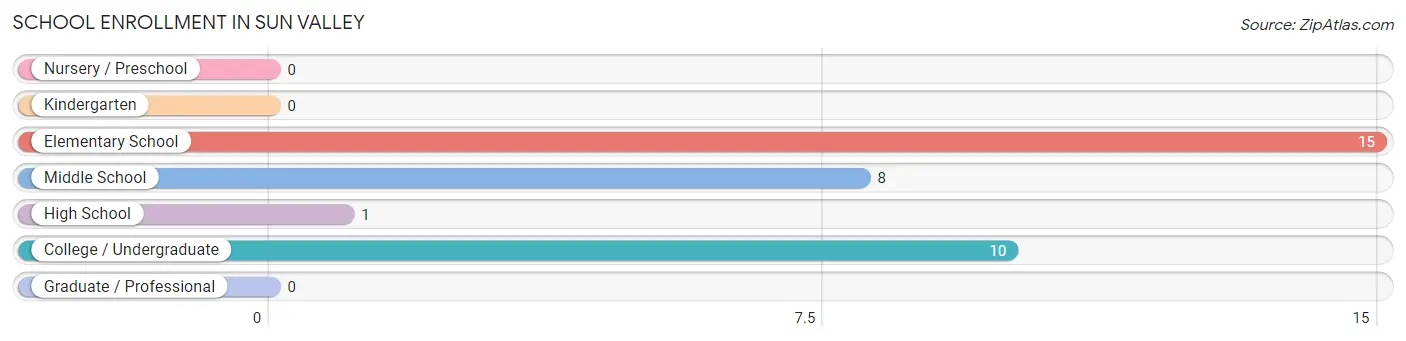
| School Level | # Students | % Students |
| Nursery / Preschool | 0 | 0.0% |
| Kindergarten | 0 | 0.0% |
| Elementary School | 15 | 44.1% |
| Middle School | 8 | 23.5% |
| High School | 1 | 2.9% |
| College / Undergraduate | 10 | 29.4% |
| Graduate / Professional | 0 | 0.0% |
| Total | 34 | 100.0% |
School Enrollment by Age by Funding Source in Sun Valley
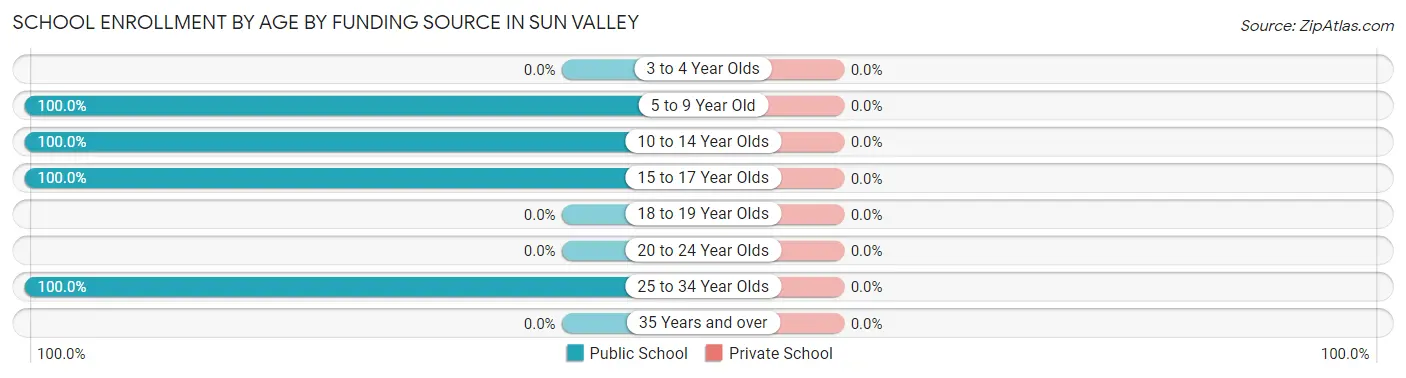
| Age Bracket | Public School | Private School |
| 3 to 4 Year Olds | 0 (0.0%) | 0 (0.0%) |
| 5 to 9 Year Old | 15 (100.0%) | 0 (0.0%) |
| 10 to 14 Year Olds | 8 (100.0%) | 0 (0.0%) |
| 15 to 17 Year Olds | 1 (100.0%) | 0 (0.0%) |
| 18 to 19 Year Olds | 0 (0.0%) | 0 (0.0%) |
| 20 to 24 Year Olds | 0 (0.0%) | 0 (0.0%) |
| 25 to 34 Year Olds | 10 (100.0%) | 0 (0.0%) |
| 35 Years and over | 0 (0.0%) | 0 (0.0%) |
| Total | 34 (100.0%) | 0 (0.0%) |
Educational Attainment by Field of Study in Sun Valley
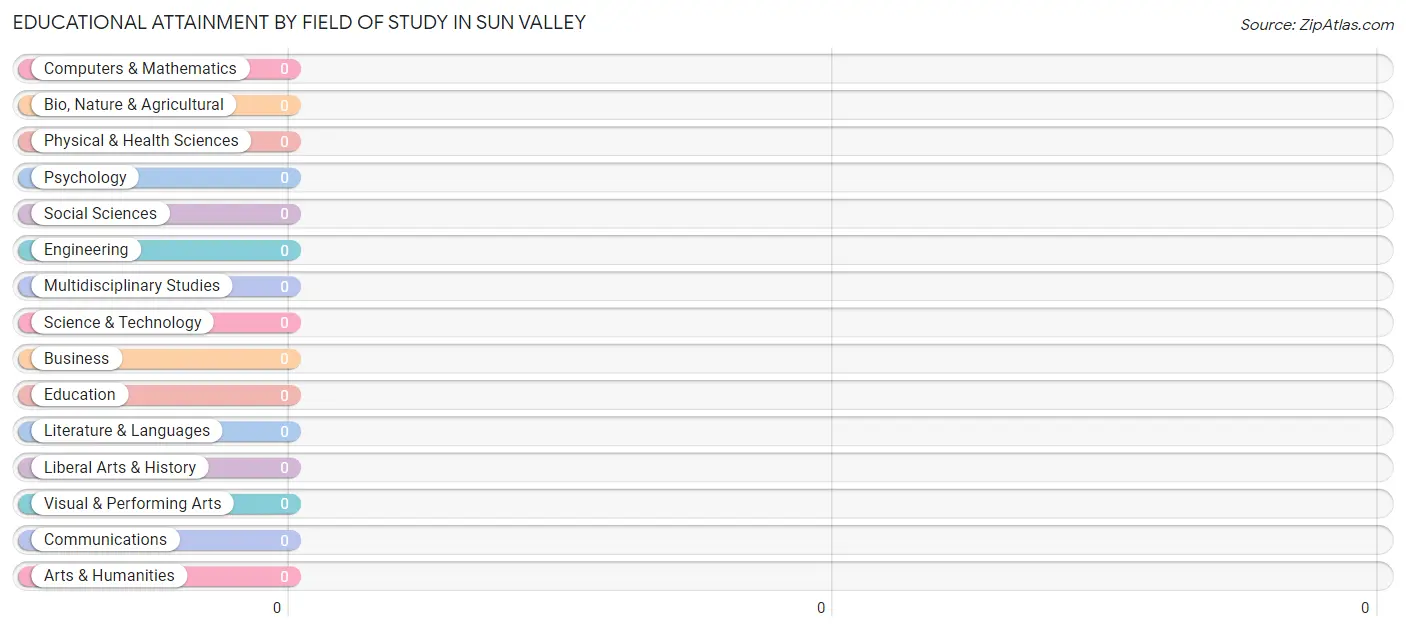
| Field of Study | # Graduates | % Graduates |
| Computers & Mathematics | 0 | 0.0% |
| Bio, Nature & Agricultural | 0 | 0.0% |
| Physical & Health Sciences | 0 | 0.0% |
| Psychology | 0 | 0.0% |
| Social Sciences | 0 | 0.0% |
| Engineering | 0 | 0.0% |
| Multidisciplinary Studies | 0 | 0.0% |
| Science & Technology | 0 | 0.0% |
| Business | 0 | 0.0% |
| Education | 0 | 0.0% |
| Literature & Languages | 0 | 0.0% |
| Liberal Arts & History | 0 | 0.0% |
| Visual & Performing Arts | 0 | 0.0% |
| Communications | 0 | 0.0% |
| Arts & Humanities | 0 | 0.0% |
| Total | 0 | 0.0% |
Transportation & Commute in Sun Valley
Vehicle Availability by Sex in Sun Valley
The most prevalent vehicle ownership categories in Sun Valley are males with 2 vehicles (9, accounting for 39.1%) and females with 2 vehicles (10, making up 42.9%).
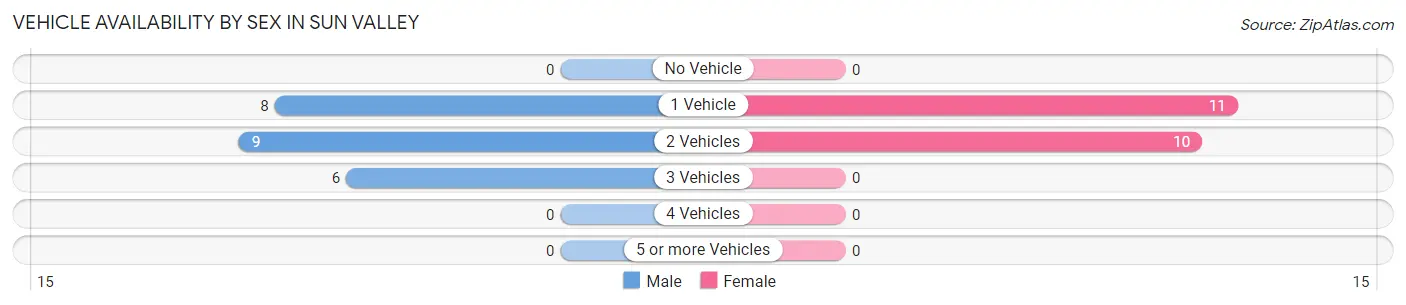
| Vehicles Available | Male | Female |
| No Vehicle | 0 (0.0%) | 0 (0.0%) |
| 1 Vehicle | 8 (34.8%) | 11 (52.4%) |
| 2 Vehicles | 9 (39.1%) | 10 (47.6%) |
| 3 Vehicles | 6 (26.1%) | 0 (0.0%) |
| 4 Vehicles | 0 (0.0%) | 0 (0.0%) |
| 5 or more Vehicles | 0 (0.0%) | 0 (0.0%) |
| Total | 23 (100.0%) | 21 (100.0%) |
Commute Time in Sun Valley
The most frequently occuring commute durations in Sun Valley are 15 to 19 minutes (13 commuters, 29.5%), 20 to 24 minutes (11 commuters, 25.0%), and 30 to 34 minutes (9 commuters, 20.4%).
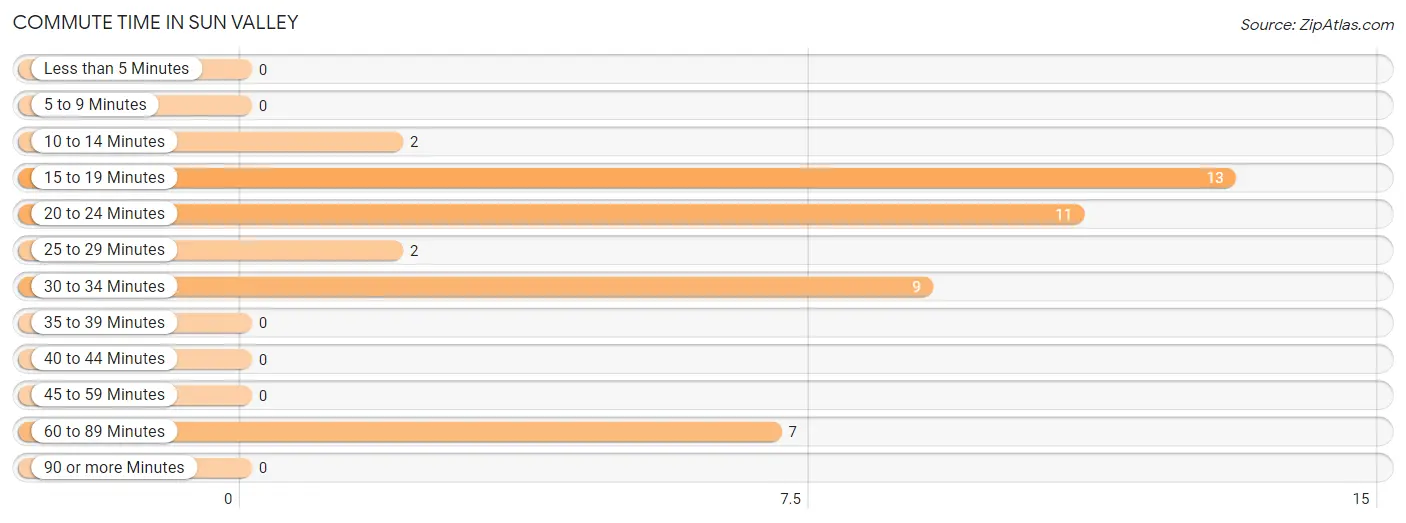
| Commute Time | # Commuters | % Commuters |
| Less than 5 Minutes | 0 | 0.0% |
| 5 to 9 Minutes | 0 | 0.0% |
| 10 to 14 Minutes | 2 | 4.5% |
| 15 to 19 Minutes | 13 | 29.5% |
| 20 to 24 Minutes | 11 | 25.0% |
| 25 to 29 Minutes | 2 | 4.5% |
| 30 to 34 Minutes | 9 | 20.4% |
| 35 to 39 Minutes | 0 | 0.0% |
| 40 to 44 Minutes | 0 | 0.0% |
| 45 to 59 Minutes | 0 | 0.0% |
| 60 to 89 Minutes | 7 | 15.9% |
| 90 or more Minutes | 0 | 0.0% |
Commute Time by Sex in Sun Valley
The most common commute times in Sun Valley are 20 to 24 minutes (11 commuters, 47.8%) for males and 15 to 19 minutes (12 commuters, 57.1%) for females.
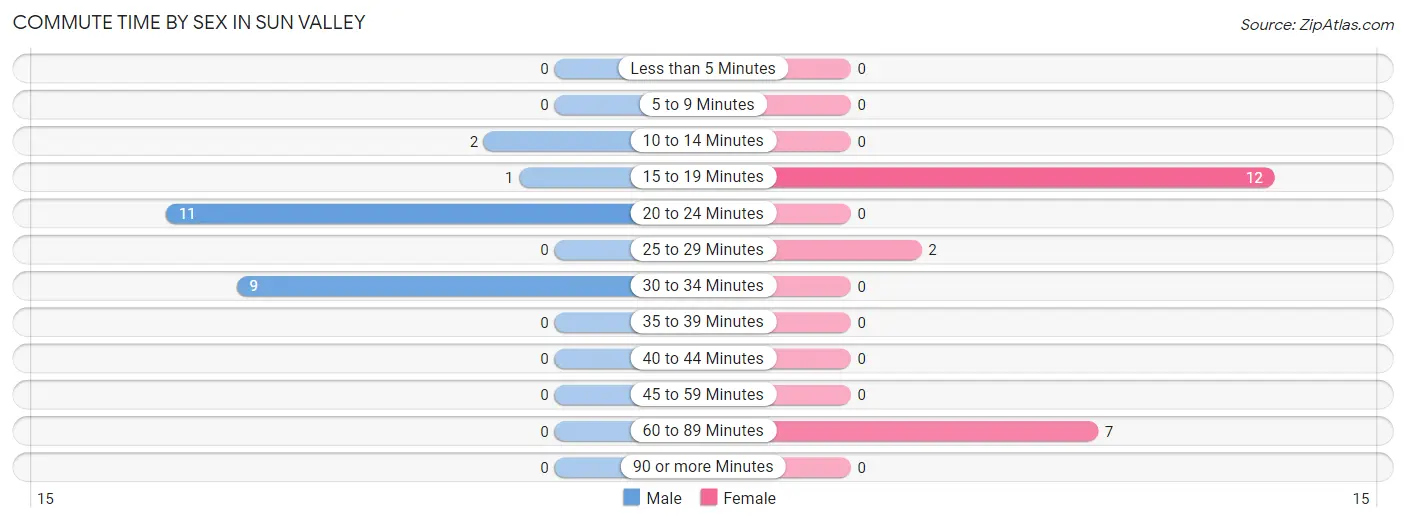
| Commute Time | Male | Female |
| Less than 5 Minutes | 0 (0.0%) | 0 (0.0%) |
| 5 to 9 Minutes | 0 (0.0%) | 0 (0.0%) |
| 10 to 14 Minutes | 2 (8.7%) | 0 (0.0%) |
| 15 to 19 Minutes | 1 (4.3%) | 12 (57.1%) |
| 20 to 24 Minutes | 11 (47.8%) | 0 (0.0%) |
| 25 to 29 Minutes | 0 (0.0%) | 2 (9.5%) |
| 30 to 34 Minutes | 9 (39.1%) | 0 (0.0%) |
| 35 to 39 Minutes | 0 (0.0%) | 0 (0.0%) |
| 40 to 44 Minutes | 0 (0.0%) | 0 (0.0%) |
| 45 to 59 Minutes | 0 (0.0%) | 0 (0.0%) |
| 60 to 89 Minutes | 0 (0.0%) | 7 (33.3%) |
| 90 or more Minutes | 0 (0.0%) | 0 (0.0%) |
Time of Departure to Work by Sex in Sun Valley
The most frequent times of departure to work in Sun Valley are 6:00 AM to 6:29 AM (9, 39.1%) for males and 11:00 AM to 11:59 AM (10, 47.6%) for females.
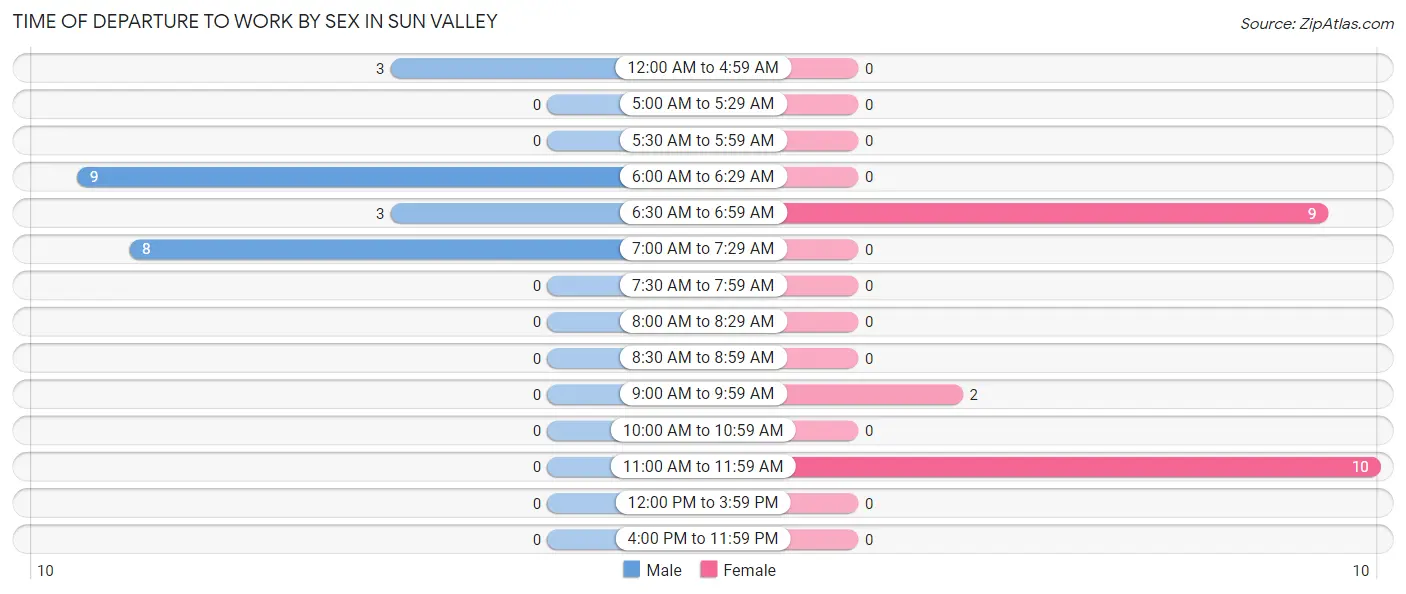
| Time of Departure | Male | Female |
| 12:00 AM to 4:59 AM | 3 (13.0%) | 0 (0.0%) |
| 5:00 AM to 5:29 AM | 0 (0.0%) | 0 (0.0%) |
| 5:30 AM to 5:59 AM | 0 (0.0%) | 0 (0.0%) |
| 6:00 AM to 6:29 AM | 9 (39.1%) | 0 (0.0%) |
| 6:30 AM to 6:59 AM | 3 (13.0%) | 9 (42.9%) |
| 7:00 AM to 7:29 AM | 8 (34.8%) | 0 (0.0%) |
| 7:30 AM to 7:59 AM | 0 (0.0%) | 0 (0.0%) |
| 8:00 AM to 8:29 AM | 0 (0.0%) | 0 (0.0%) |
| 8:30 AM to 8:59 AM | 0 (0.0%) | 0 (0.0%) |
| 9:00 AM to 9:59 AM | 0 (0.0%) | 2 (9.5%) |
| 10:00 AM to 10:59 AM | 0 (0.0%) | 0 (0.0%) |
| 11:00 AM to 11:59 AM | 0 (0.0%) | 10 (47.6%) |
| 12:00 PM to 3:59 PM | 0 (0.0%) | 0 (0.0%) |
| 4:00 PM to 11:59 PM | 0 (0.0%) | 0 (0.0%) |
| Total | 23 (100.0%) | 21 (100.0%) |
Housing Occupancy in Sun Valley
Occupancy by Ownership in Sun Valley
Of the total 32 dwellings in Sun Valley, owner-occupied units account for 10 (31.2%), while renter-occupied units make up 22 (68.8%).
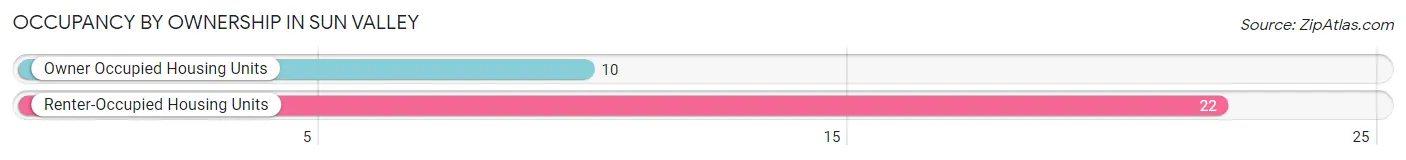
| Occupancy | # Housing Units | % Housing Units |
| Owner Occupied Housing Units | 10 | 31.2% |
| Renter-Occupied Housing Units | 22 | 68.8% |
| Total Occupied Housing Units | 32 | 100.0% |
Occupancy by Household Size in Sun Valley
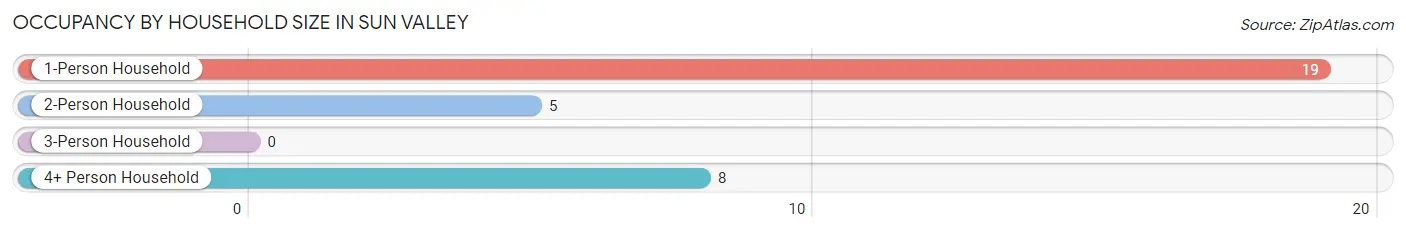
| Household Size | # Housing Units | % Housing Units |
| 1-Person Household | 19 | 59.4% |
| 2-Person Household | 5 | 15.6% |
| 3-Person Household | 0 | 0.0% |
| 4+ Person Household | 8 | 25.0% |
| Total Housing Units | 32 | 100.0% |
Occupancy by Ownership by Household Size in Sun Valley
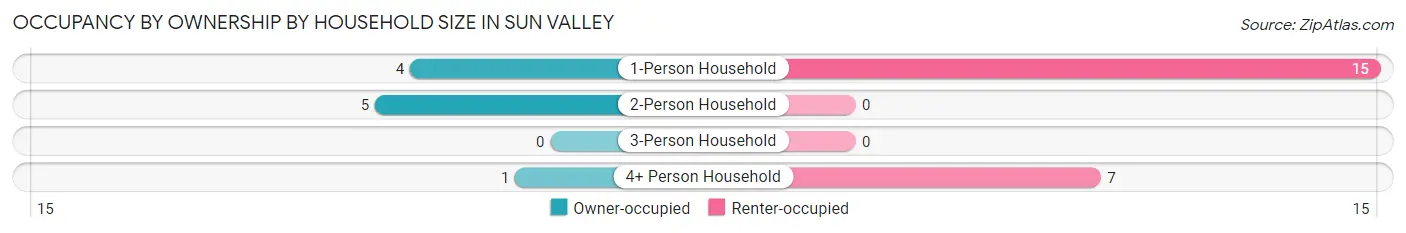
| Household Size | Owner-occupied | Renter-occupied |
| 1-Person Household | 4 (21.0%) | 15 (78.9%) |
| 2-Person Household | 5 (100.0%) | 0 (0.0%) |
| 3-Person Household | 0 (0.0%) | 0 (0.0%) |
| 4+ Person Household | 1 (12.5%) | 7 (87.5%) |
| Total Housing Units | 10 (31.2%) | 22 (68.8%) |
Occupancy by Educational Attainment in Sun Valley
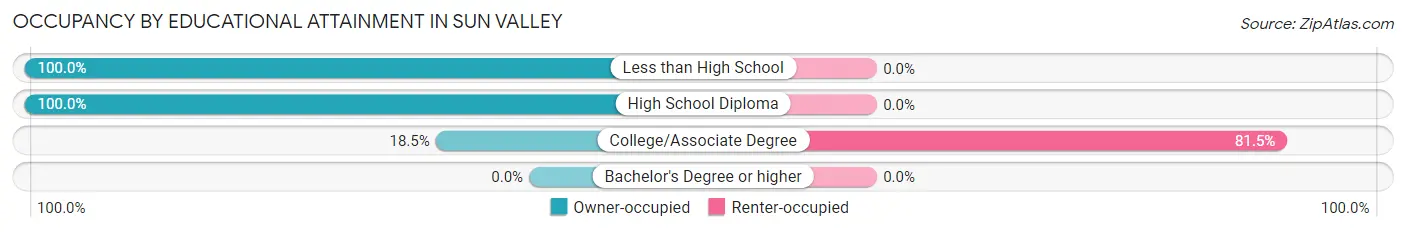
| Household Size | Owner-occupied | Renter-occupied |
| Less than High School | 1 (100.0%) | 0 (0.0%) |
| High School Diploma | 4 (100.0%) | 0 (0.0%) |
| College/Associate Degree | 5 (18.5%) | 22 (81.5%) |
| Bachelor's Degree or higher | 0 (0.0%) | 0 (0.0%) |
Occupancy by Age of Householder in Sun Valley
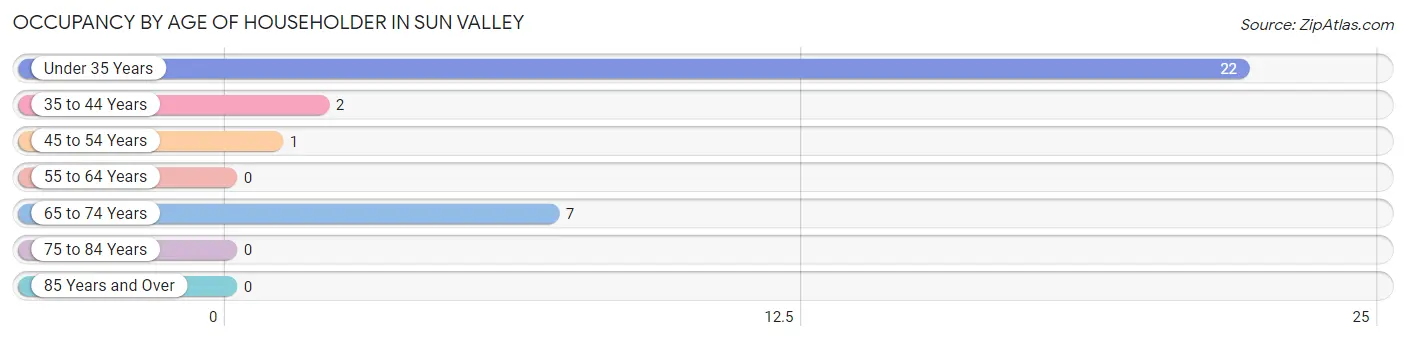
| Age Bracket | # Households | % Households |
| Under 35 Years | 22 | 68.8% |
| 35 to 44 Years | 2 | 6.2% |
| 45 to 54 Years | 1 | 3.1% |
| 55 to 64 Years | 0 | 0.0% |
| 65 to 74 Years | 7 | 21.9% |
| 75 to 84 Years | 0 | 0.0% |
| 85 Years and Over | 0 | 0.0% |
| Total | 32 | 100.0% |
Housing Finances in Sun Valley
Median Income by Occupancy in Sun Valley
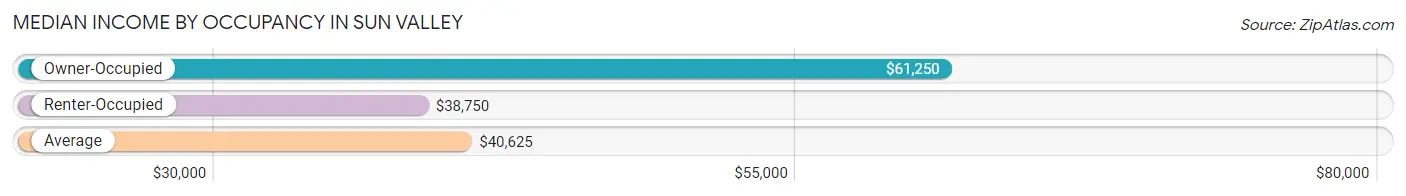
| Occupancy Type | # Households | Median Income |
| Owner-Occupied | 10 (31.2%) | $61,250 |
| Renter-Occupied | 22 (68.8%) | $38,750 |
| Average | 32 (100.0%) | $40,625 |
Occupancy by Householder Income Bracket in Sun Valley
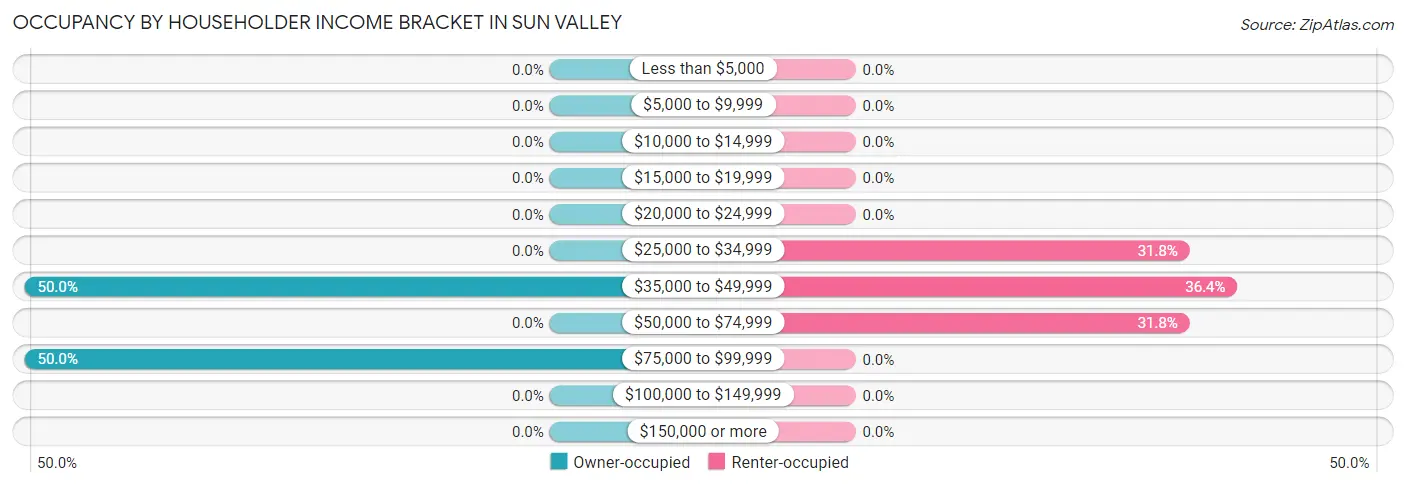
| Income Bracket | Owner-occupied | Renter-occupied |
| Less than $5,000 | 0 (0.0%) | 0 (0.0%) |
| $5,000 to $9,999 | 0 (0.0%) | 0 (0.0%) |
| $10,000 to $14,999 | 0 (0.0%) | 0 (0.0%) |
| $15,000 to $19,999 | 0 (0.0%) | 0 (0.0%) |
| $20,000 to $24,999 | 0 (0.0%) | 0 (0.0%) |
| $25,000 to $34,999 | 0 (0.0%) | 7 (31.8%) |
| $35,000 to $49,999 | 5 (50.0%) | 8 (36.4%) |
| $50,000 to $74,999 | 0 (0.0%) | 7 (31.8%) |
| $75,000 to $99,999 | 5 (50.0%) | 0 (0.0%) |
| $100,000 to $149,999 | 0 (0.0%) | 0 (0.0%) |
| $150,000 or more | 0 (0.0%) | 0 (0.0%) |
| Total | 10 (100.0%) | 22 (100.0%) |
Monthly Housing Cost Tiers in Sun Valley
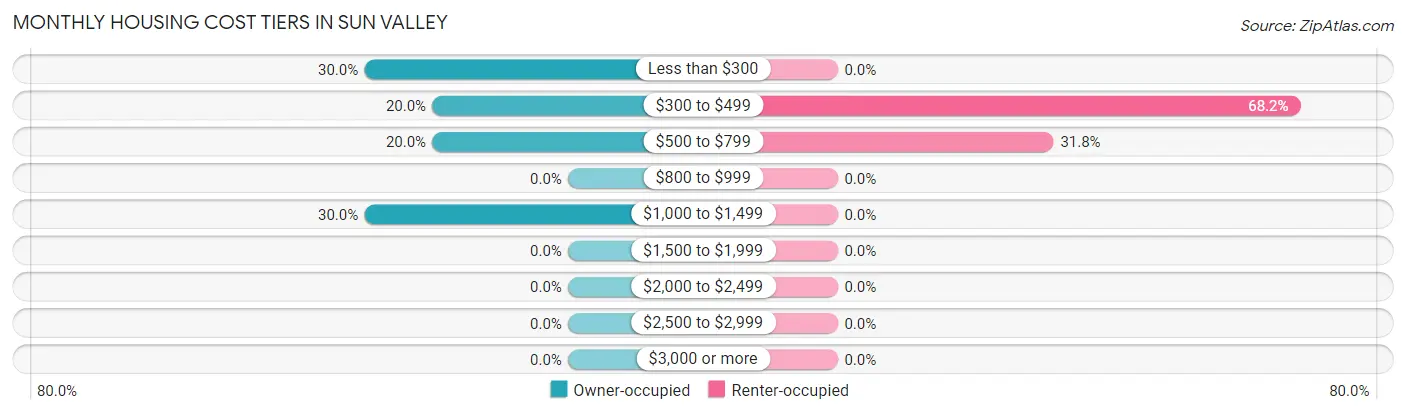
| Monthly Cost | Owner-occupied | Renter-occupied |
| Less than $300 | 3 (30.0%) | 0 (0.0%) |
| $300 to $499 | 2 (20.0%) | 15 (68.2%) |
| $500 to $799 | 2 (20.0%) | 7 (31.8%) |
| $800 to $999 | 0 (0.0%) | 0 (0.0%) |
| $1,000 to $1,499 | 3 (30.0%) | 0 (0.0%) |
| $1,500 to $1,999 | 0 (0.0%) | 0 (0.0%) |
| $2,000 to $2,499 | 0 (0.0%) | 0 (0.0%) |
| $2,500 to $2,999 | 0 (0.0%) | 0 (0.0%) |
| $3,000 or more | 0 (0.0%) | 0 (0.0%) |
| Total | 10 (100.0%) | 22 (100.0%) |
Physical Housing Characteristics in Sun Valley
Housing Structures in Sun Valley
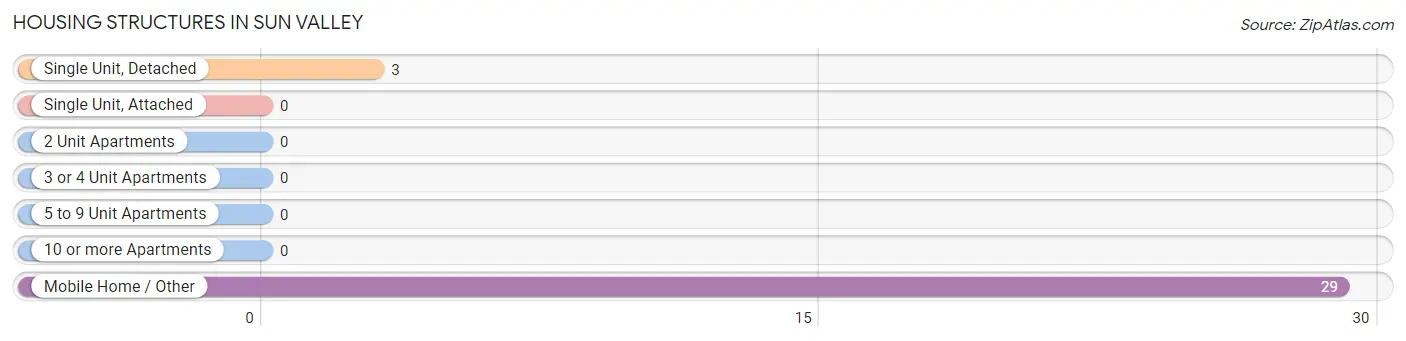
| Structure Type | # Housing Units | % Housing Units |
| Single Unit, Detached | 3 | 9.4% |
| Single Unit, Attached | 0 | 0.0% |
| 2 Unit Apartments | 0 | 0.0% |
| 3 or 4 Unit Apartments | 0 | 0.0% |
| 5 to 9 Unit Apartments | 0 | 0.0% |
| 10 or more Apartments | 0 | 0.0% |
| Mobile Home / Other | 29 | 90.6% |
| Total | 32 | 100.0% |
Housing Structures by Occupancy in Sun Valley
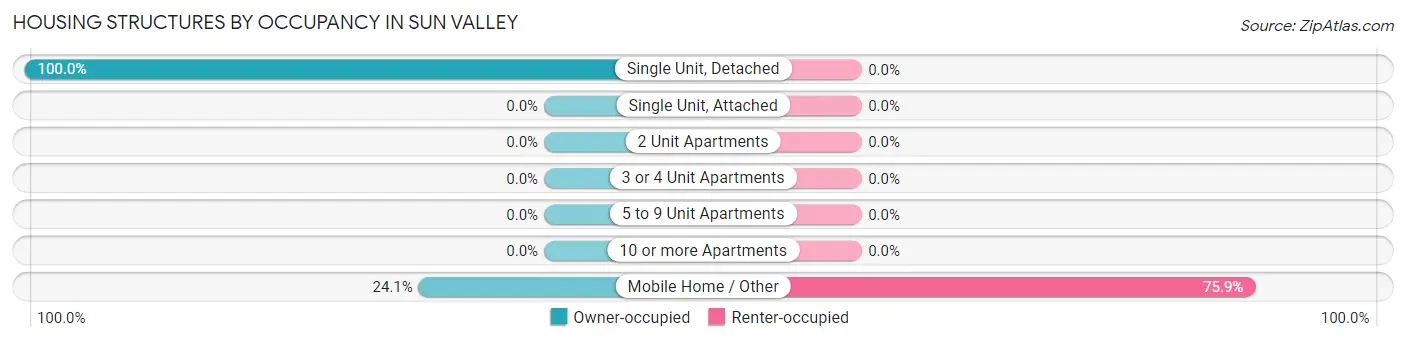
| Structure Type | Owner-occupied | Renter-occupied |
| Single Unit, Detached | 3 (100.0%) | 0 (0.0%) |
| Single Unit, Attached | 0 (0.0%) | 0 (0.0%) |
| 2 Unit Apartments | 0 (0.0%) | 0 (0.0%) |
| 3 or 4 Unit Apartments | 0 (0.0%) | 0 (0.0%) |
| 5 to 9 Unit Apartments | 0 (0.0%) | 0 (0.0%) |
| 10 or more Apartments | 0 (0.0%) | 0 (0.0%) |
| Mobile Home / Other | 7 (24.1%) | 22 (75.9%) |
| Total | 10 (31.2%) | 22 (68.8%) |
Housing Structures by Number of Rooms in Sun Valley
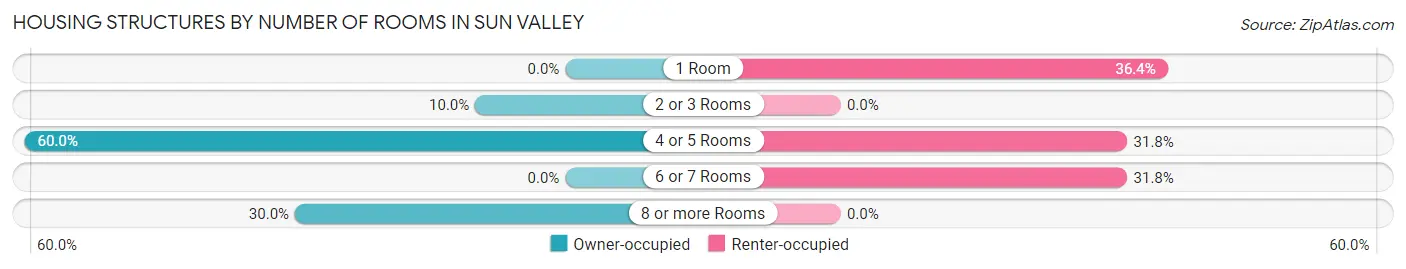
| Number of Rooms | Owner-occupied | Renter-occupied |
| 1 Room | 0 (0.0%) | 8 (36.4%) |
| 2 or 3 Rooms | 1 (10.0%) | 0 (0.0%) |
| 4 or 5 Rooms | 6 (60.0%) | 7 (31.8%) |
| 6 or 7 Rooms | 0 (0.0%) | 7 (31.8%) |
| 8 or more Rooms | 3 (30.0%) | 0 (0.0%) |
| Total | 10 (100.0%) | 22 (100.0%) |
Housing Structure by Heating Type in Sun Valley
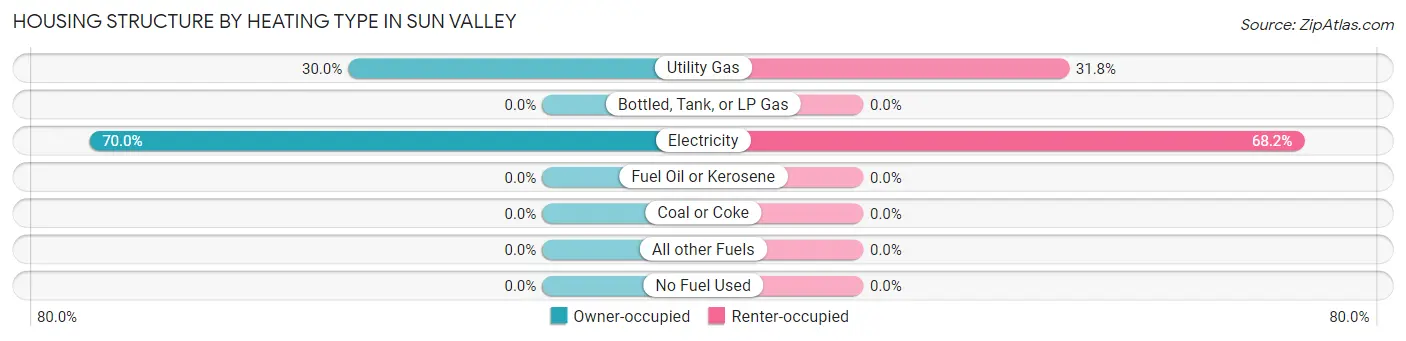
| Heating Type | Owner-occupied | Renter-occupied |
| Utility Gas | 3 (30.0%) | 7 (31.8%) |
| Bottled, Tank, or LP Gas | 0 (0.0%) | 0 (0.0%) |
| Electricity | 7 (70.0%) | 15 (68.2%) |
| Fuel Oil or Kerosene | 0 (0.0%) | 0 (0.0%) |
| Coal or Coke | 0 (0.0%) | 0 (0.0%) |
| All other Fuels | 0 (0.0%) | 0 (0.0%) |
| No Fuel Used | 0 (0.0%) | 0 (0.0%) |
| Total | 10 (100.0%) | 22 (100.0%) |
Household Vehicle Usage in Sun Valley
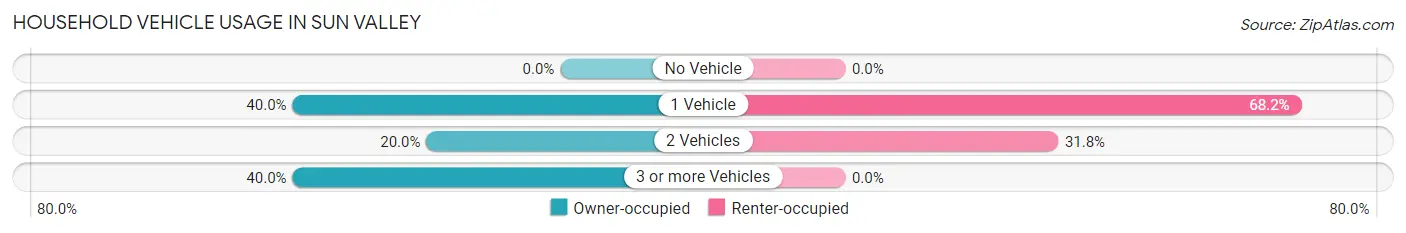
| Vehicles per Household | Owner-occupied | Renter-occupied |
| No Vehicle | 0 (0.0%) | 0 (0.0%) |
| 1 Vehicle | 4 (40.0%) | 15 (68.2%) |
| 2 Vehicles | 2 (20.0%) | 7 (31.8%) |
| 3 or more Vehicles | 4 (40.0%) | 0 (0.0%) |
| Total | 10 (100.0%) | 22 (100.0%) |
Real Estate & Mortgages in Sun Valley
Real Estate and Mortgage Overview in Sun Valley
| Characteristic | Without Mortgage | With Mortgage |
| Housing Units | 8 | 2 |
| Median Property Value | - | - |
| Median Household Income | $75,833 | $0 |
| Monthly Housing Costs | - | - |
| Real Estate Taxes | - | - |
Property Value by Mortgage Status in Sun Valley
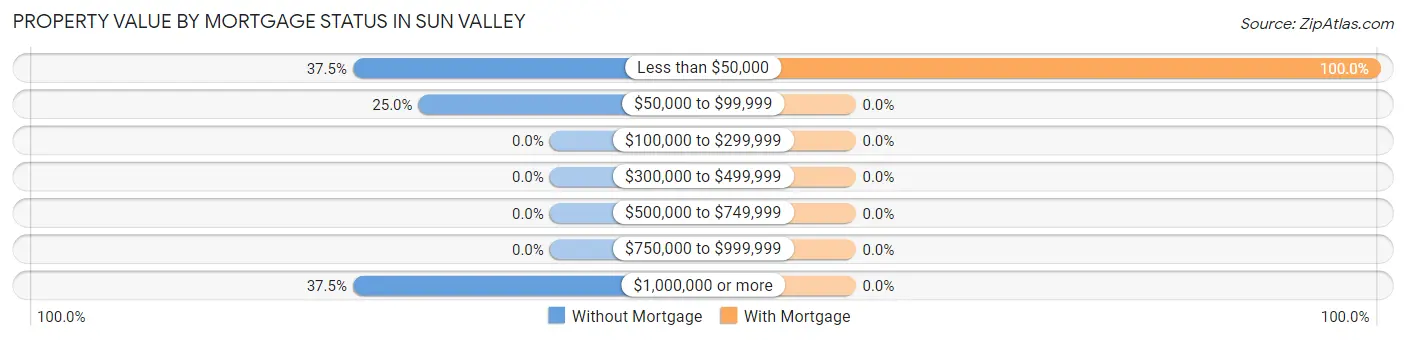
| Property Value | Without Mortgage | With Mortgage |
| Less than $50,000 | 3 (37.5%) | 2 (100.0%) |
| $50,000 to $99,999 | 2 (25.0%) | 0 (0.0%) |
| $100,000 to $299,999 | 0 (0.0%) | 0 (0.0%) |
| $300,000 to $499,999 | 0 (0.0%) | 0 (0.0%) |
| $500,000 to $749,999 | 0 (0.0%) | 0 (0.0%) |
| $750,000 to $999,999 | 0 (0.0%) | 0 (0.0%) |
| $1,000,000 or more | 3 (37.5%) | 0 (0.0%) |
| Total | 8 (100.0%) | 2 (100.0%) |
Household Income by Mortgage Status in Sun Valley
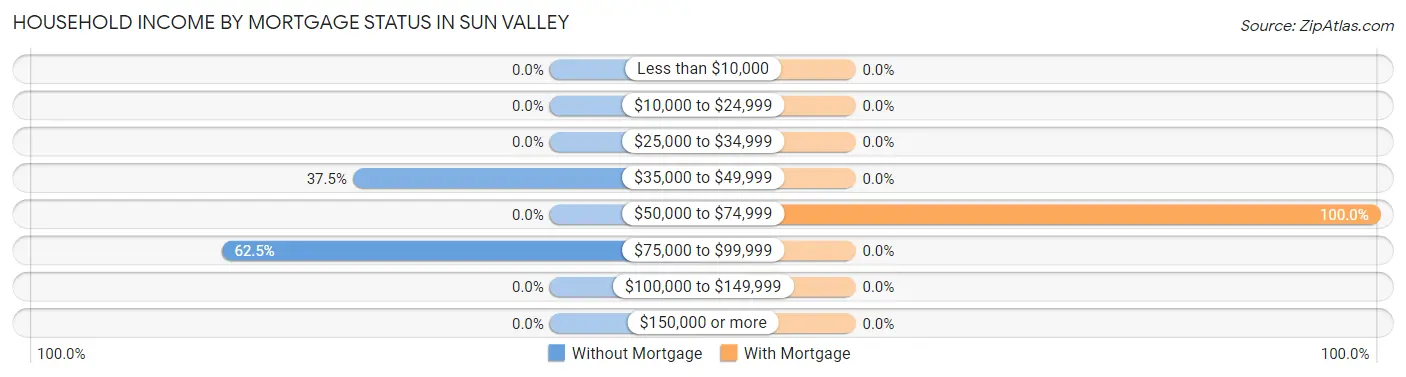
| Household Income | Without Mortgage | With Mortgage |
| Less than $10,000 | 0 (0.0%) | 0 (0.0%) |
| $10,000 to $24,999 | 0 (0.0%) | 0 (0.0%) |
| $25,000 to $34,999 | 0 (0.0%) | 0 (0.0%) |
| $35,000 to $49,999 | 3 (37.5%) | 0 (0.0%) |
| $50,000 to $74,999 | 0 (0.0%) | 2 (100.0%) |
| $75,000 to $99,999 | 5 (62.5%) | 0 (0.0%) |
| $100,000 to $149,999 | 0 (0.0%) | 0 (0.0%) |
| $150,000 or more | 0 (0.0%) | 0 (0.0%) |
| Total | 8 (100.0%) | 2 (100.0%) |
Property Value to Household Income Ratio in Sun Valley
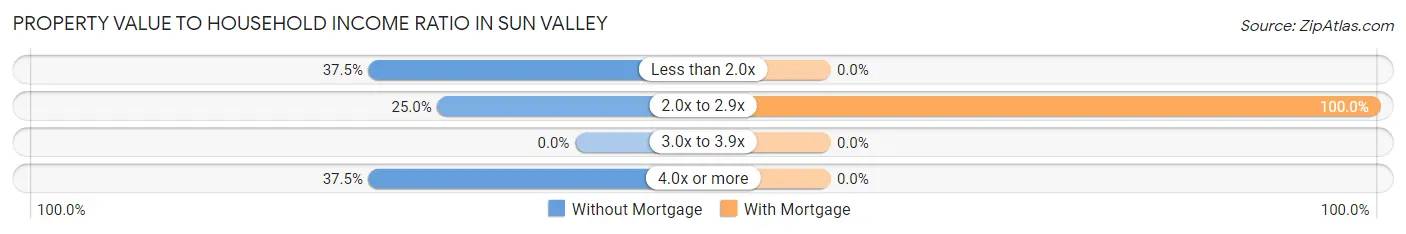
| Value-to-Income Ratio | Without Mortgage | With Mortgage |
| Less than 2.0x | 3 (37.5%) | 0 (0.0%) |
| 2.0x to 2.9x | 2 (25.0%) | 2 (100.0%) |
| 3.0x to 3.9x | 0 (0.0%) | 0 (0.0%) |
| 4.0x or more | 3 (37.5%) | 0 (0.0%) |
| Total | 8 (100.0%) | 2 (100.0%) |
Real Estate Taxes by Mortgage Status in Sun Valley
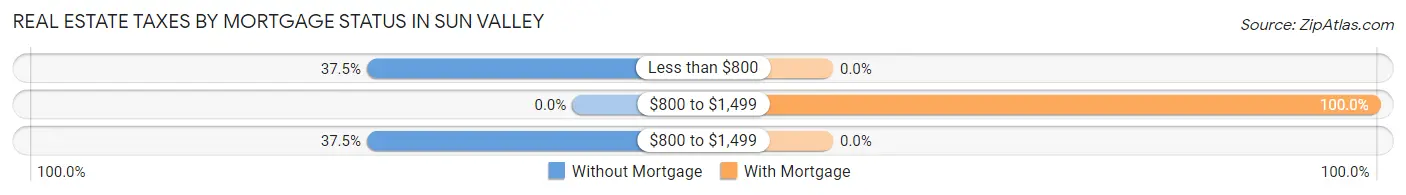
| Property Taxes | Without Mortgage | With Mortgage |
| Less than $800 | 3 (37.5%) | 0 (0.0%) |
| $800 to $1,499 | 0 (0.0%) | 2 (100.0%) |
| $800 to $1,499 | 3 (37.5%) | 0 (0.0%) |
| Total | 8 (100.0%) | 2 (100.0%) |
Health & Disability in Sun Valley
Health Insurance Coverage by Age in Sun Valley
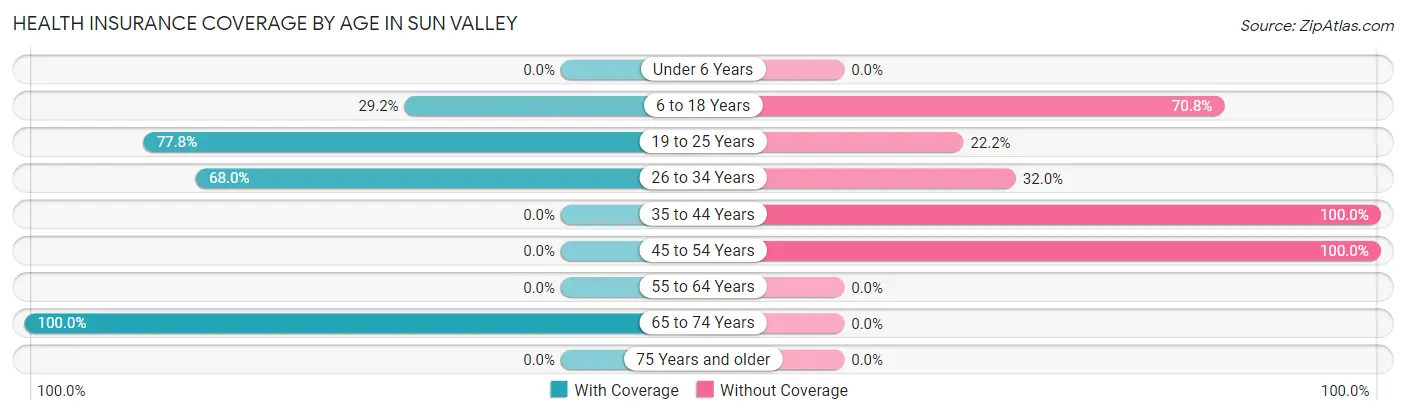
| Age Bracket | With Coverage | Without Coverage |
| Under 6 Years | 0 (0.0%) | 0 (0.0%) |
| 6 to 18 Years | 7 (29.2%) | 17 (70.8%) |
| 19 to 25 Years | 7 (77.8%) | 2 (22.2%) |
| 26 to 34 Years | 17 (68.0%) | 8 (32.0%) |
| 35 to 44 Years | 0 (0.0%) | 5 (100.0%) |
| 45 to 54 Years | 0 (0.0%) | 1 (100.0%) |
| 55 to 64 Years | 0 (0.0%) | 0 (0.0%) |
| 65 to 74 Years | 11 (100.0%) | 0 (0.0%) |
| 75 Years and older | 0 (0.0%) | 0 (0.0%) |
| Total | 42 (56.0%) | 33 (44.0%) |
Health Insurance Coverage by Citizenship Status in Sun Valley
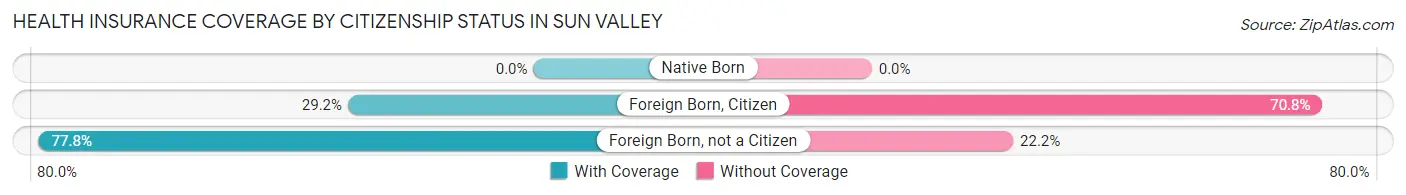
| Citizenship Status | With Coverage | Without Coverage |
| Native Born | 0 (0.0%) | 0 (0.0%) |
| Foreign Born, Citizen | 7 (29.2%) | 17 (70.8%) |
| Foreign Born, not a Citizen | 7 (77.8%) | 2 (22.2%) |
Health Insurance Coverage by Household Income in Sun Valley
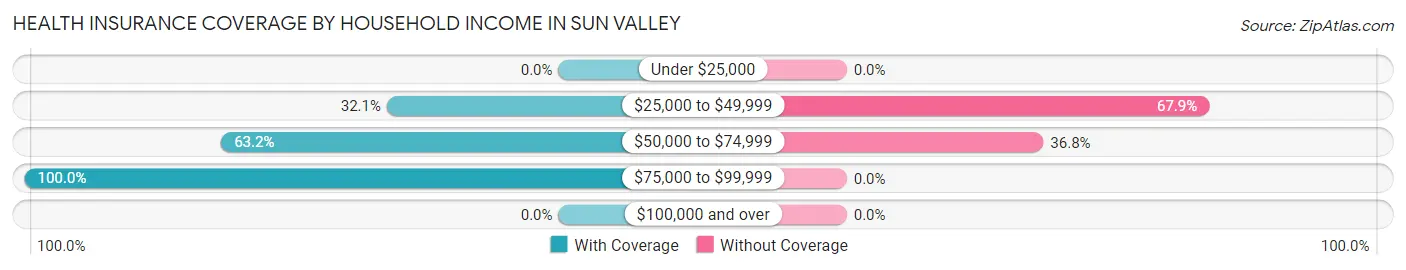
| Household Income | With Coverage | Without Coverage |
| Under $25,000 | 0 (0.0%) | 0 (0.0%) |
| $25,000 to $49,999 | 9 (32.1%) | 19 (67.9%) |
| $50,000 to $74,999 | 24 (63.2%) | 14 (36.8%) |
| $75,000 to $99,999 | 9 (100.0%) | 0 (0.0%) |
| $100,000 and over | 0 (0.0%) | 0 (0.0%) |
Public vs Private Health Insurance Coverage by Age in Sun Valley
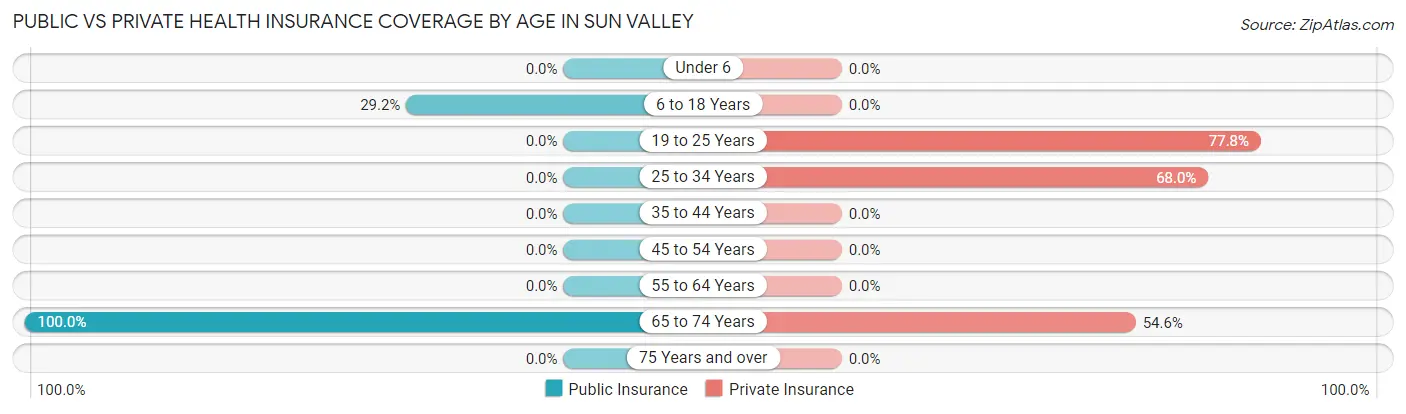
| Age Bracket | Public Insurance | Private Insurance |
| Under 6 | 0 (0.0%) | 0 (0.0%) |
| 6 to 18 Years | 7 (29.2%) | 0 (0.0%) |
| 19 to 25 Years | 0 (0.0%) | 7 (77.8%) |
| 25 to 34 Years | 0 (0.0%) | 17 (68.0%) |
| 35 to 44 Years | 0 (0.0%) | 0 (0.0%) |
| 45 to 54 Years | 0 (0.0%) | 0 (0.0%) |
| 55 to 64 Years | 0 (0.0%) | 0 (0.0%) |
| 65 to 74 Years | 11 (100.0%) | 6 (54.5%) |
| 75 Years and over | 0 (0.0%) | 0 (0.0%) |
| Total | 18 (24.0%) | 30 (40.0%) |
Disability Status by Sex by Age in Sun Valley
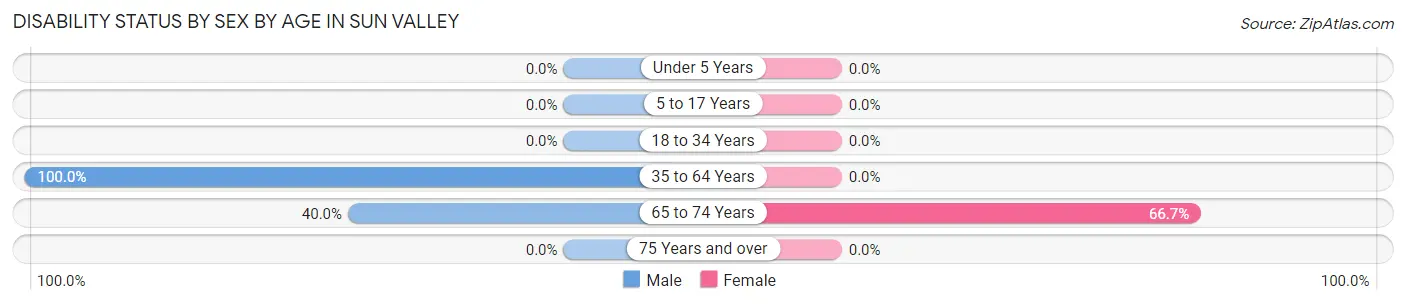
| Age Bracket | Male | Female |
| Under 5 Years | 0 (0.0%) | 0 (0.0%) |
| 5 to 17 Years | 0 (0.0%) | 0 (0.0%) |
| 18 to 34 Years | 0 (0.0%) | 0 (0.0%) |
| 35 to 64 Years | 1 (100.0%) | 0 (0.0%) |
| 65 to 74 Years | 2 (40.0%) | 4 (66.7%) |
| 75 Years and over | 0 (0.0%) | 0 (0.0%) |
Disability Class by Sex by Age in Sun Valley
Disability Class: Hearing Difficulty
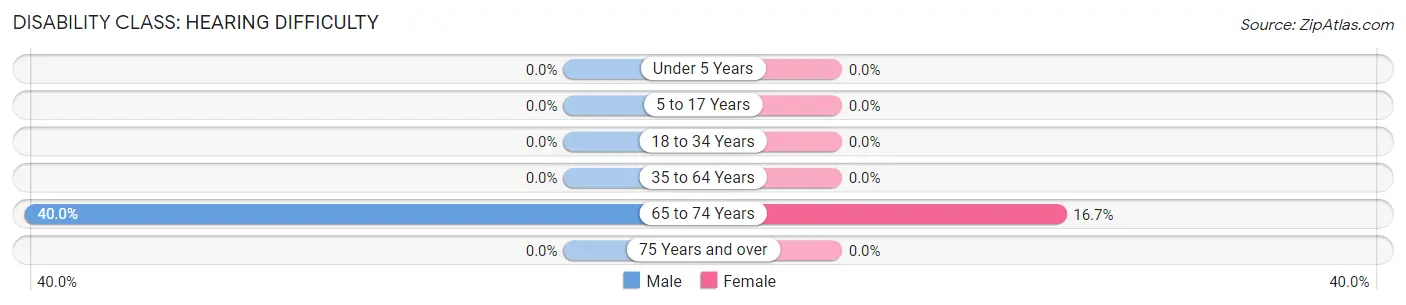
| Age Bracket | Male | Female |
| Under 5 Years | 0 (0.0%) | 0 (0.0%) |
| 5 to 17 Years | 0 (0.0%) | 0 (0.0%) |
| 18 to 34 Years | 0 (0.0%) | 0 (0.0%) |
| 35 to 64 Years | 0 (0.0%) | 0 (0.0%) |
| 65 to 74 Years | 2 (40.0%) | 1 (16.7%) |
| 75 Years and over | 0 (0.0%) | 0 (0.0%) |
Disability Class: Vision Difficulty
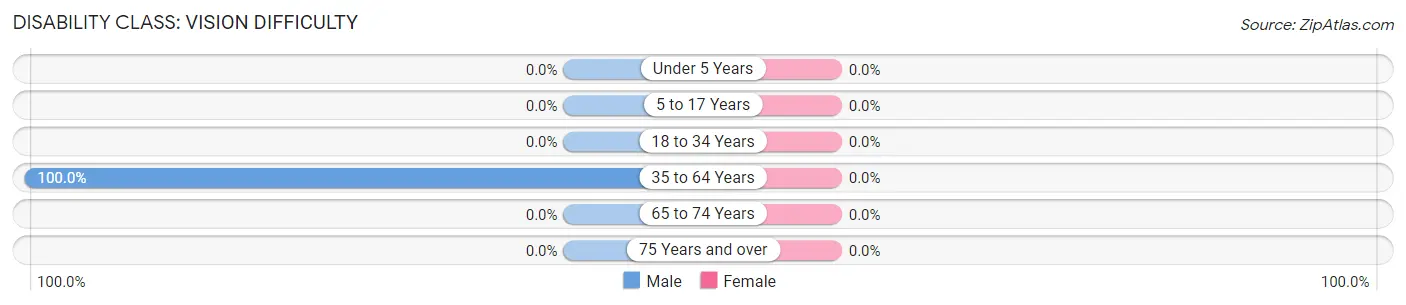
| Age Bracket | Male | Female |
| Under 5 Years | 0 (0.0%) | 0 (0.0%) |
| 5 to 17 Years | 0 (0.0%) | 0 (0.0%) |
| 18 to 34 Years | 0 (0.0%) | 0 (0.0%) |
| 35 to 64 Years | 1 (100.0%) | 0 (0.0%) |
| 65 to 74 Years | 0 (0.0%) | 0 (0.0%) |
| 75 Years and over | 0 (0.0%) | 0 (0.0%) |
Disability Class: Cognitive Difficulty
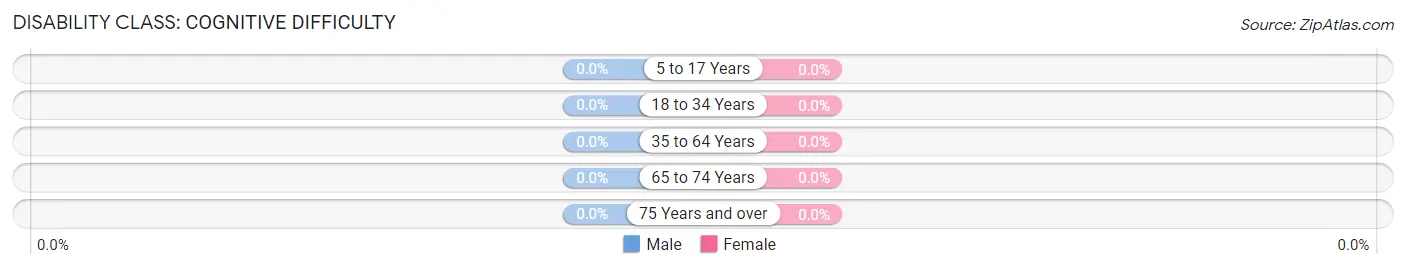
| Age Bracket | Male | Female |
| 5 to 17 Years | 0 (0.0%) | 0 (0.0%) |
| 18 to 34 Years | 0 (0.0%) | 0 (0.0%) |
| 35 to 64 Years | 0 (0.0%) | 0 (0.0%) |
| 65 to 74 Years | 0 (0.0%) | 0 (0.0%) |
| 75 Years and over | 0 (0.0%) | 0 (0.0%) |
Disability Class: Ambulatory Difficulty
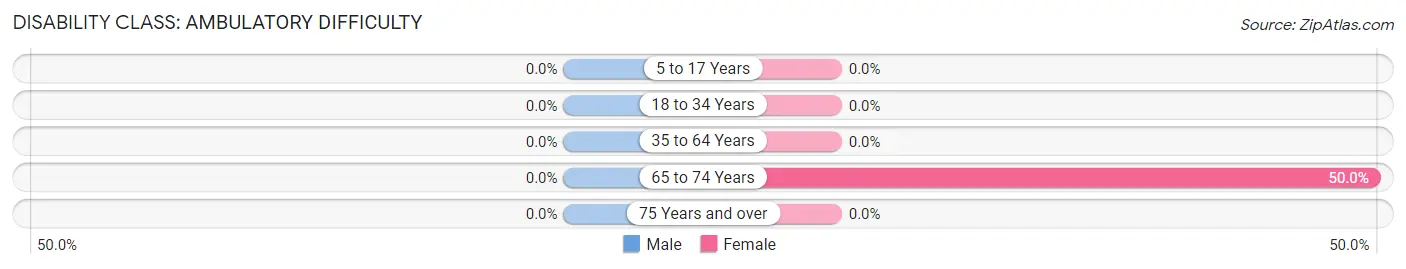
| Age Bracket | Male | Female |
| 5 to 17 Years | 0 (0.0%) | 0 (0.0%) |
| 18 to 34 Years | 0 (0.0%) | 0 (0.0%) |
| 35 to 64 Years | 0 (0.0%) | 0 (0.0%) |
| 65 to 74 Years | 0 (0.0%) | 3 (50.0%) |
| 75 Years and over | 0 (0.0%) | 0 (0.0%) |
Disability Class: Self-Care Difficulty
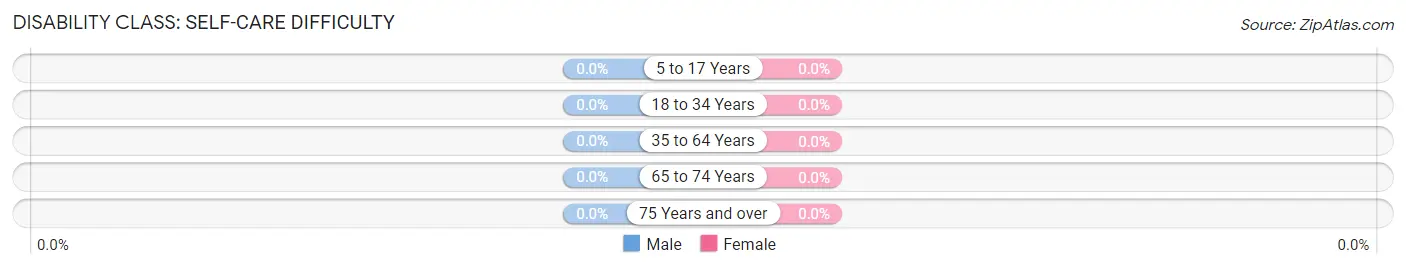
| Age Bracket | Male | Female |
| 5 to 17 Years | 0 (0.0%) | 0 (0.0%) |
| 18 to 34 Years | 0 (0.0%) | 0 (0.0%) |
| 35 to 64 Years | 0 (0.0%) | 0 (0.0%) |
| 65 to 74 Years | 0 (0.0%) | 0 (0.0%) |
| 75 Years and over | 0 (0.0%) | 0 (0.0%) |
Technology Access in Sun Valley
Computing Device Access in Sun Valley
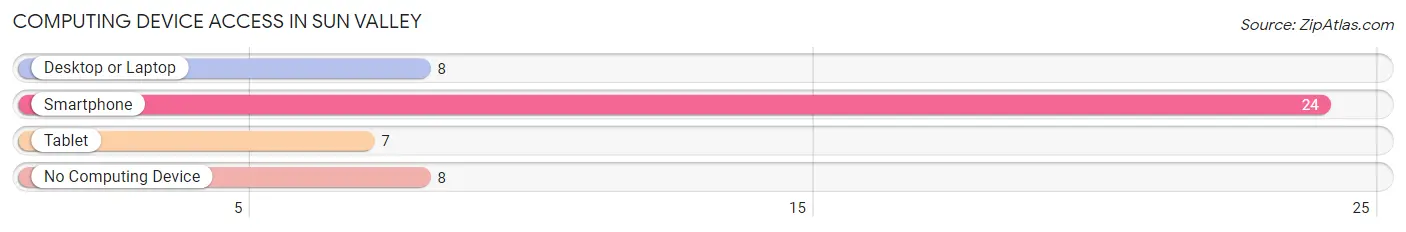
| Device Type | # Households | % Households |
| Desktop or Laptop | 8 | 25.0% |
| Smartphone | 24 | 75.0% |
| Tablet | 7 | 21.9% |
| No Computing Device | 8 | 25.0% |
| Total | 32 | 100.0% |
Internet Access in Sun Valley
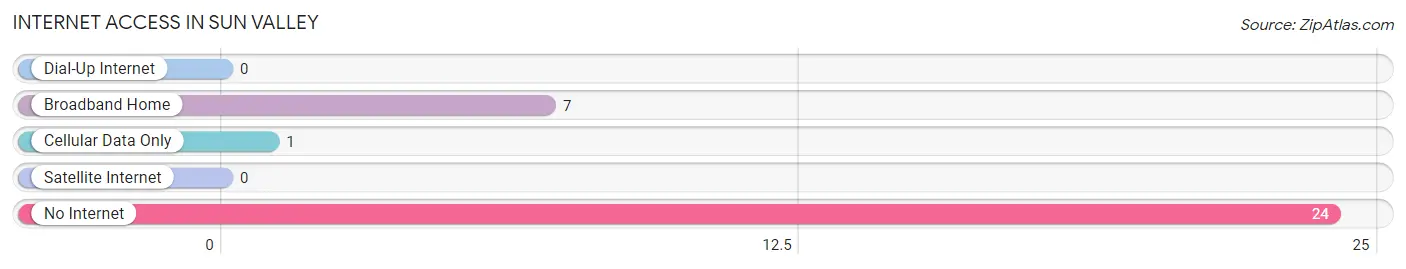
| Internet Type | # Households | % Households |
| Dial-Up Internet | 0 | 0.0% |
| Broadband Home | 7 | 21.9% |
| Cellular Data Only | 1 | 3.1% |
| Satellite Internet | 0 | 0.0% |
| No Internet | 24 | 75.0% |
| Total | 32 | 100.0% |
Sun Valley Summary
History
Sun Valley, Texas is a small unincorporated community located in the southeastern part of the state, in the county of Hidalgo. It is situated about 20 miles south of the city of McAllen, and is part of the McAllen-Edinburg-Mission Metropolitan Statistical Area. The area was first settled in the late 19th century by Mexican immigrants, and the town was officially established in the early 20th century.
The town was originally known as “Sun Valley Ranch”, and was founded by a group of Mexican immigrants who had come to the area to work in the local cotton fields. The town was named after the nearby Sun Valley Ranch, which was owned by the family of one of the immigrants. The town was officially incorporated in 1910, and the first post office was established in 1911.
The town grew slowly over the years, and by the mid-20th century, it had become a small agricultural community. The town was home to a number of small businesses, including a grocery store, a barber shop, and a gas station. The town also had a school, which was attended by the children of the local residents.
Geography
Sun Valley is located in the southeastern part of Texas, in the county of Hidalgo. It is situated about 20 miles south of the city of McAllen, and is part of the McAllen-Edinburg-Mission Metropolitan Statistical Area. The town is located in the Rio Grande Valley, and is surrounded by a number of small towns and villages.
The town is situated on the banks of the Rio Grande River, and is bordered by the cities of McAllen and Edinburg to the north, and the towns of Mission and Pharr to the south. The town is located in a flat, low-lying area, and is surrounded by agricultural fields and small ranches.
Economy
Sun Valley’s economy is largely based on agriculture. The town is home to a number of small farms and ranches, which produce a variety of crops, including cotton, corn, sorghum, and vegetables. The town is also home to a number of small businesses, including a grocery store, a barber shop, and a gas station.
The town is also home to a number of manufacturing companies, which produce a variety of products, including furniture, clothing, and electronics. The town is also home to a number of service-based businesses, including restaurants, hotels, and auto repair shops.
Demographics
As of the 2010 census, the population of Sun Valley was 1,845. The town is predominantly Hispanic, with over 90% of the population identifying as such. The median household income in the town is $25,000, and the median age is 33. The town is home to a number of small businesses, and the unemployment rate is relatively low.
Common Questions
What is Per Capita Income in Sun Valley?
Per Capita income in Sun Valley is $23,643.
What is the Median Household income in Sun Valley?
Median Household Income in Sun Valley is $40,625.
What is Income or Wage Gap in Sun Valley?
Income or Wage Gap in Sun Valley is 2.4%.
Women in Sun Valley earn 97.6 cents for every dollar earned by a man.
What is Inequality or Gini Index in Sun Valley?
Inequality or Gini Index in Sun Valley is 0.21.
What is the Total Population of Sun Valley?
Total Population of Sun Valley is 75.
What is the Total Male Population of Sun Valley?
Total Male Population of Sun Valley is 47.
What is the Total Female Population of Sun Valley?
Total Female Population of Sun Valley is 28.
What is the Ratio of Males per 100 Females in Sun Valley?
There are 167.86 Males per 100 Females in Sun Valley.
What is the Ratio of Females per 100 Males in Sun Valley?
There are 59.57 Females per 100 Males in Sun Valley.
What is the Median Population Age in Sun Valley?
Median Population Age in Sun Valley is 28.6 Years.
What is the Average Family Size in Sun Valley
Average Family Size in Sun Valley is 3.5 People.
What is the Average Household Size in Sun Valley
Average Household Size in Sun Valley is 2.3 People.
How Large is the Labor Force in Sun Valley?
There are 44 People in the Labor Forcein in Sun Valley.
What is the Percentage of People in the Labor Force in Sun Valley?
84.6% of People are in the Labor Force in Sun Valley.