El Lago, TX Map & Demographics
El Lago Map
El Lago Overview
$50,057
PER CAPITA INCOME
$111,051
AVG FAMILY INCOME
$99,375
AVG HOUSEHOLD INCOME
12.0%
WAGE / INCOME GAP [ % ]
88.0¢/ $1
WAGE / INCOME GAP [ $ ]
0.40
INEQUALITY / GINI INDEX
3,039
TOTAL POPULATION
1,464
MALE POPULATION
1,575
FEMALE POPULATION
92.95
MALES / 100 FEMALES
107.58
FEMALES / 100 MALES
44.3
MEDIAN AGE
3.0
AVG FAMILY SIZE
2.6
AVG HOUSEHOLD SIZE
1,640
LABOR FORCE [ PEOPLE ]
65.9%
PERCENT IN LABOR FORCE
2.8%
UNEMPLOYMENT RATE
Income in El Lago
Income Overview in El Lago
Per Capita Income in El Lago is $50,057, while median incomes of families and households are $111,051 and $99,375 respectively.
| Characteristic | Number | Measure |
| Per Capita Income | 3,039 | $50,057 |
| Median Family Income | 837 | $111,051 |
| Mean Family Income | 837 | $144,299 |
| Median Household Income | 1,183 | $99,375 |
| Mean Household Income | 1,183 | $125,424 |
| Income Deficit | 837 | $0 |
| Wage / Income Gap (%) | 3,039 | 12.02% |
| Wage / Income Gap ($) | 3,039 | 87.98¢ per $1 |
| Gini / Inequality Index | 3,039 | 0.40 |
Earnings by Sex in El Lago
Average Earnings in El Lago are $61,198, $68,313 for men and $60,104 for women, a difference of 12.0%.
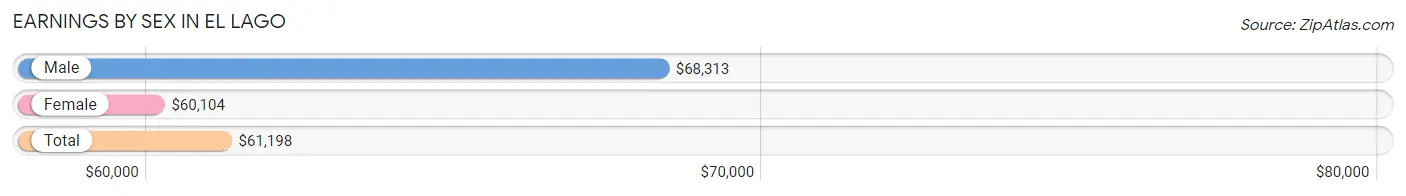
| Sex | Number | Average Earnings |
| Male | 877 (52.7%) | $68,313 |
| Female | 786 (47.3%) | $60,104 |
| Total | 1,663 (100.0%) | $61,198 |
Earnings by Sex by Income Bracket in El Lago
The most common earnings brackets in El Lago are $100,000+ for men (233 | 26.6%) and $75,000 to $99,999 for women (234 | 29.8%).
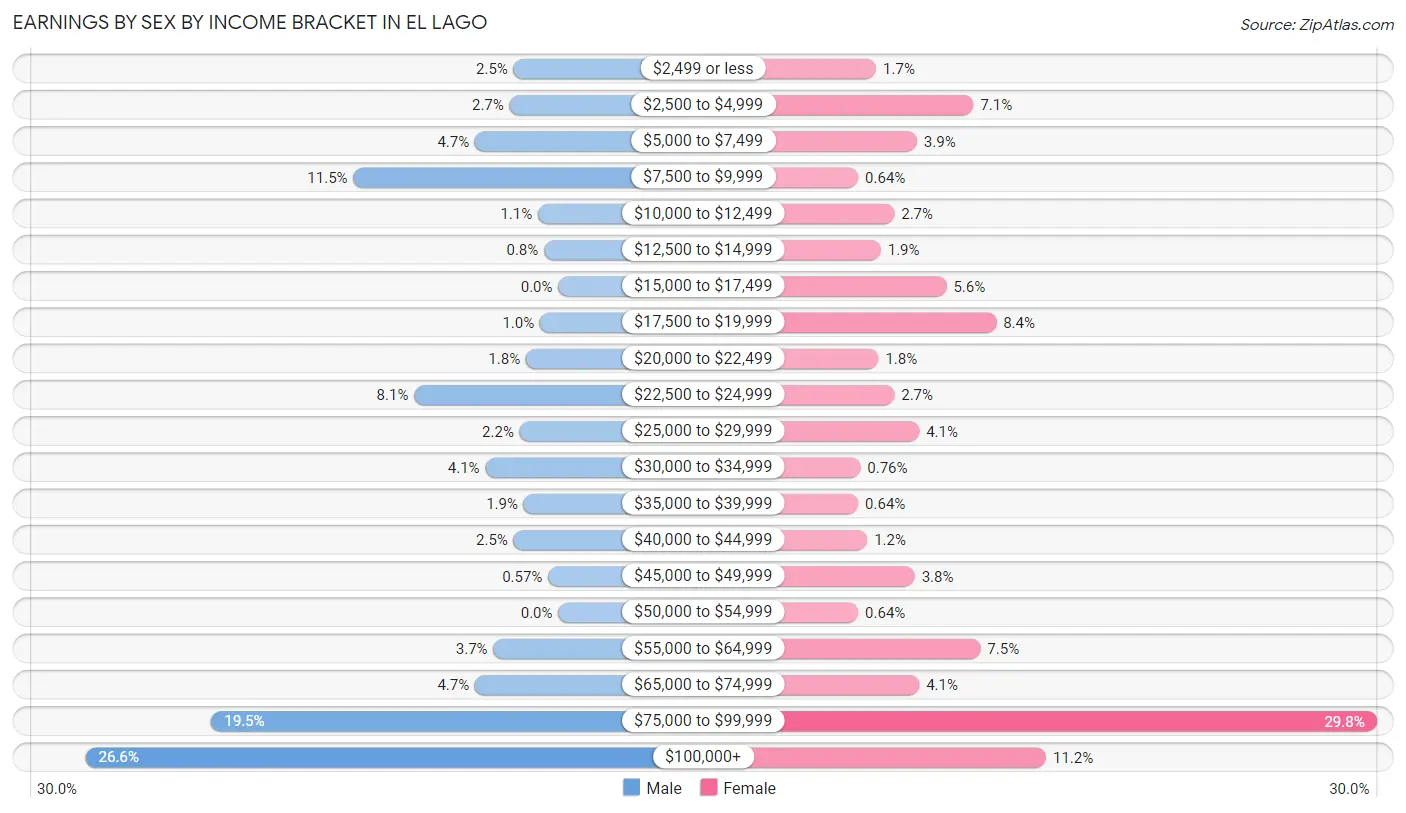
| Income | Male | Female |
| $2,499 or less | 22 (2.5%) | 13 (1.7%) |
| $2,500 to $4,999 | 24 (2.7%) | 56 (7.1%) |
| $5,000 to $7,499 | 41 (4.7%) | 31 (3.9%) |
| $7,500 to $9,999 | 101 (11.5%) | 5 (0.6%) |
| $10,000 to $12,499 | 10 (1.1%) | 21 (2.7%) |
| $12,500 to $14,999 | 7 (0.8%) | 15 (1.9%) |
| $15,000 to $17,499 | 0 (0.0%) | 44 (5.6%) |
| $17,500 to $19,999 | 9 (1.0%) | 66 (8.4%) |
| $20,000 to $22,499 | 16 (1.8%) | 14 (1.8%) |
| $22,500 to $24,999 | 71 (8.1%) | 21 (2.7%) |
| $25,000 to $29,999 | 19 (2.2%) | 32 (4.1%) |
| $30,000 to $34,999 | 36 (4.1%) | 6 (0.8%) |
| $35,000 to $39,999 | 17 (1.9%) | 5 (0.6%) |
| $40,000 to $44,999 | 22 (2.5%) | 9 (1.1%) |
| $45,000 to $49,999 | 5 (0.6%) | 30 (3.8%) |
| $50,000 to $54,999 | 0 (0.0%) | 5 (0.6%) |
| $55,000 to $64,999 | 32 (3.6%) | 59 (7.5%) |
| $65,000 to $74,999 | 41 (4.7%) | 32 (4.1%) |
| $75,000 to $99,999 | 171 (19.5%) | 234 (29.8%) |
| $100,000+ | 233 (26.6%) | 88 (11.2%) |
| Total | 877 (100.0%) | 786 (100.0%) |
Earnings by Sex by Educational Attainment in El Lago
Average earnings in El Lago are $70,865 for men and $73,047 for women, a difference of 3.0%. Men with an educational attainment of graduate degree enjoy the highest average annual earnings of $102,566, while those with high school diploma education earn the least with $30,417. Women with an educational attainment of bachelor's degree earn the most with the average annual earnings of $95,689, while those with college or associate's degree education have the smallest earnings of $64,750.
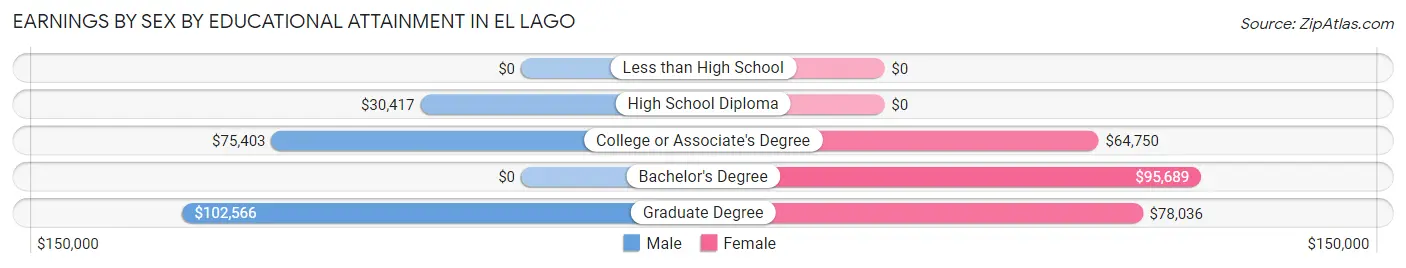
| Educational Attainment | Male Income | Female Income |
| Less than High School | - | - |
| High School Diploma | $30,417 | $0 |
| College or Associate's Degree | $75,403 | $64,750 |
| Bachelor's Degree | - | - |
| Graduate Degree | $102,566 | $78,036 |
| Total | $70,865 | $73,047 |
Family Income in El Lago
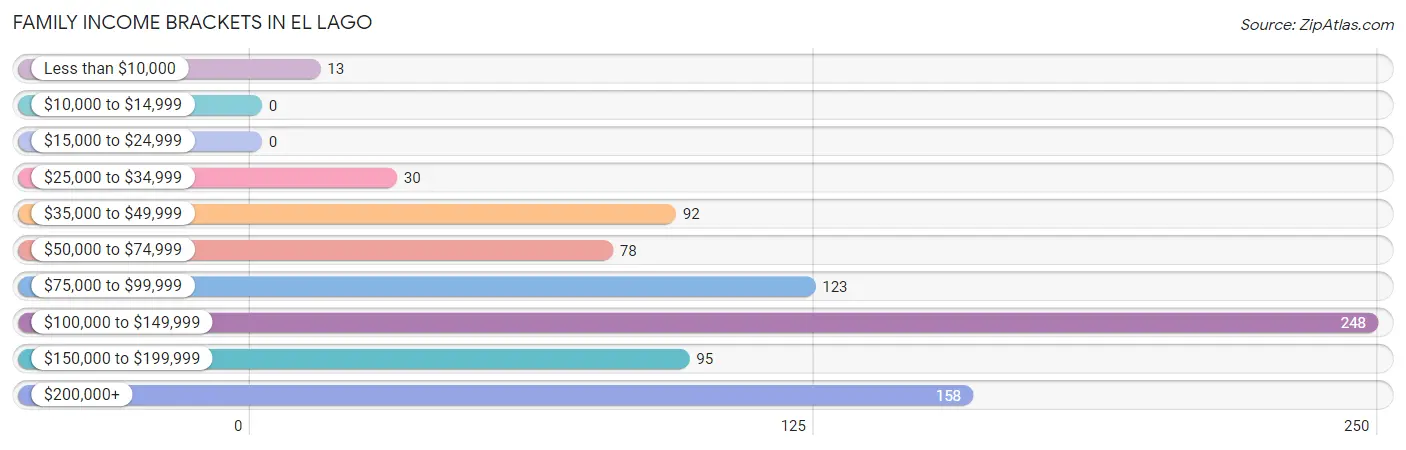
Family Income Brackets in El Lago
According to the El Lago family income data, there are 248 families falling into the $100,000 to $149,999 income range, which is the most common income bracket and makes up 29.6% of all families.
| Income Bracket | # Families | % Families |
| Less than $10,000 | 13 | 1.6% |
| $10,000 to $14,999 | 0 | 0.0% |
| $15,000 to $24,999 | 0 | 0.0% |
| $25,000 to $34,999 | 30 | 3.6% |
| $35,000 to $49,999 | 92 | 11.0% |
| $50,000 to $74,999 | 78 | 9.3% |
| $75,000 to $99,999 | 123 | 14.7% |
| $100,000 to $149,999 | 248 | 29.6% |
| $150,000 to $199,999 | 95 | 11.4% |
| $200,000+ | 158 | 18.9% |
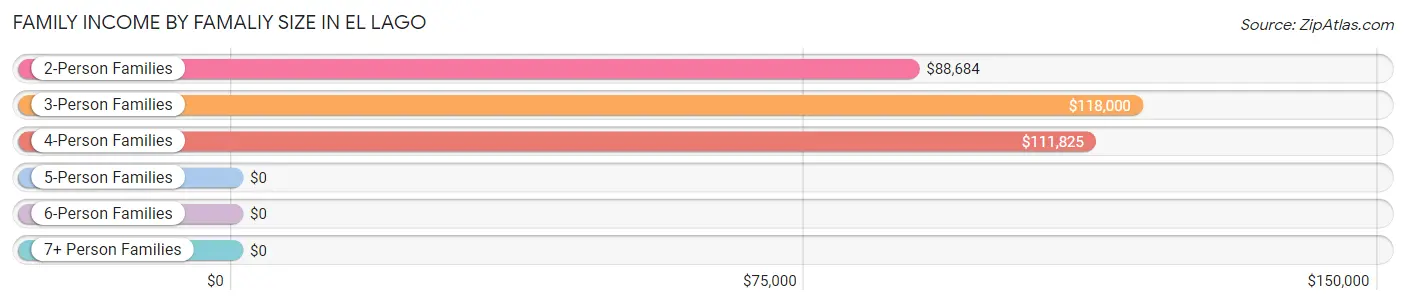
Family Income by Famaliy Size in El Lago
3-person families (144 | 17.2%) account for the highest median family income in El Lago with $118,000 per family, while 2-person families (434 | 51.8%) have the highest median income of $44,342 per family member.
| Income Bracket | # Families | Median Income |
| 2-Person Families | 434 (51.8%) | $88,684 |
| 3-Person Families | 144 (17.2%) | $118,000 |
| 4-Person Families | 197 (23.5%) | $111,825 |
| 5-Person Families | 41 (4.9%) | $0 |
| 6-Person Families | 7 (0.8%) | $0 |
| 7+ Person Families | 14 (1.7%) | $0 |
| Total | 837 (100.0%) | $111,051 |
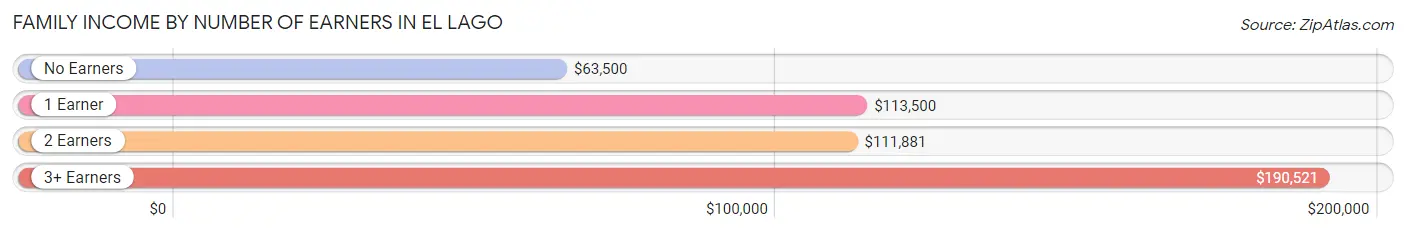
Family Income by Number of Earners in El Lago
The median family income in El Lago is $111,051, with families comprising 3+ earners (81) having the highest median family income of $190,521, while families with no earners (166) have the lowest median family income of $63,500, accounting for 9.7% and 19.8% of families, respectively.
| Number of Earners | # Families | Median Income |
| No Earners | 166 (19.8%) | $63,500 |
| 1 Earner | 172 (20.5%) | $113,500 |
| 2 Earners | 418 (49.9%) | $111,881 |
| 3+ Earners | 81 (9.7%) | $190,521 |
| Total | 837 (100.0%) | $111,051 |
Household Income in El Lago
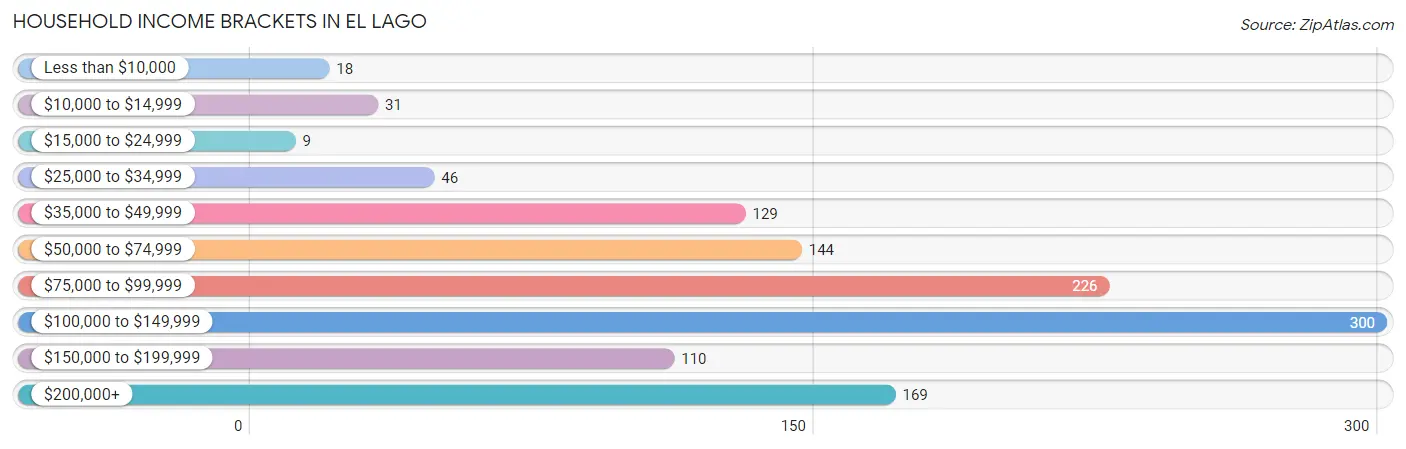
Household Income Brackets in El Lago
With 300 households falling in the category, the $100,000 to $149,999 income range is the most frequent in El Lago, accounting for 25.4% of all households. In contrast, only 9 households (0.8%) fall into the $15,000 to $24,999 income bracket, making it the least populous group.
| Income Bracket | # Households | % Households |
| Less than $10,000 | 18 | 1.5% |
| $10,000 to $14,999 | 31 | 2.6% |
| $15,000 to $24,999 | 9 | 0.8% |
| $25,000 to $34,999 | 46 | 3.9% |
| $35,000 to $49,999 | 129 | 10.9% |
| $50,000 to $74,999 | 144 | 12.2% |
| $75,000 to $99,999 | 226 | 19.1% |
| $100,000 to $149,999 | 300 | 25.4% |
| $150,000 to $199,999 | 110 | 9.3% |
| $200,000+ | 169 | 14.3% |
Household Income by Householder Age in El Lago
The median household income in El Lago is $99,375, with the highest median household income of $111,539 found in the 25 to 44 years age bracket for the primary householder. A total of 295 households (24.9%) fall into this category. Meanwhile, the 15 to 24 years age bracket for the primary householder has the lowest median household income of $0, with 16 households (1.3%) in this group.
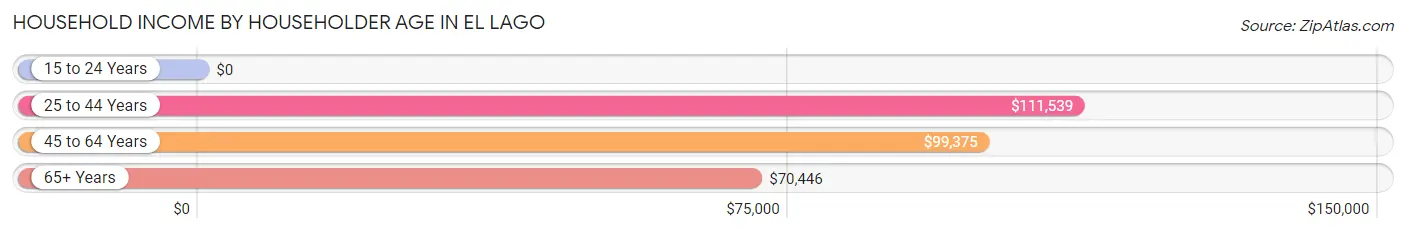
| Income Bracket | # Households | Median Income |
| 15 to 24 Years | 16 (1.3%) | $0 |
| 25 to 44 Years | 295 (24.9%) | $111,539 |
| 45 to 64 Years | 453 (38.3%) | $99,375 |
| 65+ Years | 419 (35.4%) | $70,446 |
| Total | 1,183 (100.0%) | $99,375 |
Poverty in El Lago
Income Below Poverty by Sex and Age in El Lago
With 2.9% poverty level for males and 4.0% for females among the residents of El Lago, under 5 year old males and 65 to 74 year old females are the most vulnerable to poverty, with 7 males (23.3%) and 26 females (11.6%) in their respective age groups living below the poverty level.
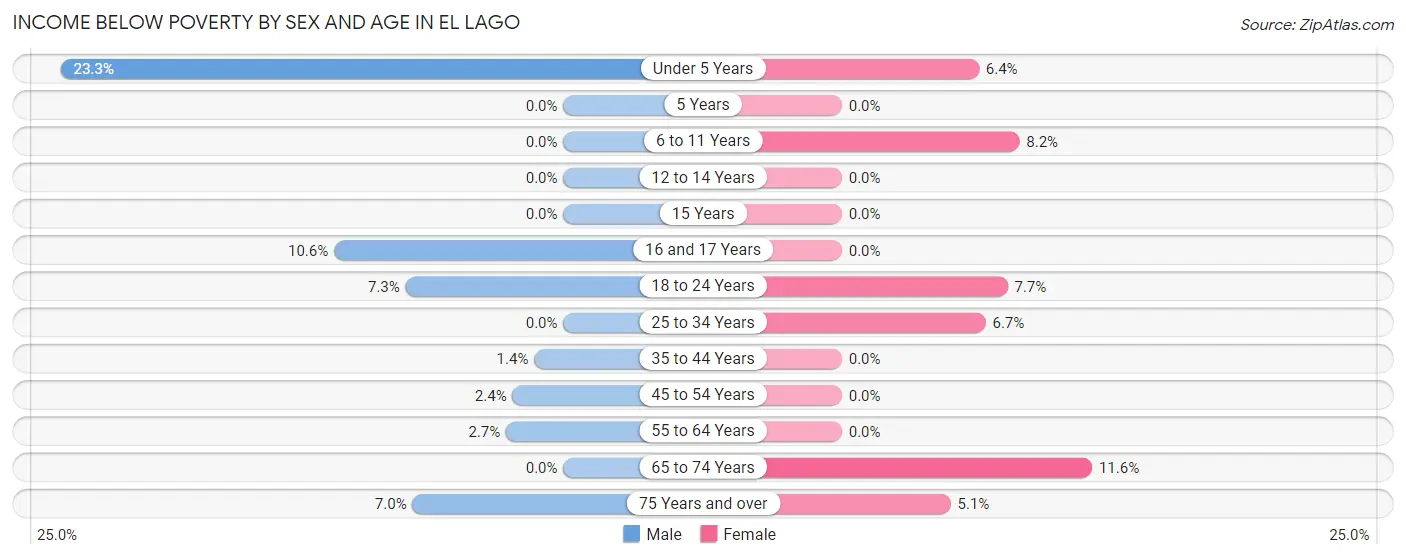
| Age Bracket | Male | Female |
| Under 5 Years | 7 (23.3%) | 7 (6.4%) |
| 5 Years | 0 (0.0%) | 0 (0.0%) |
| 6 to 11 Years | 0 (0.0%) | 7 (8.2%) |
| 12 to 14 Years | 0 (0.0%) | 0 (0.0%) |
| 15 Years | 0 (0.0%) | 0 (0.0%) |
| 16 and 17 Years | 5 (10.6%) | 0 (0.0%) |
| 18 to 24 Years | 9 (7.3%) | 12 (7.7%) |
| 25 to 34 Years | 0 (0.0%) | 6 (6.7%) |
| 35 to 44 Years | 3 (1.3%) | 0 (0.0%) |
| 45 to 54 Years | 6 (2.4%) | 0 (0.0%) |
| 55 to 64 Years | 5 (2.7%) | 0 (0.0%) |
| 65 to 74 Years | 0 (0.0%) | 26 (11.6%) |
| 75 Years and over | 7 (7.0%) | 5 (5.1%) |
| Total | 42 (2.9%) | 63 (4.0%) |
Income Above Poverty by Sex and Age in El Lago
According to the poverty statistics in El Lago, males aged 6 to 11 years and females aged 5 years are the age groups that are most secure financially, with 100.0% of males and 100.0% of females in these age groups living above the poverty line.
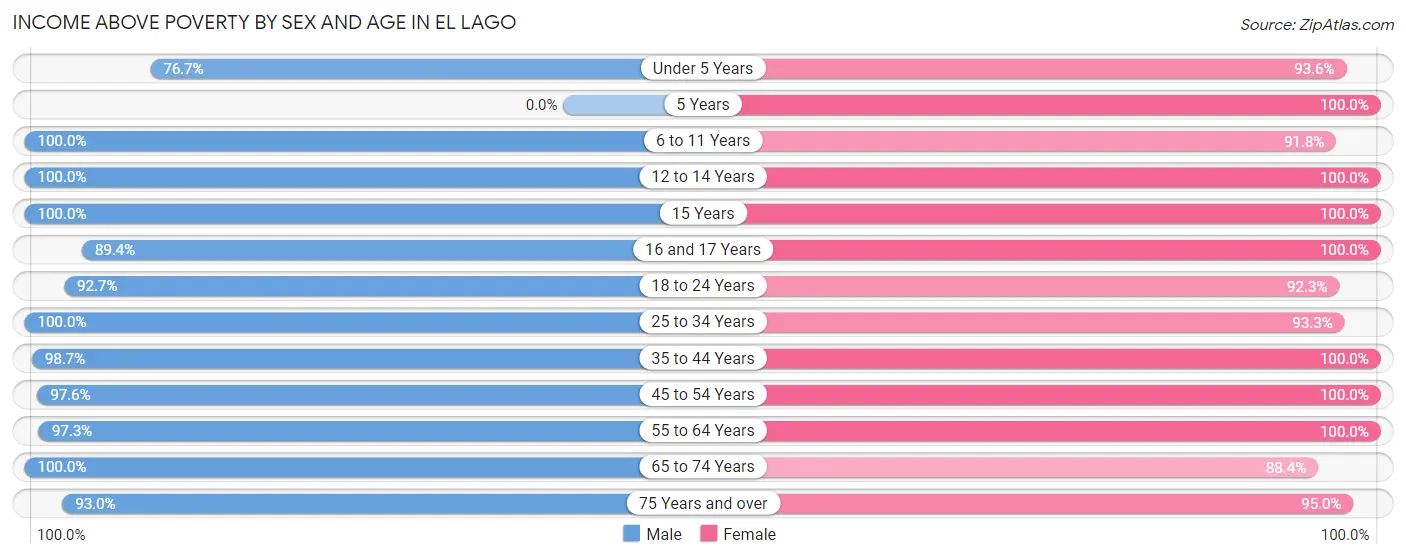
| Age Bracket | Male | Female |
| Under 5 Years | 23 (76.7%) | 103 (93.6%) |
| 5 Years | 0 (0.0%) | 15 (100.0%) |
| 6 to 11 Years | 162 (100.0%) | 78 (91.8%) |
| 12 to 14 Years | 30 (100.0%) | 93 (100.0%) |
| 15 Years | 7 (100.0%) | 19 (100.0%) |
| 16 and 17 Years | 42 (89.4%) | 13 (100.0%) |
| 18 to 24 Years | 114 (92.7%) | 144 (92.3%) |
| 25 to 34 Years | 76 (100.0%) | 84 (93.3%) |
| 35 to 44 Years | 219 (98.7%) | 264 (100.0%) |
| 45 to 54 Years | 248 (97.6%) | 255 (100.0%) |
| 55 to 64 Years | 183 (97.3%) | 152 (100.0%) |
| 65 to 74 Years | 225 (100.0%) | 198 (88.4%) |
| 75 Years and over | 93 (93.0%) | 94 (95.0%) |
| Total | 1,422 (97.1%) | 1,512 (96.0%) |
Income Below Poverty Among Married-Couple Families in El Lago
The poverty statistics for married-couple families in El Lago show that 1.0% or 7 of the total 686 families live below the poverty line. Families with no children have the highest poverty rate of 1.6%, comprising of 7 families. On the other hand, families with 1 or 2 children have the lowest poverty rate of 0.0%, which includes 0 families.
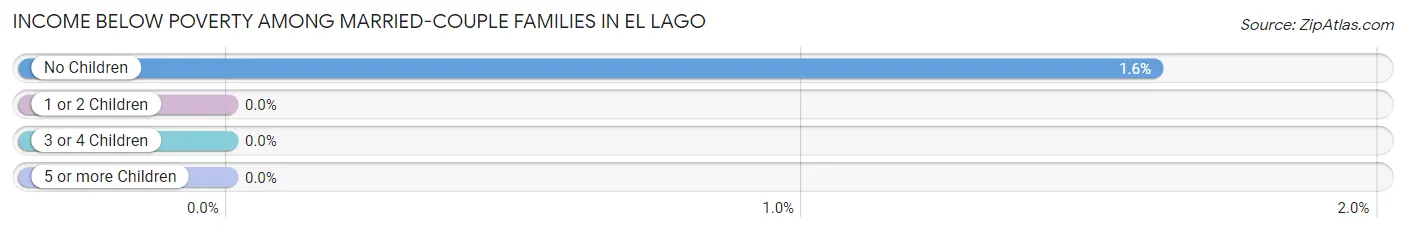
| Children | Above Poverty | Below Poverty |
| No Children | 427 (98.4%) | 7 (1.6%) |
| 1 or 2 Children | 210 (100.0%) | 0 (0.0%) |
| 3 or 4 Children | 35 (100.0%) | 0 (0.0%) |
| 5 or more Children | 7 (100.0%) | 0 (0.0%) |
| Total | 679 (99.0%) | 7 (1.0%) |
Income Below Poverty Among Single-Parent Households in El Lago
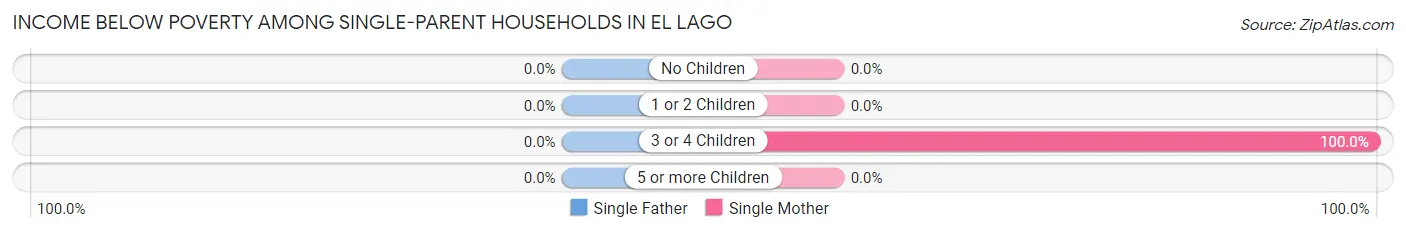
| Children | Single Father | Single Mother |
| No Children | 0 (0.0%) | 0 (0.0%) |
| 1 or 2 Children | 0 (0.0%) | 0 (0.0%) |
| 3 or 4 Children | 0 (0.0%) | 6 (100.0%) |
| 5 or more Children | 0 (0.0%) | 0 (0.0%) |
| Total | 0 (0.0%) | 6 (6.1%) |
Income Below Poverty Among Married-Couple vs Single-Parent Households in El Lago
The poverty data for El Lago shows that 7 of the married-couple family households (1.0%) and 6 of the single-parent households (4.0%) are living below the poverty level. Within the married-couple family households, those with no children have the highest poverty rate, with 7 households (1.6%) falling below the poverty line. Among the single-parent households, those with 3 or 4 children have the highest poverty rate, with 6 household (100.0%) living below poverty.
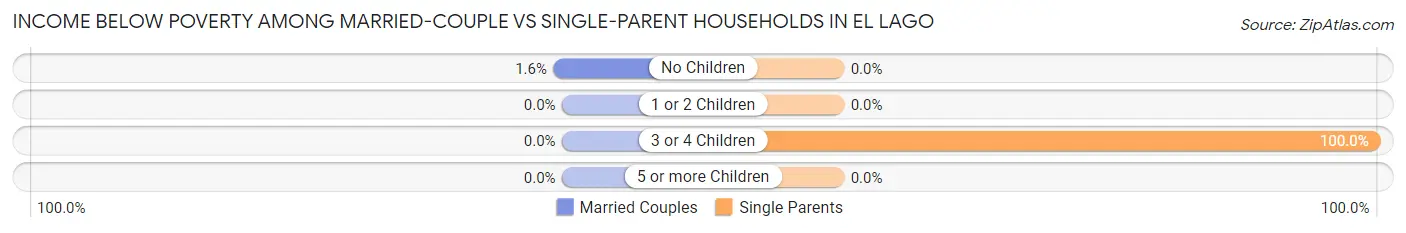
| Children | Married-Couple Families | Single-Parent Households |
| No Children | 7 (1.6%) | 0 (0.0%) |
| 1 or 2 Children | 0 (0.0%) | 0 (0.0%) |
| 3 or 4 Children | 0 (0.0%) | 6 (100.0%) |
| 5 or more Children | 0 (0.0%) | 0 (0.0%) |
| Total | 7 (1.0%) | 6 (4.0%) |
Race in El Lago
The most populous races in El Lago are White / Caucasian (2,365 | 77.8%), Asian (331 | 10.9%), and Hispanic or Latino (192 | 6.3%).
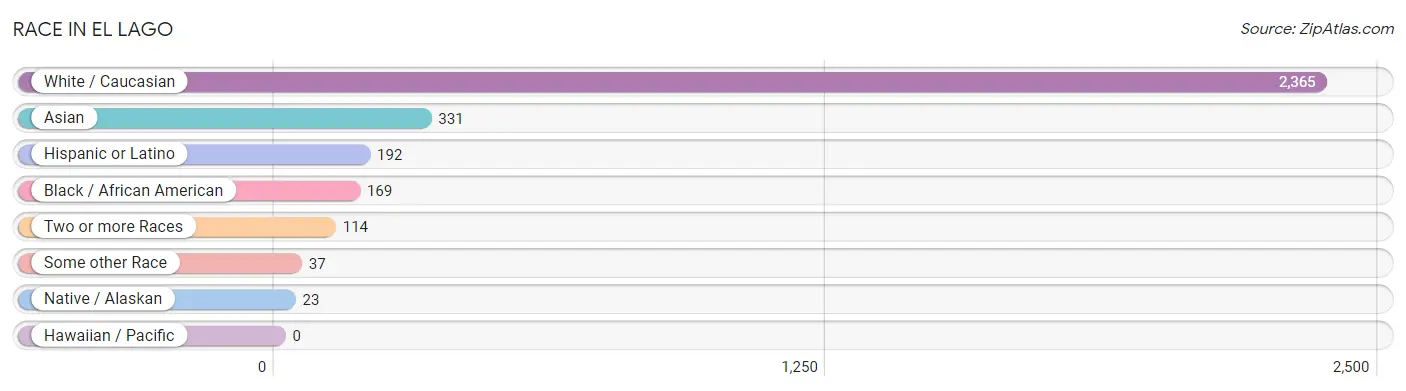
| Race | # Population | % Population |
| Asian | 331 | 10.9% |
| Black / African American | 169 | 5.6% |
| Hawaiian / Pacific | 0 | 0.0% |
| Hispanic or Latino | 192 | 6.3% |
| Native / Alaskan | 23 | 0.8% |
| White / Caucasian | 2,365 | 77.8% |
| Two or more Races | 114 | 3.7% |
| Some other Race | 37 | 1.2% |
| Total | 3,039 | 100.0% |
Ancestry in El Lago
The most populous ancestries reported in El Lago are Irish (474 | 15.6%), Korean (293 | 9.6%), American (286 | 9.4%), German (280 | 9.2%), and European (197 | 6.5%), together accounting for 50.3% of all El Lago residents.
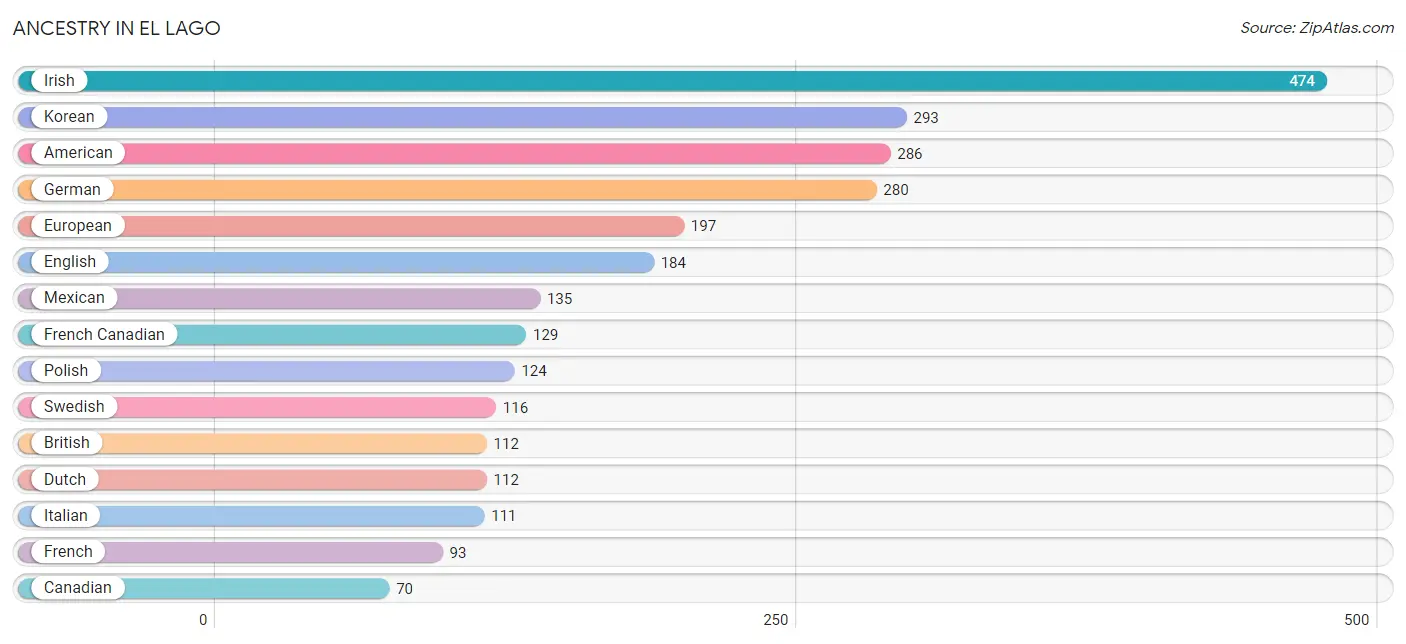
| Ancestry | # Population | % Population |
| African | 6 | 0.2% |
| American | 286 | 9.4% |
| Apache | 5 | 0.2% |
| Arab | 8 | 0.3% |
| Bangladeshi | 4 | 0.1% |
| Belgian | 42 | 1.4% |
| Bhutanese | 5 | 0.2% |
| British | 112 | 3.7% |
| Canadian | 70 | 2.3% |
| Central American | 5 | 0.2% |
| Chickasaw | 6 | 0.2% |
| Czech | 18 | 0.6% |
| Dutch | 112 | 3.7% |
| Egyptian | 8 | 0.3% |
| English | 184 | 6.0% |
| European | 197 | 6.5% |
| Finnish | 6 | 0.2% |
| French | 93 | 3.1% |
| French Canadian | 129 | 4.2% |
| German | 280 | 9.2% |
| Greek | 4 | 0.1% |
| Hungarian | 50 | 1.7% |
| Irish | 474 | 15.6% |
| Italian | 111 | 3.6% |
| Jamaican | 7 | 0.2% |
| Korean | 293 | 9.6% |
| Mexican | 135 | 4.4% |
| Nigerian | 61 | 2.0% |
| Norwegian | 33 | 1.1% |
| Osage | 2 | 0.1% |
| Ottawa | 12 | 0.4% |
| Polish | 124 | 4.1% |
| Puerto Rican | 2 | 0.1% |
| Romanian | 6 | 0.2% |
| Russian | 16 | 0.5% |
| Salvadoran | 5 | 0.2% |
| Scotch-Irish | 52 | 1.7% |
| Scottish | 24 | 0.8% |
| Slovak | 19 | 0.6% |
| Spaniard | 50 | 1.7% |
| Sri Lankan | 4 | 0.1% |
| Subsaharan African | 67 | 2.2% |
| Swedish | 116 | 3.8% |
| Thai | 30 | 1.0% |
| Welsh | 4 | 0.1% |
| Yaqui | 5 | 0.2% | View All 46 Rows |
Immigrants in El Lago
The most numerous immigrant groups reported in El Lago came from Asia (156 | 5.1%), South Eastern Asia (116 | 3.8%), Philippines (108 | 3.5%), Europe (75 | 2.5%), and Western Europe (58 | 1.9%), together accounting for 16.9% of all El Lago residents.
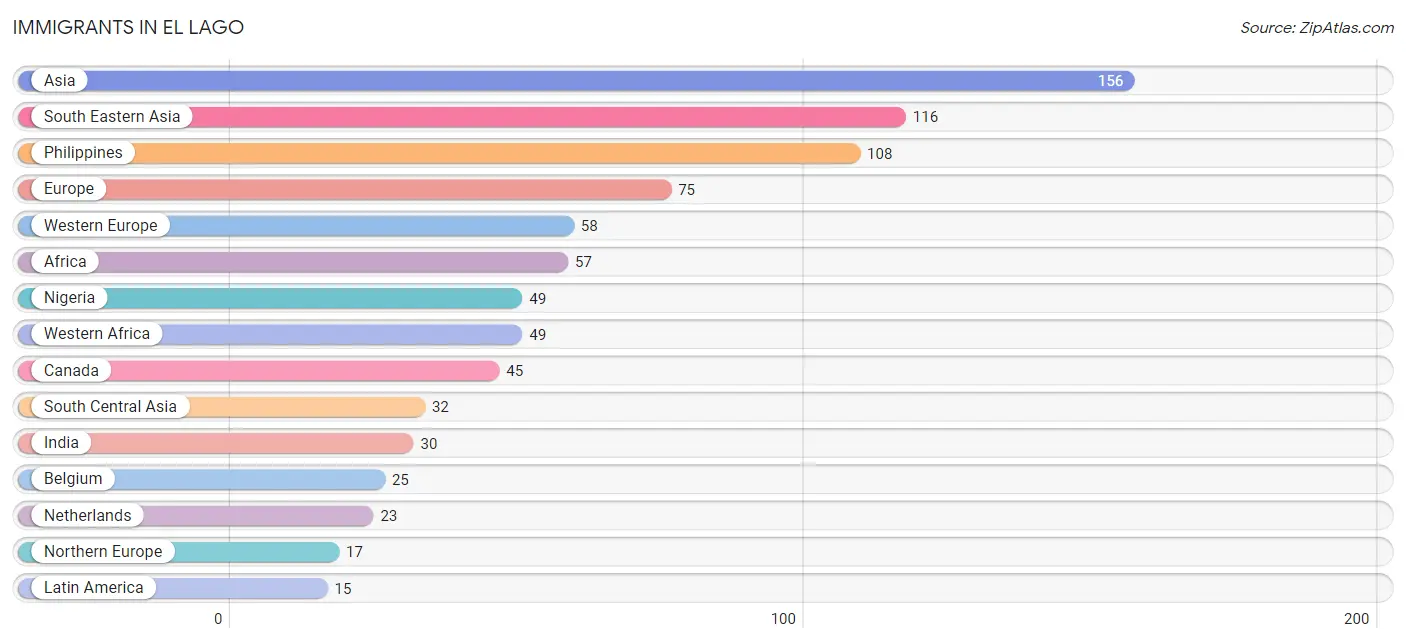
| Immigration Origin | # Population | % Population |
| Africa | 57 | 1.9% |
| Asia | 156 | 5.1% |
| Belgium | 25 | 0.8% |
| Canada | 45 | 1.5% |
| Caribbean | 7 | 0.2% |
| Central America | 8 | 0.3% |
| Egypt | 8 | 0.3% |
| Europe | 75 | 2.5% |
| Germany | 10 | 0.3% |
| India | 30 | 1.0% |
| Jamaica | 7 | 0.2% |
| Kuwait | 8 | 0.3% |
| Laos | 4 | 0.1% |
| Latin America | 15 | 0.5% |
| Mexico | 8 | 0.3% |
| Netherlands | 23 | 0.8% |
| Nigeria | 49 | 1.6% |
| Northern Africa | 8 | 0.3% |
| Northern Europe | 17 | 0.6% |
| Pakistan | 2 | 0.1% |
| Philippines | 108 | 3.5% |
| Scotland | 8 | 0.3% |
| South Central Asia | 32 | 1.1% |
| South Eastern Asia | 116 | 3.8% |
| Vietnam | 4 | 0.1% |
| Western Africa | 49 | 1.6% |
| Western Asia | 8 | 0.3% |
| Western Europe | 58 | 1.9% | View All 28 Rows |
Sex and Age in El Lago
Sex and Age in El Lago
The most populous age groups in El Lago are 40 to 44 Years (193 | 13.2%) for men and 50 to 54 Years (196 | 12.4%) for women.
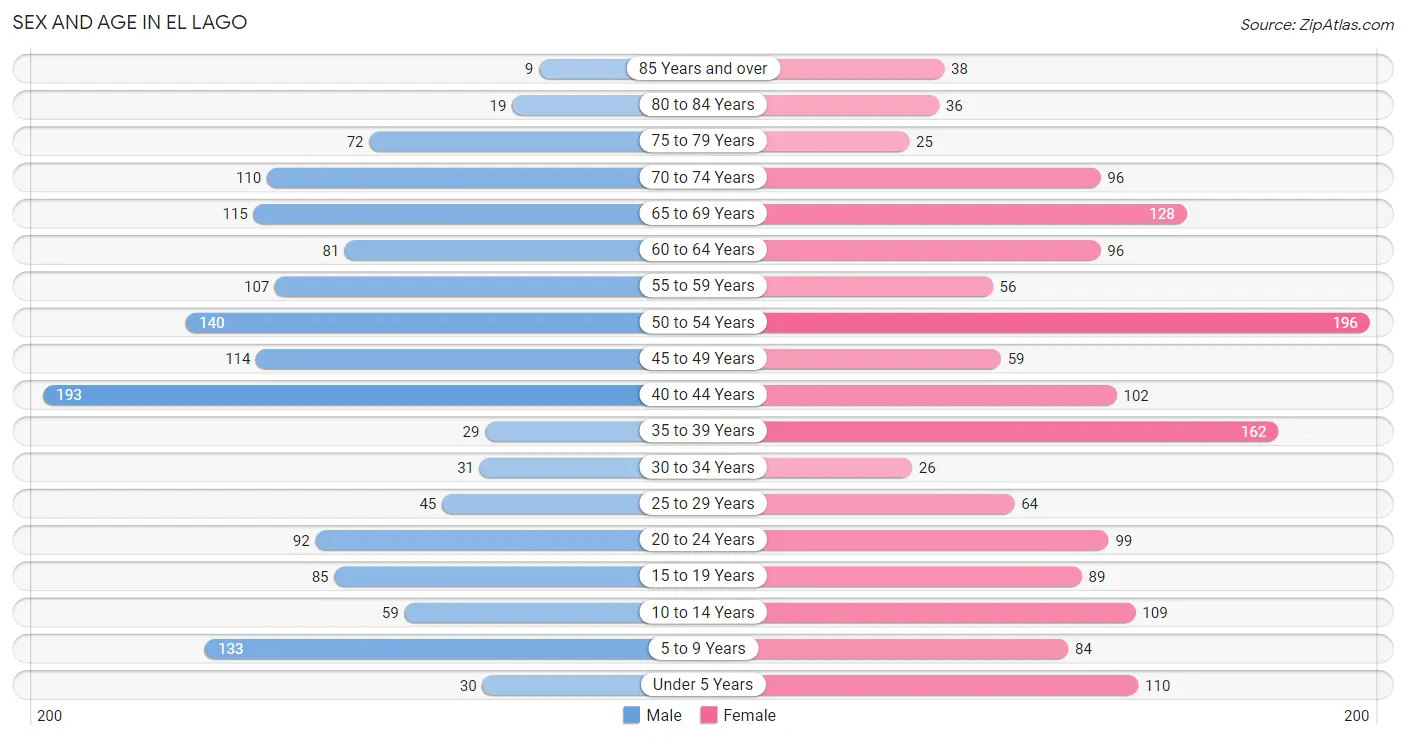
| Age Bracket | Male | Female |
| Under 5 Years | 30 (2.1%) | 110 (7.0%) |
| 5 to 9 Years | 133 (9.1%) | 84 (5.3%) |
| 10 to 14 Years | 59 (4.0%) | 109 (6.9%) |
| 15 to 19 Years | 85 (5.8%) | 89 (5.7%) |
| 20 to 24 Years | 92 (6.3%) | 99 (6.3%) |
| 25 to 29 Years | 45 (3.1%) | 64 (4.1%) |
| 30 to 34 Years | 31 (2.1%) | 26 (1.7%) |
| 35 to 39 Years | 29 (2.0%) | 162 (10.3%) |
| 40 to 44 Years | 193 (13.2%) | 102 (6.5%) |
| 45 to 49 Years | 114 (7.8%) | 59 (3.7%) |
| 50 to 54 Years | 140 (9.6%) | 196 (12.4%) |
| 55 to 59 Years | 107 (7.3%) | 56 (3.6%) |
| 60 to 64 Years | 81 (5.5%) | 96 (6.1%) |
| 65 to 69 Years | 115 (7.9%) | 128 (8.1%) |
| 70 to 74 Years | 110 (7.5%) | 96 (6.1%) |
| 75 to 79 Years | 72 (4.9%) | 25 (1.6%) |
| 80 to 84 Years | 19 (1.3%) | 36 (2.3%) |
| 85 Years and over | 9 (0.6%) | 38 (2.4%) |
| Total | 1,464 (100.0%) | 1,575 (100.0%) |
Families and Households in El Lago
Median Family Size in El Lago
The median family size in El Lago is 3.05 persons per family, with single female/mother families (98 | 11.7%) accounting for the largest median family size of 3.4 persons per family. On the other hand, single male/father families (53 | 6.3%) represent the smallest median family size with 2.32 persons per family.
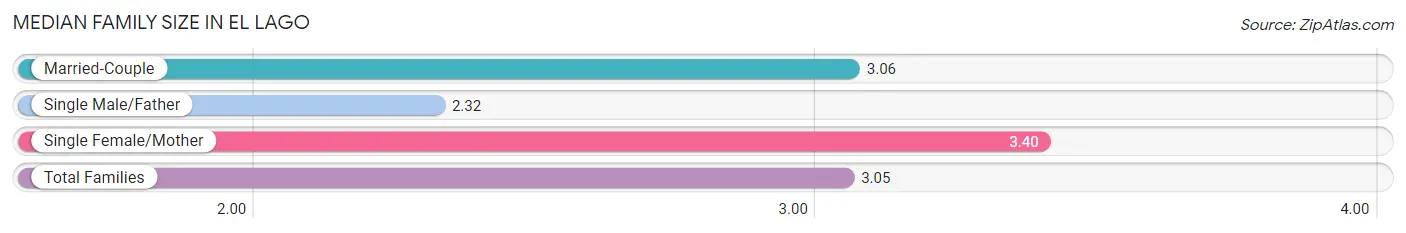
| Family Type | # Families | Family Size |
| Married-Couple | 686 (82.0%) | 3.06 |
| Single Male/Father | 53 (6.3%) | 2.32 |
| Single Female/Mother | 98 (11.7%) | 3.40 |
| Total Families | 837 (100.0%) | 3.05 |
Median Household Size in El Lago
The median household size in El Lago is 2.56 persons per household, with single female/mother households (98 | 8.3%) accounting for the largest median household size of 3.69 persons per household. non-family households (346 | 29.2%) represent the smallest median household size with 1.20 persons per household.
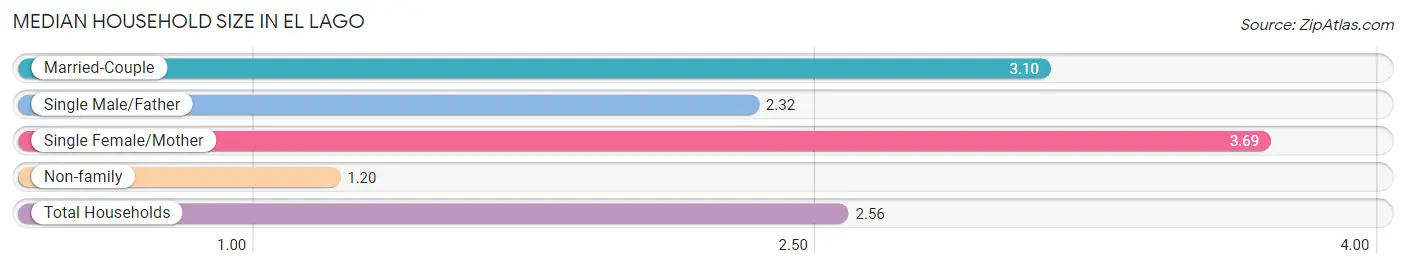
| Household Type | # Households | Household Size |
| Married-Couple | 686 (58.0%) | 3.10 |
| Single Male/Father | 53 (4.5%) | 2.32 |
| Single Female/Mother | 98 (8.3%) | 3.69 |
| Non-family | 346 (29.2%) | 1.20 |
| Total Households | 1,183 (100.0%) | 2.56 |
Household Size by Marriage Status in El Lago
Out of a total of 1,183 households in El Lago, 837 (70.8%) are family households, while 346 (29.2%) are nonfamily households. The most numerous type of family households are 2-person households, comprising 398, and the most common type of nonfamily households are 1-person households, comprising 296.
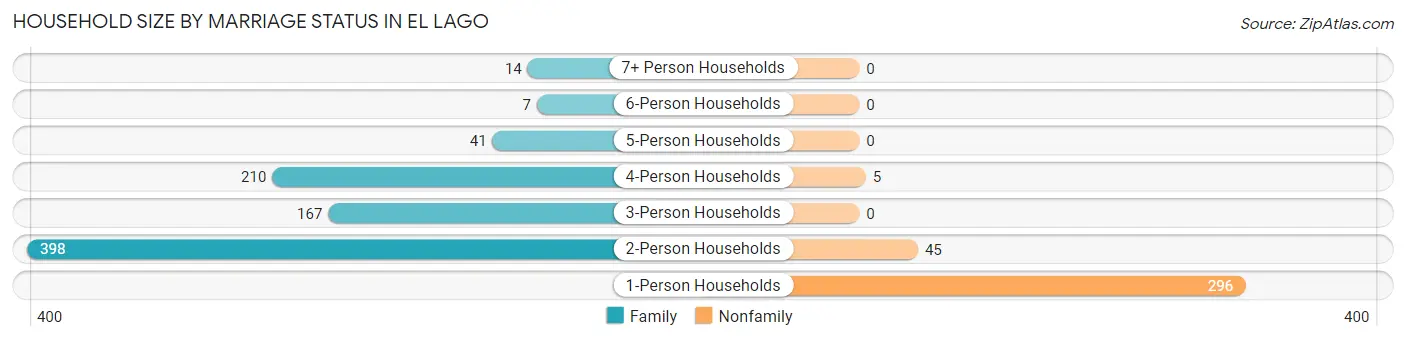
| Household Size | Family Households | Nonfamily Households |
| 1-Person Households | - | 296 (25.0%) |
| 2-Person Households | 398 (33.6%) | 45 (3.8%) |
| 3-Person Households | 167 (14.1%) | 0 (0.0%) |
| 4-Person Households | 210 (17.7%) | 5 (0.4%) |
| 5-Person Households | 41 (3.5%) | 0 (0.0%) |
| 6-Person Households | 7 (0.6%) | 0 (0.0%) |
| 7+ Person Households | 14 (1.2%) | 0 (0.0%) |
| Total | 837 (70.8%) | 346 (29.2%) |
Female Fertility in El Lago
Fertility by Age in El Lago
| Age Bracket | Women with Births | Births / 1,000 Women |
| 15 to 19 years | 0 (0.0%) | 0.0 |
| 20 to 34 years | 0 (0.0%) | 0.0 |
| 35 to 50 years | 0 (0.0%) | 0.0 |
| Total | 0 (0.0%) | 0.0 |
Fertility by Age by Marriage Status in El Lago
| Age Bracket | Married | Unmarried |
| 15 to 19 years | 0 (0.0%) | 0 (0.0%) |
| 20 to 34 years | 0 (0.0%) | 0 (0.0%) |
| 35 to 50 years | 0 (0.0%) | 0 (0.0%) |
| Total | 0 (0.0%) | 0 (0.0%) |
Fertility by Education in El Lago
| Educational Attainment | Women with Births | Births / 1,000 Women |
| Less than High School | 0 (0.0%) | 0.0 |
| High School Diploma | 0 (0.0%) | 0.0 |
| College or Associate's Degree | 0 (0.0%) | 0.0 |
| Bachelor's Degree | 0 (0.0%) | 0.0 |
| Graduate Degree | 0 (0.0%) | 0.0 |
| Total | 0 (0.0%) | 0.0 |
Fertility by Education by Marriage Status in El Lago
| Educational Attainment | Married | Unmarried |
| Less than High School | 0 (0.0%) | 0 (0.0%) |
| High School Diploma | 0 (0.0%) | 0 (0.0%) |
| College or Associate's Degree | 0 (0.0%) | 0 (0.0%) |
| Bachelor's Degree | 0 (0.0%) | 0 (0.0%) |
| Graduate Degree | 0 (0.0%) | 0 (0.0%) |
| Total | 0 (0.0%) | 0 (0.0%) |
Employment Characteristics in El Lago
Employment by Class of Employer in El Lago
Among the 1,589 employed individuals in El Lago, private company employees (918 | 57.8%), not-for-profit organizations (215 | 13.5%), and self-employed (incorporated) (152 | 9.6%) make up the most common classes of employment.
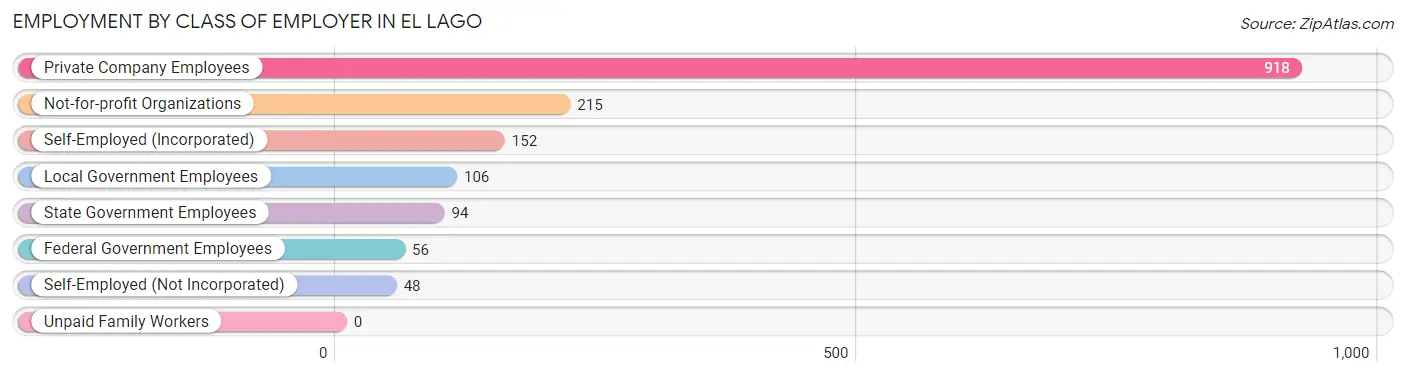
| Employer Class | # Employees | % Employees |
| Private Company Employees | 918 | 57.8% |
| Self-Employed (Incorporated) | 152 | 9.6% |
| Self-Employed (Not Incorporated) | 48 | 3.0% |
| Not-for-profit Organizations | 215 | 13.5% |
| Local Government Employees | 106 | 6.7% |
| State Government Employees | 94 | 5.9% |
| Federal Government Employees | 56 | 3.5% |
| Unpaid Family Workers | 0 | 0.0% |
| Total | 1,589 | 100.0% |
Employment Status by Age in El Lago
According to the labor force statistics for El Lago, out of the total population over 16 years of age (2,488), 65.9% or 1,640 individuals are in the labor force, with 2.8% or 46 of them unemployed. The age group with the highest labor force participation rate is 30 to 34 years, with 100.0% or 57 individuals in the labor force. Within the labor force, the 16 to 19 years age range has the highest percentage of unemployed individuals, with 31.3% or 21 of them being unemployed.
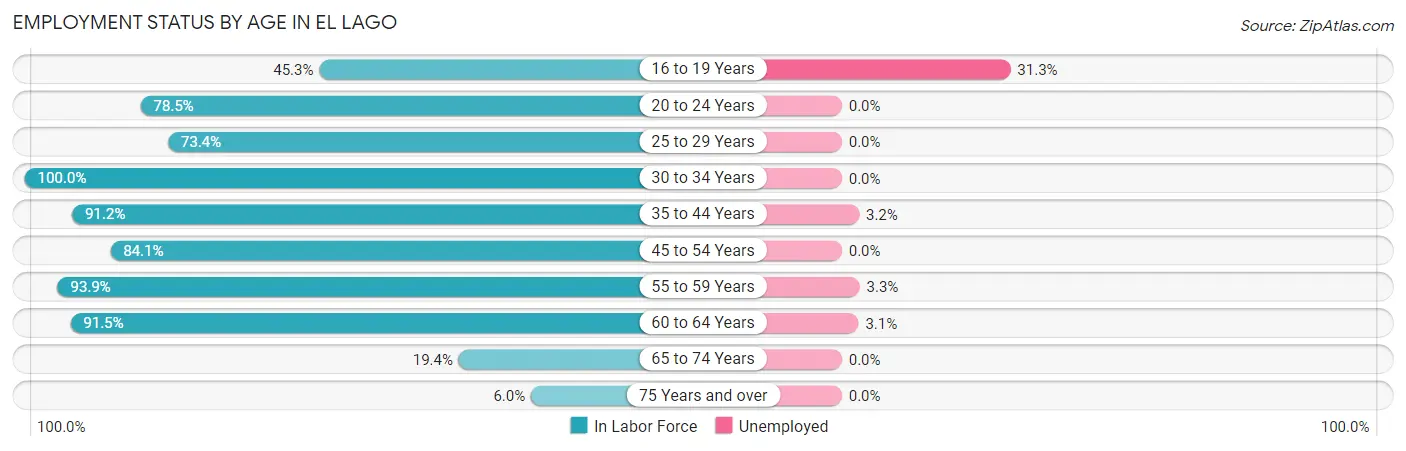
| Age Bracket | In Labor Force | Unemployed |
| 16 to 19 Years | 67 (45.3%) | 21 (31.3%) |
| 20 to 24 Years | 150 (78.5%) | 0 (0.0%) |
| 25 to 29 Years | 80 (73.4%) | 0 (0.0%) |
| 30 to 34 Years | 57 (100.0%) | 0 (0.0%) |
| 35 to 44 Years | 443 (91.2%) | 14 (3.2%) |
| 45 to 54 Years | 428 (84.1%) | 0 (0.0%) |
| 55 to 59 Years | 153 (93.9%) | 5 (3.3%) |
| 60 to 64 Years | 162 (91.5%) | 5 (3.1%) |
| 65 to 74 Years | 87 (19.4%) | 0 (0.0%) |
| 75 Years and over | 12 (6.0%) | 0 (0.0%) |
| Total | 1,640 (65.9%) | 46 (2.8%) |
Employment Status by Educational Attainment in El Lago
According to labor force statistics for El Lago, 88.1% of individuals (1,322) out of the total population between 25 and 64 years of age (1,501) are in the labor force, with 1.8% or 24 of them being unemployed. The group with the highest labor force participation rate are those with the educational attainment of bachelor's degree or higher, with 95.8% or 745 individuals in the labor force. Within the labor force, individuals with bachelor's degree or higher education have the highest percentage of unemployment, with 2.6% or 19 of them being unemployed.
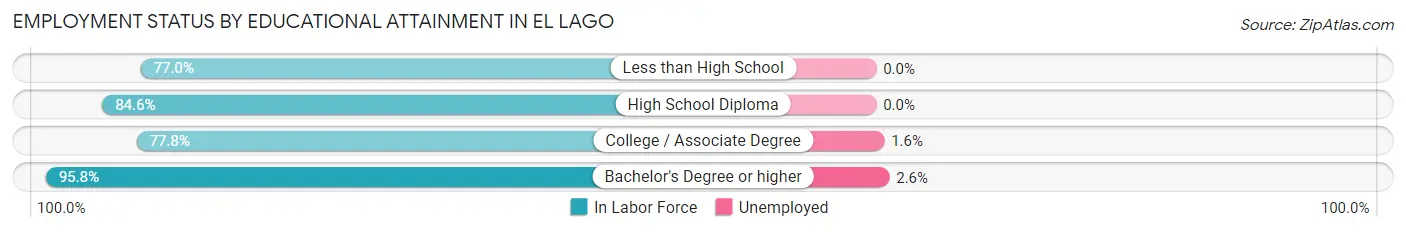
| Educational Attainment | In Labor Force | Unemployed |
| Less than High School | 57 (77.0%) | 0 (0.0%) |
| High School Diploma | 203 (84.6%) | 0 (0.0%) |
| College / Associate Degree | 318 (77.8%) | 7 (1.6%) |
| Bachelor's Degree or higher | 745 (95.8%) | 20 (2.6%) |
| Total | 1,322 (88.1%) | 27 (1.8%) |
Employment Occupations by Sex in El Lago
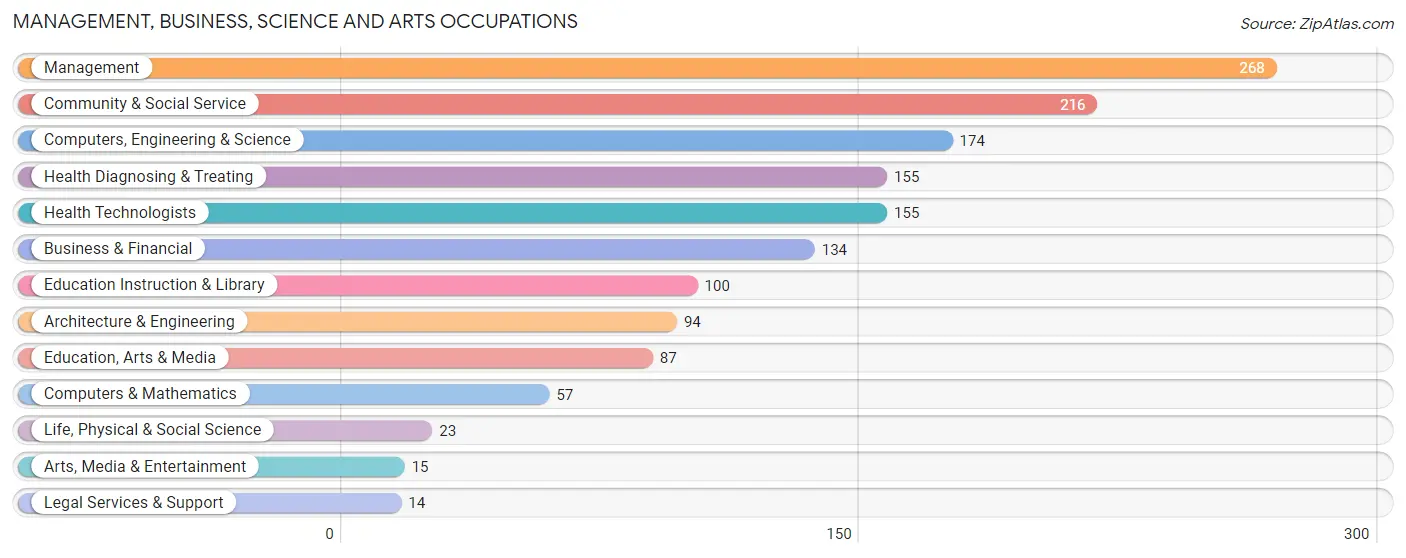
Management, Business, Science and Arts Occupations
The most common Management, Business, Science and Arts occupations in El Lago are Management (268 | 16.9%), Community & Social Service (216 | 13.6%), Computers, Engineering & Science (174 | 11.0%), Health Diagnosing & Treating (155 | 9.8%), and Health Technologists (155 | 9.8%).
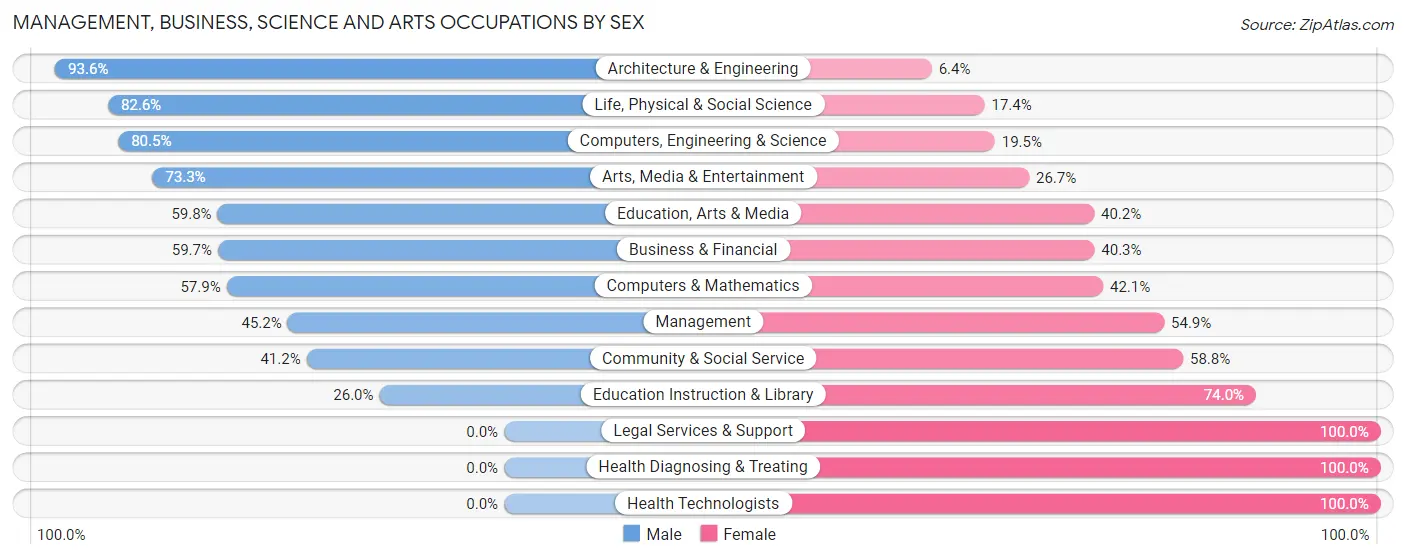
Management, Business, Science and Arts Occupations by Sex
Within the Management, Business, Science and Arts occupations in El Lago, the most male-oriented occupations are Architecture & Engineering (93.6%), Life, Physical & Social Science (82.6%), and Computers, Engineering & Science (80.5%), while the most female-oriented occupations are Legal Services & Support (100.0%), Health Diagnosing & Treating (100.0%), and Health Technologists (100.0%).
| Occupation | Male | Female |
| Management | 121 (45.2%) | 147 (54.8%) |
| Business & Financial | 80 (59.7%) | 54 (40.3%) |
| Computers, Engineering & Science | 140 (80.5%) | 34 (19.5%) |
| Computers & Mathematics | 33 (57.9%) | 24 (42.1%) |
| Architecture & Engineering | 88 (93.6%) | 6 (6.4%) |
| Life, Physical & Social Science | 19 (82.6%) | 4 (17.4%) |
| Community & Social Service | 89 (41.2%) | 127 (58.8%) |
| Education, Arts & Media | 52 (59.8%) | 35 (40.2%) |
| Legal Services & Support | 0 (0.0%) | 14 (100.0%) |
| Education Instruction & Library | 26 (26.0%) | 74 (74.0%) |
| Arts, Media & Entertainment | 11 (73.3%) | 4 (26.7%) |
| Health Diagnosing & Treating | 0 (0.0%) | 155 (100.0%) |
| Health Technologists | 0 (0.0%) | 155 (100.0%) |
| Total (Category) | 430 (45.4%) | 517 (54.6%) |
| Total (Overall) | 825 (52.0%) | 762 (48.0%) |
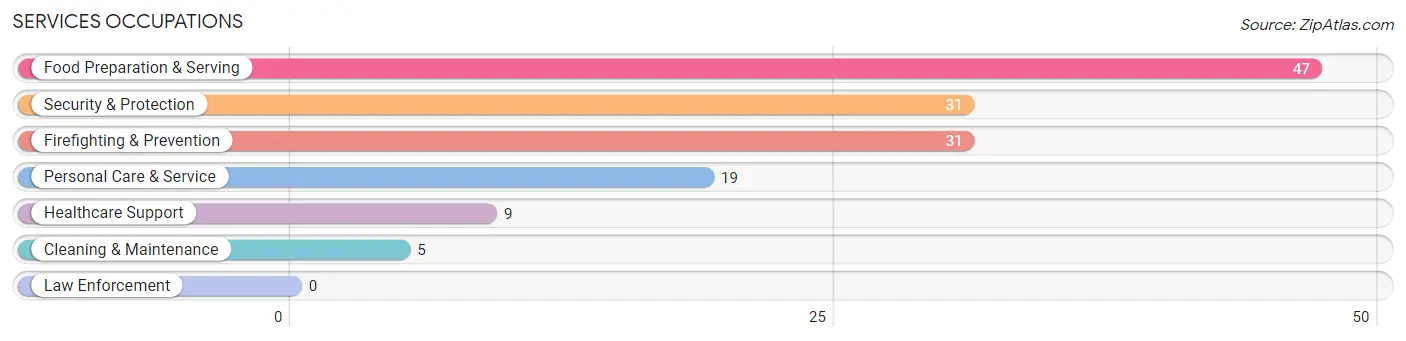
Services Occupations
The most common Services occupations in El Lago are Food Preparation & Serving (47 | 3.0%), Security & Protection (31 | 1.9%), Firefighting & Prevention (31 | 1.9%), Personal Care & Service (19 | 1.2%), and Healthcare Support (9 | 0.6%).
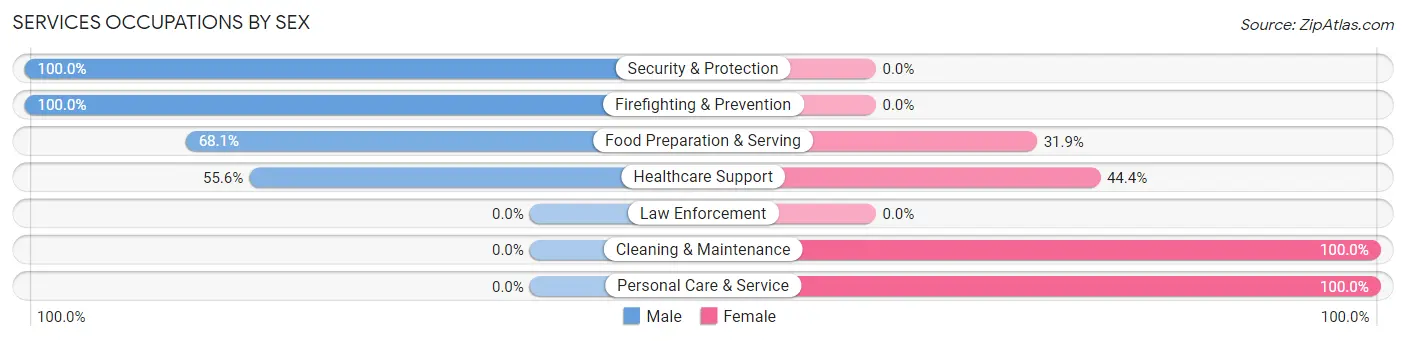
Services Occupations by Sex
Within the Services occupations in El Lago, the most male-oriented occupations are Security & Protection (100.0%), Firefighting & Prevention (100.0%), and Food Preparation & Serving (68.1%), while the most female-oriented occupations are Cleaning & Maintenance (100.0%), Personal Care & Service (100.0%), and Healthcare Support (44.4%).
| Occupation | Male | Female |
| Healthcare Support | 5 (55.6%) | 4 (44.4%) |
| Security & Protection | 31 (100.0%) | 0 (0.0%) |
| Firefighting & Prevention | 31 (100.0%) | 0 (0.0%) |
| Law Enforcement | 0 (0.0%) | 0 (0.0%) |
| Food Preparation & Serving | 32 (68.1%) | 15 (31.9%) |
| Cleaning & Maintenance | 0 (0.0%) | 5 (100.0%) |
| Personal Care & Service | 0 (0.0%) | 19 (100.0%) |
| Total (Category) | 68 (61.3%) | 43 (38.7%) |
| Total (Overall) | 825 (52.0%) | 762 (48.0%) |
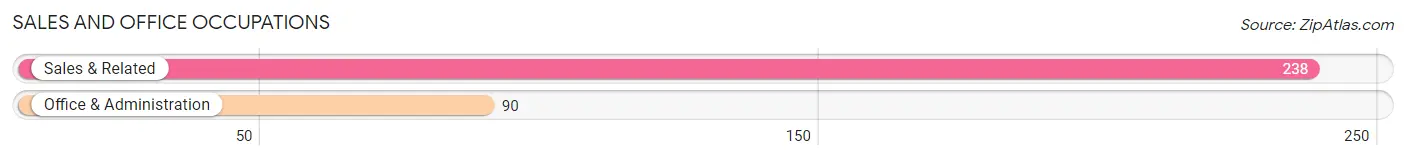
Sales and Office Occupations
The most common Sales and Office occupations in El Lago are Sales & Related (238 | 15.0%), and Office & Administration (90 | 5.7%).
Sales and Office Occupations by Sex

| Occupation | Male | Female |
| Sales & Related | 147 (61.8%) | 91 (38.2%) |
| Office & Administration | 21 (23.3%) | 69 (76.7%) |
| Total (Category) | 168 (51.2%) | 160 (48.8%) |
| Total (Overall) | 825 (52.0%) | 762 (48.0%) |
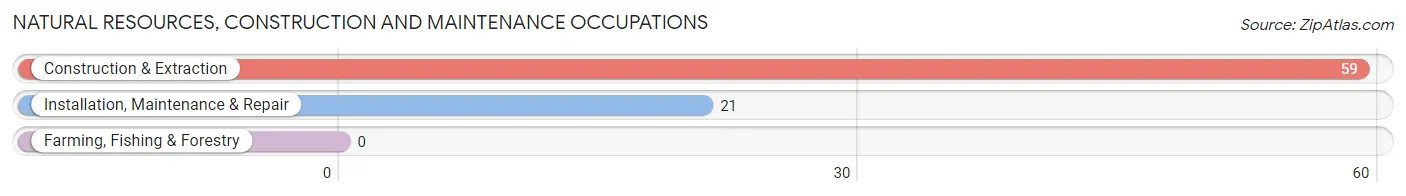
Natural Resources, Construction and Maintenance Occupations
The most common Natural Resources, Construction and Maintenance occupations in El Lago are Construction & Extraction (59 | 3.7%), and Installation, Maintenance & Repair (21 | 1.3%).
Natural Resources, Construction and Maintenance Occupations by Sex
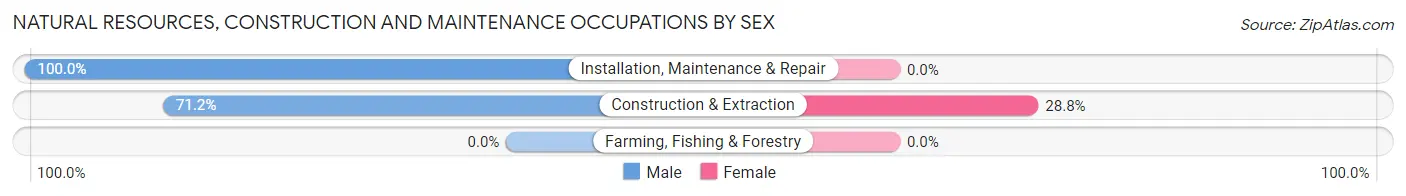
| Occupation | Male | Female |
| Farming, Fishing & Forestry | 0 (0.0%) | 0 (0.0%) |
| Construction & Extraction | 42 (71.2%) | 17 (28.8%) |
| Installation, Maintenance & Repair | 21 (100.0%) | 0 (0.0%) |
| Total (Category) | 63 (78.7%) | 17 (21.2%) |
| Total (Overall) | 825 (52.0%) | 762 (48.0%) |
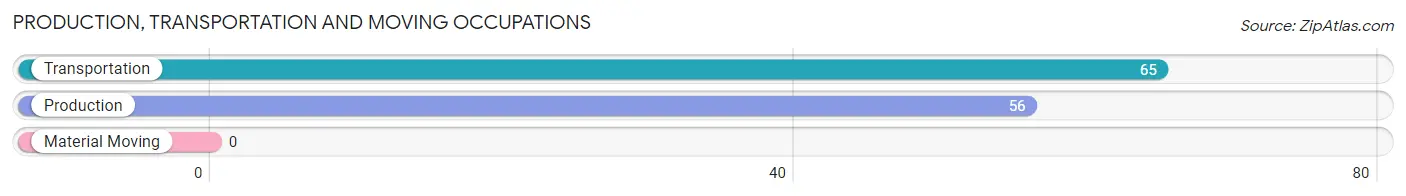
Production, Transportation and Moving Occupations
The most common Production, Transportation and Moving occupations in El Lago are Transportation (65 | 4.1%), and Production (56 | 3.5%).
Production, Transportation and Moving Occupations by Sex
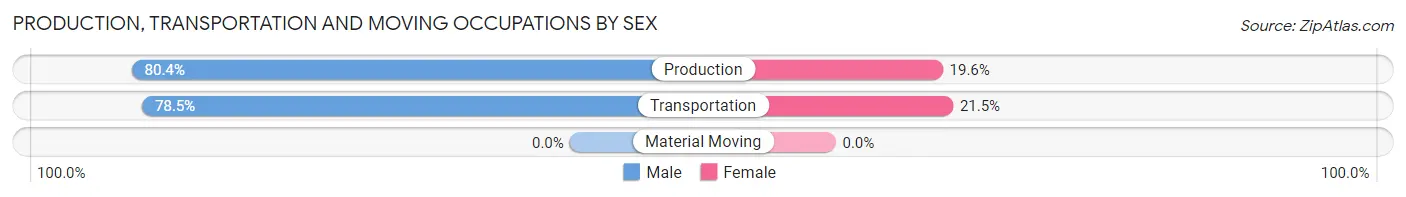
| Occupation | Male | Female |
| Production | 45 (80.4%) | 11 (19.6%) |
| Transportation | 51 (78.5%) | 14 (21.5%) |
| Material Moving | 0 (0.0%) | 0 (0.0%) |
| Total (Category) | 96 (79.3%) | 25 (20.7%) |
| Total (Overall) | 825 (52.0%) | 762 (48.0%) |
Employment Industries by Sex in El Lago
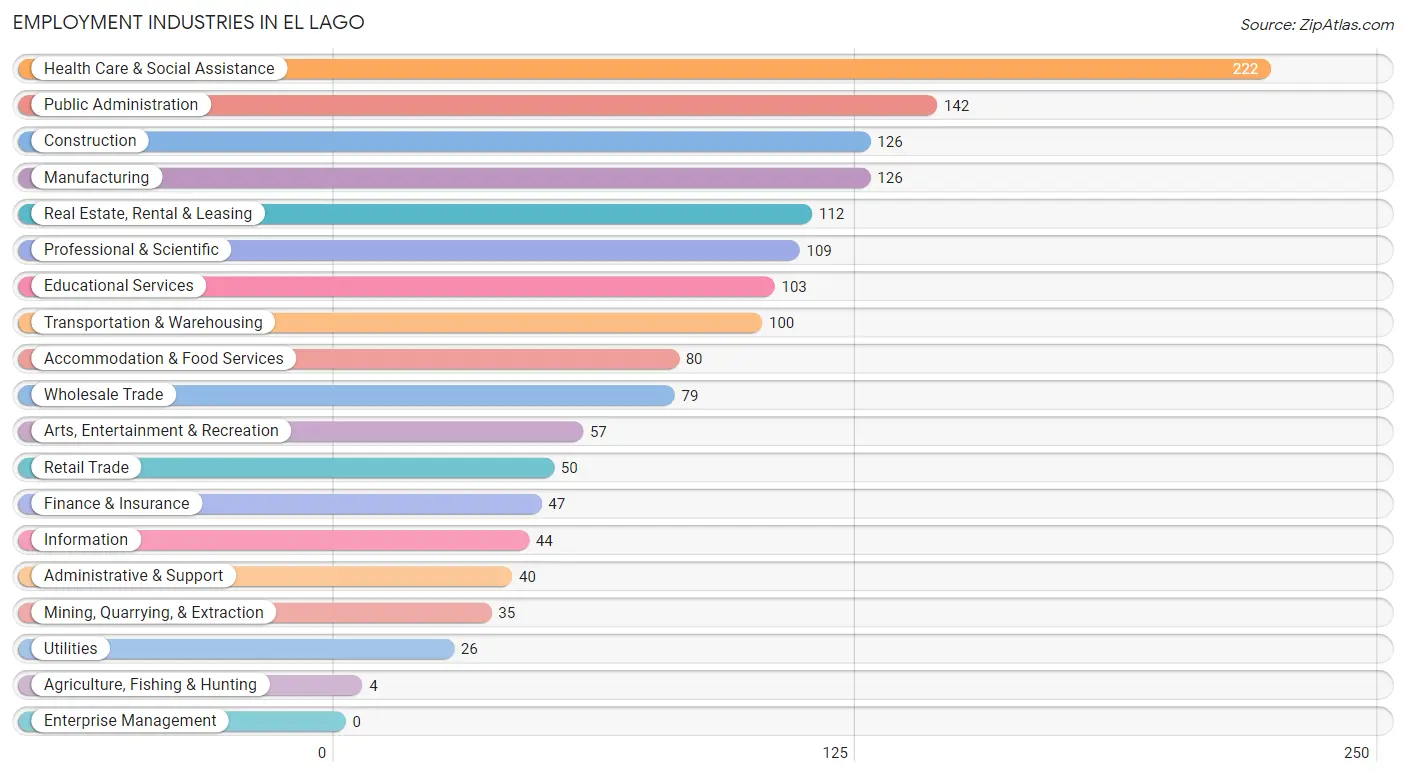
Employment Industries in El Lago
The major employment industries in El Lago include Health Care & Social Assistance (222 | 14.0%), Public Administration (142 | 8.9%), Construction (126 | 7.9%), Manufacturing (126 | 7.9%), and Real Estate, Rental & Leasing (112 | 7.1%).
Employment Industries by Sex in El Lago
The El Lago industries that see more men than women are Real Estate, Rental & Leasing (100.0%), Administrative & Support (87.5%), and Manufacturing (85.7%), whereas the industries that tend to have a higher number of women are Agriculture, Fishing & Hunting (100.0%), Information (100.0%), and Health Care & Social Assistance (94.6%).
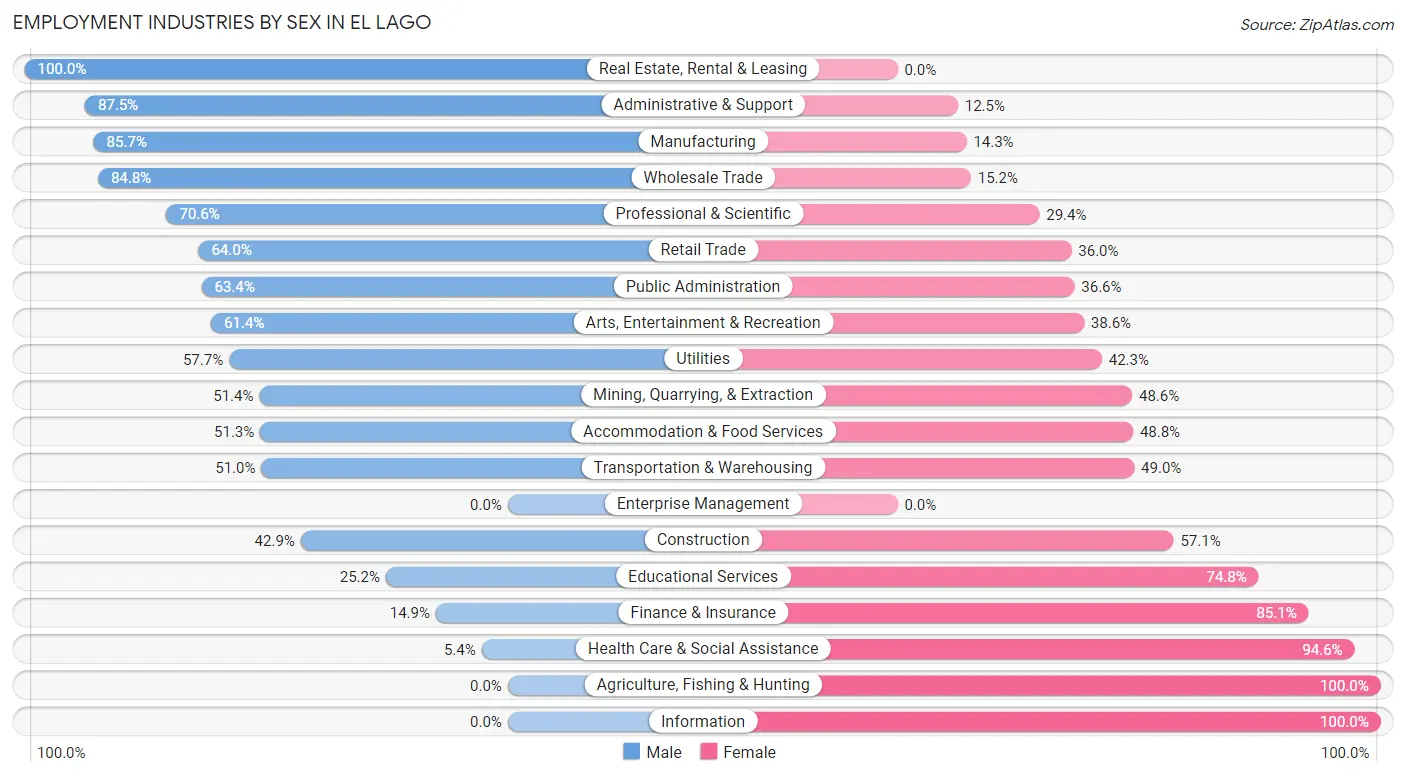
| Industry | Male | Female |
| Agriculture, Fishing & Hunting | 0 (0.0%) | 4 (100.0%) |
| Mining, Quarrying, & Extraction | 18 (51.4%) | 17 (48.6%) |
| Construction | 54 (42.9%) | 72 (57.1%) |
| Manufacturing | 108 (85.7%) | 18 (14.3%) |
| Wholesale Trade | 67 (84.8%) | 12 (15.2%) |
| Retail Trade | 32 (64.0%) | 18 (36.0%) |
| Transportation & Warehousing | 51 (51.0%) | 49 (49.0%) |
| Utilities | 15 (57.7%) | 11 (42.3%) |
| Information | 0 (0.0%) | 44 (100.0%) |
| Finance & Insurance | 7 (14.9%) | 40 (85.1%) |
| Real Estate, Rental & Leasing | 112 (100.0%) | 0 (0.0%) |
| Professional & Scientific | 77 (70.6%) | 32 (29.4%) |
| Enterprise Management | 0 (0.0%) | 0 (0.0%) |
| Administrative & Support | 35 (87.5%) | 5 (12.5%) |
| Educational Services | 26 (25.2%) | 77 (74.8%) |
| Health Care & Social Assistance | 12 (5.4%) | 210 (94.6%) |
| Arts, Entertainment & Recreation | 35 (61.4%) | 22 (38.6%) |
| Accommodation & Food Services | 41 (51.2%) | 39 (48.7%) |
| Public Administration | 90 (63.4%) | 52 (36.6%) |
| Total | 825 (52.0%) | 762 (48.0%) |
Education in El Lago
School Enrollment in El Lago
The most common levels of schooling among the 805 students in El Lago are elementary school (188 | 23.4%), college / undergraduate (162 | 20.1%), and high school (150 | 18.6%).
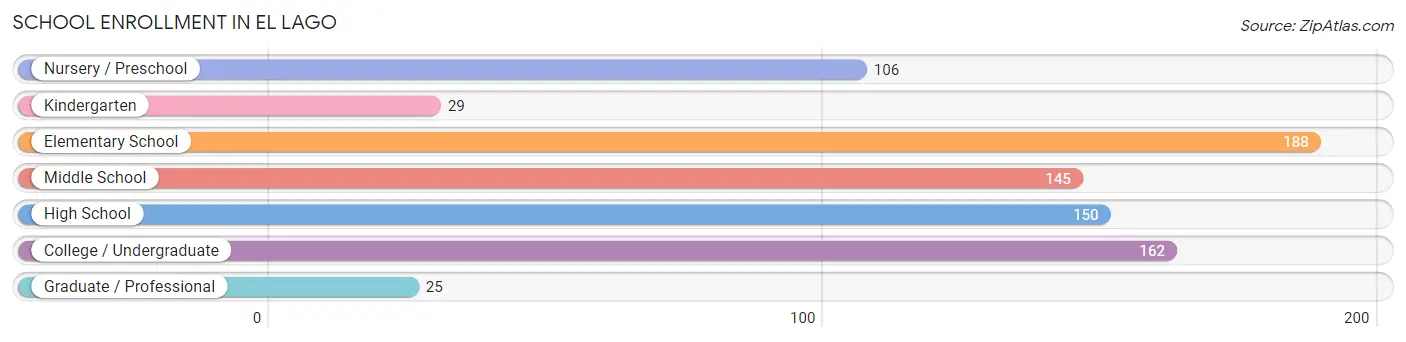
| School Level | # Students | % Students |
| Nursery / Preschool | 106 | 13.2% |
| Kindergarten | 29 | 3.6% |
| Elementary School | 188 | 23.4% |
| Middle School | 145 | 18.0% |
| High School | 150 | 18.6% |
| College / Undergraduate | 162 | 20.1% |
| Graduate / Professional | 25 | 3.1% |
| Total | 805 | 100.0% |
School Enrollment by Age by Funding Source in El Lago
Out of a total of 805 students who are enrolled in schools in El Lago, 197 (24.5%) attend a private institution, while the remaining 608 (75.5%) are enrolled in public schools. The age group of 3 to 4 year olds has the highest likelihood of being enrolled in private schools, with 106 (100.0% in the age bracket) enrolled. Conversely, the age group of 25 to 34 year olds has the lowest likelihood of being enrolled in a private school, with 28 (100.0% in the age bracket) attending a public institution.
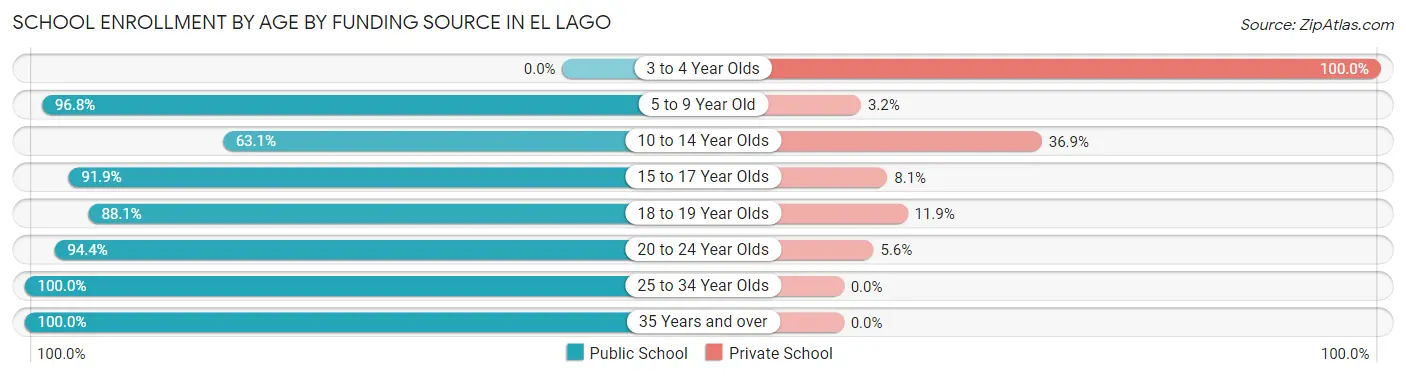
| Age Bracket | Public School | Private School |
| 3 to 4 Year Olds | 0 (0.0%) | 106 (100.0%) |
| 5 to 9 Year Old | 210 (96.8%) | 7 (3.2%) |
| 10 to 14 Year Olds | 106 (63.1%) | 62 (36.9%) |
| 15 to 17 Year Olds | 79 (91.9%) | 7 (8.1%) |
| 18 to 19 Year Olds | 74 (88.1%) | 10 (11.9%) |
| 20 to 24 Year Olds | 85 (94.4%) | 5 (5.6%) |
| 25 to 34 Year Olds | 28 (100.0%) | 0 (0.0%) |
| 35 Years and over | 26 (100.0%) | 0 (0.0%) |
| Total | 608 (75.5%) | 197 (24.5%) |
Educational Attainment by Field of Study in El Lago
Business (245 | 18.7%), science & technology (208 | 15.9%), engineering (194 | 14.8%), physical & health sciences (173 | 13.2%), and computers & mathematics (124 | 9.5%) are the most common fields of study among 1,309 individuals in El Lago who have obtained a bachelor's degree or higher.
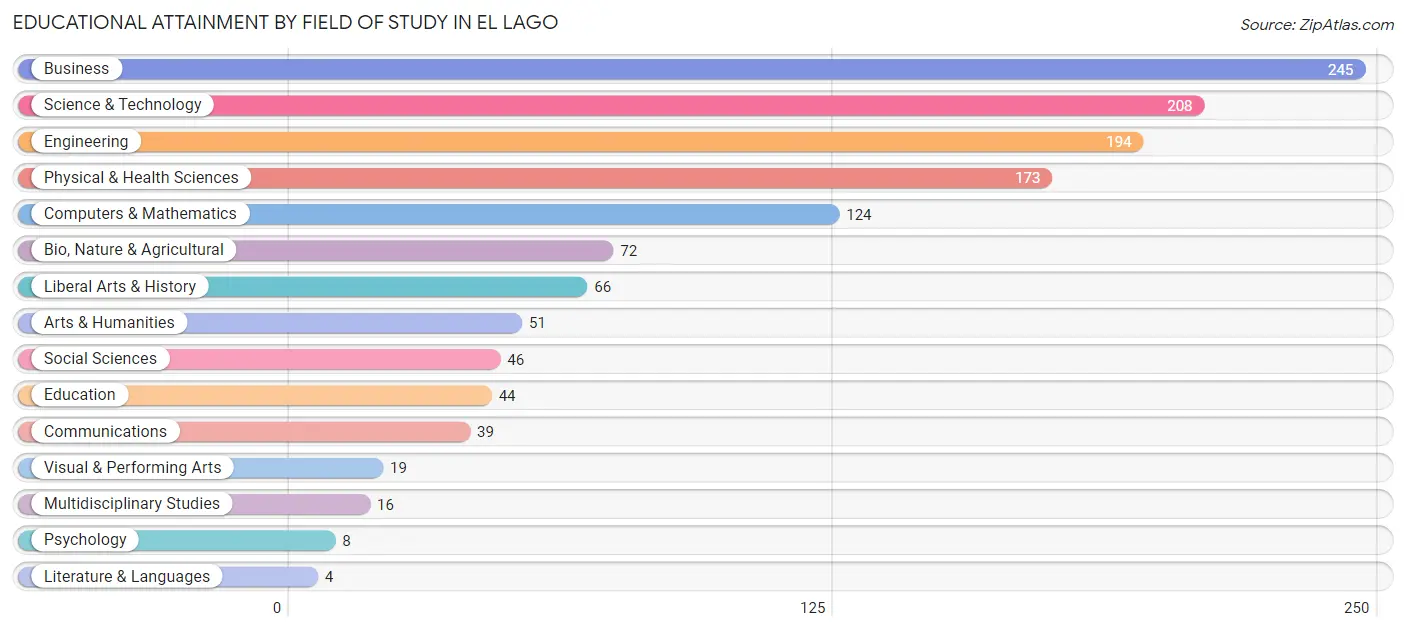
| Field of Study | # Graduates | % Graduates |
| Computers & Mathematics | 124 | 9.5% |
| Bio, Nature & Agricultural | 72 | 5.5% |
| Physical & Health Sciences | 173 | 13.2% |
| Psychology | 8 | 0.6% |
| Social Sciences | 46 | 3.5% |
| Engineering | 194 | 14.8% |
| Multidisciplinary Studies | 16 | 1.2% |
| Science & Technology | 208 | 15.9% |
| Business | 245 | 18.7% |
| Education | 44 | 3.4% |
| Literature & Languages | 4 | 0.3% |
| Liberal Arts & History | 66 | 5.0% |
| Visual & Performing Arts | 19 | 1.5% |
| Communications | 39 | 3.0% |
| Arts & Humanities | 51 | 3.9% |
| Total | 1,309 | 100.0% |
Transportation & Commute in El Lago
Vehicle Availability by Sex in El Lago
The most prevalent vehicle ownership categories in El Lago are males with 2 vehicles (353, accounting for 42.7%) and females with 2 vehicles (294, making up 46.3%).
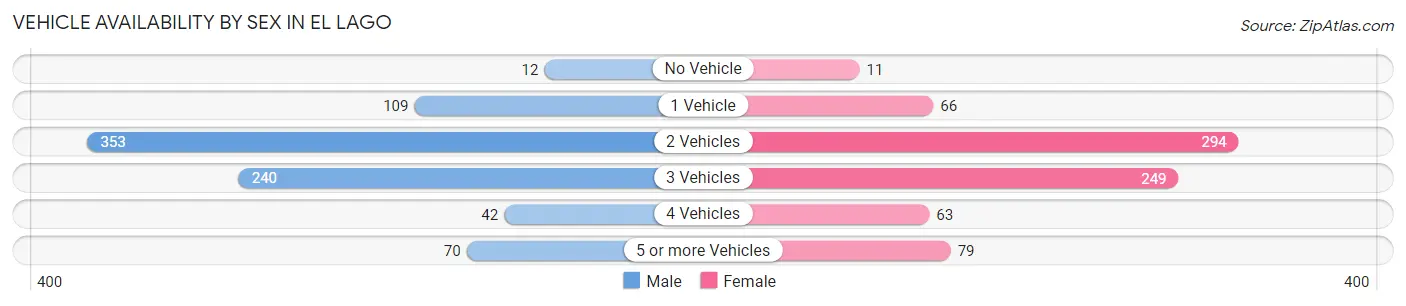
| Vehicles Available | Male | Female |
| No Vehicle | 12 (1.5%) | 11 (1.4%) |
| 1 Vehicle | 109 (13.2%) | 66 (8.7%) |
| 2 Vehicles | 353 (42.7%) | 294 (38.6%) |
| 3 Vehicles | 240 (29.1%) | 249 (32.7%) |
| 4 Vehicles | 42 (5.1%) | 63 (8.3%) |
| 5 or more Vehicles | 70 (8.5%) | 79 (10.4%) |
| Total | 826 (100.0%) | 762 (100.0%) |
Commute Time in El Lago
The most frequently occuring commute durations in El Lago are 15 to 19 minutes (275 commuters, 19.2%), 45 to 59 minutes (166 commuters, 11.6%), and 60 to 89 minutes (163 commuters, 11.4%).
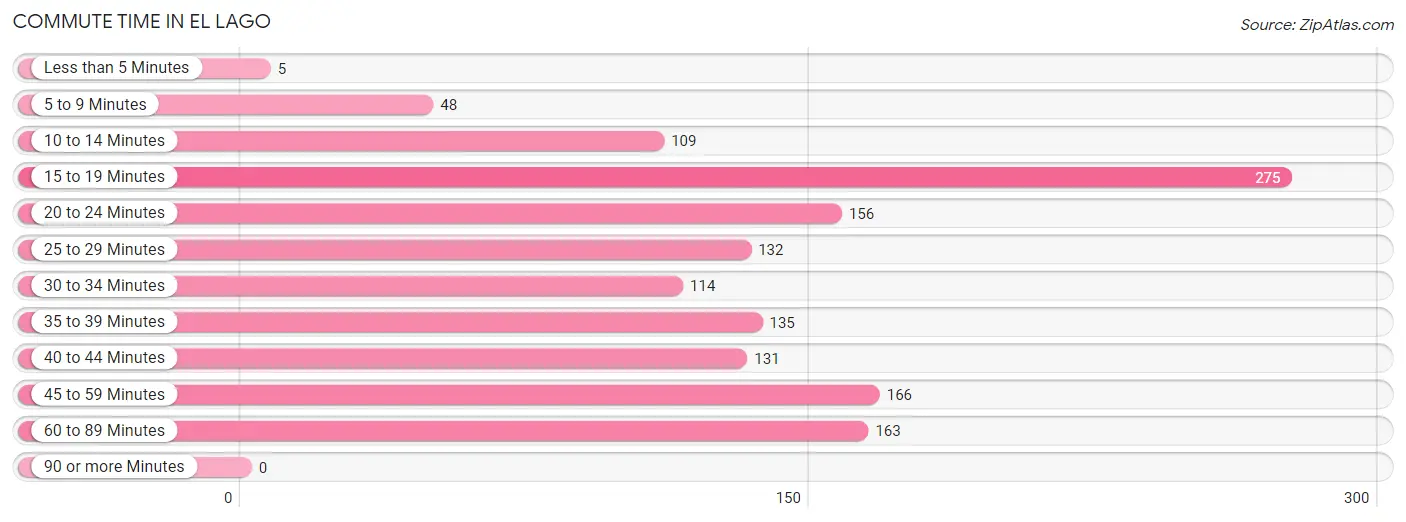
| Commute Time | # Commuters | % Commuters |
| Less than 5 Minutes | 5 | 0.4% |
| 5 to 9 Minutes | 48 | 3.4% |
| 10 to 14 Minutes | 109 | 7.6% |
| 15 to 19 Minutes | 275 | 19.2% |
| 20 to 24 Minutes | 156 | 10.9% |
| 25 to 29 Minutes | 132 | 9.2% |
| 30 to 34 Minutes | 114 | 8.0% |
| 35 to 39 Minutes | 135 | 9.4% |
| 40 to 44 Minutes | 131 | 9.1% |
| 45 to 59 Minutes | 166 | 11.6% |
| 60 to 89 Minutes | 163 | 11.4% |
| 90 or more Minutes | 0 | 0.0% |
Commute Time by Sex in El Lago
The most common commute times in El Lago are 15 to 19 minutes (159 commuters, 21.9%) for males and 15 to 19 minutes (116 commuters, 16.4%) for females.
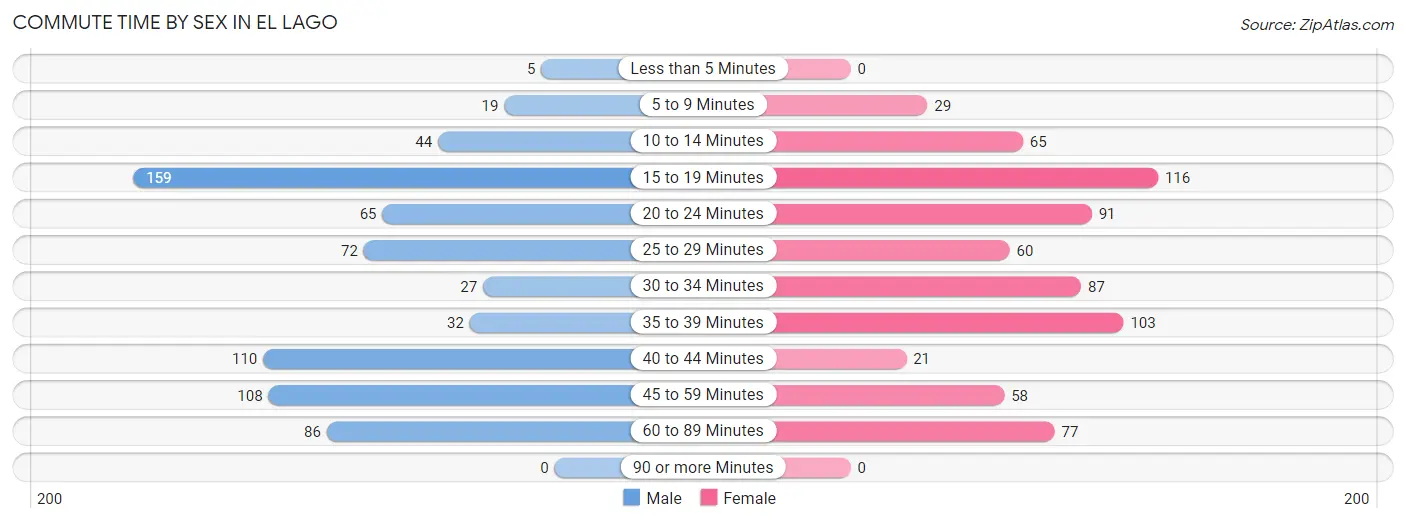
| Commute Time | Male | Female |
| Less than 5 Minutes | 5 (0.7%) | 0 (0.0%) |
| 5 to 9 Minutes | 19 (2.6%) | 29 (4.1%) |
| 10 to 14 Minutes | 44 (6.0%) | 65 (9.2%) |
| 15 to 19 Minutes | 159 (21.9%) | 116 (16.4%) |
| 20 to 24 Minutes | 65 (8.9%) | 91 (12.9%) |
| 25 to 29 Minutes | 72 (9.9%) | 60 (8.5%) |
| 30 to 34 Minutes | 27 (3.7%) | 87 (12.3%) |
| 35 to 39 Minutes | 32 (4.4%) | 103 (14.6%) |
| 40 to 44 Minutes | 110 (15.1%) | 21 (3.0%) |
| 45 to 59 Minutes | 108 (14.9%) | 58 (8.2%) |
| 60 to 89 Minutes | 86 (11.8%) | 77 (10.9%) |
| 90 or more Minutes | 0 (0.0%) | 0 (0.0%) |
Time of Departure to Work by Sex in El Lago
The most frequent times of departure to work in El Lago are 9:00 AM to 9:59 AM (118, 16.2%) for males and 12:00 AM to 4:59 AM (119, 16.8%) for females.
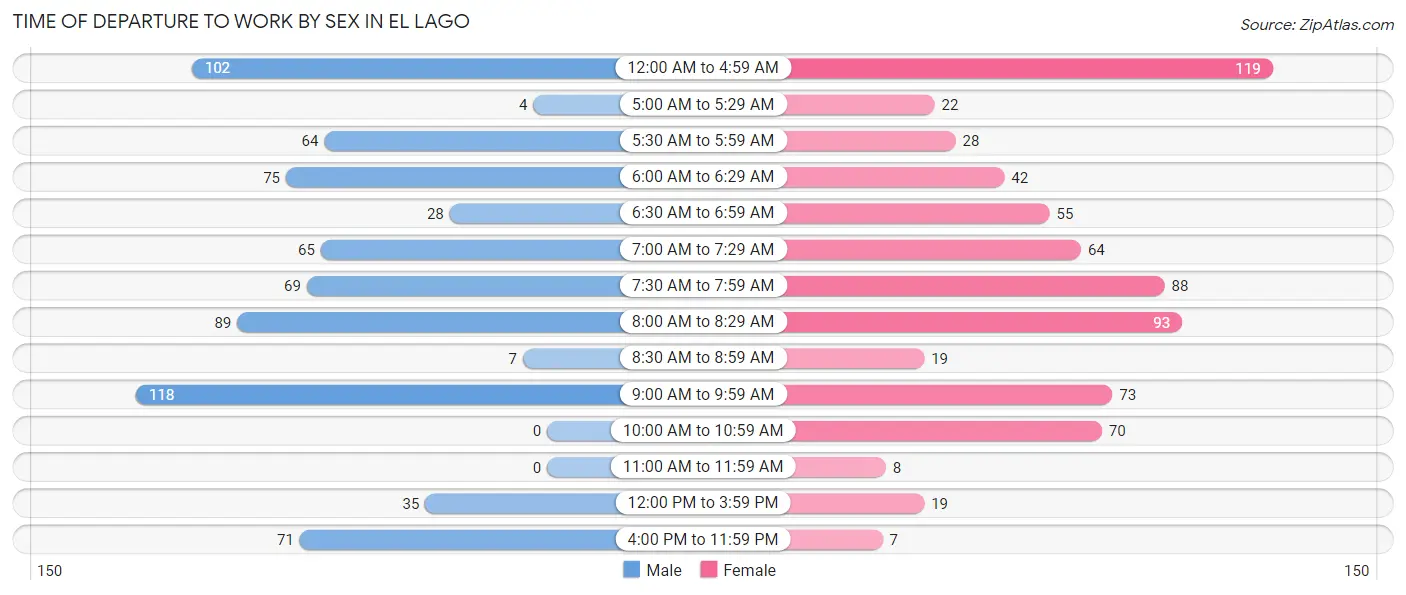
| Time of Departure | Male | Female |
| 12:00 AM to 4:59 AM | 102 (14.0%) | 119 (16.8%) |
| 5:00 AM to 5:29 AM | 4 (0.5%) | 22 (3.1%) |
| 5:30 AM to 5:59 AM | 64 (8.8%) | 28 (4.0%) |
| 6:00 AM to 6:29 AM | 75 (10.3%) | 42 (5.9%) |
| 6:30 AM to 6:59 AM | 28 (3.8%) | 55 (7.8%) |
| 7:00 AM to 7:29 AM | 65 (8.9%) | 64 (9.0%) |
| 7:30 AM to 7:59 AM | 69 (9.5%) | 88 (12.4%) |
| 8:00 AM to 8:29 AM | 89 (12.2%) | 93 (13.2%) |
| 8:30 AM to 8:59 AM | 7 (1.0%) | 19 (2.7%) |
| 9:00 AM to 9:59 AM | 118 (16.2%) | 73 (10.3%) |
| 10:00 AM to 10:59 AM | 0 (0.0%) | 70 (9.9%) |
| 11:00 AM to 11:59 AM | 0 (0.0%) | 8 (1.1%) |
| 12:00 PM to 3:59 PM | 35 (4.8%) | 19 (2.7%) |
| 4:00 PM to 11:59 PM | 71 (9.8%) | 7 (1.0%) |
| Total | 727 (100.0%) | 707 (100.0%) |
Housing Occupancy in El Lago
Occupancy by Ownership in El Lago
Of the total 1,183 dwellings in El Lago, owner-occupied units account for 986 (83.4%), while renter-occupied units make up 197 (16.7%).
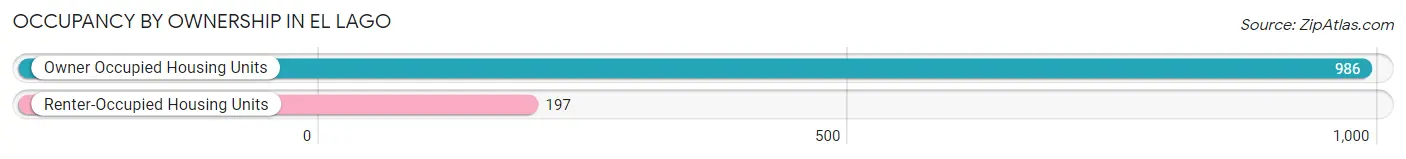
| Occupancy | # Housing Units | % Housing Units |
| Owner Occupied Housing Units | 986 | 83.4% |
| Renter-Occupied Housing Units | 197 | 16.7% |
| Total Occupied Housing Units | 1,183 | 100.0% |
Occupancy by Household Size in El Lago
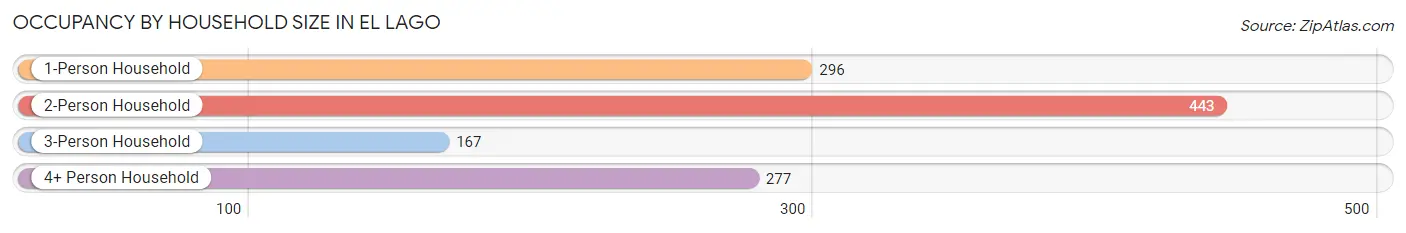
| Household Size | # Housing Units | % Housing Units |
| 1-Person Household | 296 | 25.0% |
| 2-Person Household | 443 | 37.4% |
| 3-Person Household | 167 | 14.1% |
| 4+ Person Household | 277 | 23.4% |
| Total Housing Units | 1,183 | 100.0% |
Occupancy by Ownership by Household Size in El Lago
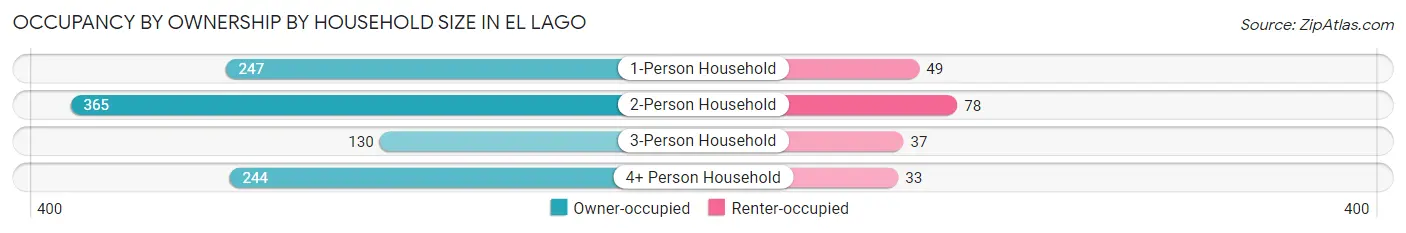
| Household Size | Owner-occupied | Renter-occupied |
| 1-Person Household | 247 (83.5%) | 49 (16.6%) |
| 2-Person Household | 365 (82.4%) | 78 (17.6%) |
| 3-Person Household | 130 (77.8%) | 37 (22.2%) |
| 4+ Person Household | 244 (88.1%) | 33 (11.9%) |
| Total Housing Units | 986 (83.4%) | 197 (16.7%) |
Occupancy by Educational Attainment in El Lago
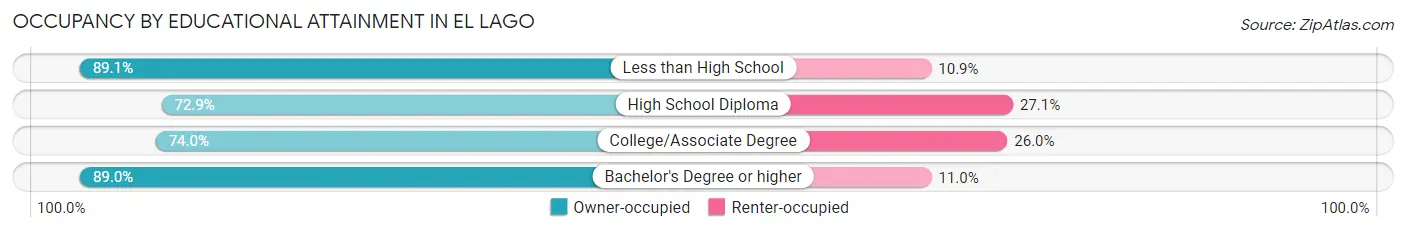
| Household Size | Owner-occupied | Renter-occupied |
| Less than High School | 57 (89.1%) | 7 (10.9%) |
| High School Diploma | 102 (72.9%) | 38 (27.1%) |
| College/Associate Degree | 219 (74.0%) | 77 (26.0%) |
| Bachelor's Degree or higher | 608 (89.0%) | 75 (11.0%) |
Occupancy by Age of Householder in El Lago
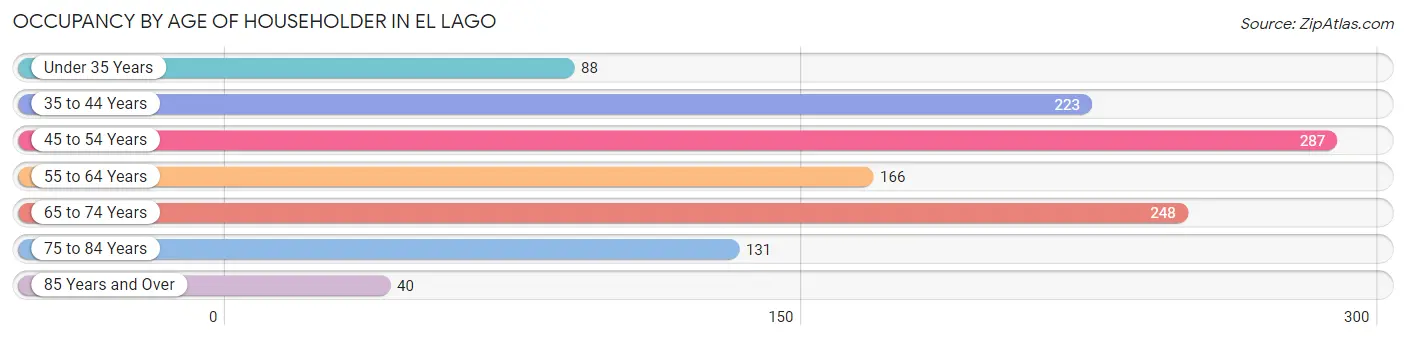
| Age Bracket | # Households | % Households |
| Under 35 Years | 88 | 7.4% |
| 35 to 44 Years | 223 | 18.9% |
| 45 to 54 Years | 287 | 24.3% |
| 55 to 64 Years | 166 | 14.0% |
| 65 to 74 Years | 248 | 21.0% |
| 75 to 84 Years | 131 | 11.1% |
| 85 Years and Over | 40 | 3.4% |
| Total | 1,183 | 100.0% |
Housing Finances in El Lago
Median Income by Occupancy in El Lago
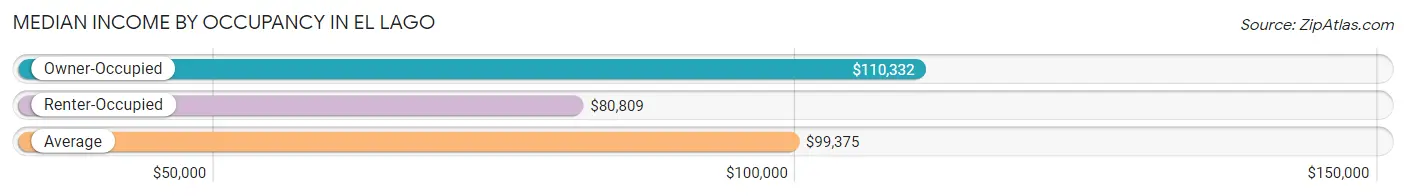
| Occupancy Type | # Households | Median Income |
| Owner-Occupied | 986 (83.4%) | $110,332 |
| Renter-Occupied | 197 (16.7%) | $80,809 |
| Average | 1,183 (100.0%) | $99,375 |
Occupancy by Householder Income Bracket in El Lago
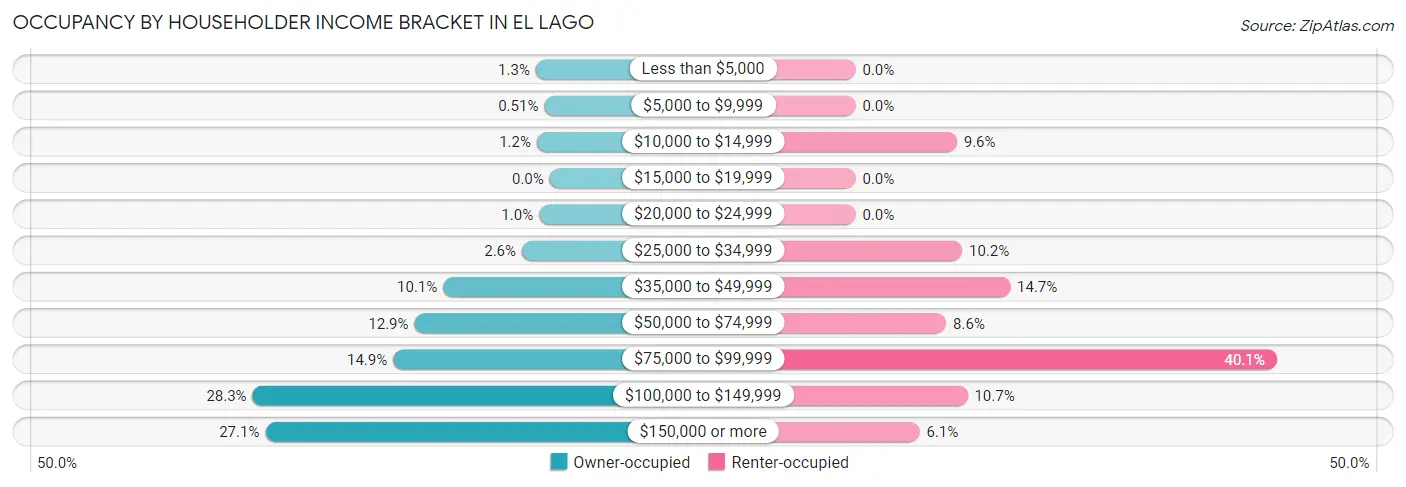
| Income Bracket | Owner-occupied | Renter-occupied |
| Less than $5,000 | 13 (1.3%) | 0 (0.0%) |
| $5,000 to $9,999 | 5 (0.5%) | 0 (0.0%) |
| $10,000 to $14,999 | 12 (1.2%) | 19 (9.6%) |
| $15,000 to $19,999 | 0 (0.0%) | 0 (0.0%) |
| $20,000 to $24,999 | 10 (1.0%) | 0 (0.0%) |
| $25,000 to $34,999 | 26 (2.6%) | 20 (10.2%) |
| $35,000 to $49,999 | 100 (10.1%) | 29 (14.7%) |
| $50,000 to $74,999 | 127 (12.9%) | 17 (8.6%) |
| $75,000 to $99,999 | 147 (14.9%) | 79 (40.1%) |
| $100,000 to $149,999 | 279 (28.3%) | 21 (10.7%) |
| $150,000 or more | 267 (27.1%) | 12 (6.1%) |
| Total | 986 (100.0%) | 197 (100.0%) |
Monthly Housing Cost Tiers in El Lago
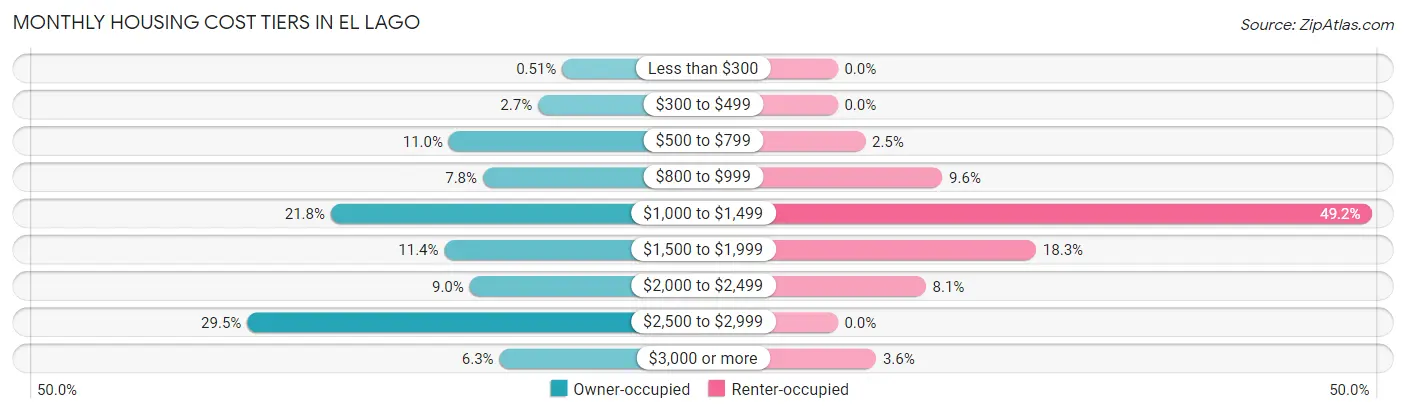
| Monthly Cost | Owner-occupied | Renter-occupied |
| Less than $300 | 5 (0.5%) | 0 (0.0%) |
| $300 to $499 | 27 (2.7%) | 0 (0.0%) |
| $500 to $799 | 108 (11.0%) | 5 (2.5%) |
| $800 to $999 | 77 (7.8%) | 19 (9.6%) |
| $1,000 to $1,499 | 215 (21.8%) | 97 (49.2%) |
| $1,500 to $1,999 | 112 (11.4%) | 36 (18.3%) |
| $2,000 to $2,499 | 89 (9.0%) | 16 (8.1%) |
| $2,500 to $2,999 | 291 (29.5%) | 0 (0.0%) |
| $3,000 or more | 62 (6.3%) | 7 (3.5%) |
| Total | 986 (100.0%) | 197 (100.0%) |
Physical Housing Characteristics in El Lago
Housing Structures in El Lago
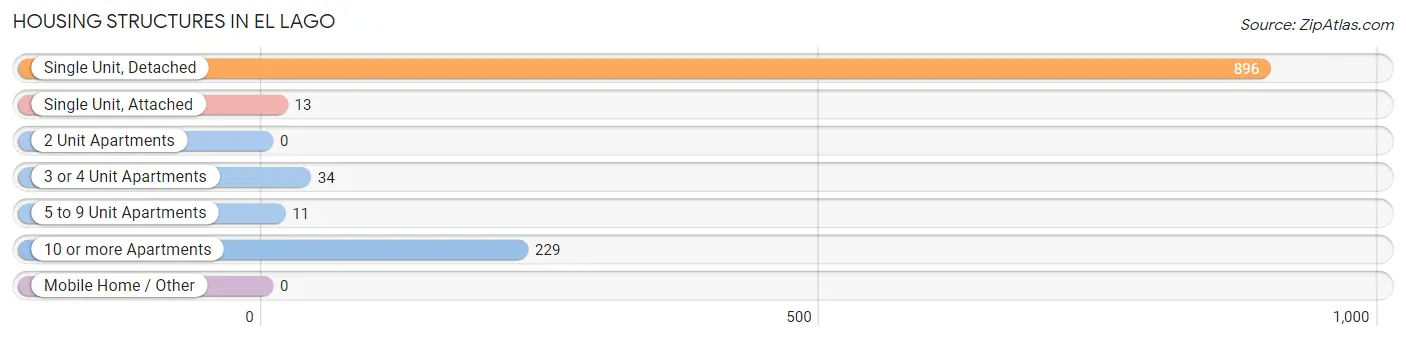
| Structure Type | # Housing Units | % Housing Units |
| Single Unit, Detached | 896 | 75.7% |
| Single Unit, Attached | 13 | 1.1% |
| 2 Unit Apartments | 0 | 0.0% |
| 3 or 4 Unit Apartments | 34 | 2.9% |
| 5 to 9 Unit Apartments | 11 | 0.9% |
| 10 or more Apartments | 229 | 19.4% |
| Mobile Home / Other | 0 | 0.0% |
| Total | 1,183 | 100.0% |
Housing Structures by Occupancy in El Lago
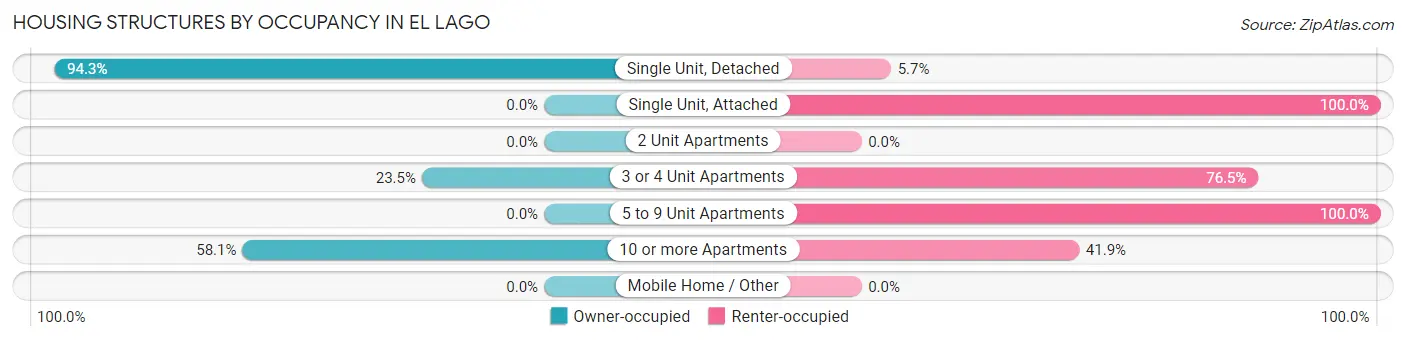
| Structure Type | Owner-occupied | Renter-occupied |
| Single Unit, Detached | 845 (94.3%) | 51 (5.7%) |
| Single Unit, Attached | 0 (0.0%) | 13 (100.0%) |
| 2 Unit Apartments | 0 (0.0%) | 0 (0.0%) |
| 3 or 4 Unit Apartments | 8 (23.5%) | 26 (76.5%) |
| 5 to 9 Unit Apartments | 0 (0.0%) | 11 (100.0%) |
| 10 or more Apartments | 133 (58.1%) | 96 (41.9%) |
| Mobile Home / Other | 0 (0.0%) | 0 (0.0%) |
| Total | 986 (83.4%) | 197 (16.7%) |
Housing Structures by Number of Rooms in El Lago
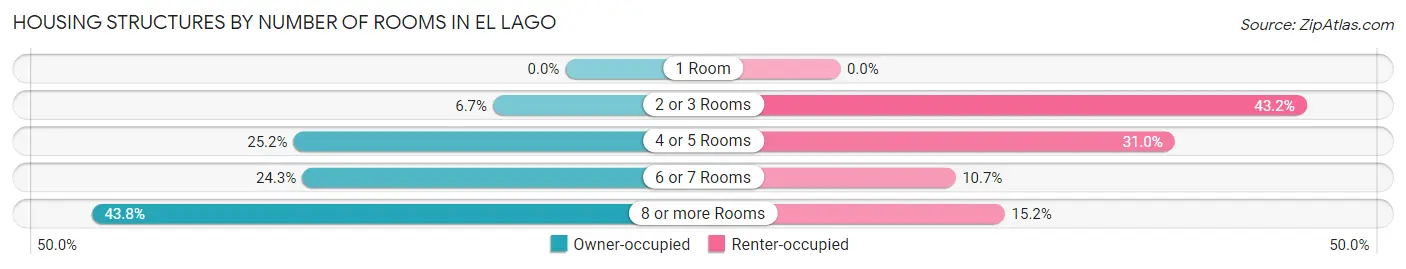
| Number of Rooms | Owner-occupied | Renter-occupied |
| 1 Room | 0 (0.0%) | 0 (0.0%) |
| 2 or 3 Rooms | 66 (6.7%) | 85 (43.1%) |
| 4 or 5 Rooms | 248 (25.2%) | 61 (31.0%) |
| 6 or 7 Rooms | 240 (24.3%) | 21 (10.7%) |
| 8 or more Rooms | 432 (43.8%) | 30 (15.2%) |
| Total | 986 (100.0%) | 197 (100.0%) |
Housing Structure by Heating Type in El Lago
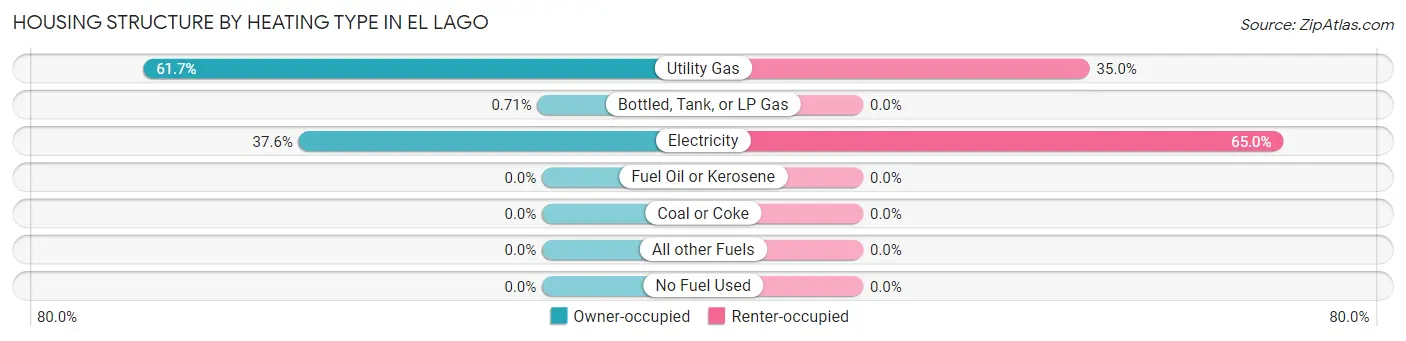
| Heating Type | Owner-occupied | Renter-occupied |
| Utility Gas | 608 (61.7%) | 69 (35.0%) |
| Bottled, Tank, or LP Gas | 7 (0.7%) | 0 (0.0%) |
| Electricity | 371 (37.6%) | 128 (65.0%) |
| Fuel Oil or Kerosene | 0 (0.0%) | 0 (0.0%) |
| Coal or Coke | 0 (0.0%) | 0 (0.0%) |
| All other Fuels | 0 (0.0%) | 0 (0.0%) |
| No Fuel Used | 0 (0.0%) | 0 (0.0%) |
| Total | 986 (100.0%) | 197 (100.0%) |
Household Vehicle Usage in El Lago
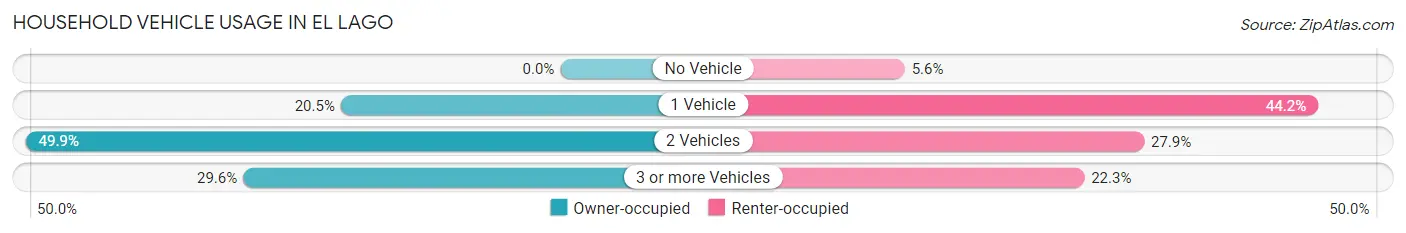
| Vehicles per Household | Owner-occupied | Renter-occupied |
| No Vehicle | 0 (0.0%) | 11 (5.6%) |
| 1 Vehicle | 202 (20.5%) | 87 (44.2%) |
| 2 Vehicles | 492 (49.9%) | 55 (27.9%) |
| 3 or more Vehicles | 292 (29.6%) | 44 (22.3%) |
| Total | 986 (100.0%) | 197 (100.0%) |
Real Estate & Mortgages in El Lago
Real Estate and Mortgage Overview in El Lago
| Characteristic | Without Mortgage | With Mortgage |
| Housing Units | 374 | 612 |
| Median Property Value | $268,200 | $322,800 |
| Median Household Income | $71,625 | $207 |
| Monthly Housing Costs | $921 | $62 |
| Real Estate Taxes | $4,105 | $0 |
Property Value by Mortgage Status in El Lago
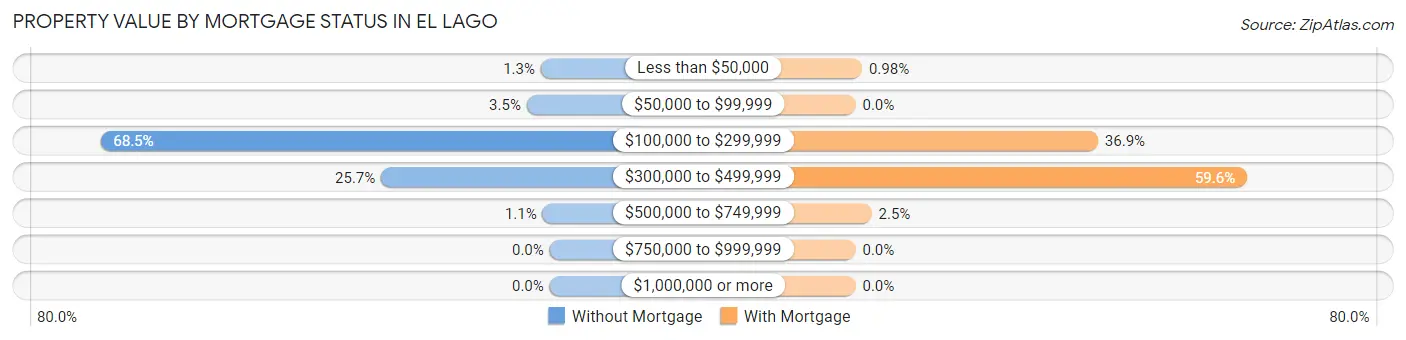
| Property Value | Without Mortgage | With Mortgage |
| Less than $50,000 | 5 (1.3%) | 6 (1.0%) |
| $50,000 to $99,999 | 13 (3.5%) | 0 (0.0%) |
| $100,000 to $299,999 | 256 (68.4%) | 226 (36.9%) |
| $300,000 to $499,999 | 96 (25.7%) | 365 (59.6%) |
| $500,000 to $749,999 | 4 (1.1%) | 15 (2.5%) |
| $750,000 to $999,999 | 0 (0.0%) | 0 (0.0%) |
| $1,000,000 or more | 0 (0.0%) | 0 (0.0%) |
| Total | 374 (100.0%) | 612 (100.0%) |
Household Income by Mortgage Status in El Lago
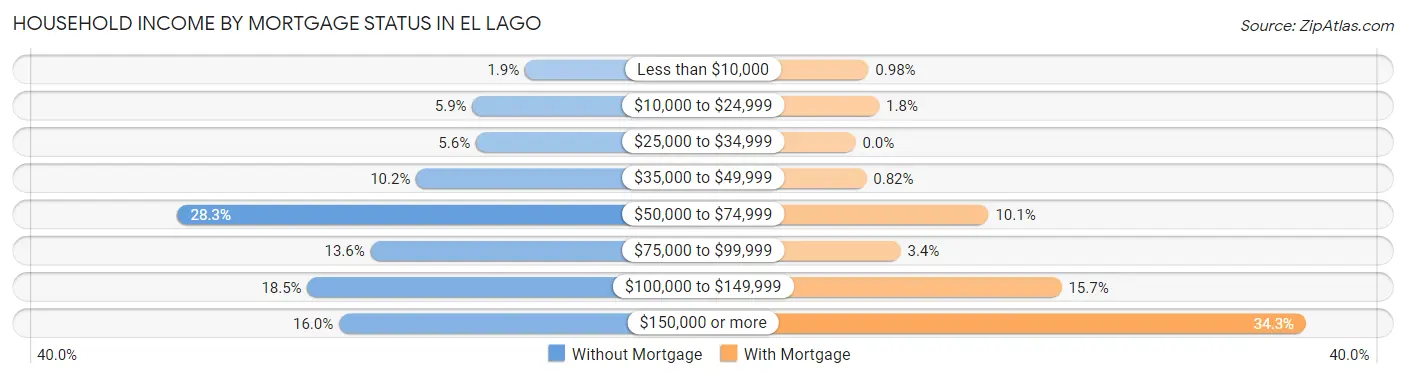
| Household Income | Without Mortgage | With Mortgage |
| Less than $10,000 | 7 (1.9%) | 6 (1.0%) |
| $10,000 to $24,999 | 22 (5.9%) | 11 (1.8%) |
| $25,000 to $34,999 | 21 (5.6%) | 0 (0.0%) |
| $35,000 to $49,999 | 38 (10.2%) | 5 (0.8%) |
| $50,000 to $74,999 | 106 (28.3%) | 62 (10.1%) |
| $75,000 to $99,999 | 51 (13.6%) | 21 (3.4%) |
| $100,000 to $149,999 | 69 (18.4%) | 96 (15.7%) |
| $150,000 or more | 60 (16.0%) | 210 (34.3%) |
| Total | 374 (100.0%) | 612 (100.0%) |
Property Value to Household Income Ratio in El Lago
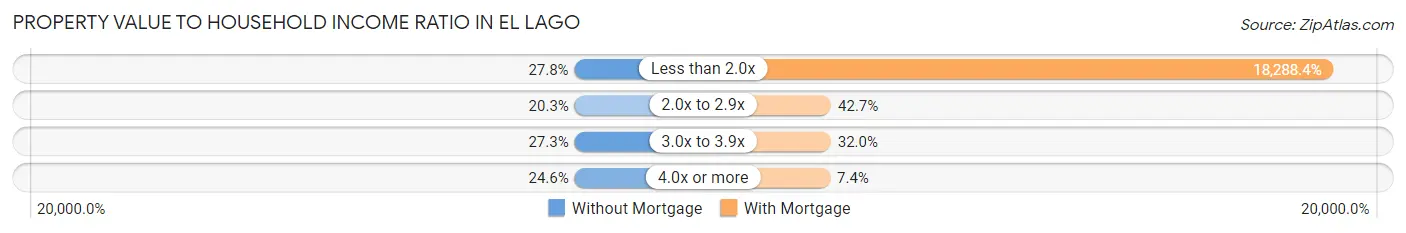
| Value-to-Income Ratio | Without Mortgage | With Mortgage |
| Less than 2.0x | 104 (27.8%) | 111,925 (18,288.4%) |
| 2.0x to 2.9x | 76 (20.3%) | 261 (42.6%) |
| 3.0x to 3.9x | 102 (27.3%) | 196 (32.0%) |
| 4.0x or more | 92 (24.6%) | 45 (7.3%) |
| Total | 374 (100.0%) | 612 (100.0%) |
Real Estate Taxes by Mortgage Status in El Lago

| Property Taxes | Without Mortgage | With Mortgage |
| Less than $800 | 17 (4.5%) | 6 (1.0%) |
| $800 to $1,499 | 30 (8.0%) | 12 (2.0%) |
| $800 to $1,499 | 315 (84.2%) | 0 (0.0%) |
| Total | 374 (100.0%) | 612 (100.0%) |
Health & Disability in El Lago
Health Insurance Coverage by Age in El Lago
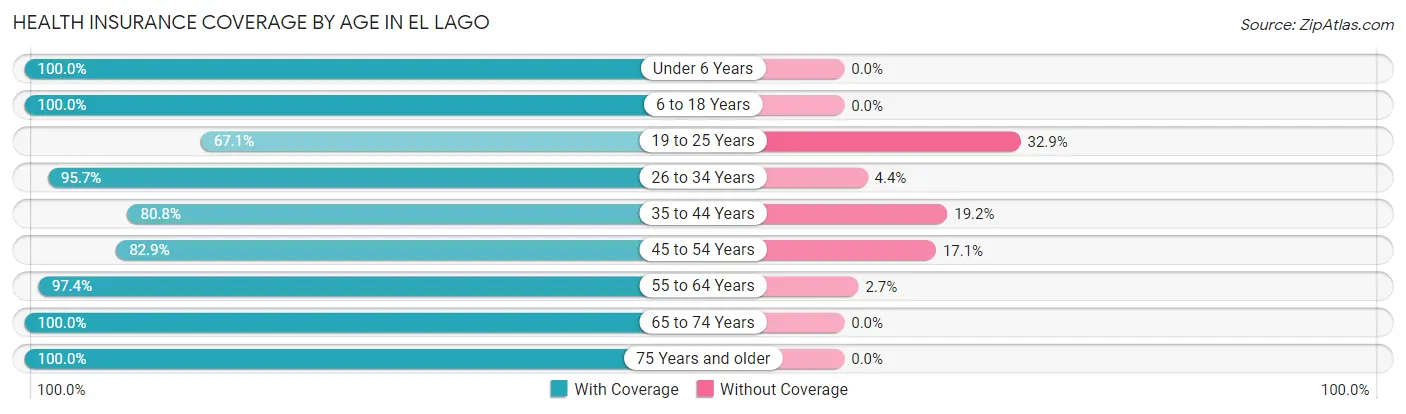
| Age Bracket | With Coverage | Without Coverage |
| Under 6 Years | 155 (100.0%) | 0 (0.0%) |
| 6 to 18 Years | 524 (100.0%) | 0 (0.0%) |
| 19 to 25 Years | 145 (67.1%) | 71 (32.9%) |
| 26 to 34 Years | 154 (95.7%) | 7 (4.3%) |
| 35 to 44 Years | 387 (80.8%) | 92 (19.2%) |
| 45 to 54 Years | 422 (82.9%) | 87 (17.1%) |
| 55 to 64 Years | 331 (97.4%) | 9 (2.6%) |
| 65 to 74 Years | 449 (100.0%) | 0 (0.0%) |
| 75 Years and older | 199 (100.0%) | 0 (0.0%) |
| Total | 2,766 (91.2%) | 266 (8.8%) |
Health Insurance Coverage by Citizenship Status in El Lago

| Citizenship Status | With Coverage | Without Coverage |
| Native Born | 155 (100.0%) | 0 (0.0%) |
| Foreign Born, Citizen | 524 (100.0%) | 0 (0.0%) |
| Foreign Born, not a Citizen | 145 (67.1%) | 71 (32.9%) |
Health Insurance Coverage by Household Income in El Lago
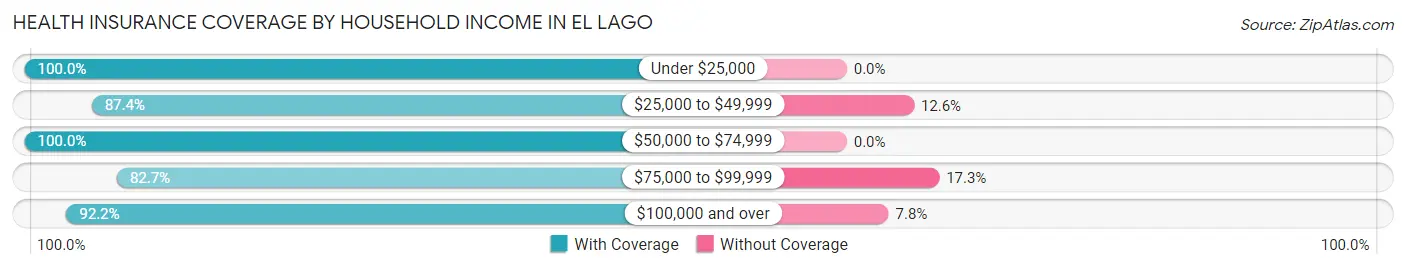
| Household Income | With Coverage | Without Coverage |
| Under $25,000 | 87 (100.0%) | 0 (0.0%) |
| $25,000 to $49,999 | 264 (87.4%) | 38 (12.6%) |
| $50,000 to $74,999 | 284 (100.0%) | 0 (0.0%) |
| $75,000 to $99,999 | 387 (82.7%) | 81 (17.3%) |
| $100,000 and over | 1,731 (92.2%) | 147 (7.8%) |
Public vs Private Health Insurance Coverage by Age in El Lago
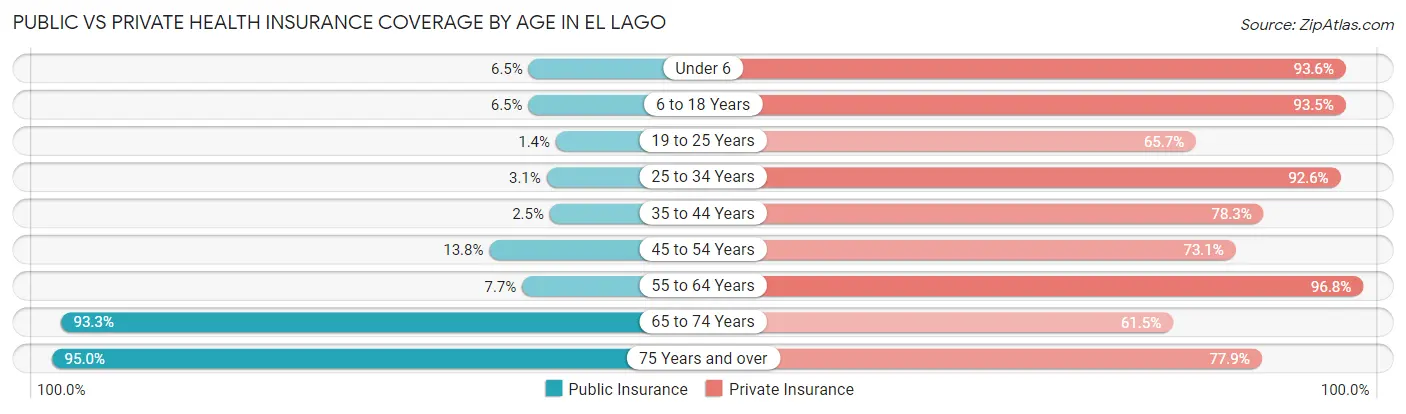
| Age Bracket | Public Insurance | Private Insurance |
| Under 6 | 10 (6.5%) | 145 (93.5%) |
| 6 to 18 Years | 34 (6.5%) | 490 (93.5%) |
| 19 to 25 Years | 3 (1.4%) | 142 (65.7%) |
| 25 to 34 Years | 5 (3.1%) | 149 (92.5%) |
| 35 to 44 Years | 12 (2.5%) | 375 (78.3%) |
| 45 to 54 Years | 70 (13.8%) | 372 (73.1%) |
| 55 to 64 Years | 26 (7.6%) | 329 (96.8%) |
| 65 to 74 Years | 419 (93.3%) | 276 (61.5%) |
| 75 Years and over | 189 (95.0%) | 155 (77.9%) |
| Total | 768 (25.3%) | 2,433 (80.2%) |
Disability Status by Sex by Age in El Lago
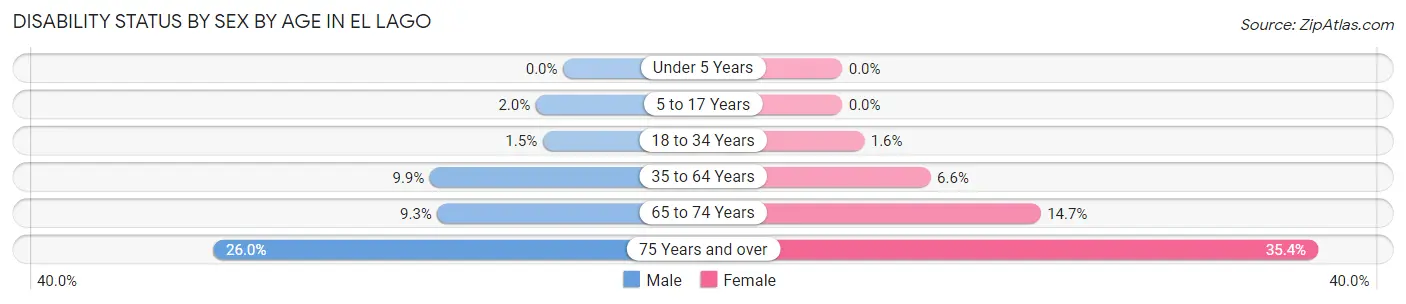
| Age Bracket | Male | Female |
| Under 5 Years | 0 (0.0%) | 0 (0.0%) |
| 5 to 17 Years | 5 (2.0%) | 0 (0.0%) |
| 18 to 34 Years | 3 (1.5%) | 4 (1.6%) |
| 35 to 64 Years | 65 (9.9%) | 44 (6.6%) |
| 65 to 74 Years | 21 (9.3%) | 33 (14.7%) |
| 75 Years and over | 26 (26.0%) | 35 (35.3%) |
Disability Class by Sex by Age in El Lago
Disability Class: Hearing Difficulty
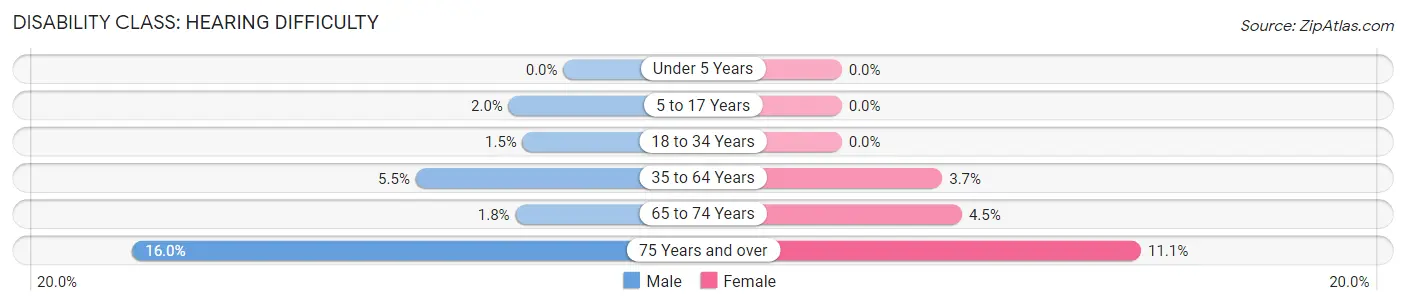
| Age Bracket | Male | Female |
| Under 5 Years | 0 (0.0%) | 0 (0.0%) |
| 5 to 17 Years | 5 (2.0%) | 0 (0.0%) |
| 18 to 34 Years | 3 (1.5%) | 0 (0.0%) |
| 35 to 64 Years | 36 (5.5%) | 25 (3.7%) |
| 65 to 74 Years | 4 (1.8%) | 10 (4.5%) |
| 75 Years and over | 16 (16.0%) | 11 (11.1%) |
Disability Class: Vision Difficulty
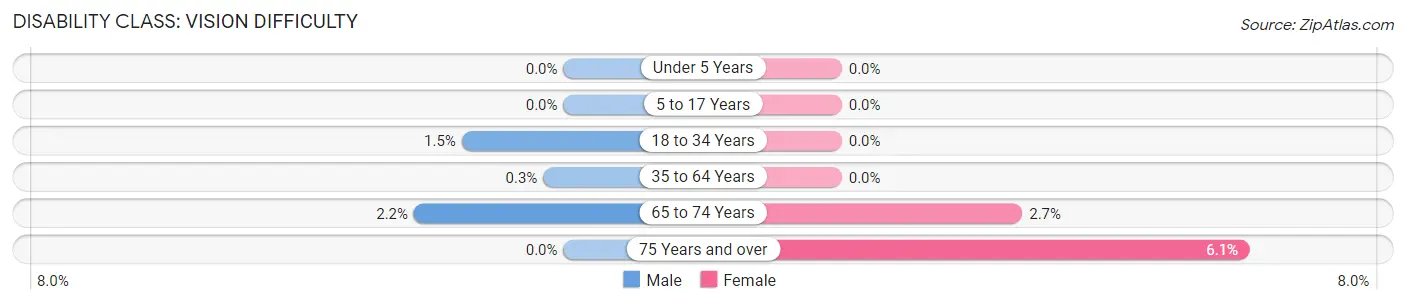
| Age Bracket | Male | Female |
| Under 5 Years | 0 (0.0%) | 0 (0.0%) |
| 5 to 17 Years | 0 (0.0%) | 0 (0.0%) |
| 18 to 34 Years | 3 (1.5%) | 0 (0.0%) |
| 35 to 64 Years | 2 (0.3%) | 0 (0.0%) |
| 65 to 74 Years | 5 (2.2%) | 6 (2.7%) |
| 75 Years and over | 0 (0.0%) | 6 (6.1%) |
Disability Class: Cognitive Difficulty
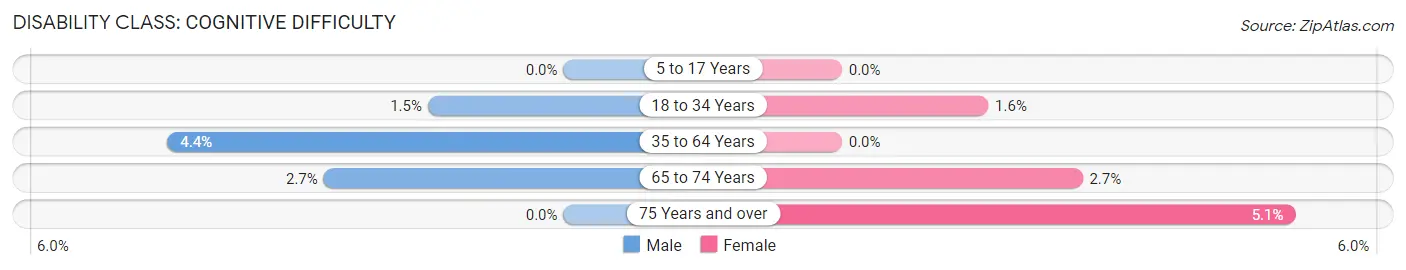
| Age Bracket | Male | Female |
| 5 to 17 Years | 0 (0.0%) | 0 (0.0%) |
| 18 to 34 Years | 3 (1.5%) | 4 (1.6%) |
| 35 to 64 Years | 29 (4.4%) | 0 (0.0%) |
| 65 to 74 Years | 6 (2.7%) | 6 (2.7%) |
| 75 Years and over | 0 (0.0%) | 5 (5.1%) |
Disability Class: Ambulatory Difficulty
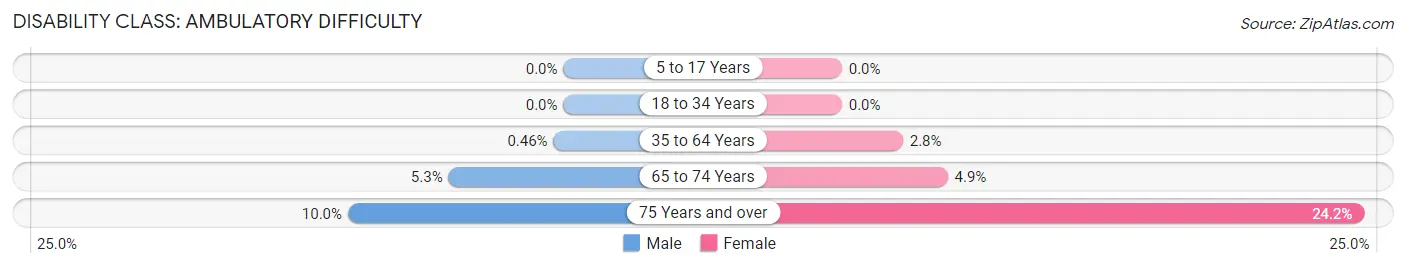
| Age Bracket | Male | Female |
| 5 to 17 Years | 0 (0.0%) | 0 (0.0%) |
| 18 to 34 Years | 0 (0.0%) | 0 (0.0%) |
| 35 to 64 Years | 3 (0.5%) | 19 (2.8%) |
| 65 to 74 Years | 12 (5.3%) | 11 (4.9%) |
| 75 Years and over | 10 (10.0%) | 24 (24.2%) |
Disability Class: Self-Care Difficulty
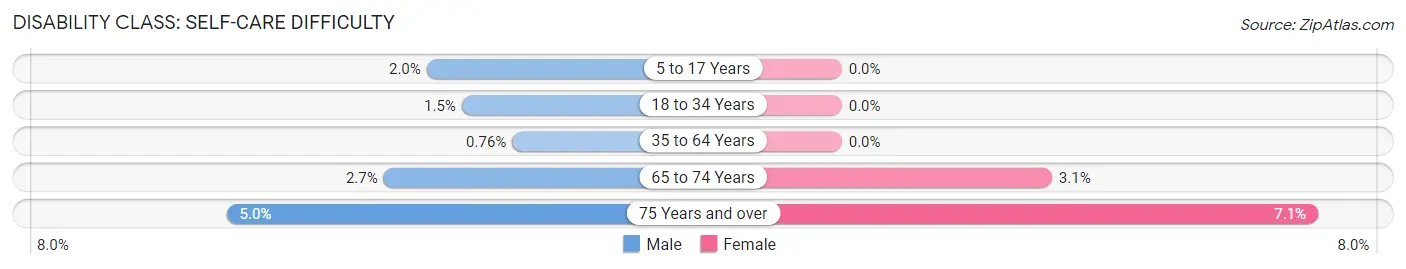
| Age Bracket | Male | Female |
| 5 to 17 Years | 5 (2.0%) | 0 (0.0%) |
| 18 to 34 Years | 3 (1.5%) | 0 (0.0%) |
| 35 to 64 Years | 5 (0.8%) | 0 (0.0%) |
| 65 to 74 Years | 6 (2.7%) | 7 (3.1%) |
| 75 Years and over | 5 (5.0%) | 7 (7.1%) |
Technology Access in El Lago
Computing Device Access in El Lago
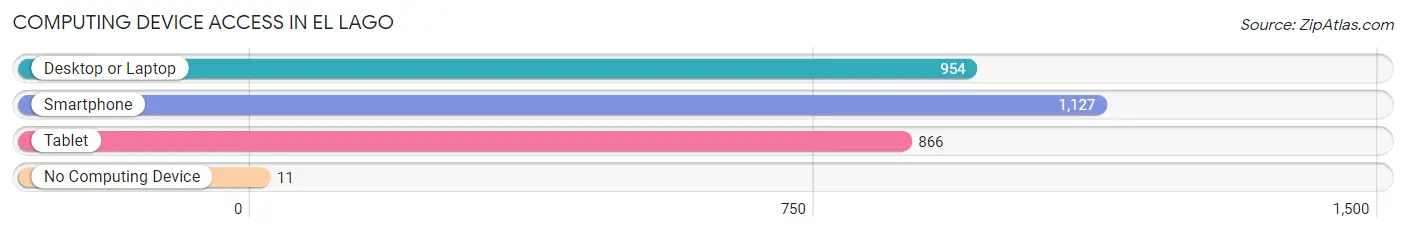
| Device Type | # Households | % Households |
| Desktop or Laptop | 954 | 80.6% |
| Smartphone | 1,127 | 95.3% |
| Tablet | 866 | 73.2% |
| No Computing Device | 11 | 0.9% |
| Total | 1,183 | 100.0% |
Internet Access in El Lago
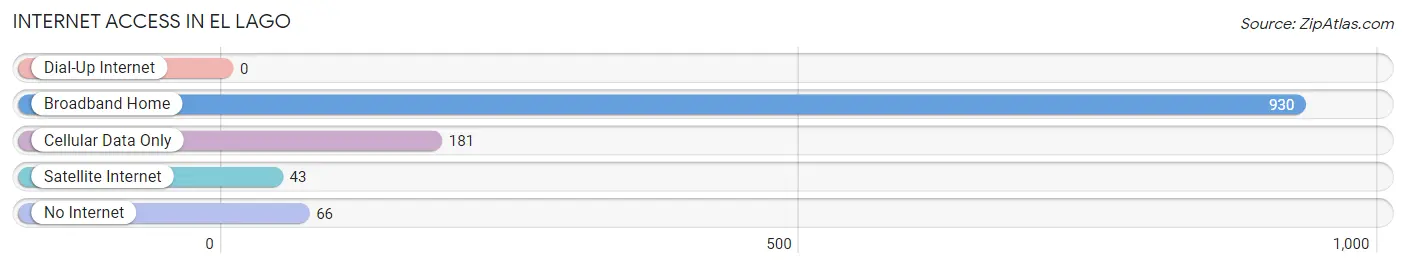
| Internet Type | # Households | % Households |
| Dial-Up Internet | 0 | 0.0% |
| Broadband Home | 930 | 78.6% |
| Cellular Data Only | 181 | 15.3% |
| Satellite Internet | 43 | 3.6% |
| No Internet | 66 | 5.6% |
| Total | 1,183 | 100.0% |
El Lago Summary
El Lago is a small city located in Harris County, Texas, United States. It is situated on the western shore of Galveston Bay, approximately 20 miles southeast of Houston. The city was incorporated in 1954 and has a population of approximately 3,000 people.
History
The area that is now El Lago was originally inhabited by the Karankawa Indians. The first European settlers arrived in the area in the early 1800s. The settlement was originally known as Clear Lake, and was later renamed El Lago, which is Spanish for “the lake.”
In the early 1900s, the area was a popular vacation spot for wealthy Houstonians. The city was incorporated in 1954 and has since grown to become a residential community.
Geography
El Lago is located in Harris County, Texas, approximately 20 miles southeast of Houston. The city is situated on the western shore of Galveston Bay, and is bordered by Clear Lake City to the north, Taylor Lake Village to the east, and Seabrook to the south.
The city has a total area of 1.3 square miles, all of which is land. The terrain is mostly flat, with some areas of marshland. The climate is humid subtropical, with hot summers and mild winters.
Economy
The economy of El Lago is largely based on the oil and gas industry. The city is home to several oil and gas companies, including Shell Oil Company, Chevron Corporation, and ExxonMobil.
The city is also home to several aerospace companies, including NASA’s Johnson Space Center and the United Space Alliance. The city is also home to several retail stores, restaurants, and other businesses.
Demographics
As of the 2010 census, El Lago had a population of 3,043. The racial makeup of the city was 79.3% White, 11.2% African American, 0.7% Native American, 2.2% Asian, 0.1% Pacific Islander, 4.2% from other races, and 2.4% from two or more races. Hispanic or Latino of any race were 11.7% of the population.
The median income for a household in El Lago was $60,938, and the median income for a family was $68,938. The per capita income for the city was $30,938. About 5.2% of families and 6.7% of the population were below the poverty line, including 8.2% of those under age 18 and 4.2% of those age 65 or over.
El Lago is a small city with a rich history and a diverse population. The city is home to several oil and gas companies, aerospace companies, and other businesses. The city has a humid subtropical climate and is a popular destination for vacationers and retirees. The city has a median income of $60,938 and a per capita income of $30,938.
Common Questions
What is Per Capita Income in El Lago?
Per Capita income in El Lago is $50,057.
What is the Median Family Income in El Lago?
Median Family Income in El Lago is $111,051.
What is the Median Household income in El Lago?
Median Household Income in El Lago is $99,375.
What is Income or Wage Gap in El Lago?
Income or Wage Gap in El Lago is 12.0%.
Women in El Lago earn 88.0 cents for every dollar earned by a man.
What is Inequality or Gini Index in El Lago?
Inequality or Gini Index in El Lago is 0.40.
What is the Total Population of El Lago?
Total Population of El Lago is 3,039.
What is the Total Male Population of El Lago?
Total Male Population of El Lago is 1,464.
What is the Total Female Population of El Lago?
Total Female Population of El Lago is 1,575.
What is the Ratio of Males per 100 Females in El Lago?
There are 92.95 Males per 100 Females in El Lago.
What is the Ratio of Females per 100 Males in El Lago?
There are 107.58 Females per 100 Males in El Lago.
What is the Median Population Age in El Lago?
Median Population Age in El Lago is 44.3 Years.
What is the Average Family Size in El Lago
Average Family Size in El Lago is 3.0 People.
What is the Average Household Size in El Lago
Average Household Size in El Lago is 2.6 People.
How Large is the Labor Force in El Lago?
There are 1,640 People in the Labor Forcein in El Lago.
What is the Percentage of People in the Labor Force in El Lago?
65.9% of People are in the Labor Force in El Lago.
What is the Unemployment Rate in El Lago?
Unemployment Rate in El Lago is 2.8%.