Zip Codes with the Highest Percentage of Population Employed in Architecture & Engineering in Paris, TX
RELATED REPORTS & OPTIONS
Architecture & Engineering
Paris
Compare Zip Codes
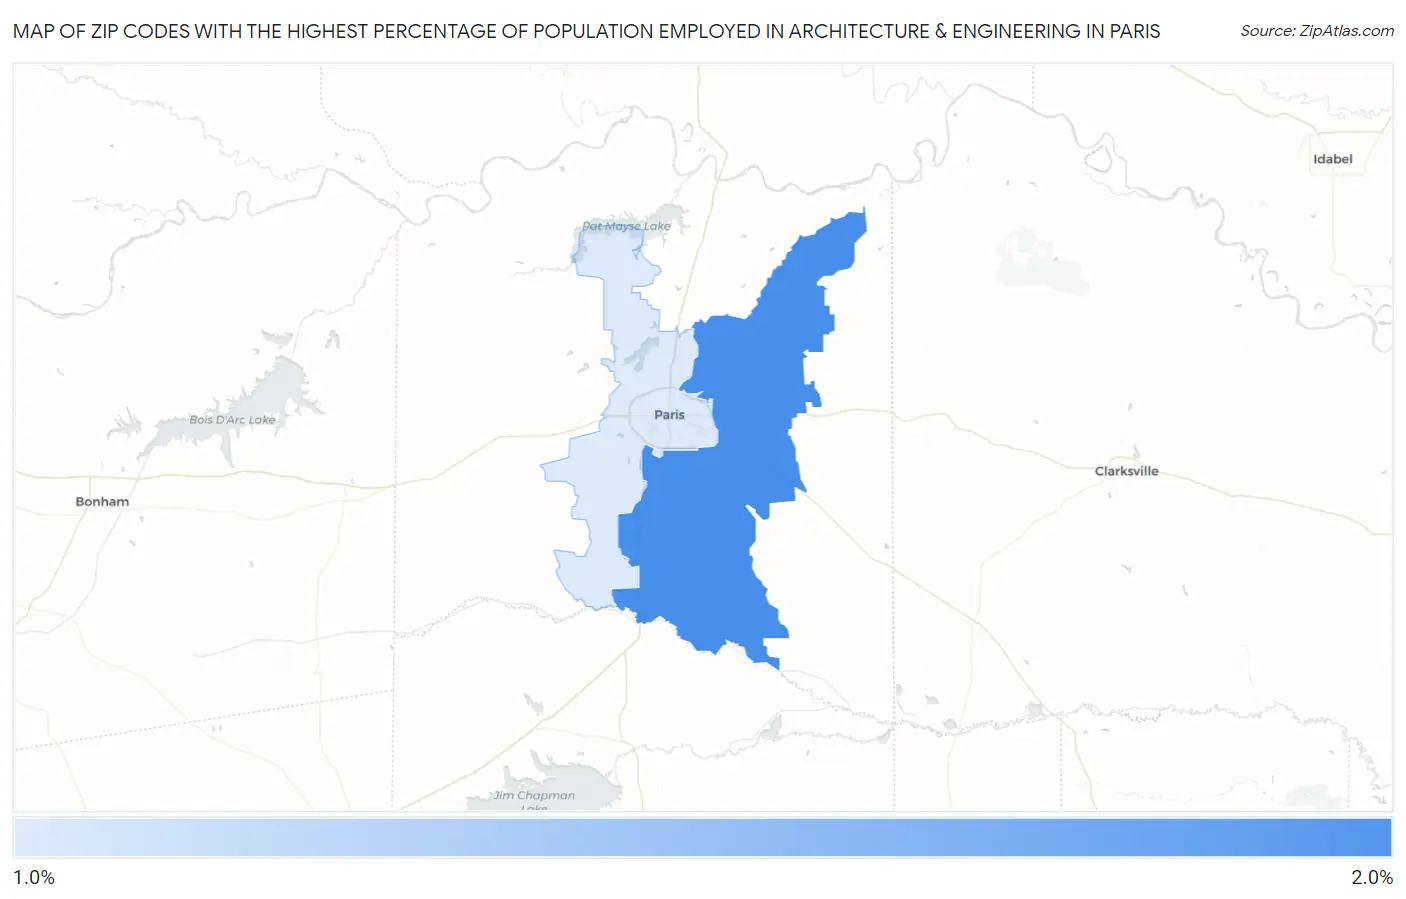
Map of Zip Codes with the Highest Percentage of Population Employed in Architecture & Engineering in Paris
1.6%
1.9%
Zip Codes with the Highest Percentage of Population Employed in Architecture & Engineering in Paris, TX
| Zip Code | % Employed | vs State | vs National | |
| 1. | 75462 | 1.9% | 2.2%(-0.277)#543 | 2.1%(-0.204)#9,947 |
| 2. | 75460 | 1.6% | 2.2%(-0.629)#674 | 2.1%(-0.556)#12,237 |
1
Common Questions
What are the Top Zip Codes with the Highest Percentage of Population Employed in Architecture & Engineering in Paris, TX?
Top Zip Codes with the Highest Percentage of Population Employed in Architecture & Engineering in Paris, TX are:
What zip code has the Highest Percentage of Population Employed in Architecture & Engineering in Paris, TX?
75462 has the Highest Percentage of Population Employed in Architecture & Engineering in Paris, TX with 1.9%.
What is the Percentage of Population Employed in Architecture & Engineering in Paris, TX?
Percentage of Population Employed in Architecture & Engineering in Paris is 1.7%.
What is the Percentage of Population Employed in Architecture & Engineering in Texas?
Percentage of Population Employed in Architecture & Engineering in Texas is 2.2%.
What is the Percentage of Population Employed in Architecture & Engineering in the United States?
Percentage of Population Employed in Architecture & Engineering in the United States is 2.1%.