Zip Codes with the Highest Percentage of Population Employed in Architecture & Engineering in Cleburne, TX
RELATED REPORTS & OPTIONS
Architecture & Engineering
Cleburne
Compare Zip Codes
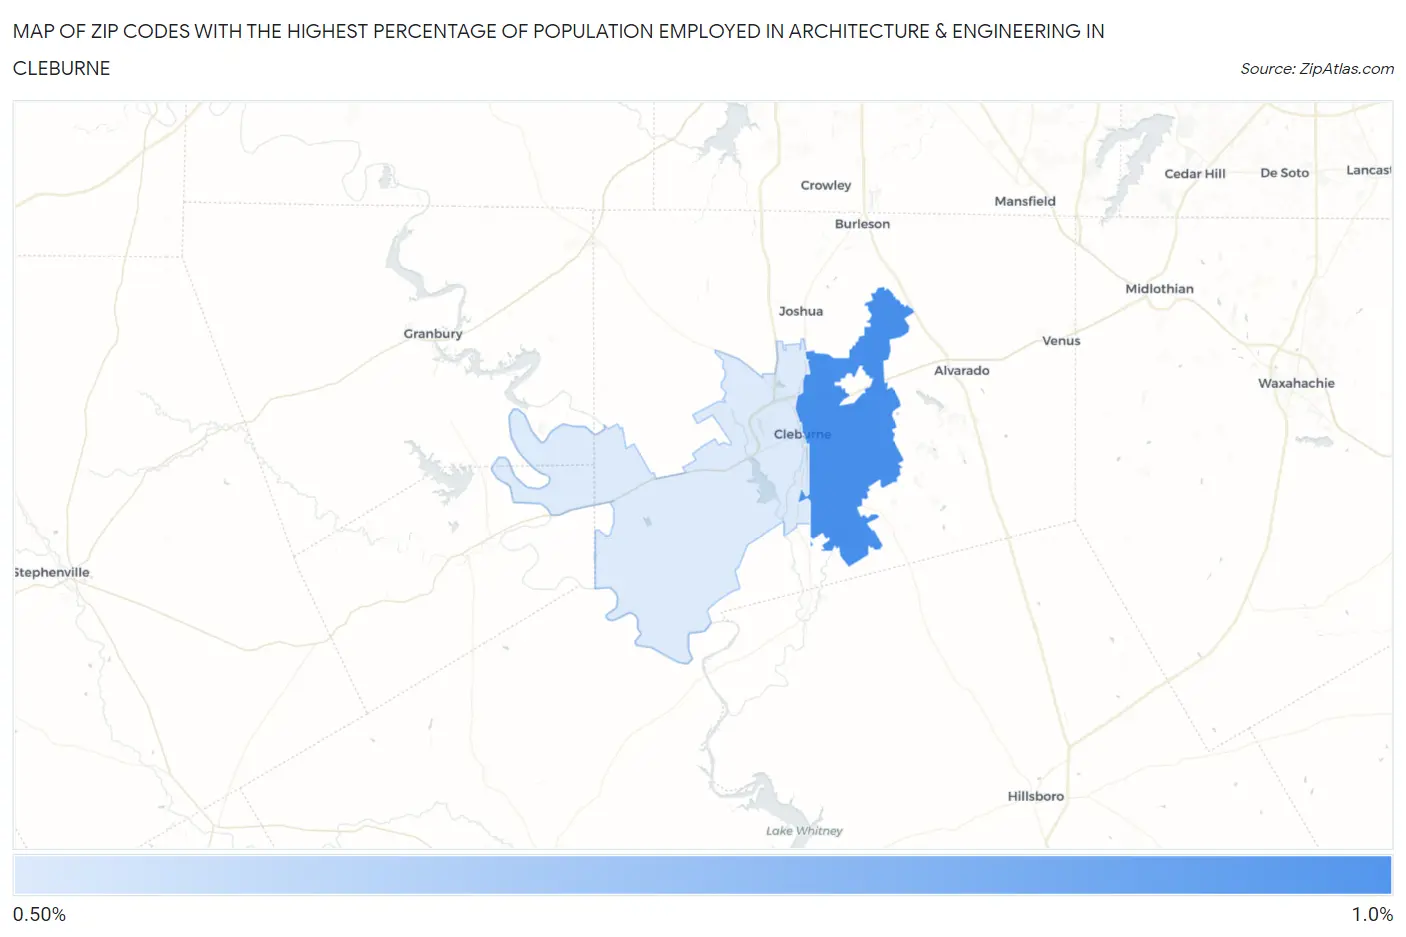
Map of Zip Codes with the Highest Percentage of Population Employed in Architecture & Engineering in Cleburne
0.53%
0.89%
Zip Codes with the Highest Percentage of Population Employed in Architecture & Engineering in Cleburne, TX
| Zip Code | % Employed | vs State | vs National | |
| 1. | 76031 | 0.89% | 2.2%(-1.34)#947 | 2.1%(-1.26)#17,485 |
| 2. | 76033 | 0.53% | 2.2%(-1.70)#1,113 | 2.1%(-1.62)#20,107 |
1
Common Questions
What are the Top Zip Codes with the Highest Percentage of Population Employed in Architecture & Engineering in Cleburne, TX?
Top Zip Codes with the Highest Percentage of Population Employed in Architecture & Engineering in Cleburne, TX are:
What zip code has the Highest Percentage of Population Employed in Architecture & Engineering in Cleburne, TX?
76031 has the Highest Percentage of Population Employed in Architecture & Engineering in Cleburne, TX with 0.89%.
What is the Percentage of Population Employed in Architecture & Engineering in Cleburne, TX?
Percentage of Population Employed in Architecture & Engineering in Cleburne is 0.48%.
What is the Percentage of Population Employed in Architecture & Engineering in Texas?
Percentage of Population Employed in Architecture & Engineering in Texas is 2.2%.
What is the Percentage of Population Employed in Architecture & Engineering in the United States?
Percentage of Population Employed in Architecture & Engineering in the United States is 2.1%.