Lake Jackson, TX Map & Demographics
Lake Jackson Map
Lake Jackson Overview
$42,143
PER CAPITA INCOME
$102,689
AVG FAMILY INCOME
$89,215
AVG HOUSEHOLD INCOME
45.5%
WAGE / INCOME GAP [ % ]
54.5¢/ $1
WAGE / INCOME GAP [ $ ]
$7,599
FAMILY INCOME DEFICIT
0.40
INEQUALITY / GINI INDEX
27,954
TOTAL POPULATION
14,133
MALE POPULATION
13,821
FEMALE POPULATION
102.26
MALES / 100 FEMALES
97.79
FEMALES / 100 MALES
33.6
MEDIAN AGE
3.2
AVG FAMILY SIZE
2.6
AVG HOUSEHOLD SIZE
14,591
LABOR FORCE [ PEOPLE ]
67.4%
PERCENT IN LABOR FORCE
7.0%
UNEMPLOYMENT RATE
Lake Jackson Zip Codes
Lake Jackson Area Codes
Income in Lake Jackson
Income Overview in Lake Jackson
Per Capita Income in Lake Jackson is $42,143, while median incomes of families and households are $102,689 and $89,215 respectively.
| Characteristic | Number | Measure |
| Per Capita Income | 27,954 | $42,143 |
| Median Family Income | 7,195 | $102,689 |
| Mean Family Income | 7,195 | $122,863 |
| Median Household Income | 10,558 | $89,215 |
| Mean Household Income | 10,558 | $111,259 |
| Income Deficit | 7,195 | $7,599 |
| Wage / Income Gap (%) | 27,954 | 45.53% |
| Wage / Income Gap ($) | 27,954 | 54.47¢ per $1 |
| Gini / Inequality Index | 27,954 | 0.40 |
Earnings by Sex in Lake Jackson
Average Earnings in Lake Jackson are $48,275, $59,649 for men and $32,493 for women, a difference of 45.5%.
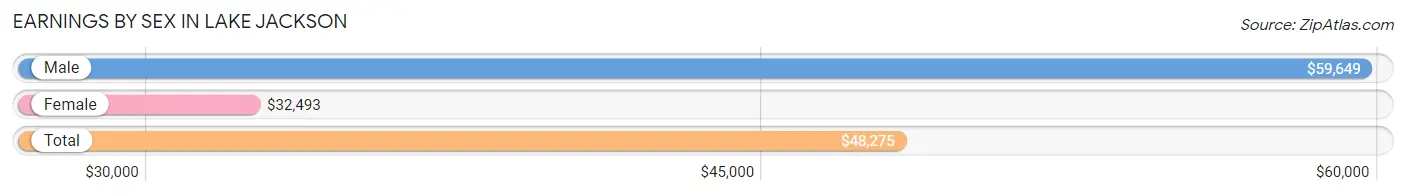
| Sex | Number | Average Earnings |
| Male | 8,537 (58.9%) | $59,649 |
| Female | 5,969 (41.1%) | $32,493 |
| Total | 14,506 (100.0%) | $48,275 |
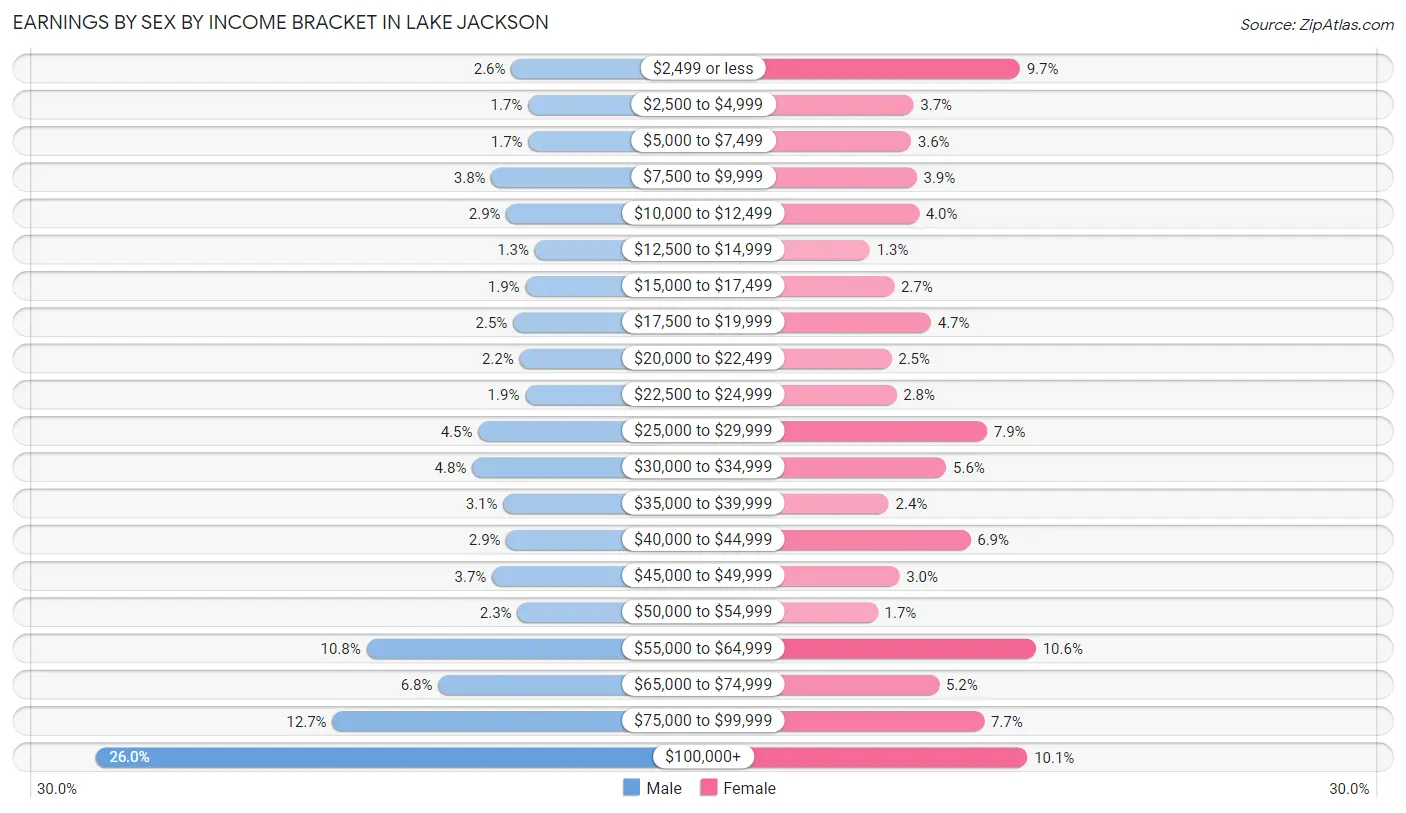
Earnings by Sex by Income Bracket in Lake Jackson
The most common earnings brackets in Lake Jackson are $100,000+ for men (2,217 | 26.0%) and $55,000 to $64,999 for women (634 | 10.6%).
| Income | Male | Female |
| $2,499 or less | 225 (2.6%) | 580 (9.7%) |
| $2,500 to $4,999 | 145 (1.7%) | 223 (3.7%) |
| $5,000 to $7,499 | 143 (1.7%) | 215 (3.6%) |
| $7,500 to $9,999 | 321 (3.8%) | 234 (3.9%) |
| $10,000 to $12,499 | 249 (2.9%) | 241 (4.0%) |
| $12,500 to $14,999 | 113 (1.3%) | 77 (1.3%) |
| $15,000 to $17,499 | 158 (1.8%) | 158 (2.6%) |
| $17,500 to $19,999 | 217 (2.5%) | 282 (4.7%) |
| $20,000 to $22,499 | 186 (2.2%) | 149 (2.5%) |
| $22,500 to $24,999 | 159 (1.9%) | 166 (2.8%) |
| $25,000 to $29,999 | 384 (4.5%) | 470 (7.9%) |
| $30,000 to $34,999 | 413 (4.8%) | 333 (5.6%) |
| $35,000 to $39,999 | 264 (3.1%) | 140 (2.4%) |
| $40,000 to $44,999 | 249 (2.9%) | 414 (6.9%) |
| $45,000 to $49,999 | 318 (3.7%) | 176 (2.9%) |
| $50,000 to $54,999 | 196 (2.3%) | 103 (1.7%) |
| $55,000 to $64,999 | 920 (10.8%) | 634 (10.6%) |
| $65,000 to $74,999 | 576 (6.8%) | 309 (5.2%) |
| $75,000 to $99,999 | 1,084 (12.7%) | 460 (7.7%) |
| $100,000+ | 2,217 (26.0%) | 605 (10.1%) |
| Total | 8,537 (100.0%) | 5,969 (100.0%) |
Earnings by Sex by Educational Attainment in Lake Jackson
Average earnings in Lake Jackson are $69,470 for men and $40,050 for women, a difference of 42.3%. Men with an educational attainment of bachelor's degree enjoy the highest average annual earnings of $90,568, while those with less than high school education earn the least with $48,316. Women with an educational attainment of graduate degree earn the most with the average annual earnings of $72,056, while those with less than high school education have the smallest earnings of $18,406.
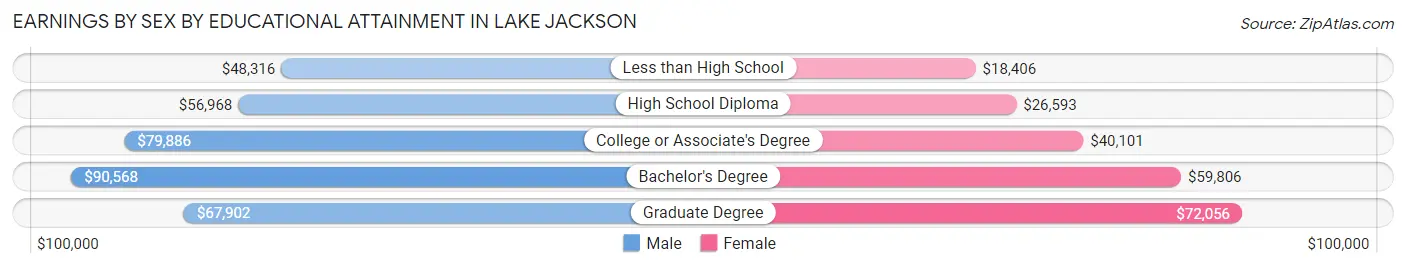
| Educational Attainment | Male Income | Female Income |
| Less than High School | $48,316 | $18,406 |
| High School Diploma | $56,968 | $26,593 |
| College or Associate's Degree | $79,886 | $40,101 |
| Bachelor's Degree | $90,568 | $59,806 |
| Graduate Degree | $67,902 | $72,056 |
| Total | $69,470 | $40,050 |
Family Income in Lake Jackson
Family Income Brackets in Lake Jackson
According to the Lake Jackson family income data, there are 1,540 families falling into the $100,000 to $149,999 income range, which is the most common income bracket and makes up 21.4% of all families. Conversely, the less than $10,000 income bracket is the least frequent group with only 94 families (1.3%) belonging to this category.
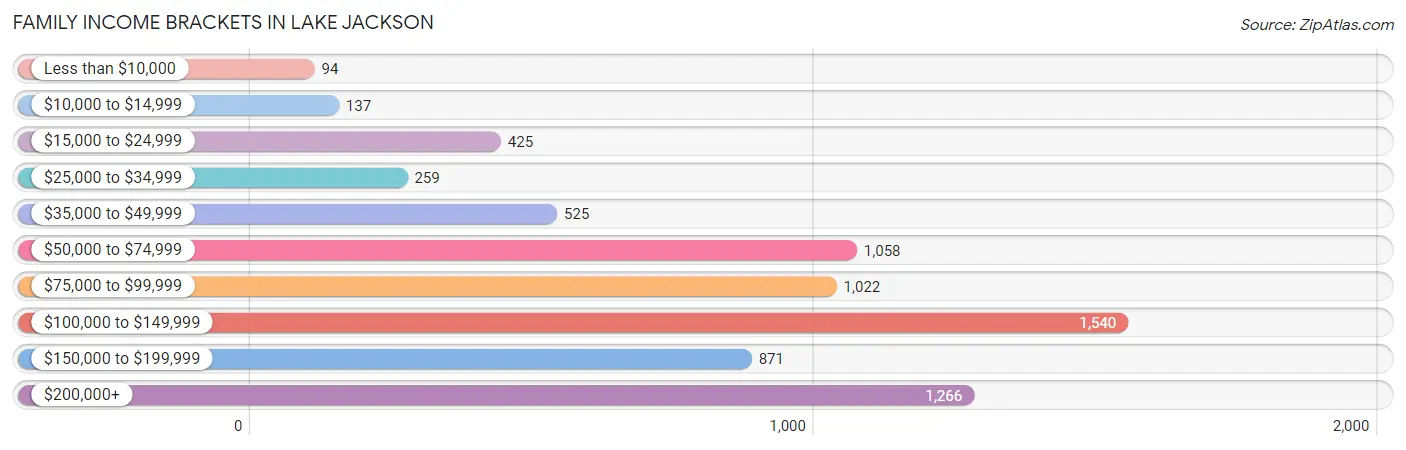
| Income Bracket | # Families | % Families |
| Less than $10,000 | 94 | 1.3% |
| $10,000 to $14,999 | 137 | 1.9% |
| $15,000 to $24,999 | 425 | 5.9% |
| $25,000 to $34,999 | 259 | 3.6% |
| $35,000 to $49,999 | 525 | 7.3% |
| $50,000 to $74,999 | 1,058 | 14.7% |
| $75,000 to $99,999 | 1,022 | 14.2% |
| $100,000 to $149,999 | 1,540 | 21.4% |
| $150,000 to $199,999 | 871 | 12.1% |
| $200,000+ | 1,266 | 17.6% |
Family Income by Famaliy Size in Lake Jackson
5-person families (733 | 10.2%) account for the highest median family income in Lake Jackson with $119,701 per family, while 2-person families (3,365 | 46.8%) have the highest median income of $44,642 per family member.
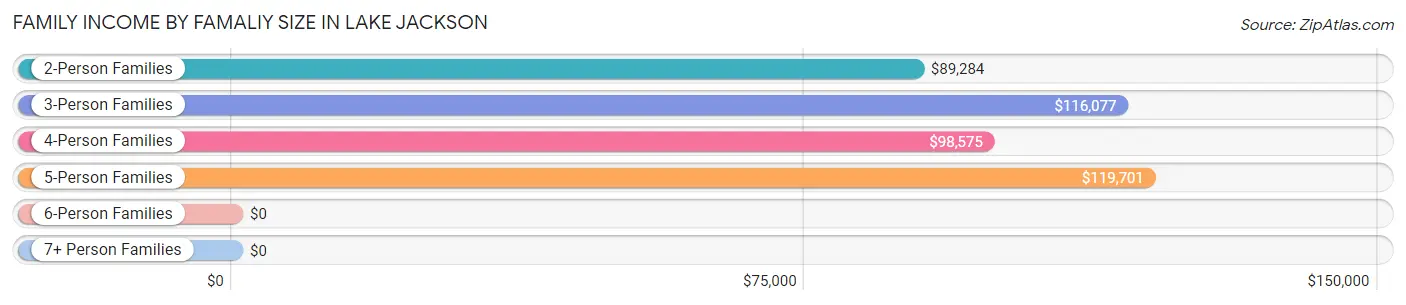
| Income Bracket | # Families | Median Income |
| 2-Person Families | 3,365 (46.8%) | $89,284 |
| 3-Person Families | 1,534 (21.3%) | $116,077 |
| 4-Person Families | 1,317 (18.3%) | $98,575 |
| 5-Person Families | 733 (10.2%) | $119,701 |
| 6-Person Families | 210 (2.9%) | $0 |
| 7+ Person Families | 36 (0.5%) | $0 |
| Total | 7,195 (100.0%) | $102,689 |
Family Income by Number of Earners in Lake Jackson
The median family income in Lake Jackson is $102,689, with families comprising 3+ earners (740) having the highest median family income of $141,867, while families with no earners (915) have the lowest median family income of $61,948, accounting for 10.3% and 12.7% of families, respectively.
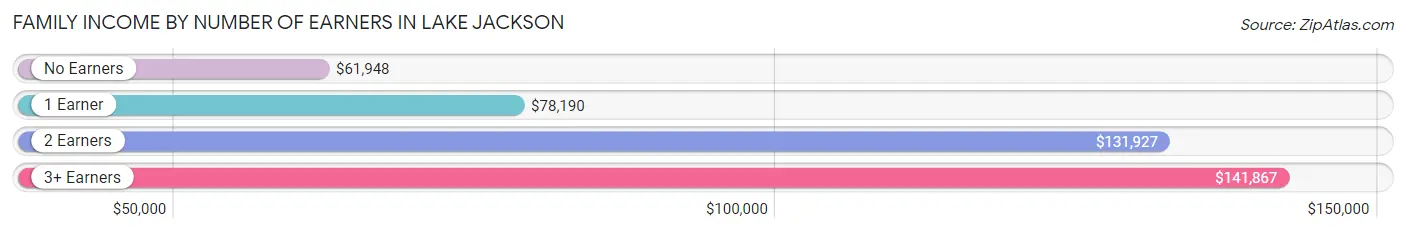
| Number of Earners | # Families | Median Income |
| No Earners | 915 (12.7%) | $61,948 |
| 1 Earner | 3,006 (41.8%) | $78,190 |
| 2 Earners | 2,534 (35.2%) | $131,927 |
| 3+ Earners | 740 (10.3%) | $141,867 |
| Total | 7,195 (100.0%) | $102,689 |
Household Income in Lake Jackson
Household Income Brackets in Lake Jackson
With 2,164 households falling in the category, the $100,000 to $149,999 income range is the most frequent in Lake Jackson, accounting for 20.5% of all households. In contrast, only 190 households (1.8%) fall into the $10,000 to $14,999 income bracket, making it the least populous group.
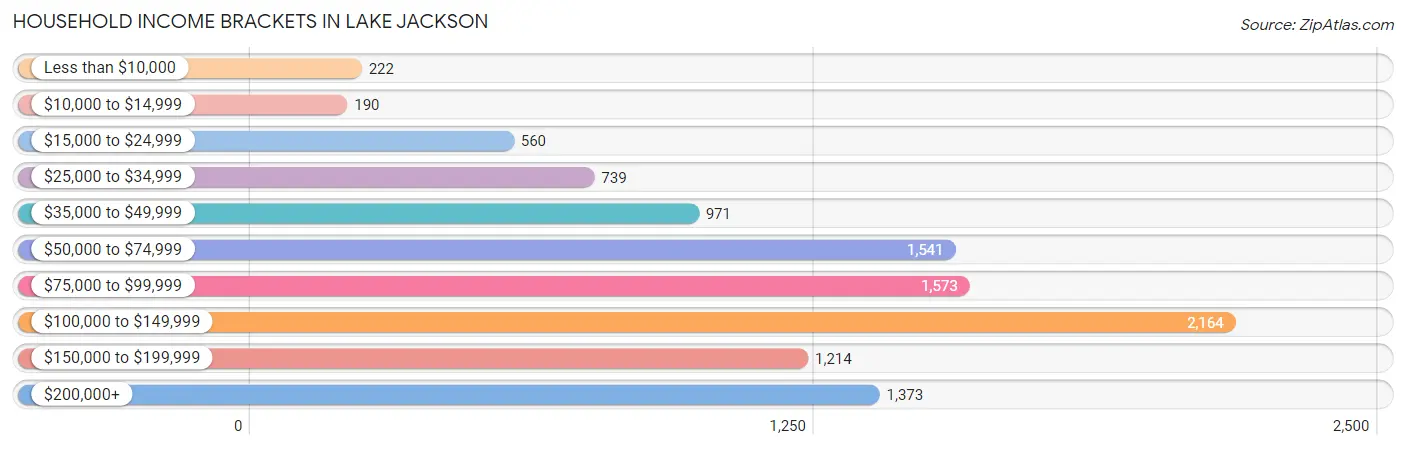
| Income Bracket | # Households | % Households |
| Less than $10,000 | 222 | 2.1% |
| $10,000 to $14,999 | 190 | 1.8% |
| $15,000 to $24,999 | 560 | 5.3% |
| $25,000 to $34,999 | 739 | 7.0% |
| $35,000 to $49,999 | 971 | 9.2% |
| $50,000 to $74,999 | 1,541 | 14.6% |
| $75,000 to $99,999 | 1,573 | 14.9% |
| $100,000 to $149,999 | 2,164 | 20.5% |
| $150,000 to $199,999 | 1,214 | 11.5% |
| $200,000+ | 1,373 | 13.0% |
Household Income by Householder Age in Lake Jackson
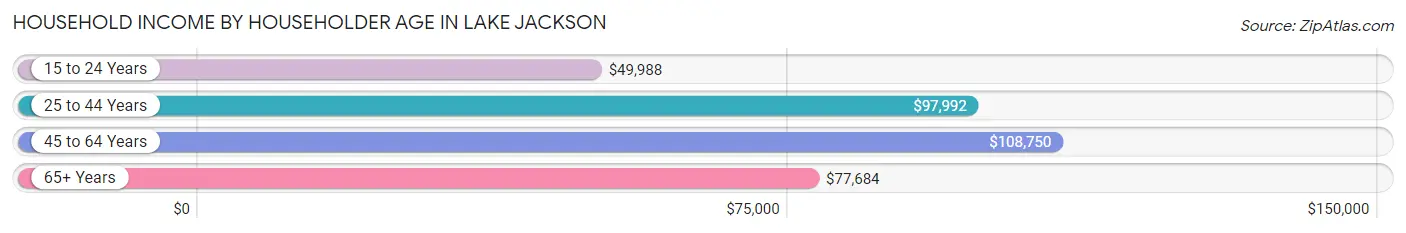
The median household income in Lake Jackson is $89,215, with the highest median household income of $108,750 found in the 45 to 64 years age bracket for the primary householder. A total of 3,654 households (34.6%) fall into this category. Meanwhile, the 15 to 24 years age bracket for the primary householder has the lowest median household income of $49,988, with 577 households (5.5%) in this group.
| Income Bracket | # Households | Median Income |
| 15 to 24 Years | 577 (5.5%) | $49,988 |
| 25 to 44 Years | 3,872 (36.7%) | $97,992 |
| 45 to 64 Years | 3,654 (34.6%) | $108,750 |
| 65+ Years | 2,455 (23.3%) | $77,684 |
| Total | 10,558 (100.0%) | $89,215 |
Poverty in Lake Jackson
Income Below Poverty by Sex and Age in Lake Jackson
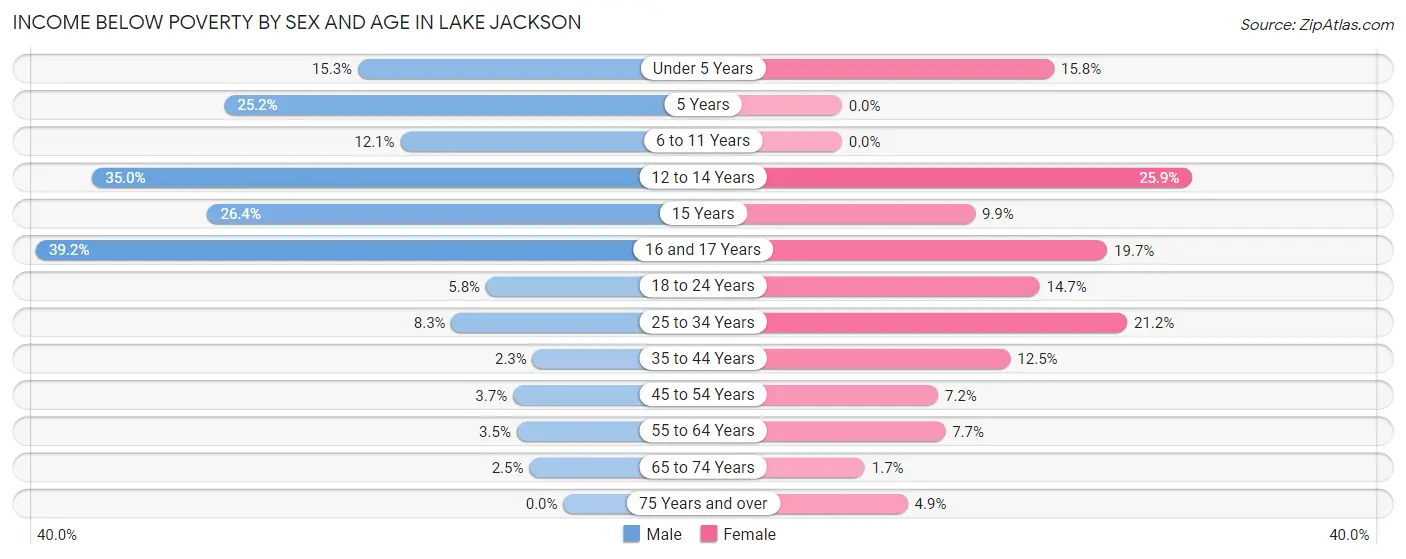
With 9.0% poverty level for males and 11.2% for females among the residents of Lake Jackson, 16 and 17 year old males and 12 to 14 year old females are the most vulnerable to poverty, with 193 males (39.2%) and 179 females (25.9%) in their respective age groups living below the poverty level.
| Age Bracket | Male | Female |
| Under 5 Years | 126 (15.2%) | 142 (15.8%) |
| 5 Years | 38 (25.2%) | 0 (0.0%) |
| 6 to 11 Years | 156 (12.1%) | 0 (0.0%) |
| 12 to 14 Years | 214 (35.0%) | 179 (25.9%) |
| 15 Years | 51 (26.4%) | 37 (9.9%) |
| 16 and 17 Years | 193 (39.2%) | 52 (19.7%) |
| 18 to 24 Years | 90 (5.8%) | 166 (14.7%) |
| 25 to 34 Years | 224 (8.3%) | 422 (21.2%) |
| 35 to 44 Years | 35 (2.3%) | 216 (12.5%) |
| 45 to 54 Years | 54 (3.7%) | 111 (7.1%) |
| 55 to 64 Years | 61 (3.5%) | 144 (7.7%) |
| 65 to 74 Years | 26 (2.5%) | 19 (1.7%) |
| 75 Years and over | 0 (0.0%) | 44 (4.9%) |
| Total | 1,268 (9.0%) | 1,532 (11.2%) |
Income Above Poverty by Sex and Age in Lake Jackson
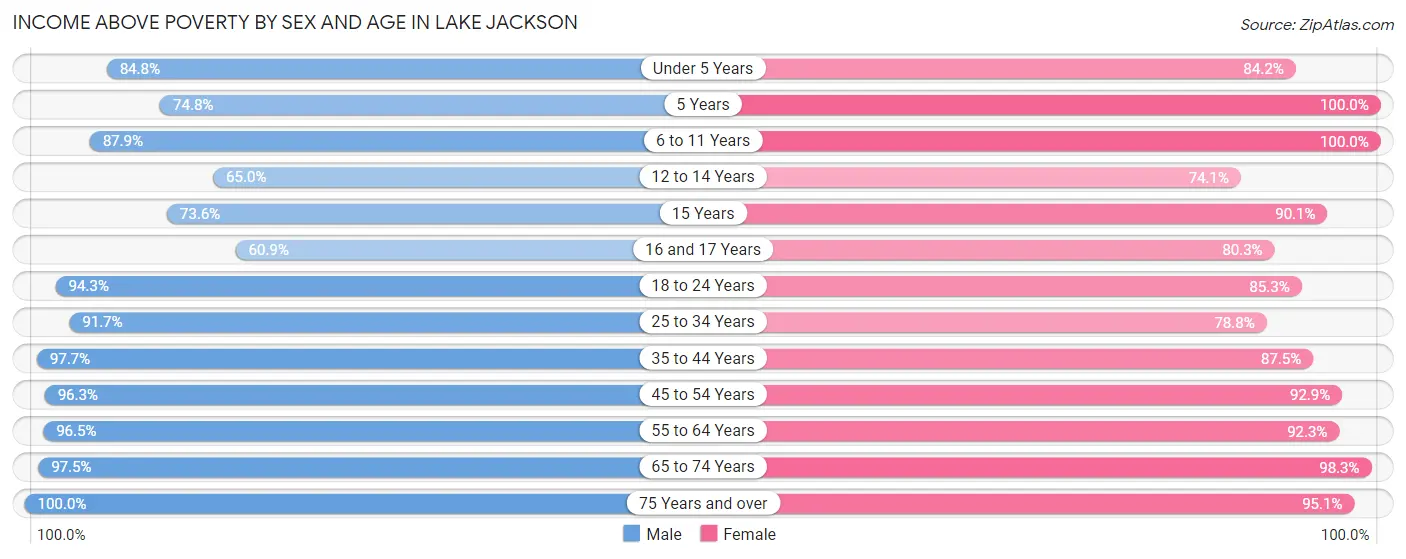
According to the poverty statistics in Lake Jackson, males aged 75 years and over and females aged 5 years are the age groups that are most secure financially, with 100.0% of males and 100.0% of females in these age groups living above the poverty line.
| Age Bracket | Male | Female |
| Under 5 Years | 700 (84.8%) | 759 (84.2%) |
| 5 Years | 113 (74.8%) | 106 (100.0%) |
| 6 to 11 Years | 1,133 (87.9%) | 1,083 (100.0%) |
| 12 to 14 Years | 398 (65.0%) | 511 (74.1%) |
| 15 Years | 142 (73.6%) | 337 (90.1%) |
| 16 and 17 Years | 300 (60.9%) | 212 (80.3%) |
| 18 to 24 Years | 1,474 (94.3%) | 965 (85.3%) |
| 25 to 34 Years | 2,473 (91.7%) | 1,570 (78.8%) |
| 35 to 44 Years | 1,497 (97.7%) | 1,509 (87.5%) |
| 45 to 54 Years | 1,388 (96.3%) | 1,442 (92.8%) |
| 55 to 64 Years | 1,700 (96.5%) | 1,730 (92.3%) |
| 65 to 74 Years | 1,003 (97.5%) | 1,089 (98.3%) |
| 75 Years and over | 497 (100.0%) | 855 (95.1%) |
| Total | 12,818 (91.0%) | 12,168 (88.8%) |
Income Below Poverty Among Married-Couple Families in Lake Jackson
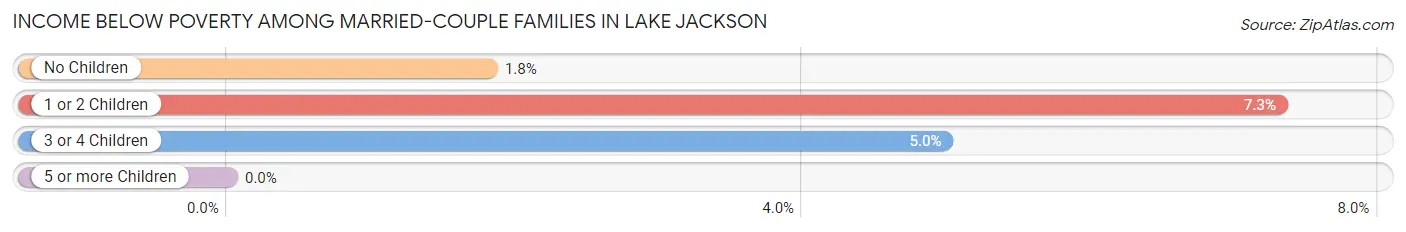
The poverty statistics for married-couple families in Lake Jackson show that 3.9% or 215 of the total 5,525 families live below the poverty line. Families with 1 or 2 children have the highest poverty rate of 7.3%, comprising of 130 families. On the other hand, families with no children have the lowest poverty rate of 1.8%, which includes 58 families.
| Children | Above Poverty | Below Poverty |
| No Children | 3,146 (98.2%) | 58 (1.8%) |
| 1 or 2 Children | 1,649 (92.7%) | 130 (7.3%) |
| 3 or 4 Children | 515 (95.0%) | 27 (5.0%) |
| 5 or more Children | 0 (0.0%) | 0 (0.0%) |
| Total | 5,310 (96.1%) | 215 (3.9%) |
Income Below Poverty Among Single-Parent Households in Lake Jackson
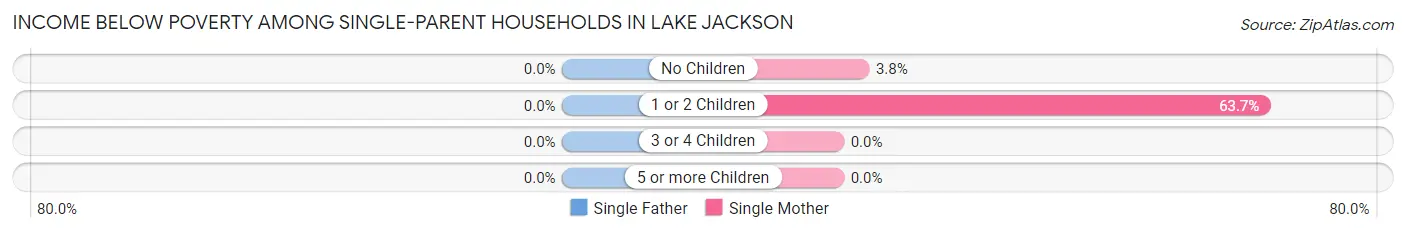
| Children | Single Father | Single Mother |
| No Children | 0 (0.0%) | 11 (3.8%) |
| 1 or 2 Children | 0 (0.0%) | 465 (63.7%) |
| 3 or 4 Children | 0 (0.0%) | 0 (0.0%) |
| 5 or more Children | 0 (0.0%) | 0 (0.0%) |
| Total | 0 (0.0%) | 476 (43.3%) |
Income Below Poverty Among Married-Couple vs Single-Parent Households in Lake Jackson
The poverty data for Lake Jackson shows that 215 of the married-couple family households (3.9%) and 476 of the single-parent households (28.5%) are living below the poverty level. Within the married-couple family households, those with 1 or 2 children have the highest poverty rate, with 130 households (7.3%) falling below the poverty line. Among the single-parent households, those with 1 or 2 children have the highest poverty rate, with 465 household (45.6%) living below poverty.
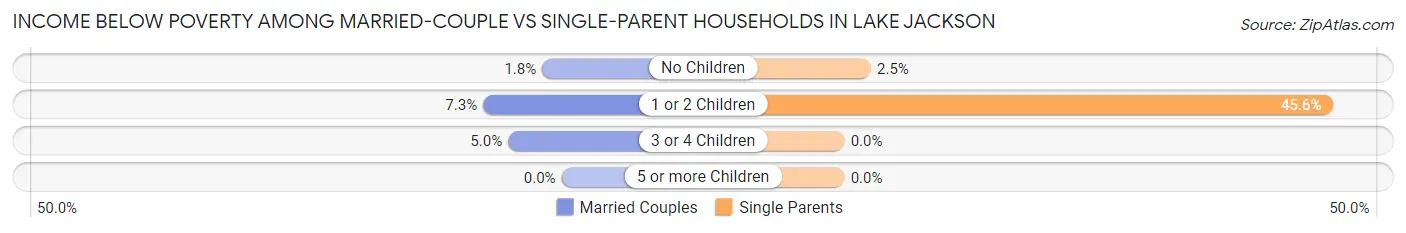
| Children | Married-Couple Families | Single-Parent Households |
| No Children | 58 (1.8%) | 11 (2.5%) |
| 1 or 2 Children | 130 (7.3%) | 465 (45.6%) |
| 3 or 4 Children | 27 (5.0%) | 0 (0.0%) |
| 5 or more Children | 0 (0.0%) | 0 (0.0%) |
| Total | 215 (3.9%) | 476 (28.5%) |
Race in Lake Jackson
The most populous races in Lake Jackson are White / Caucasian (21,478 | 76.8%), Hispanic or Latino (8,037 | 28.7%), and Two or more Races (2,686 | 9.6%).
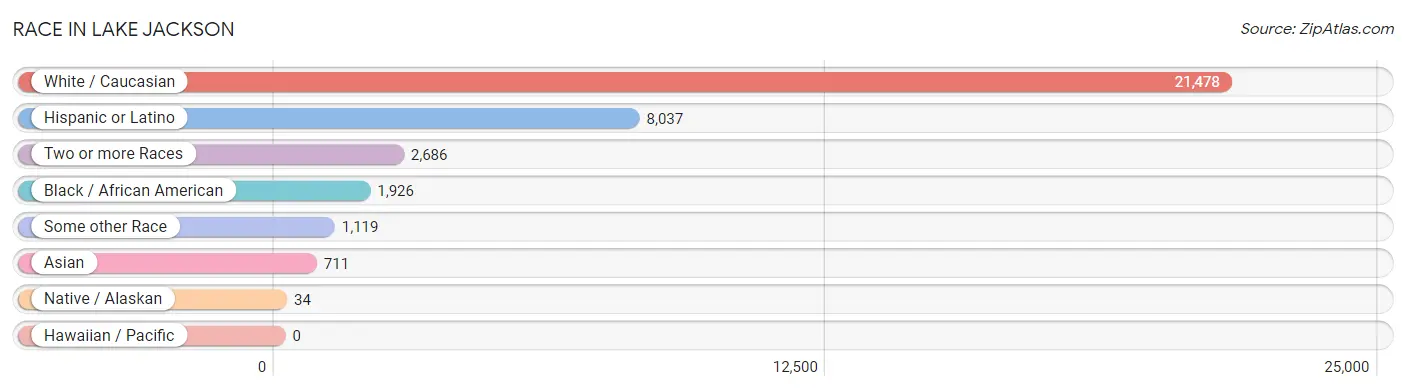
| Race | # Population | % Population |
| Asian | 711 | 2.5% |
| Black / African American | 1,926 | 6.9% |
| Hawaiian / Pacific | 0 | 0.0% |
| Hispanic or Latino | 8,037 | 28.7% |
| Native / Alaskan | 34 | 0.1% |
| White / Caucasian | 21,478 | 76.8% |
| Two or more Races | 2,686 | 9.6% |
| Some other Race | 1,119 | 4.0% |
| Total | 27,954 | 100.0% |
Ancestry in Lake Jackson
The most populous ancestries reported in Lake Jackson are Mexican (6,987 | 25.0%), German (2,775 | 9.9%), English (2,399 | 8.6%), Irish (2,134 | 7.6%), and American (1,782 | 6.4%), together accounting for 57.5% of all Lake Jackson residents.
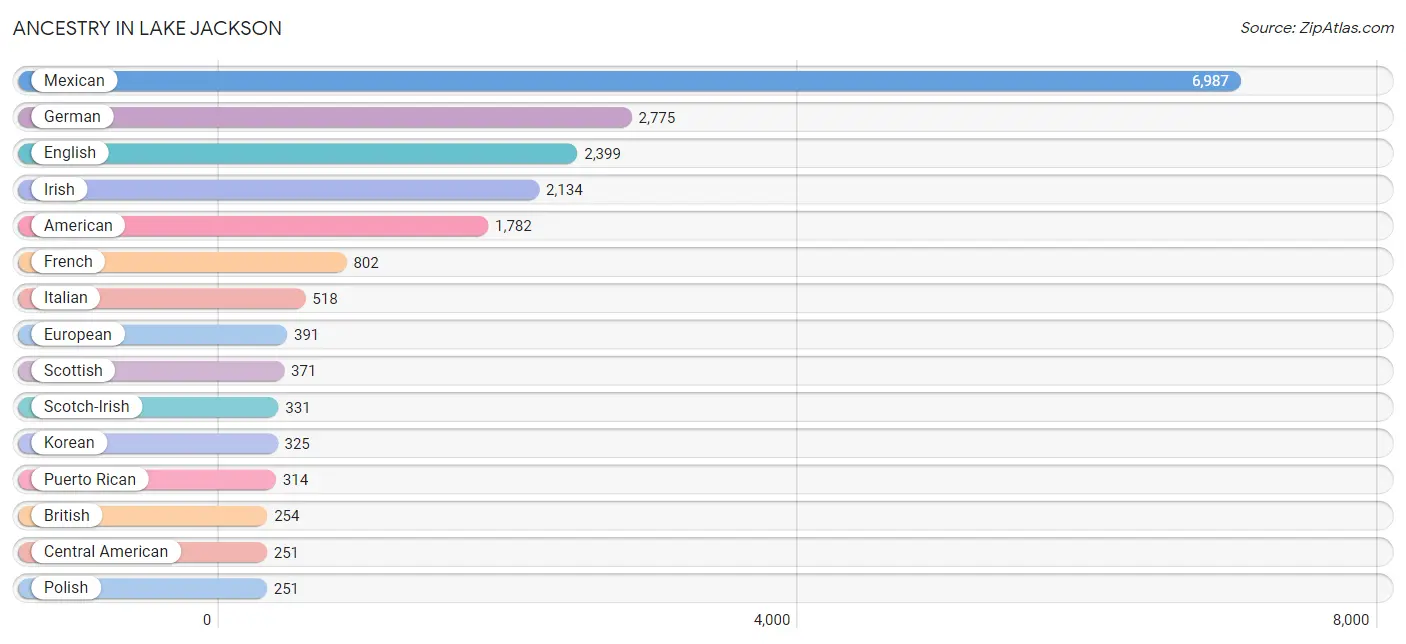
| Ancestry | # Population | % Population |
| African | 1 | 0.0% |
| American | 1,782 | 6.4% |
| Arab | 24 | 0.1% |
| Argentinean | 10 | 0.0% |
| Austrian | 26 | 0.1% |
| Basque | 22 | 0.1% |
| Bhutanese | 59 | 0.2% |
| British | 254 | 0.9% |
| Burmese | 169 | 0.6% |
| Cajun | 40 | 0.1% |
| Canadian | 213 | 0.8% |
| Central American | 251 | 0.9% |
| Central American Indian | 12 | 0.0% |
| Cherokee | 92 | 0.3% |
| Choctaw | 5 | 0.0% |
| Colombian | 18 | 0.1% |
| Creek | 17 | 0.1% |
| Croatian | 7 | 0.0% |
| Cuban | 20 | 0.1% |
| Czech | 238 | 0.9% |
| Czechoslovakian | 59 | 0.2% |
| Danish | 123 | 0.4% |
| Delaware | 5 | 0.0% |
| Dominican | 12 | 0.0% |
| Dutch | 205 | 0.7% |
| Ecuadorian | 36 | 0.1% |
| English | 2,399 | 8.6% |
| European | 391 | 1.4% |
| Filipino | 8 | 0.0% |
| Finnish | 10 | 0.0% |
| French | 802 | 2.9% |
| French Canadian | 118 | 0.4% |
| German | 2,775 | 9.9% |
| Greek | 48 | 0.2% |
| Guatemalan | 70 | 0.3% |
| Haitian | 48 | 0.2% |
| Hungarian | 31 | 0.1% |
| Indian (Asian) | 82 | 0.3% |
| Irish | 2,134 | 7.6% |
| Italian | 518 | 1.8% |
| Korean | 325 | 1.2% |
| Lebanese | 24 | 0.1% |
| Lithuanian | 12 | 0.0% |
| Mexican | 6,987 | 25.0% |
| Mexican American Indian | 35 | 0.1% |
| Nicaraguan | 18 | 0.1% |
| Northern European | 89 | 0.3% |
| Norwegian | 10 | 0.0% |
| Pakistani | 34 | 0.1% |
| Panamanian | 10 | 0.0% |
| Paraguayan | 13 | 0.1% |
| Polish | 251 | 0.9% |
| Puerto Rican | 314 | 1.1% |
| Russian | 236 | 0.8% |
| Salvadoran | 153 | 0.5% |
| Scandinavian | 43 | 0.2% |
| Scotch-Irish | 331 | 1.2% |
| Scottish | 371 | 1.3% |
| Slavic | 24 | 0.1% |
| Slovak | 61 | 0.2% |
| Slovene | 17 | 0.1% |
| South American | 77 | 0.3% |
| Spaniard | 183 | 0.6% |
| Sri Lankan | 71 | 0.3% |
| Subsaharan African | 11 | 0.0% |
| Swedish | 126 | 0.4% |
| Swiss | 156 | 0.6% |
| Thai | 96 | 0.3% |
| Ukrainian | 16 | 0.1% |
| Welsh | 248 | 0.9% | View All 70 Rows |
Immigrants in Lake Jackson
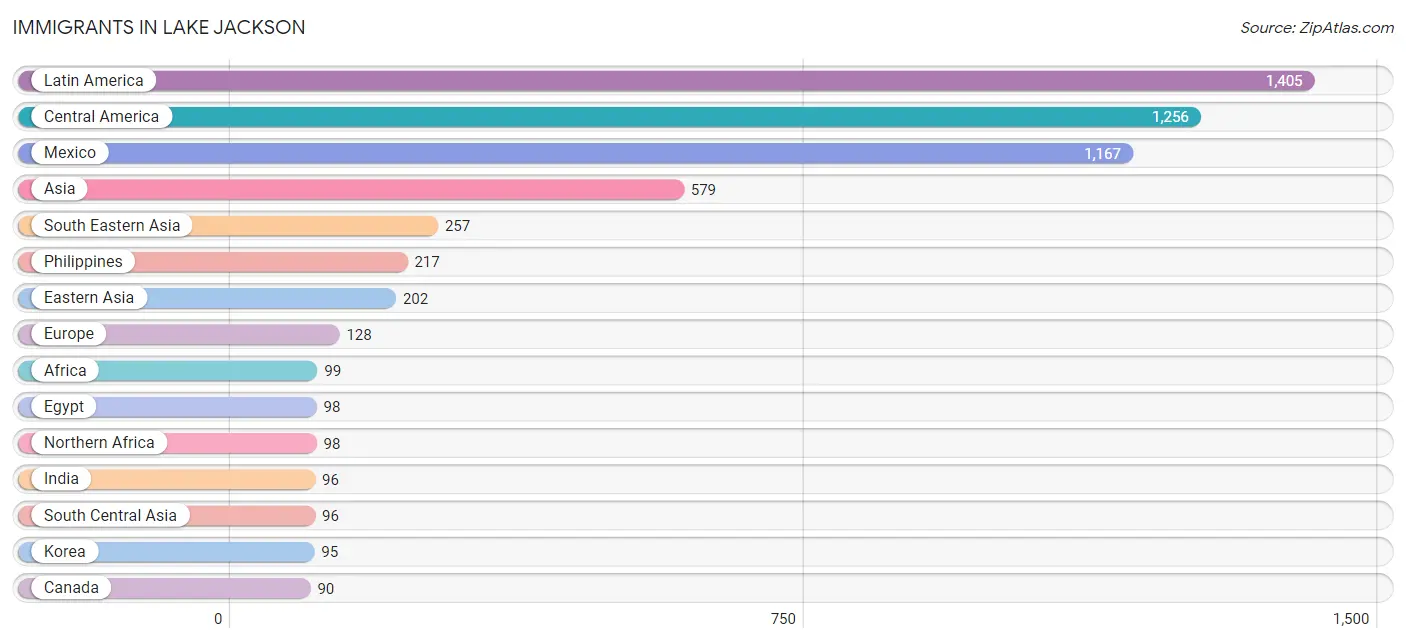
The most numerous immigrant groups reported in Lake Jackson came from Latin America (1,405 | 5.0%), Central America (1,256 | 4.5%), Mexico (1,167 | 4.2%), Asia (579 | 2.1%), and South Eastern Asia (257 | 0.9%), together accounting for 16.7% of all Lake Jackson residents.
| Immigration Origin | # Population | % Population |
| Africa | 99 | 0.4% |
| Argentina | 10 | 0.0% |
| Asia | 579 | 2.1% |
| Canada | 90 | 0.3% |
| Caribbean | 80 | 0.3% |
| Central America | 1,256 | 4.5% |
| China | 54 | 0.2% |
| Colombia | 18 | 0.1% |
| Cuba | 20 | 0.1% |
| Czechoslovakia | 8 | 0.0% |
| Denmark | 12 | 0.0% |
| Dominican Republic | 12 | 0.0% |
| Eastern Asia | 202 | 0.7% |
| Eastern Europe | 39 | 0.1% |
| Ecuador | 36 | 0.1% |
| Egypt | 98 | 0.4% |
| El Salvador | 47 | 0.2% |
| England | 21 | 0.1% |
| Europe | 128 | 0.5% |
| Germany | 10 | 0.0% |
| Haiti | 48 | 0.2% |
| Honduras | 20 | 0.1% |
| Hungary | 31 | 0.1% |
| India | 96 | 0.3% |
| Japan | 53 | 0.2% |
| Korea | 95 | 0.3% |
| Latin America | 1,405 | 5.0% |
| Lebanon | 24 | 0.1% |
| Mexico | 1,167 | 4.2% |
| Nicaragua | 12 | 0.0% |
| Northern Africa | 98 | 0.4% |
| Northern Europe | 50 | 0.2% |
| Panama | 10 | 0.0% |
| Philippines | 217 | 0.8% |
| Scotland | 9 | 0.0% |
| South America | 69 | 0.3% |
| South Central Asia | 96 | 0.3% |
| South Eastern Asia | 257 | 0.9% |
| Southern Europe | 22 | 0.1% |
| Spain | 22 | 0.1% |
| Sweden | 8 | 0.0% |
| Switzerland | 7 | 0.0% |
| Taiwan | 8 | 0.0% |
| Thailand | 16 | 0.1% |
| Vietnam | 24 | 0.1% |
| Western Asia | 24 | 0.1% |
| Western Europe | 17 | 0.1% | View All 47 Rows |
Sex and Age in Lake Jackson
Sex and Age in Lake Jackson
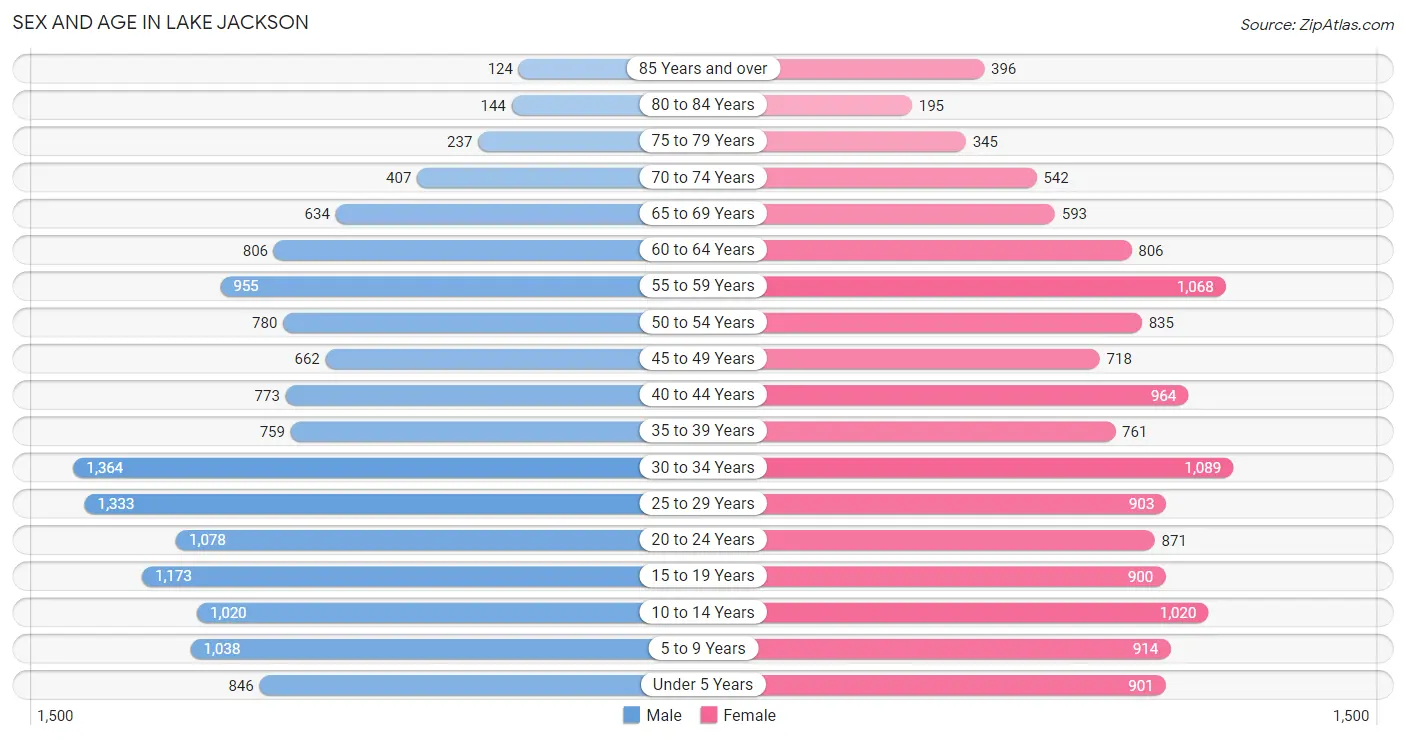
The most populous age groups in Lake Jackson are 30 to 34 Years (1,364 | 9.7%) for men and 30 to 34 Years (1,089 | 7.9%) for women.
| Age Bracket | Male | Female |
| Under 5 Years | 846 (6.0%) | 901 (6.5%) |
| 5 to 9 Years | 1,038 (7.3%) | 914 (6.6%) |
| 10 to 14 Years | 1,020 (7.2%) | 1,020 (7.4%) |
| 15 to 19 Years | 1,173 (8.3%) | 900 (6.5%) |
| 20 to 24 Years | 1,078 (7.6%) | 871 (6.3%) |
| 25 to 29 Years | 1,333 (9.4%) | 903 (6.5%) |
| 30 to 34 Years | 1,364 (9.7%) | 1,089 (7.9%) |
| 35 to 39 Years | 759 (5.4%) | 761 (5.5%) |
| 40 to 44 Years | 773 (5.5%) | 964 (7.0%) |
| 45 to 49 Years | 662 (4.7%) | 718 (5.2%) |
| 50 to 54 Years | 780 (5.5%) | 835 (6.0%) |
| 55 to 59 Years | 955 (6.8%) | 1,068 (7.7%) |
| 60 to 64 Years | 806 (5.7%) | 806 (5.8%) |
| 65 to 69 Years | 634 (4.5%) | 593 (4.3%) |
| 70 to 74 Years | 407 (2.9%) | 542 (3.9%) |
| 75 to 79 Years | 237 (1.7%) | 345 (2.5%) |
| 80 to 84 Years | 144 (1.0%) | 195 (1.4%) |
| 85 Years and over | 124 (0.9%) | 396 (2.9%) |
| Total | 14,133 (100.0%) | 13,821 (100.0%) |
Families and Households in Lake Jackson
Median Family Size in Lake Jackson
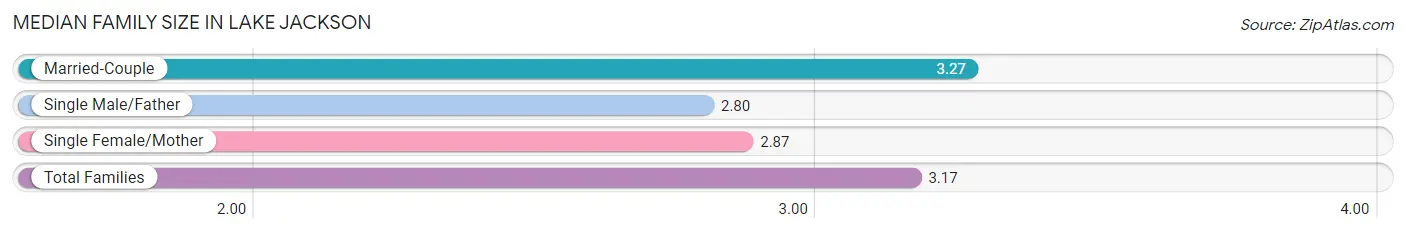
The median family size in Lake Jackson is 3.17 persons per family, with married-couple families (5,525 | 76.8%) accounting for the largest median family size of 3.27 persons per family. On the other hand, single male/father families (571 | 7.9%) represent the smallest median family size with 2.80 persons per family.
| Family Type | # Families | Family Size |
| Married-Couple | 5,525 (76.8%) | 3.27 |
| Single Male/Father | 571 (7.9%) | 2.80 |
| Single Female/Mother | 1,099 (15.3%) | 2.87 |
| Total Families | 7,195 (100.0%) | 3.17 |
Median Household Size in Lake Jackson
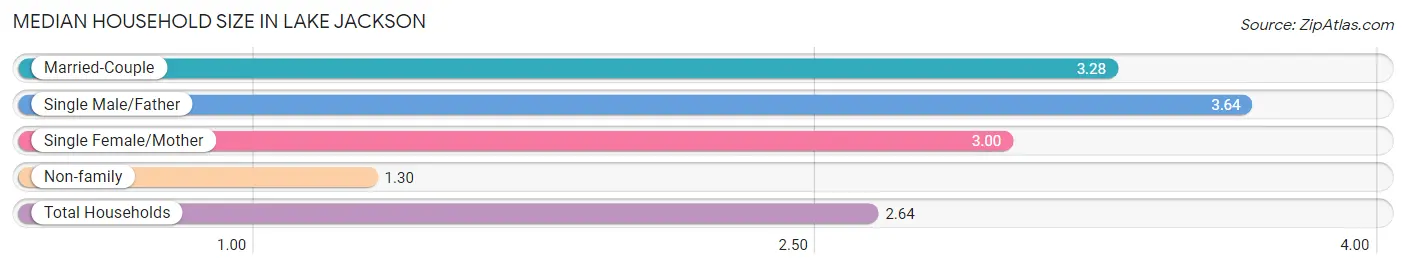
The median household size in Lake Jackson is 2.64 persons per household, with single male/father households (571 | 5.4%) accounting for the largest median household size of 3.64 persons per household. non-family households (3,363 | 31.9%) represent the smallest median household size with 1.30 persons per household.
| Household Type | # Households | Household Size |
| Married-Couple | 5,525 (52.3%) | 3.28 |
| Single Male/Father | 571 (5.4%) | 3.64 |
| Single Female/Mother | 1,099 (10.4%) | 3.00 |
| Non-family | 3,363 (31.9%) | 1.30 |
| Total Households | 10,558 (100.0%) | 2.64 |
Household Size by Marriage Status in Lake Jackson
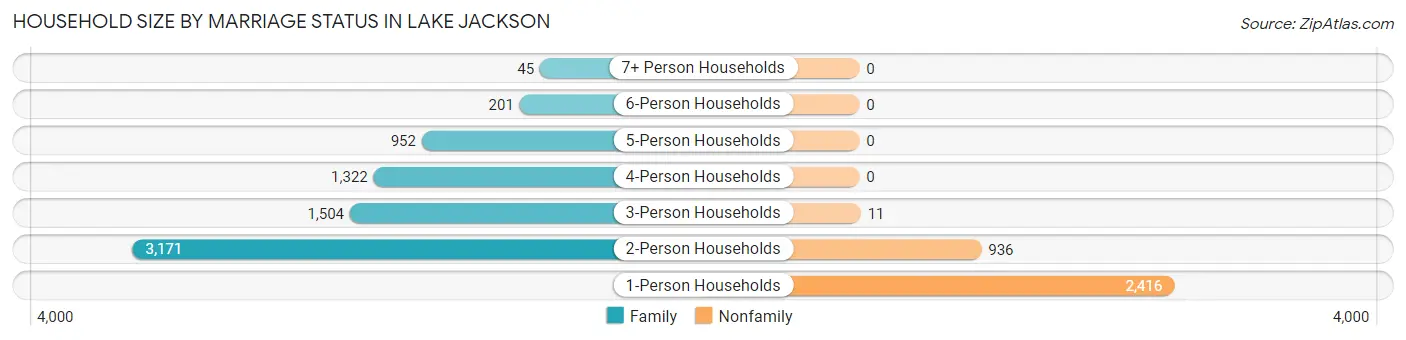
Out of a total of 10,558 households in Lake Jackson, 7,195 (68.1%) are family households, while 3,363 (31.9%) are nonfamily households. The most numerous type of family households are 2-person households, comprising 3,171, and the most common type of nonfamily households are 1-person households, comprising 2,416.
| Household Size | Family Households | Nonfamily Households |
| 1-Person Households | - | 2,416 (22.9%) |
| 2-Person Households | 3,171 (30.0%) | 936 (8.9%) |
| 3-Person Households | 1,504 (14.2%) | 11 (0.1%) |
| 4-Person Households | 1,322 (12.5%) | 0 (0.0%) |
| 5-Person Households | 952 (9.0%) | 0 (0.0%) |
| 6-Person Households | 201 (1.9%) | 0 (0.0%) |
| 7+ Person Households | 45 (0.4%) | 0 (0.0%) |
| Total | 7,195 (68.1%) | 3,363 (31.9%) |
Female Fertility in Lake Jackson
Fertility by Age in Lake Jackson
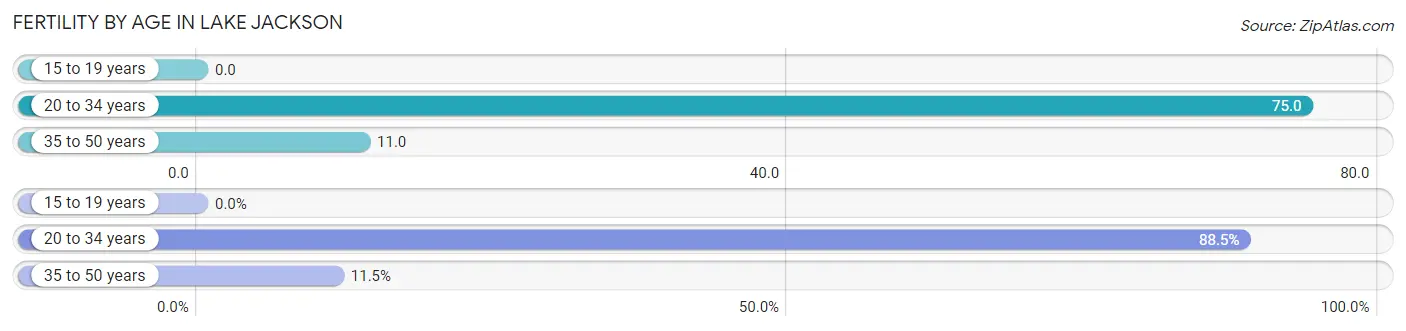
Average fertility rate in Lake Jackson is 39.0 births per 1,000 women. Women in the age bracket of 20 to 34 years have the highest fertility rate with 75.0 births per 1,000 women. Women in the age bracket of 20 to 34 years acount for 88.5% of all women with births.
| Age Bracket | Women with Births | Births / 1,000 Women |
| 15 to 19 years | 0 (0.0%) | 0.0 |
| 20 to 34 years | 215 (88.5%) | 75.0 |
| 35 to 50 years | 28 (11.5%) | 11.0 |
| Total | 243 (100.0%) | 39.0 |
Fertility by Age by Marriage Status in Lake Jackson
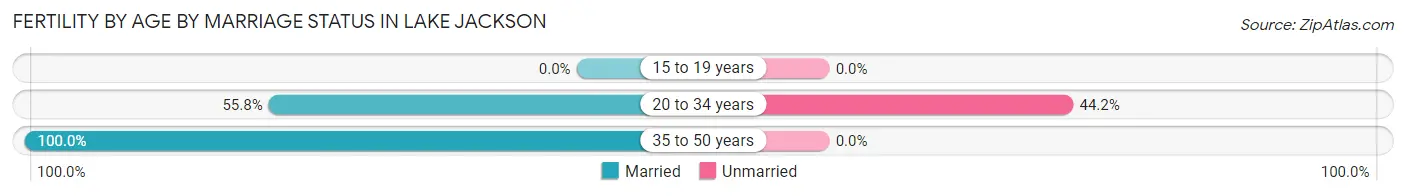
60.9% of women with births (243) in Lake Jackson are married. The highest percentage of unmarried women with births falls into 20 to 34 years age bracket with 44.2% of them unmarried at the time of birth, while the lowest percentage of unmarried women with births belong to 35 to 50 years age bracket with 0.0% of them unmarried.
| Age Bracket | Married | Unmarried |
| 15 to 19 years | 0 (0.0%) | 0 (0.0%) |
| 20 to 34 years | 120 (55.8%) | 95 (44.2%) |
| 35 to 50 years | 28 (100.0%) | 0 (0.0%) |
| Total | 148 (60.9%) | 95 (39.1%) |
Fertility by Education in Lake Jackson
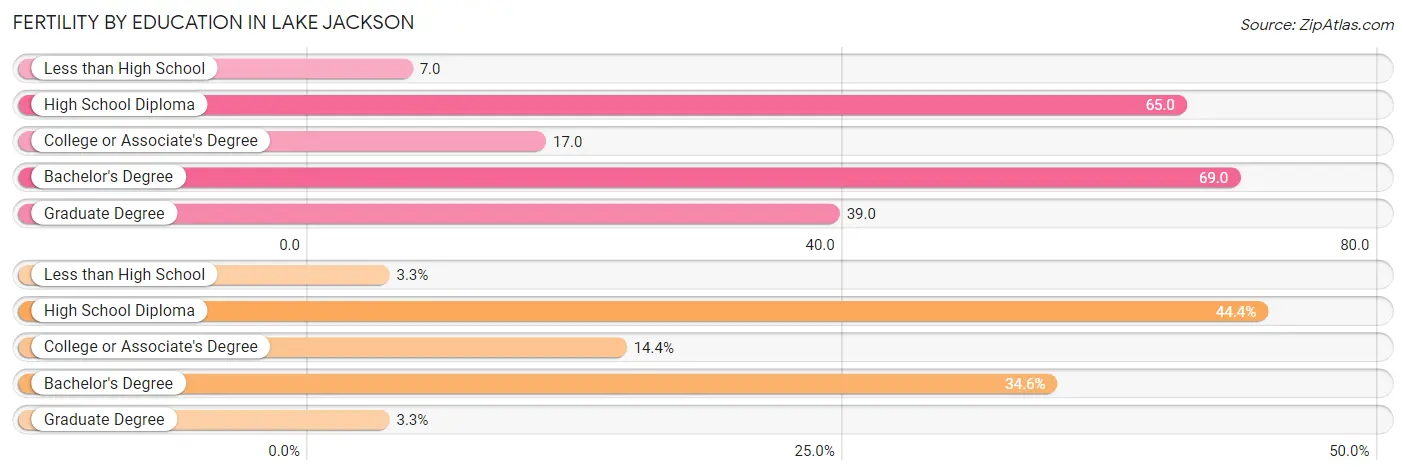
Average fertility rate in Lake Jackson is 39.0 births per 1,000 women. Women with the education attainment of bachelor's degree have the highest fertility rate of 69.0 births per 1,000 women, while women with the education attainment of less than high school have the lowest fertility at 7.0 births per 1,000 women. Women with the education attainment of high school diploma represent 44.4% of all women with births.
| Educational Attainment | Women with Births | Births / 1,000 Women |
| Less than High School | 8 (3.3%) | 7.0 |
| High School Diploma | 108 (44.4%) | 65.0 |
| College or Associate's Degree | 35 (14.4%) | 17.0 |
| Bachelor's Degree | 84 (34.6%) | 69.0 |
| Graduate Degree | 8 (3.3%) | 39.0 |
| Total | 243 (100.0%) | 39.0 |
Fertility by Education by Marriage Status in Lake Jackson
39.1% of women with births in Lake Jackson are unmarried. Women with the educational attainment of less than high school are most likely to be married with 100.0% of them married at childbirth, while women with the educational attainment of college or associate's degree are least likely to be married with 85.7% of them unmarried at childbirth.
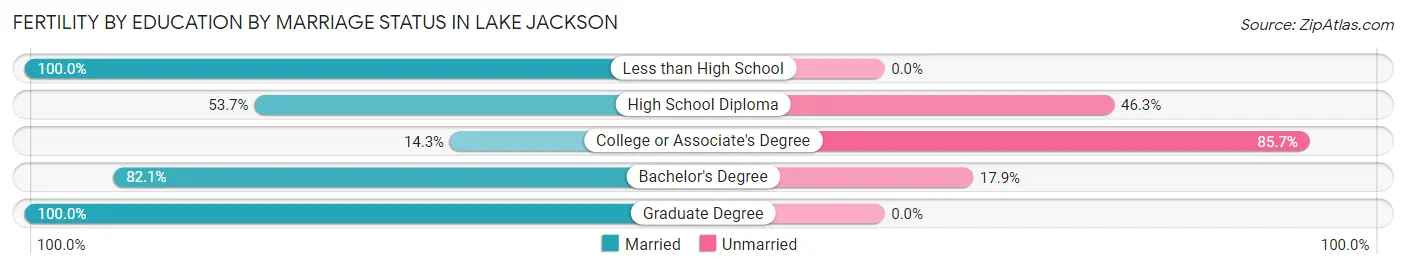
| Educational Attainment | Married | Unmarried |
| Less than High School | 8 (100.0%) | 0 (0.0%) |
| High School Diploma | 58 (53.7%) | 50 (46.3%) |
| College or Associate's Degree | 5 (14.3%) | 30 (85.7%) |
| Bachelor's Degree | 69 (82.1%) | 15 (17.9%) |
| Graduate Degree | 8 (100.0%) | 0 (0.0%) |
| Total | 148 (60.9%) | 95 (39.1%) |
Employment Characteristics in Lake Jackson
Employment by Class of Employer in Lake Jackson
Among the 13,318 employed individuals in Lake Jackson, private company employees (9,520 | 71.5%), local government employees (1,348 | 10.1%), and not-for-profit organizations (1,108 | 8.3%) make up the most common classes of employment.
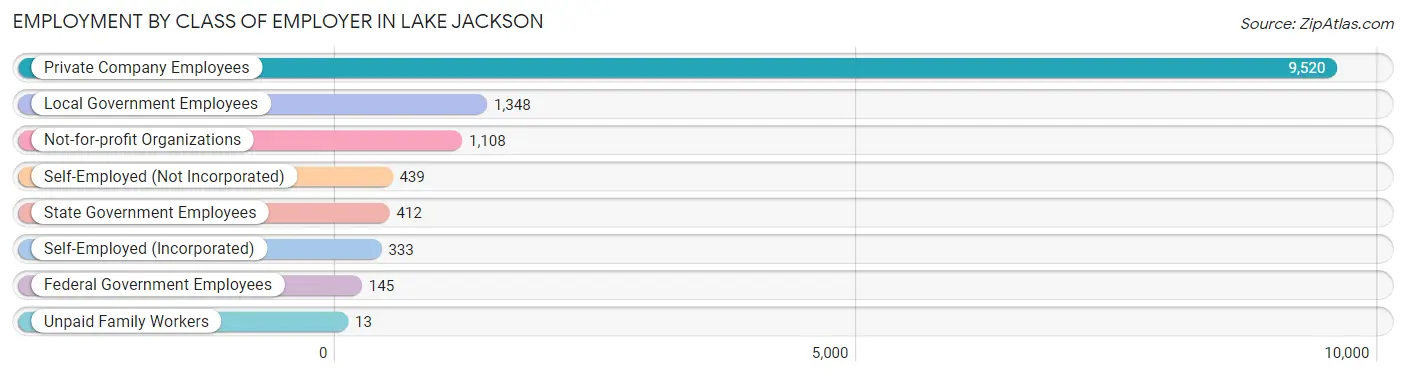
| Employer Class | # Employees | % Employees |
| Private Company Employees | 9,520 | 71.5% |
| Self-Employed (Incorporated) | 333 | 2.5% |
| Self-Employed (Not Incorporated) | 439 | 3.3% |
| Not-for-profit Organizations | 1,108 | 8.3% |
| Local Government Employees | 1,348 | 10.1% |
| State Government Employees | 412 | 3.1% |
| Federal Government Employees | 145 | 1.1% |
| Unpaid Family Workers | 13 | 0.1% |
| Total | 13,318 | 100.0% |
Employment Status by Age in Lake Jackson
According to the labor force statistics for Lake Jackson, out of the total population over 16 years of age (21,648), 67.4% or 14,591 individuals are in the labor force, with 7.0% or 1,021 of them unemployed. The age group with the highest labor force participation rate is 35 to 44 years, with 88.7% or 2,889 individuals in the labor force. Within the labor force, the 16 to 19 years age range has the highest percentage of unemployed individuals, with 25.6% or 169 of them being unemployed.
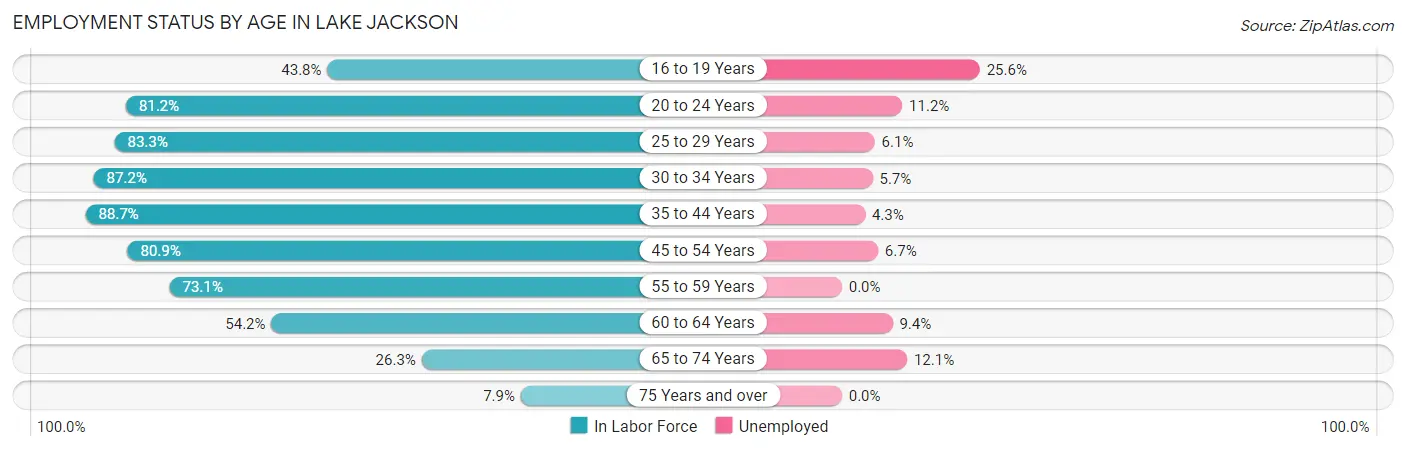
| Age Bracket | In Labor Force | Unemployed |
| 16 to 19 Years | 660 (43.8%) | 169 (25.6%) |
| 20 to 24 Years | 1,583 (81.2%) | 177 (11.2%) |
| 25 to 29 Years | 1,863 (83.3%) | 114 (6.1%) |
| 30 to 34 Years | 2,139 (87.2%) | 122 (5.7%) |
| 35 to 44 Years | 2,889 (88.7%) | 124 (4.3%) |
| 45 to 54 Years | 2,423 (80.9%) | 162 (6.7%) |
| 55 to 59 Years | 1,479 (73.1%) | 0 (0.0%) |
| 60 to 64 Years | 874 (54.2%) | 82 (9.4%) |
| 65 to 74 Years | 572 (26.3%) | 69 (12.1%) |
| 75 Years and over | 114 (7.9%) | 0 (0.0%) |
| Total | 14,591 (67.4%) | 1,021 (7.0%) |
Employment Status by Educational Attainment in Lake Jackson
According to labor force statistics for Lake Jackson, 80.0% of individuals (11,661) out of the total population between 25 and 64 years of age (14,576) are in the labor force, with 5.2% or 606 of them being unemployed. The group with the highest labor force participation rate are those with the educational attainment of bachelor's degree or higher, with 82.4% or 3,710 individuals in the labor force. Within the labor force, individuals with college / associate degree education have the highest percentage of unemployment, with 8.1% or 346 of them being unemployed.
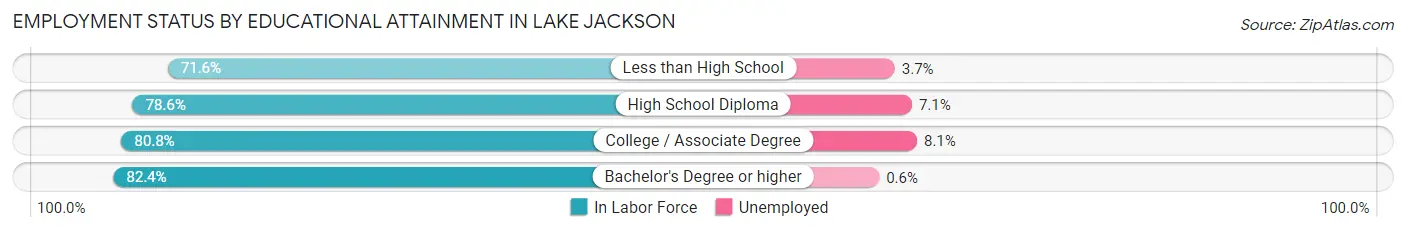
| Educational Attainment | In Labor Force | Unemployed |
| Less than High School | 828 (71.6%) | 43 (3.7%) |
| High School Diploma | 2,848 (78.6%) | 257 (7.1%) |
| College / Associate Degree | 4,276 (80.8%) | 429 (8.1%) |
| Bachelor's Degree or higher | 3,710 (82.4%) | 27 (0.6%) |
| Total | 11,661 (80.0%) | 758 (5.2%) |
Employment Occupations by Sex in Lake Jackson
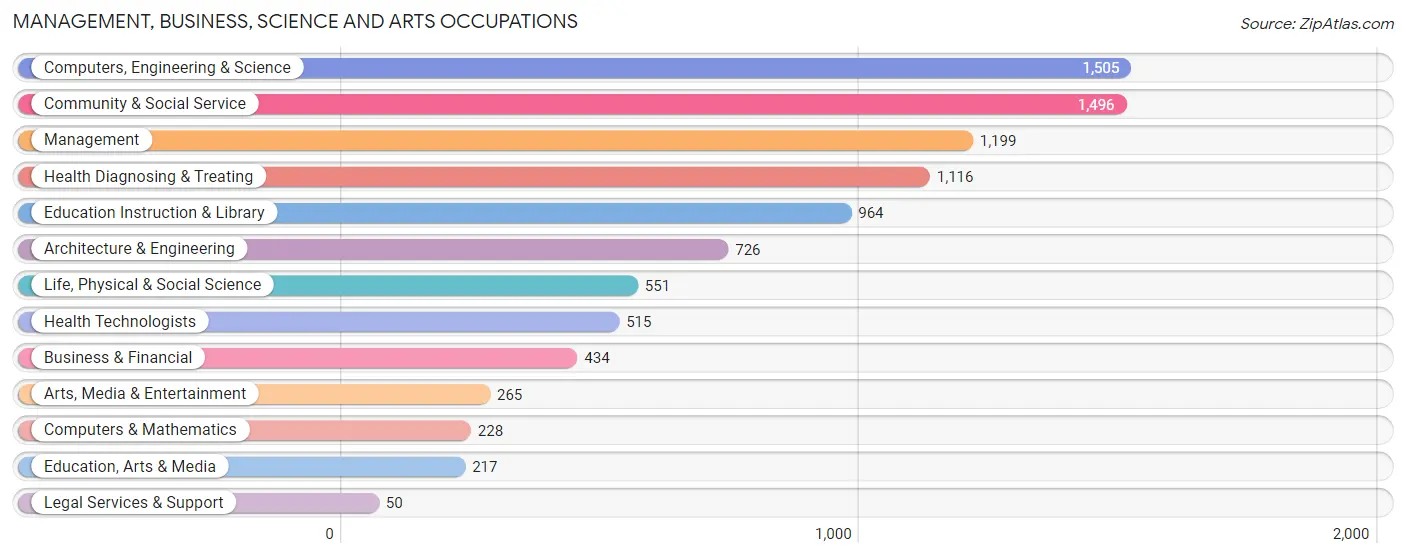
Management, Business, Science and Arts Occupations
The most common Management, Business, Science and Arts occupations in Lake Jackson are Computers, Engineering & Science (1,505 | 11.1%), Community & Social Service (1,496 | 11.0%), Management (1,199 | 8.8%), Health Diagnosing & Treating (1,116 | 8.2%), and Education Instruction & Library (964 | 7.1%).
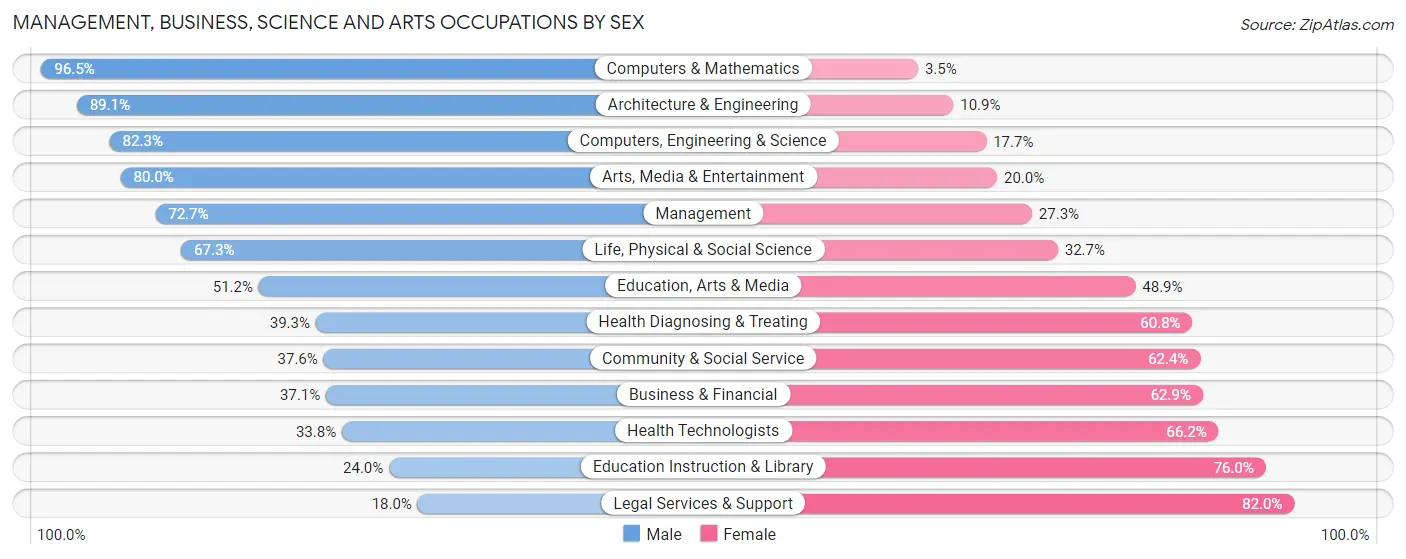
Management, Business, Science and Arts Occupations by Sex
Within the Management, Business, Science and Arts occupations in Lake Jackson, the most male-oriented occupations are Computers & Mathematics (96.5%), Architecture & Engineering (89.1%), and Computers, Engineering & Science (82.3%), while the most female-oriented occupations are Legal Services & Support (82.0%), Education Instruction & Library (76.0%), and Health Technologists (66.2%).
| Occupation | Male | Female |
| Management | 872 (72.7%) | 327 (27.3%) |
| Business & Financial | 161 (37.1%) | 273 (62.9%) |
| Computers, Engineering & Science | 1,238 (82.3%) | 267 (17.7%) |
| Computers & Mathematics | 220 (96.5%) | 8 (3.5%) |
| Architecture & Engineering | 647 (89.1%) | 79 (10.9%) |
| Life, Physical & Social Science | 371 (67.3%) | 180 (32.7%) |
| Community & Social Service | 563 (37.6%) | 933 (62.4%) |
| Education, Arts & Media | 111 (51.1%) | 106 (48.8%) |
| Legal Services & Support | 9 (18.0%) | 41 (82.0%) |
| Education Instruction & Library | 231 (24.0%) | 733 (76.0%) |
| Arts, Media & Entertainment | 212 (80.0%) | 53 (20.0%) |
| Health Diagnosing & Treating | 438 (39.3%) | 678 (60.8%) |
| Health Technologists | 174 (33.8%) | 341 (66.2%) |
| Total (Category) | 3,272 (56.9%) | 2,478 (43.1%) |
| Total (Overall) | 8,075 (59.5%) | 5,498 (40.5%) |
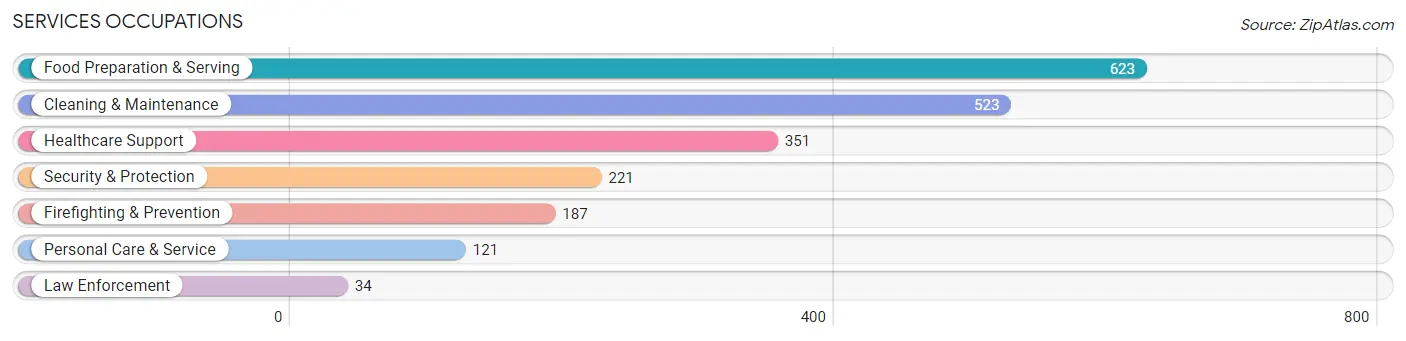
Services Occupations
The most common Services occupations in Lake Jackson are Food Preparation & Serving (623 | 4.6%), Cleaning & Maintenance (523 | 3.8%), Healthcare Support (351 | 2.6%), Security & Protection (221 | 1.6%), and Firefighting & Prevention (187 | 1.4%).
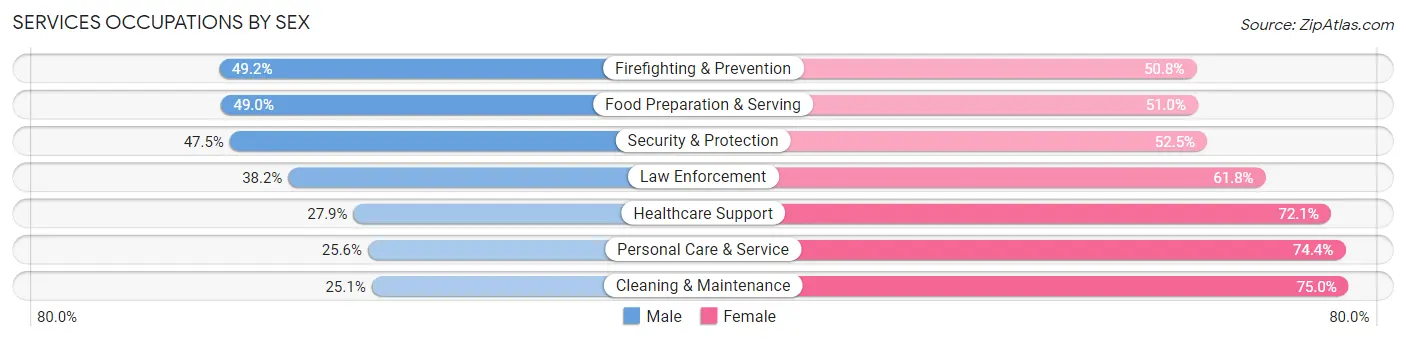
Services Occupations by Sex
Within the Services occupations in Lake Jackson, the most male-oriented occupations are Firefighting & Prevention (49.2%), Food Preparation & Serving (49.0%), and Security & Protection (47.5%), while the most female-oriented occupations are Cleaning & Maintenance (75.0%), Personal Care & Service (74.4%), and Healthcare Support (72.1%).
| Occupation | Male | Female |
| Healthcare Support | 98 (27.9%) | 253 (72.1%) |
| Security & Protection | 105 (47.5%) | 116 (52.5%) |
| Firefighting & Prevention | 92 (49.2%) | 95 (50.8%) |
| Law Enforcement | 13 (38.2%) | 21 (61.8%) |
| Food Preparation & Serving | 305 (49.0%) | 318 (51.0%) |
| Cleaning & Maintenance | 131 (25.1%) | 392 (75.0%) |
| Personal Care & Service | 31 (25.6%) | 90 (74.4%) |
| Total (Category) | 670 (36.4%) | 1,169 (63.6%) |
| Total (Overall) | 8,075 (59.5%) | 5,498 (40.5%) |
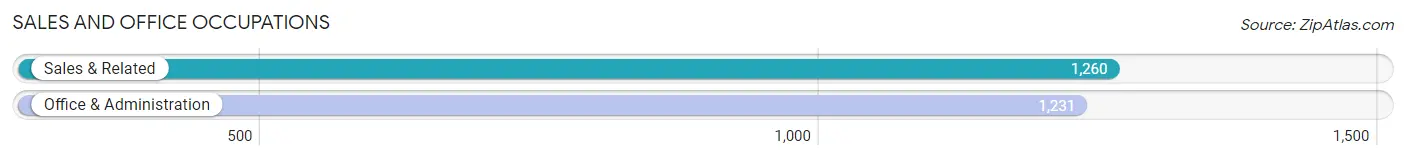
Sales and Office Occupations
The most common Sales and Office occupations in Lake Jackson are Sales & Related (1,260 | 9.3%), and Office & Administration (1,231 | 9.1%).
Sales and Office Occupations by Sex
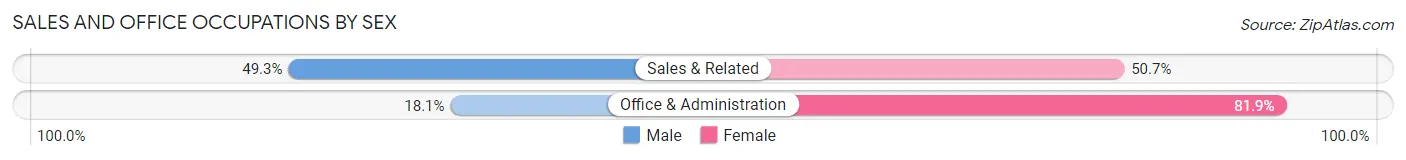
| Occupation | Male | Female |
| Sales & Related | 621 (49.3%) | 639 (50.7%) |
| Office & Administration | 223 (18.1%) | 1,008 (81.9%) |
| Total (Category) | 844 (33.9%) | 1,647 (66.1%) |
| Total (Overall) | 8,075 (59.5%) | 5,498 (40.5%) |
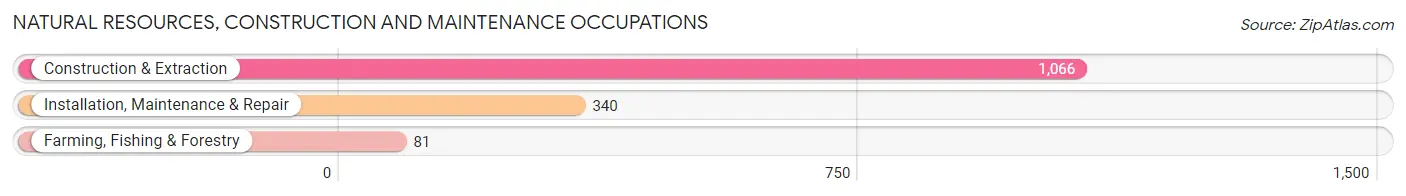
Natural Resources, Construction and Maintenance Occupations
The most common Natural Resources, Construction and Maintenance occupations in Lake Jackson are Construction & Extraction (1,066 | 7.9%), Installation, Maintenance & Repair (340 | 2.5%), and Farming, Fishing & Forestry (81 | 0.6%).
Natural Resources, Construction and Maintenance Occupations by Sex
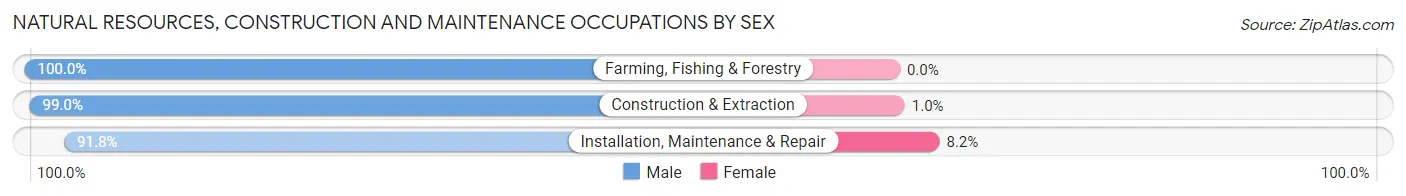
| Occupation | Male | Female |
| Farming, Fishing & Forestry | 81 (100.0%) | 0 (0.0%) |
| Construction & Extraction | 1,055 (99.0%) | 11 (1.0%) |
| Installation, Maintenance & Repair | 312 (91.8%) | 28 (8.2%) |
| Total (Category) | 1,448 (97.4%) | 39 (2.6%) |
| Total (Overall) | 8,075 (59.5%) | 5,498 (40.5%) |
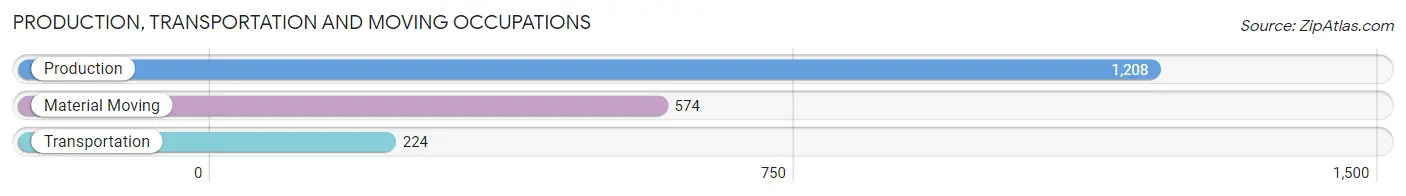
Production, Transportation and Moving Occupations
The most common Production, Transportation and Moving occupations in Lake Jackson are Production (1,208 | 8.9%), Material Moving (574 | 4.2%), and Transportation (224 | 1.7%).
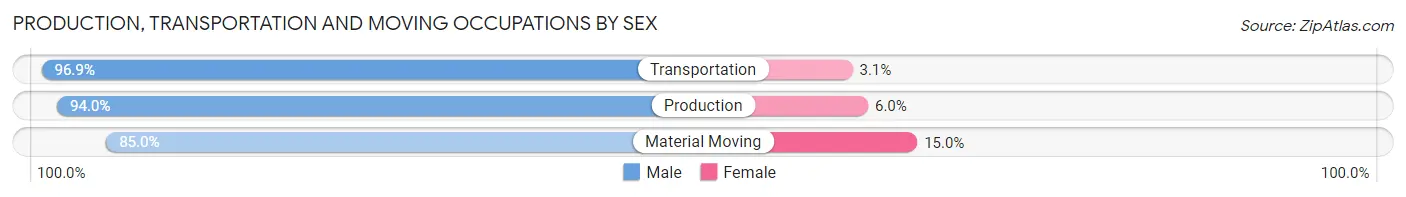
Production, Transportation and Moving Occupations by Sex
| Occupation | Male | Female |
| Production | 1,136 (94.0%) | 72 (6.0%) |
| Transportation | 217 (96.9%) | 7 (3.1%) |
| Material Moving | 488 (85.0%) | 86 (15.0%) |
| Total (Category) | 1,841 (91.8%) | 165 (8.2%) |
| Total (Overall) | 8,075 (59.5%) | 5,498 (40.5%) |
Employment Industries by Sex in Lake Jackson
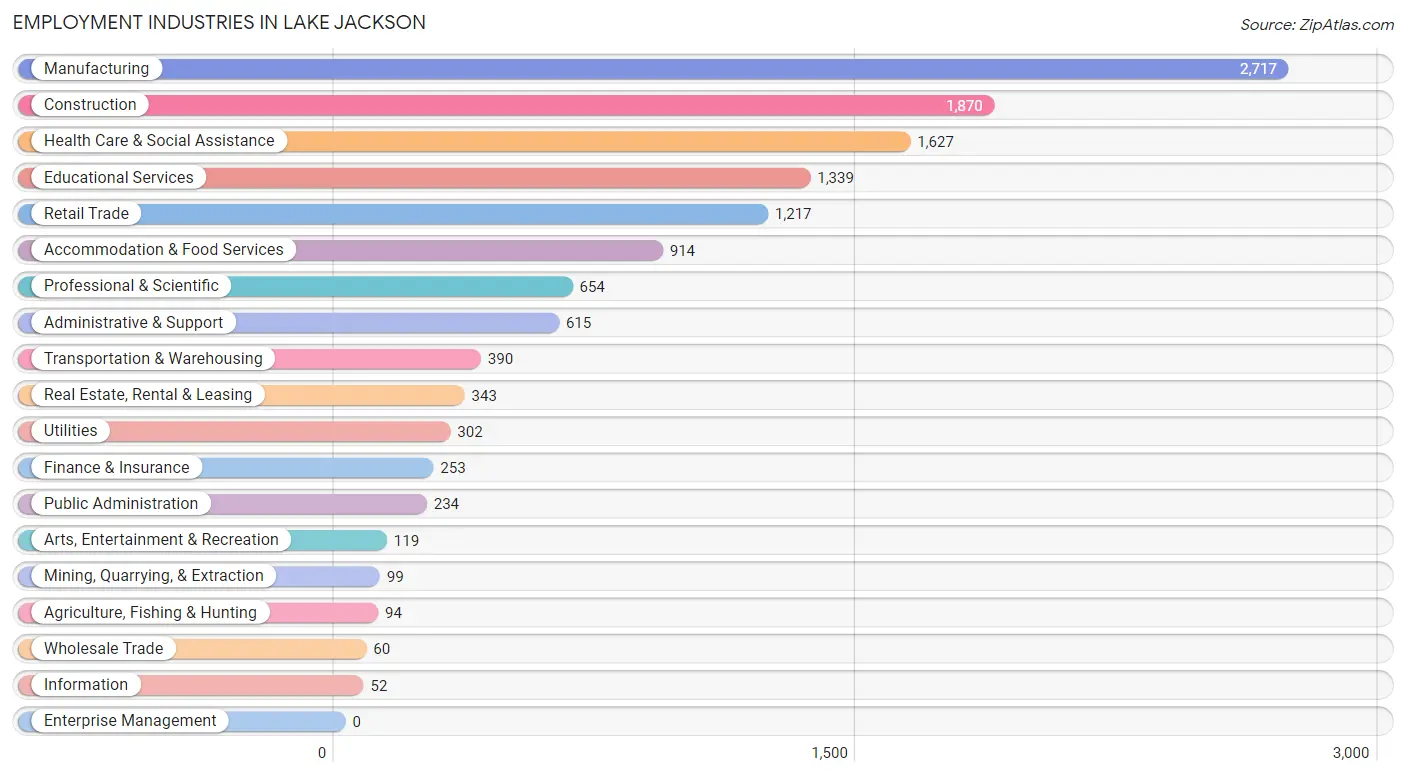
Employment Industries in Lake Jackson
The major employment industries in Lake Jackson include Manufacturing (2,717 | 20.0%), Construction (1,870 | 13.8%), Health Care & Social Assistance (1,627 | 12.0%), Educational Services (1,339 | 9.9%), and Retail Trade (1,217 | 9.0%).
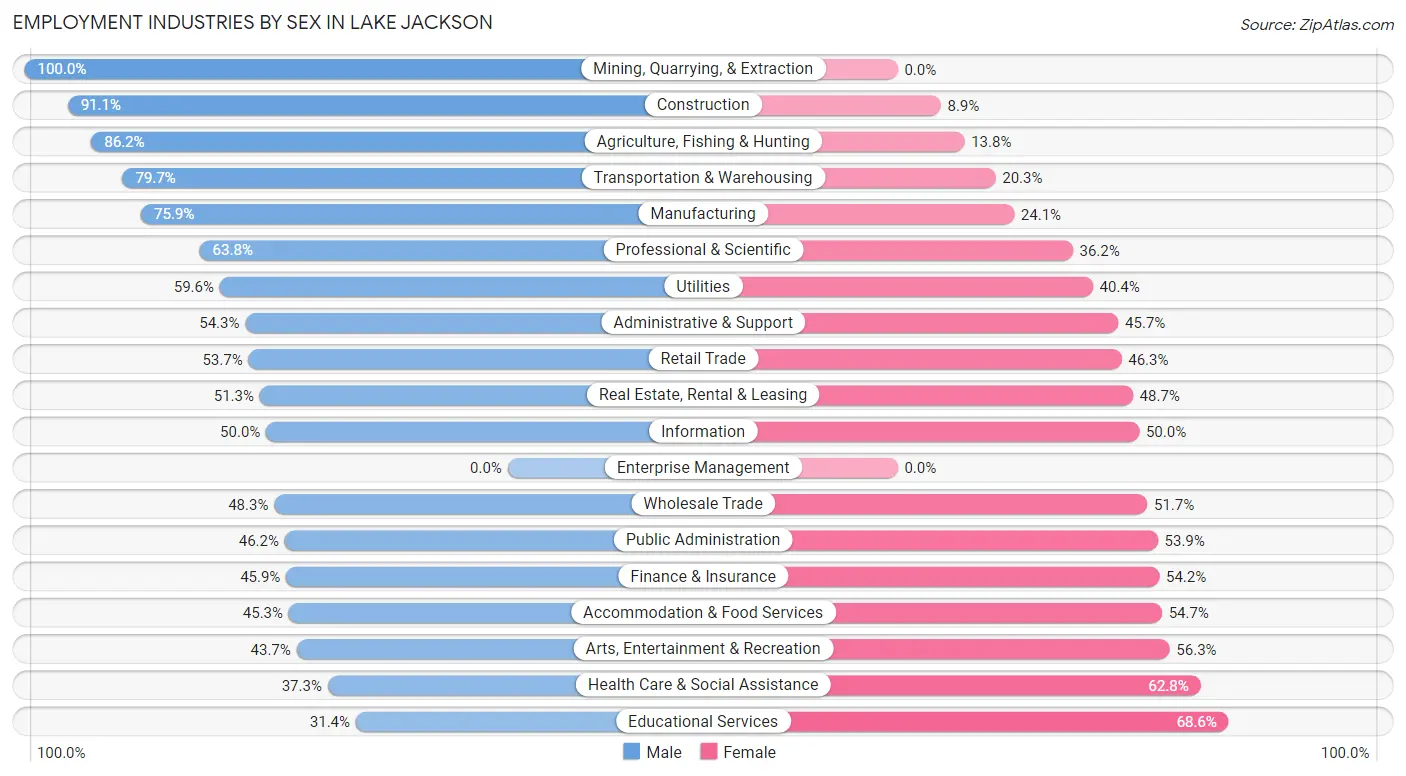
Employment Industries by Sex in Lake Jackson
The Lake Jackson industries that see more men than women are Mining, Quarrying, & Extraction (100.0%), Construction (91.1%), and Agriculture, Fishing & Hunting (86.2%), whereas the industries that tend to have a higher number of women are Educational Services (68.6%), Health Care & Social Assistance (62.7%), and Arts, Entertainment & Recreation (56.3%).
| Industry | Male | Female |
| Agriculture, Fishing & Hunting | 81 (86.2%) | 13 (13.8%) |
| Mining, Quarrying, & Extraction | 99 (100.0%) | 0 (0.0%) |
| Construction | 1,703 (91.1%) | 167 (8.9%) |
| Manufacturing | 2,062 (75.9%) | 655 (24.1%) |
| Wholesale Trade | 29 (48.3%) | 31 (51.7%) |
| Retail Trade | 653 (53.7%) | 564 (46.3%) |
| Transportation & Warehousing | 311 (79.7%) | 79 (20.3%) |
| Utilities | 180 (59.6%) | 122 (40.4%) |
| Information | 26 (50.0%) | 26 (50.0%) |
| Finance & Insurance | 116 (45.9%) | 137 (54.1%) |
| Real Estate, Rental & Leasing | 176 (51.3%) | 167 (48.7%) |
| Professional & Scientific | 417 (63.8%) | 237 (36.2%) |
| Enterprise Management | 0 (0.0%) | 0 (0.0%) |
| Administrative & Support | 334 (54.3%) | 281 (45.7%) |
| Educational Services | 421 (31.4%) | 918 (68.6%) |
| Health Care & Social Assistance | 606 (37.2%) | 1,021 (62.7%) |
| Arts, Entertainment & Recreation | 52 (43.7%) | 67 (56.3%) |
| Accommodation & Food Services | 414 (45.3%) | 500 (54.7%) |
| Public Administration | 108 (46.2%) | 126 (53.8%) |
| Total | 8,075 (59.5%) | 5,498 (40.5%) |
Education in Lake Jackson
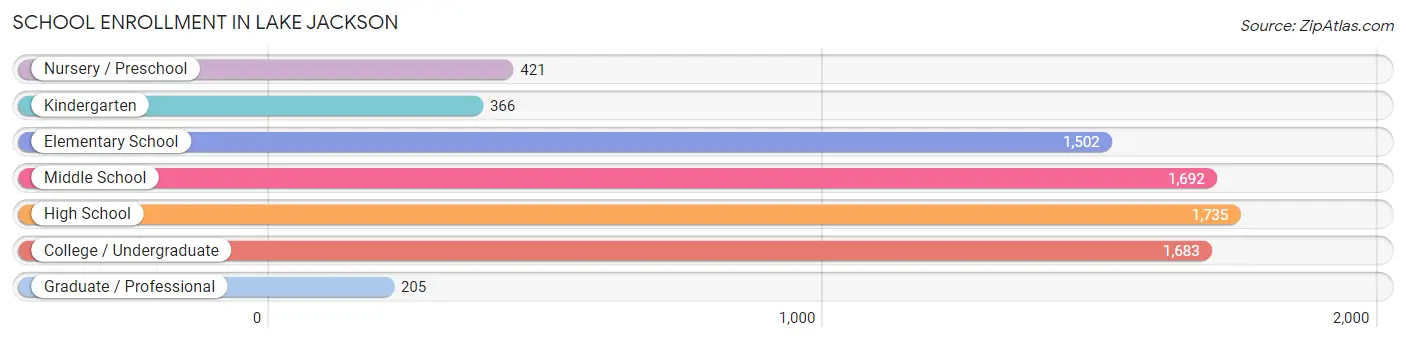
School Enrollment in Lake Jackson
The most common levels of schooling among the 7,604 students in Lake Jackson are high school (1,735 | 22.8%), middle school (1,692 | 22.3%), and college / undergraduate (1,683 | 22.1%).
| School Level | # Students | % Students |
| Nursery / Preschool | 421 | 5.5% |
| Kindergarten | 366 | 4.8% |
| Elementary School | 1,502 | 19.8% |
| Middle School | 1,692 | 22.3% |
| High School | 1,735 | 22.8% |
| College / Undergraduate | 1,683 | 22.1% |
| Graduate / Professional | 205 | 2.7% |
| Total | 7,604 | 100.0% |
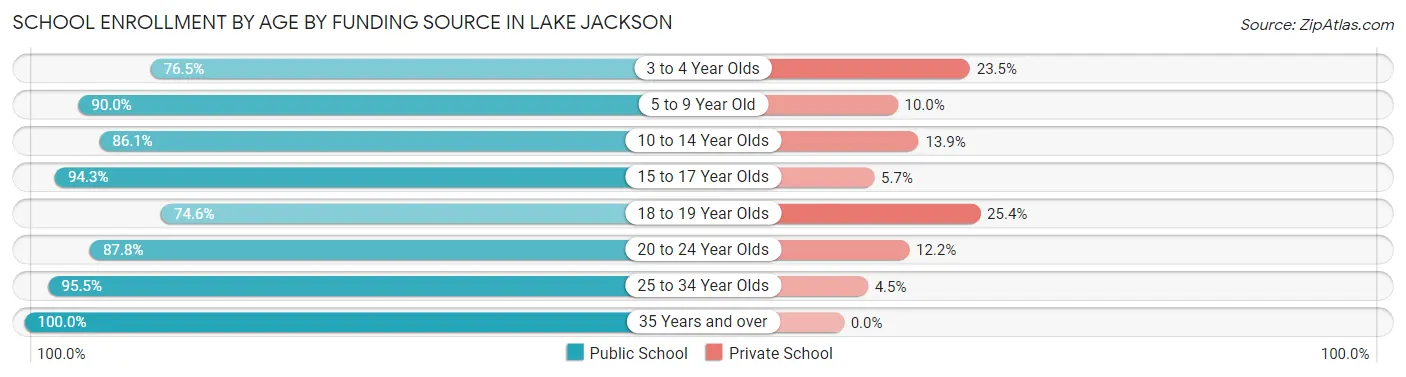
School Enrollment by Age by Funding Source in Lake Jackson
Out of a total of 7,604 students who are enrolled in schools in Lake Jackson, 874 (11.5%) attend a private institution, while the remaining 6,730 (88.5%) are enrolled in public schools. The age group of 18 to 19 year olds has the highest likelihood of being enrolled in private schools, with 135 (25.4% in the age bracket) enrolled. Conversely, the age group of 35 years and over has the lowest likelihood of being enrolled in a private school, with 222 (100.0% in the age bracket) attending a public institution.
| Age Bracket | Public School | Private School |
| 3 to 4 Year Olds | 280 (76.5%) | 86 (23.5%) |
| 5 to 9 Year Old | 1,642 (90.0%) | 183 (10.0%) |
| 10 to 14 Year Olds | 1,747 (86.1%) | 283 (13.9%) |
| 15 to 17 Year Olds | 1,180 (94.3%) | 71 (5.7%) |
| 18 to 19 Year Olds | 396 (74.6%) | 135 (25.4%) |
| 20 to 24 Year Olds | 642 (87.8%) | 89 (12.2%) |
| 25 to 34 Year Olds | 619 (95.5%) | 29 (4.5%) |
| 35 Years and over | 222 (100.0%) | 0 (0.0%) |
| Total | 6,730 (88.5%) | 874 (11.5%) |
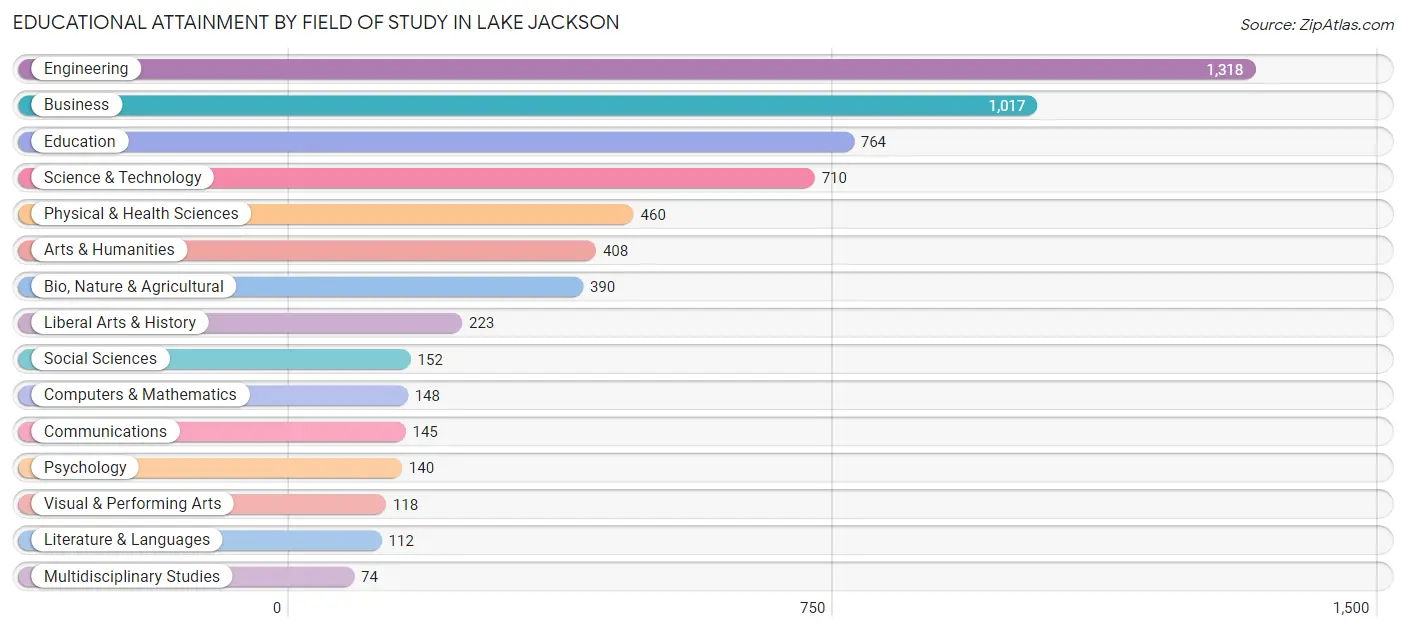
Educational Attainment by Field of Study in Lake Jackson
Engineering (1,318 | 21.3%), business (1,017 | 16.5%), education (764 | 12.4%), science & technology (710 | 11.5%), and physical & health sciences (460 | 7.4%) are the most common fields of study among 6,179 individuals in Lake Jackson who have obtained a bachelor's degree or higher.
| Field of Study | # Graduates | % Graduates |
| Computers & Mathematics | 148 | 2.4% |
| Bio, Nature & Agricultural | 390 | 6.3% |
| Physical & Health Sciences | 460 | 7.4% |
| Psychology | 140 | 2.3% |
| Social Sciences | 152 | 2.5% |
| Engineering | 1,318 | 21.3% |
| Multidisciplinary Studies | 74 | 1.2% |
| Science & Technology | 710 | 11.5% |
| Business | 1,017 | 16.5% |
| Education | 764 | 12.4% |
| Literature & Languages | 112 | 1.8% |
| Liberal Arts & History | 223 | 3.6% |
| Visual & Performing Arts | 118 | 1.9% |
| Communications | 145 | 2.4% |
| Arts & Humanities | 408 | 6.6% |
| Total | 6,179 | 100.0% |
Transportation & Commute in Lake Jackson
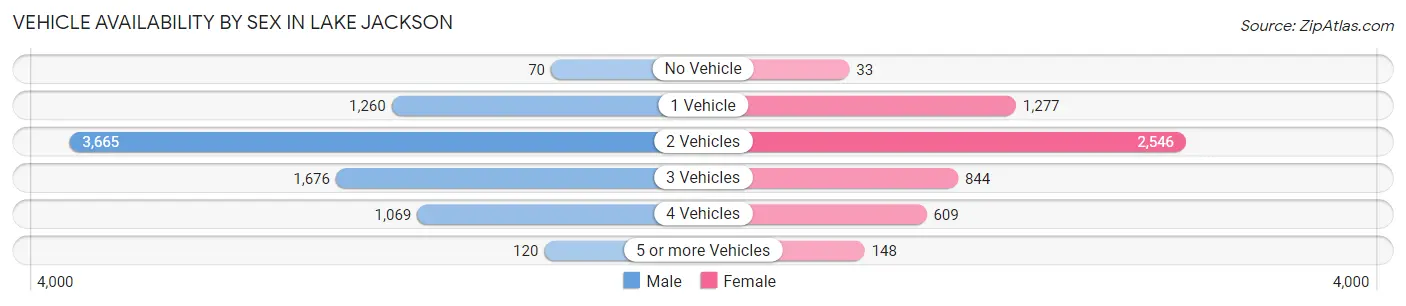
Vehicle Availability by Sex in Lake Jackson
The most prevalent vehicle ownership categories in Lake Jackson are males with 2 vehicles (3,665, accounting for 46.6%) and females with 2 vehicles (2,546, making up 67.2%).
| Vehicles Available | Male | Female |
| No Vehicle | 70 (0.9%) | 33 (0.6%) |
| 1 Vehicle | 1,260 (16.0%) | 1,277 (23.4%) |
| 2 Vehicles | 3,665 (46.6%) | 2,546 (46.7%) |
| 3 Vehicles | 1,676 (21.3%) | 844 (15.5%) |
| 4 Vehicles | 1,069 (13.6%) | 609 (11.2%) |
| 5 or more Vehicles | 120 (1.5%) | 148 (2.7%) |
| Total | 7,860 (100.0%) | 5,457 (100.0%) |
Commute Time in Lake Jackson
The most frequently occuring commute durations in Lake Jackson are 10 to 14 minutes (3,561 commuters, 28.0%), 5 to 9 minutes (2,990 commuters, 23.5%), and 15 to 19 minutes (1,744 commuters, 13.7%).
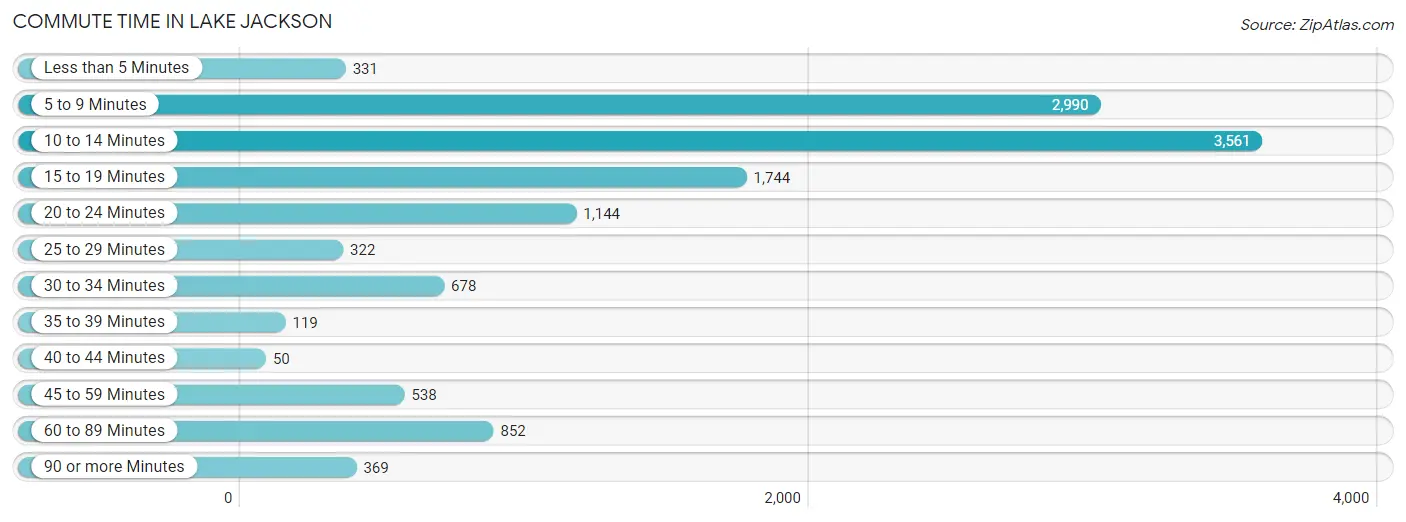
| Commute Time | # Commuters | % Commuters |
| Less than 5 Minutes | 331 | 2.6% |
| 5 to 9 Minutes | 2,990 | 23.5% |
| 10 to 14 Minutes | 3,561 | 28.0% |
| 15 to 19 Minutes | 1,744 | 13.7% |
| 20 to 24 Minutes | 1,144 | 9.0% |
| 25 to 29 Minutes | 322 | 2.5% |
| 30 to 34 Minutes | 678 | 5.3% |
| 35 to 39 Minutes | 119 | 0.9% |
| 40 to 44 Minutes | 50 | 0.4% |
| 45 to 59 Minutes | 538 | 4.2% |
| 60 to 89 Minutes | 852 | 6.7% |
| 90 or more Minutes | 369 | 2.9% |
Commute Time by Sex in Lake Jackson
The most common commute times in Lake Jackson are 10 to 14 minutes (2,028 commuters, 26.6%) for males and 10 to 14 minutes (1,533 commuters, 30.3%) for females.
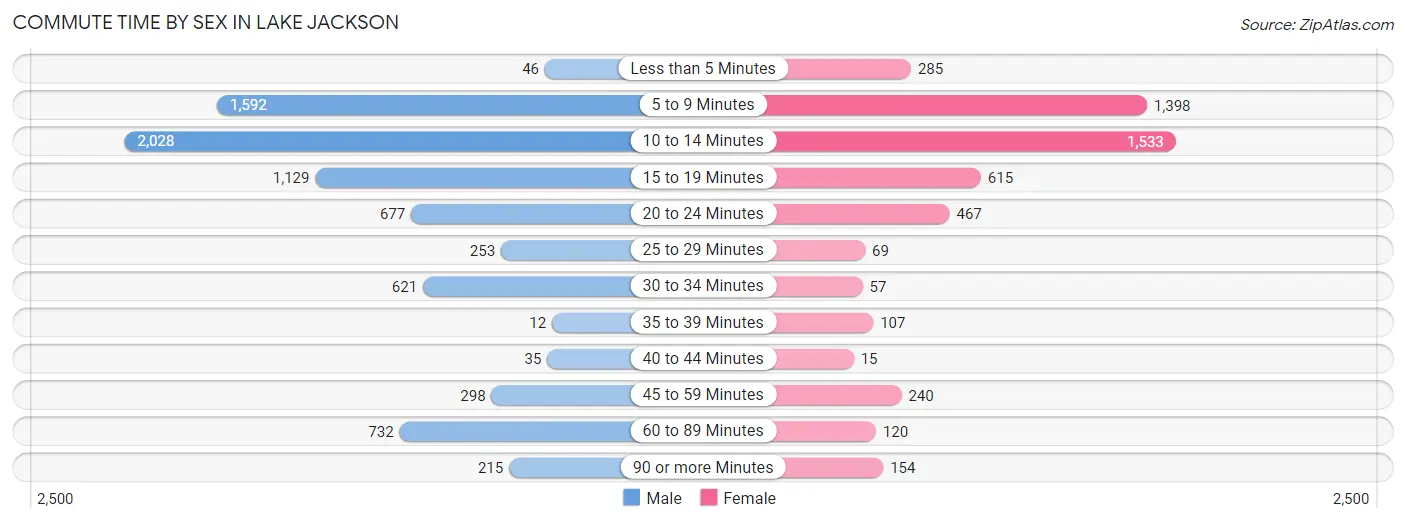
| Commute Time | Male | Female |
| Less than 5 Minutes | 46 (0.6%) | 285 (5.6%) |
| 5 to 9 Minutes | 1,592 (20.8%) | 1,398 (27.6%) |
| 10 to 14 Minutes | 2,028 (26.6%) | 1,533 (30.3%) |
| 15 to 19 Minutes | 1,129 (14.8%) | 615 (12.1%) |
| 20 to 24 Minutes | 677 (8.9%) | 467 (9.2%) |
| 25 to 29 Minutes | 253 (3.3%) | 69 (1.4%) |
| 30 to 34 Minutes | 621 (8.1%) | 57 (1.1%) |
| 35 to 39 Minutes | 12 (0.2%) | 107 (2.1%) |
| 40 to 44 Minutes | 35 (0.5%) | 15 (0.3%) |
| 45 to 59 Minutes | 298 (3.9%) | 240 (4.7%) |
| 60 to 89 Minutes | 732 (9.6%) | 120 (2.4%) |
| 90 or more Minutes | 215 (2.8%) | 154 (3.0%) |
Time of Departure to Work by Sex in Lake Jackson
The most frequent times of departure to work in Lake Jackson are 6:00 AM to 6:29 AM (1,164, 15.2%) for males and 7:00 AM to 7:29 AM (753, 14.9%) for females.
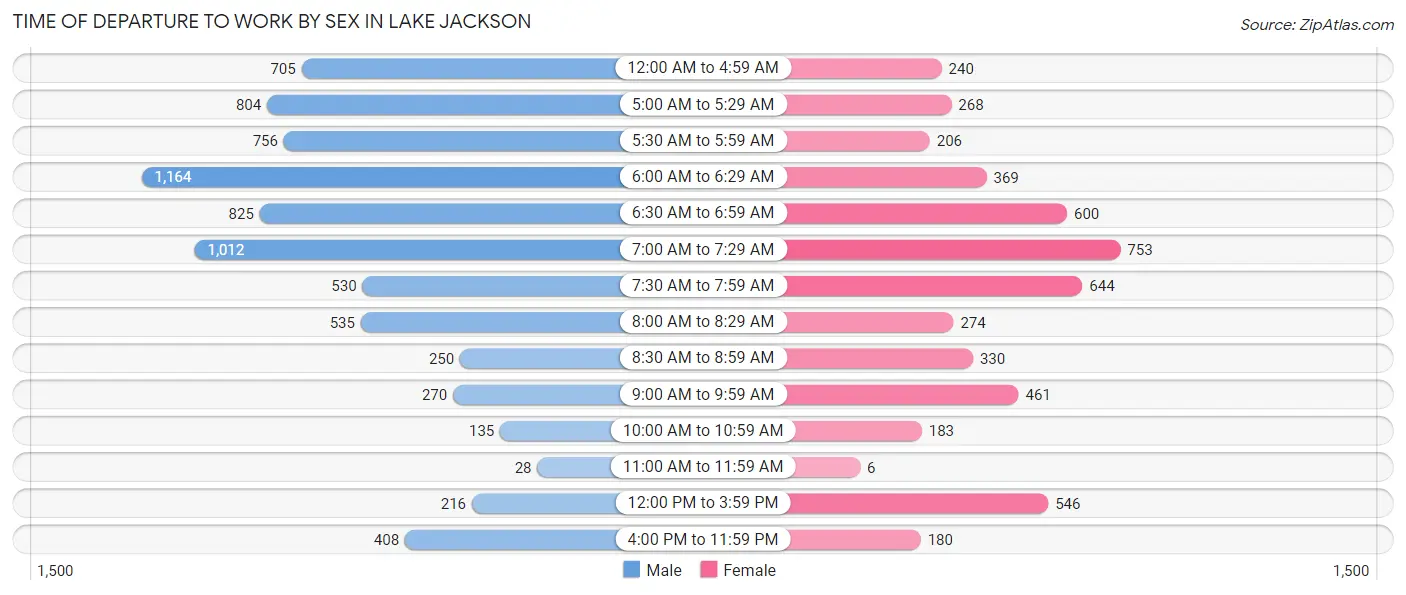
| Time of Departure | Male | Female |
| 12:00 AM to 4:59 AM | 705 (9.2%) | 240 (4.7%) |
| 5:00 AM to 5:29 AM | 804 (10.5%) | 268 (5.3%) |
| 5:30 AM to 5:59 AM | 756 (9.9%) | 206 (4.1%) |
| 6:00 AM to 6:29 AM | 1,164 (15.2%) | 369 (7.3%) |
| 6:30 AM to 6:59 AM | 825 (10.8%) | 600 (11.9%) |
| 7:00 AM to 7:29 AM | 1,012 (13.3%) | 753 (14.9%) |
| 7:30 AM to 7:59 AM | 530 (6.9%) | 644 (12.7%) |
| 8:00 AM to 8:29 AM | 535 (7.0%) | 274 (5.4%) |
| 8:30 AM to 8:59 AM | 250 (3.3%) | 330 (6.5%) |
| 9:00 AM to 9:59 AM | 270 (3.5%) | 461 (9.1%) |
| 10:00 AM to 10:59 AM | 135 (1.8%) | 183 (3.6%) |
| 11:00 AM to 11:59 AM | 28 (0.4%) | 6 (0.1%) |
| 12:00 PM to 3:59 PM | 216 (2.8%) | 546 (10.8%) |
| 4:00 PM to 11:59 PM | 408 (5.3%) | 180 (3.6%) |
| Total | 7,638 (100.0%) | 5,060 (100.0%) |
Housing Occupancy in Lake Jackson
Occupancy by Ownership in Lake Jackson
Of the total 10,558 dwellings in Lake Jackson, owner-occupied units account for 6,666 (63.1%), while renter-occupied units make up 3,892 (36.9%).
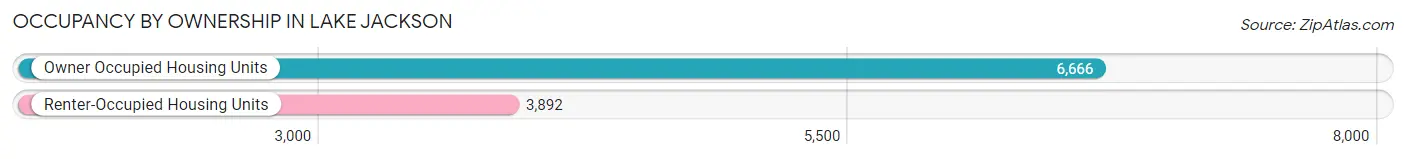
| Occupancy | # Housing Units | % Housing Units |
| Owner Occupied Housing Units | 6,666 | 63.1% |
| Renter-Occupied Housing Units | 3,892 | 36.9% |
| Total Occupied Housing Units | 10,558 | 100.0% |
Occupancy by Household Size in Lake Jackson
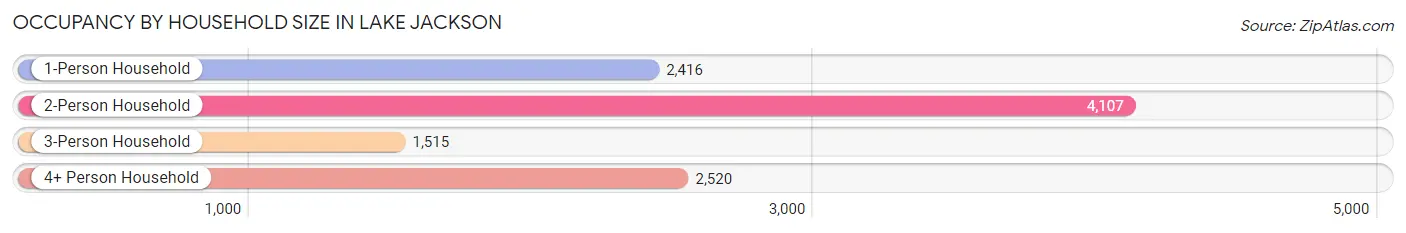
| Household Size | # Housing Units | % Housing Units |
| 1-Person Household | 2,416 | 22.9% |
| 2-Person Household | 4,107 | 38.9% |
| 3-Person Household | 1,515 | 14.3% |
| 4+ Person Household | 2,520 | 23.9% |
| Total Housing Units | 10,558 | 100.0% |
Occupancy by Ownership by Household Size in Lake Jackson
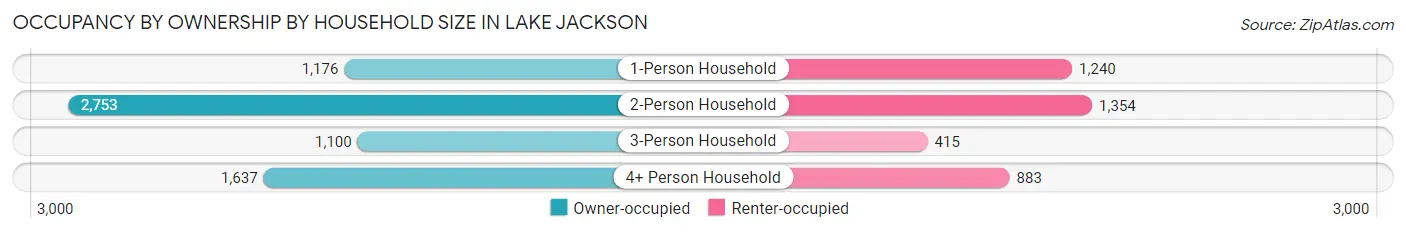
| Household Size | Owner-occupied | Renter-occupied |
| 1-Person Household | 1,176 (48.7%) | 1,240 (51.3%) |
| 2-Person Household | 2,753 (67.0%) | 1,354 (33.0%) |
| 3-Person Household | 1,100 (72.6%) | 415 (27.4%) |
| 4+ Person Household | 1,637 (65.0%) | 883 (35.0%) |
| Total Housing Units | 6,666 (63.1%) | 3,892 (36.9%) |
Occupancy by Educational Attainment in Lake Jackson
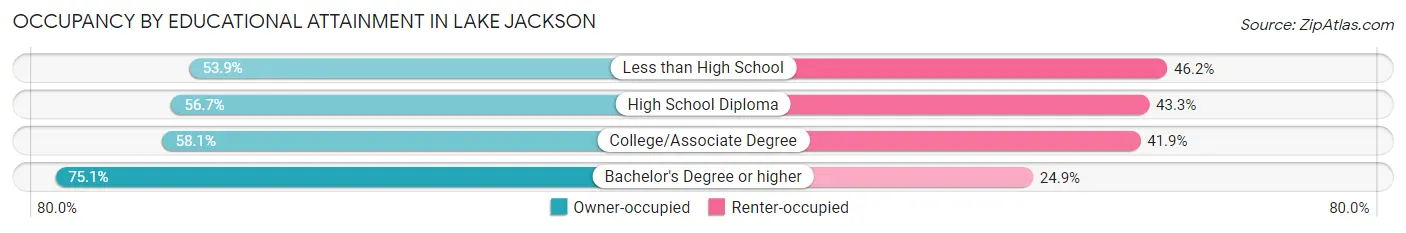
| Household Size | Owner-occupied | Renter-occupied |
| Less than High School | 357 (53.8%) | 306 (46.2%) |
| High School Diploma | 1,382 (56.7%) | 1,055 (43.3%) |
| College/Associate Degree | 2,310 (58.1%) | 1,665 (41.9%) |
| Bachelor's Degree or higher | 2,617 (75.1%) | 866 (24.9%) |
Occupancy by Age of Householder in Lake Jackson
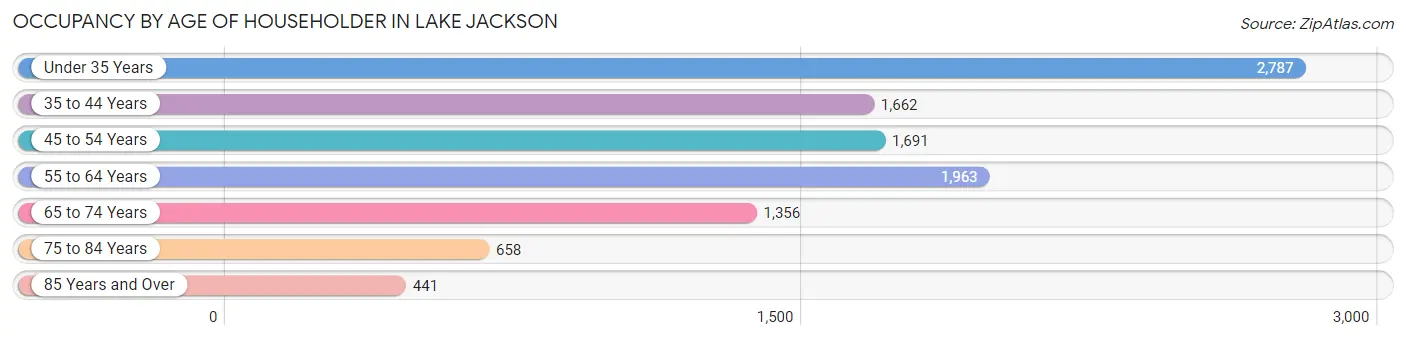
| Age Bracket | # Households | % Households |
| Under 35 Years | 2,787 | 26.4% |
| 35 to 44 Years | 1,662 | 15.7% |
| 45 to 54 Years | 1,691 | 16.0% |
| 55 to 64 Years | 1,963 | 18.6% |
| 65 to 74 Years | 1,356 | 12.8% |
| 75 to 84 Years | 658 | 6.2% |
| 85 Years and Over | 441 | 4.2% |
| Total | 10,558 | 100.0% |
Housing Finances in Lake Jackson
Median Income by Occupancy in Lake Jackson
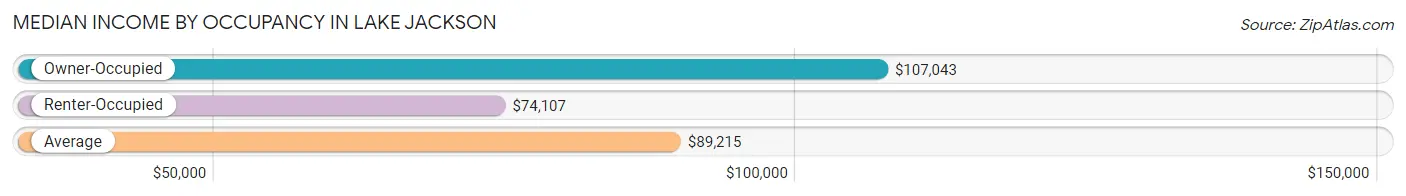
| Occupancy Type | # Households | Median Income |
| Owner-Occupied | 6,666 (63.1%) | $107,043 |
| Renter-Occupied | 3,892 (36.9%) | $74,107 |
| Average | 10,558 (100.0%) | $89,215 |
Occupancy by Householder Income Bracket in Lake Jackson
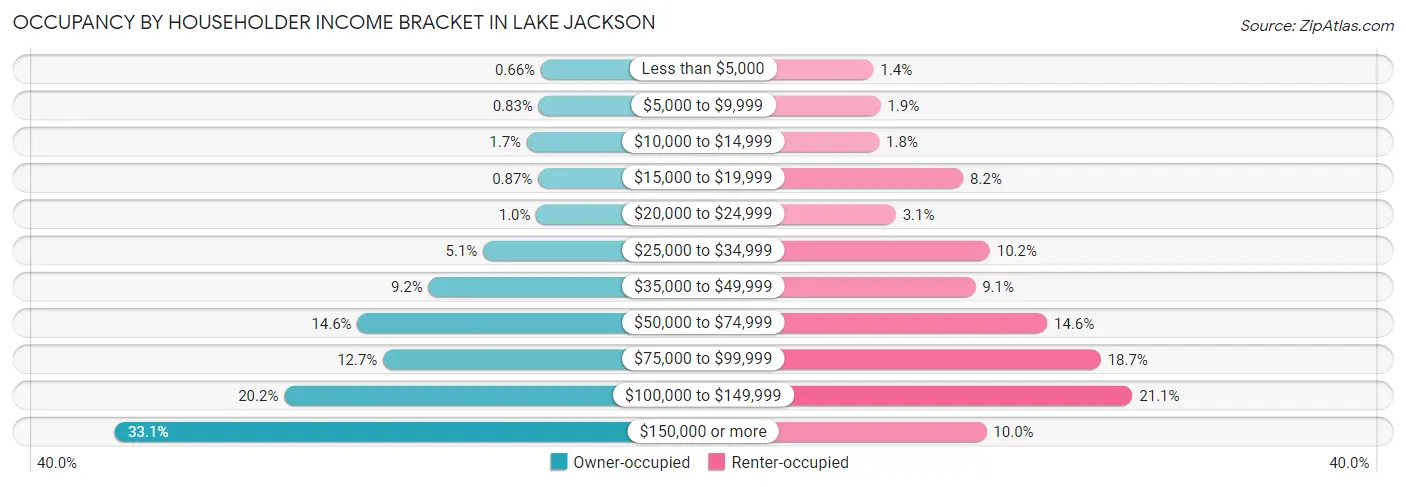
| Income Bracket | Owner-occupied | Renter-occupied |
| Less than $5,000 | 44 (0.7%) | 53 (1.4%) |
| $5,000 to $9,999 | 55 (0.8%) | 74 (1.9%) |
| $10,000 to $14,999 | 115 (1.7%) | 70 (1.8%) |
| $15,000 to $19,999 | 58 (0.9%) | 319 (8.2%) |
| $20,000 to $24,999 | 67 (1.0%) | 119 (3.1%) |
| $25,000 to $34,999 | 337 (5.1%) | 398 (10.2%) |
| $35,000 to $49,999 | 614 (9.2%) | 355 (9.1%) |
| $50,000 to $74,999 | 976 (14.6%) | 568 (14.6%) |
| $75,000 to $99,999 | 845 (12.7%) | 727 (18.7%) |
| $100,000 to $149,999 | 1,348 (20.2%) | 821 (21.1%) |
| $150,000 or more | 2,207 (33.1%) | 388 (10.0%) |
| Total | 6,666 (100.0%) | 3,892 (100.0%) |
Monthly Housing Cost Tiers in Lake Jackson
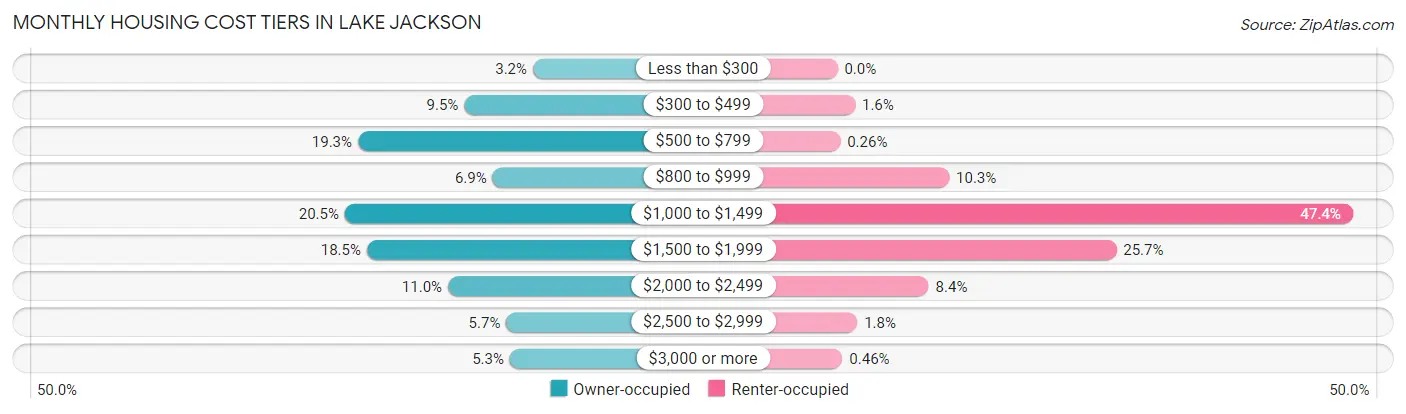
| Monthly Cost | Owner-occupied | Renter-occupied |
| Less than $300 | 214 (3.2%) | 0 (0.0%) |
| $300 to $499 | 635 (9.5%) | 63 (1.6%) |
| $500 to $799 | 1,288 (19.3%) | 10 (0.3%) |
| $800 to $999 | 461 (6.9%) | 400 (10.3%) |
| $1,000 to $1,499 | 1,368 (20.5%) | 1,846 (47.4%) |
| $1,500 to $1,999 | 1,233 (18.5%) | 999 (25.7%) |
| $2,000 to $2,499 | 735 (11.0%) | 327 (8.4%) |
| $2,500 to $2,999 | 377 (5.7%) | 71 (1.8%) |
| $3,000 or more | 355 (5.3%) | 18 (0.5%) |
| Total | 6,666 (100.0%) | 3,892 (100.0%) |
Physical Housing Characteristics in Lake Jackson
Housing Structures in Lake Jackson
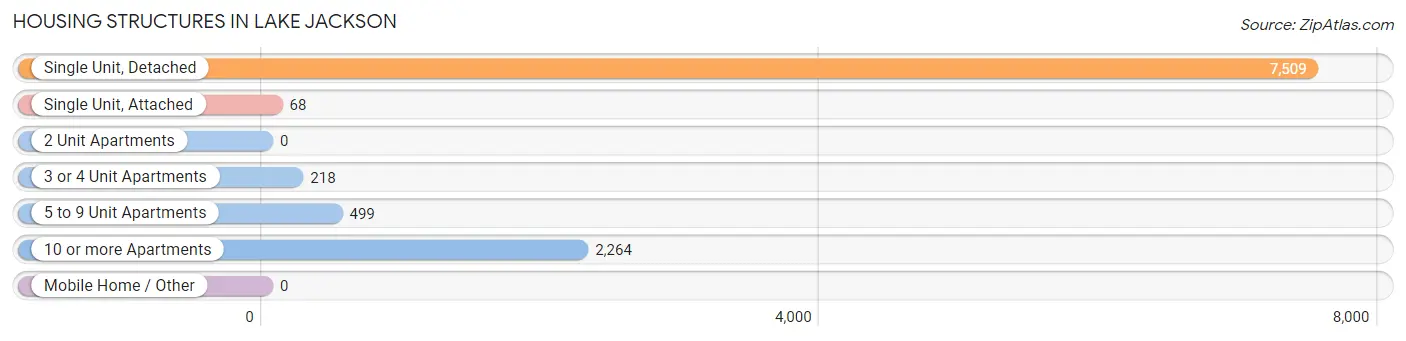
| Structure Type | # Housing Units | % Housing Units |
| Single Unit, Detached | 7,509 | 71.1% |
| Single Unit, Attached | 68 | 0.6% |
| 2 Unit Apartments | 0 | 0.0% |
| 3 or 4 Unit Apartments | 218 | 2.1% |
| 5 to 9 Unit Apartments | 499 | 4.7% |
| 10 or more Apartments | 2,264 | 21.4% |
| Mobile Home / Other | 0 | 0.0% |
| Total | 10,558 | 100.0% |
Housing Structures by Occupancy in Lake Jackson
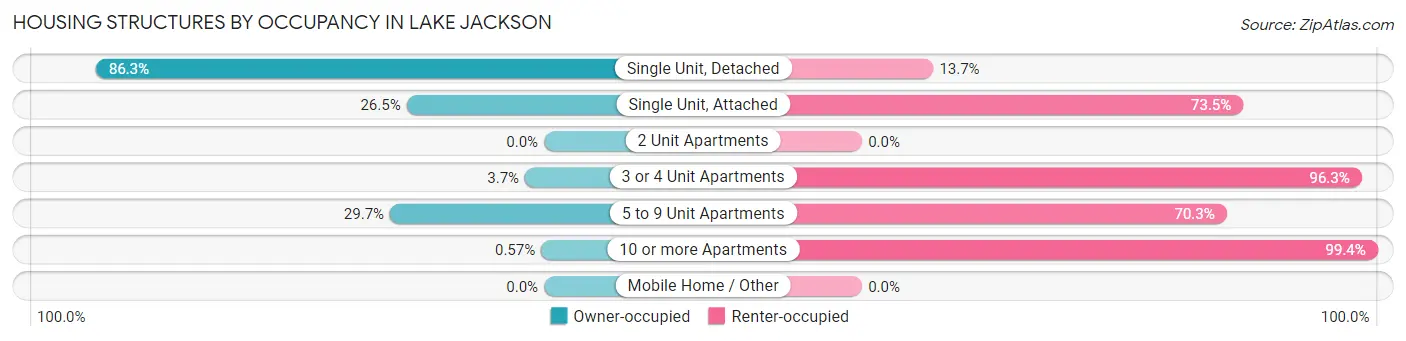
| Structure Type | Owner-occupied | Renter-occupied |
| Single Unit, Detached | 6,479 (86.3%) | 1,030 (13.7%) |
| Single Unit, Attached | 18 (26.5%) | 50 (73.5%) |
| 2 Unit Apartments | 0 (0.0%) | 0 (0.0%) |
| 3 or 4 Unit Apartments | 8 (3.7%) | 210 (96.3%) |
| 5 to 9 Unit Apartments | 148 (29.7%) | 351 (70.3%) |
| 10 or more Apartments | 13 (0.6%) | 2,251 (99.4%) |
| Mobile Home / Other | 0 (0.0%) | 0 (0.0%) |
| Total | 6,666 (63.1%) | 3,892 (36.9%) |
Housing Structures by Number of Rooms in Lake Jackson
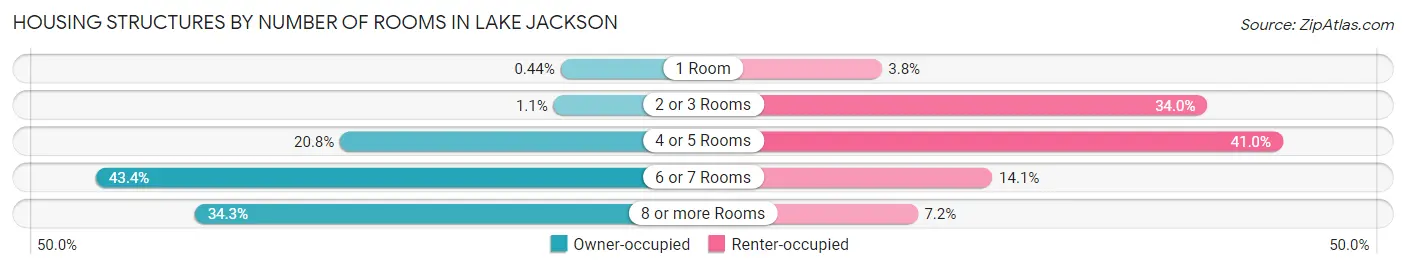
| Number of Rooms | Owner-occupied | Renter-occupied |
| 1 Room | 29 (0.4%) | 149 (3.8%) |
| 2 or 3 Rooms | 72 (1.1%) | 1,322 (34.0%) |
| 4 or 5 Rooms | 1,388 (20.8%) | 1,594 (41.0%) |
| 6 or 7 Rooms | 2,893 (43.4%) | 548 (14.1%) |
| 8 or more Rooms | 2,284 (34.3%) | 279 (7.2%) |
| Total | 6,666 (100.0%) | 3,892 (100.0%) |
Housing Structure by Heating Type in Lake Jackson
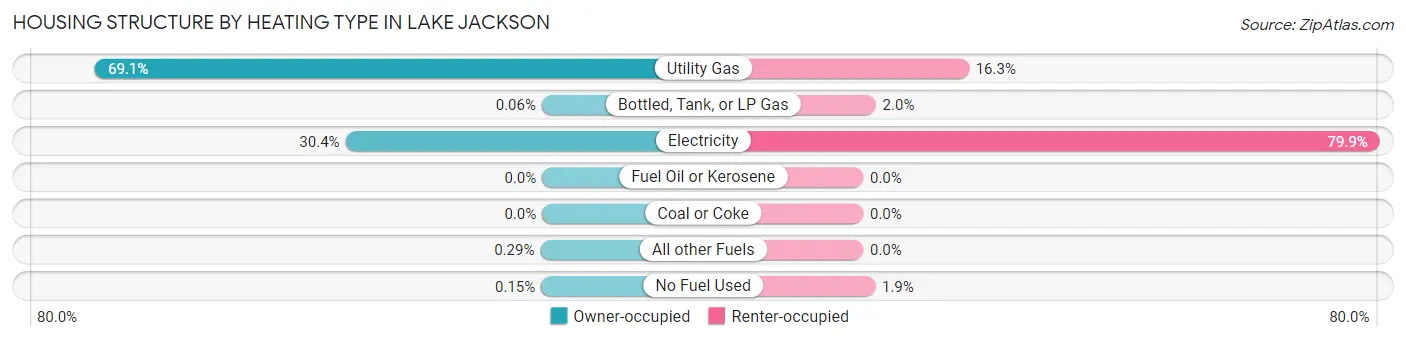
| Heating Type | Owner-occupied | Renter-occupied |
| Utility Gas | 4,606 (69.1%) | 636 (16.3%) |
| Bottled, Tank, or LP Gas | 4 (0.1%) | 76 (1.9%) |
| Electricity | 2,027 (30.4%) | 3,108 (79.9%) |
| Fuel Oil or Kerosene | 0 (0.0%) | 0 (0.0%) |
| Coal or Coke | 0 (0.0%) | 0 (0.0%) |
| All other Fuels | 19 (0.3%) | 0 (0.0%) |
| No Fuel Used | 10 (0.2%) | 72 (1.8%) |
| Total | 6,666 (100.0%) | 3,892 (100.0%) |
Household Vehicle Usage in Lake Jackson
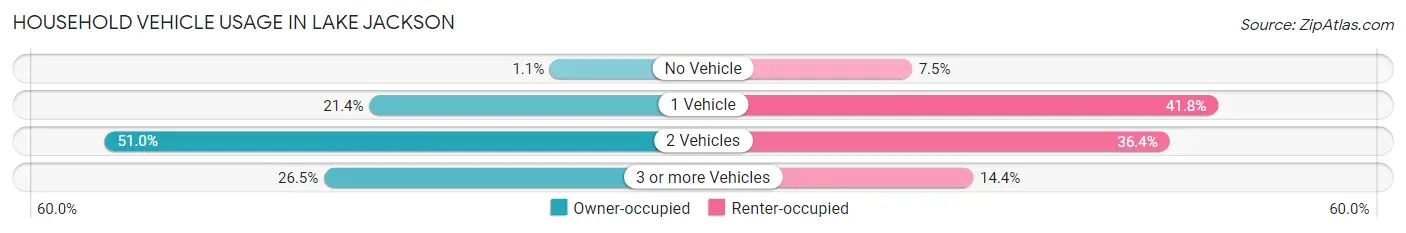
| Vehicles per Household | Owner-occupied | Renter-occupied |
| No Vehicle | 76 (1.1%) | 291 (7.5%) |
| 1 Vehicle | 1,425 (21.4%) | 1,627 (41.8%) |
| 2 Vehicles | 3,402 (51.0%) | 1,415 (36.4%) |
| 3 or more Vehicles | 1,763 (26.5%) | 559 (14.4%) |
| Total | 6,666 (100.0%) | 3,892 (100.0%) |
Real Estate & Mortgages in Lake Jackson
Real Estate and Mortgage Overview in Lake Jackson
| Characteristic | Without Mortgage | With Mortgage |
| Housing Units | 3,309 | 3,357 |
| Median Property Value | $225,700 | $253,100 |
| Median Household Income | $86,438 | $1,331 |
| Monthly Housing Costs | $693 | $321 |
| Real Estate Taxes | $3,123 | $35 |
Property Value by Mortgage Status in Lake Jackson
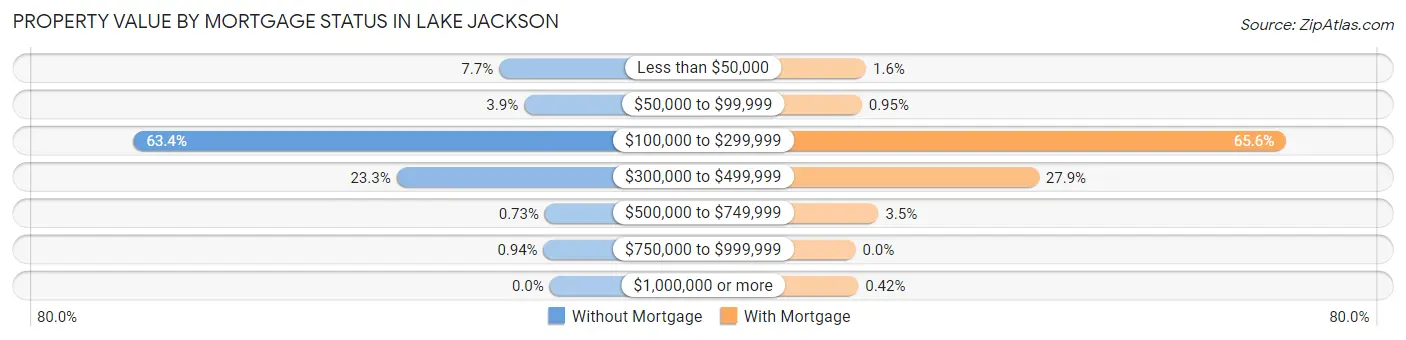
| Property Value | Without Mortgage | With Mortgage |
| Less than $50,000 | 255 (7.7%) | 54 (1.6%) |
| $50,000 to $99,999 | 129 (3.9%) | 32 (0.9%) |
| $100,000 to $299,999 | 2,098 (63.4%) | 2,202 (65.6%) |
| $300,000 to $499,999 | 772 (23.3%) | 938 (27.9%) |
| $500,000 to $749,999 | 24 (0.7%) | 117 (3.5%) |
| $750,000 to $999,999 | 31 (0.9%) | 0 (0.0%) |
| $1,000,000 or more | 0 (0.0%) | 14 (0.4%) |
| Total | 3,309 (100.0%) | 3,357 (100.0%) |
Household Income by Mortgage Status in Lake Jackson
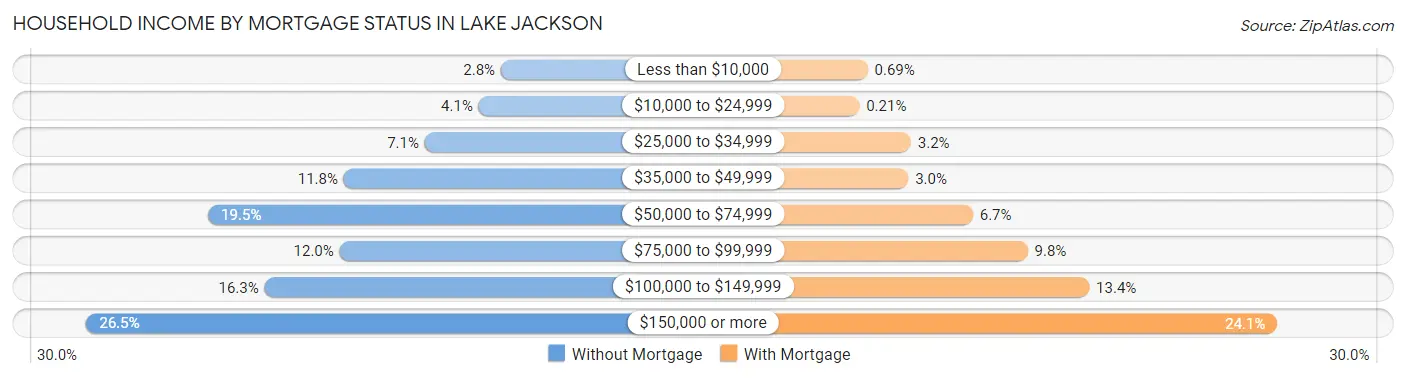
| Household Income | Without Mortgage | With Mortgage |
| Less than $10,000 | 92 (2.8%) | 23 (0.7%) |
| $10,000 to $24,999 | 134 (4.1%) | 7 (0.2%) |
| $25,000 to $34,999 | 236 (7.1%) | 106 (3.2%) |
| $35,000 to $49,999 | 389 (11.8%) | 101 (3.0%) |
| $50,000 to $74,999 | 646 (19.5%) | 225 (6.7%) |
| $75,000 to $99,999 | 397 (12.0%) | 330 (9.8%) |
| $100,000 to $149,999 | 539 (16.3%) | 448 (13.4%) |
| $150,000 or more | 876 (26.5%) | 809 (24.1%) |
| Total | 3,309 (100.0%) | 3,357 (100.0%) |
Property Value to Household Income Ratio in Lake Jackson
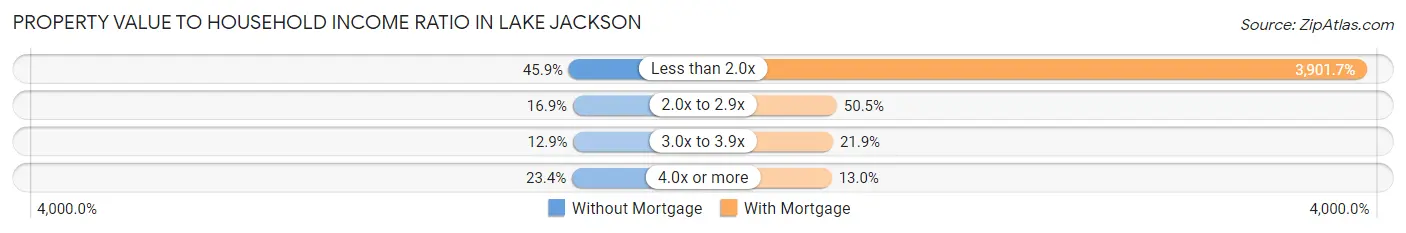
| Value-to-Income Ratio | Without Mortgage | With Mortgage |
| Less than 2.0x | 1,518 (45.9%) | 130,981 (3,901.7%) |
| 2.0x to 2.9x | 558 (16.9%) | 1,696 (50.5%) |
| 3.0x to 3.9x | 427 (12.9%) | 734 (21.9%) |
| 4.0x or more | 773 (23.4%) | 437 (13.0%) |
| Total | 3,309 (100.0%) | 3,357 (100.0%) |
Real Estate Taxes by Mortgage Status in Lake Jackson
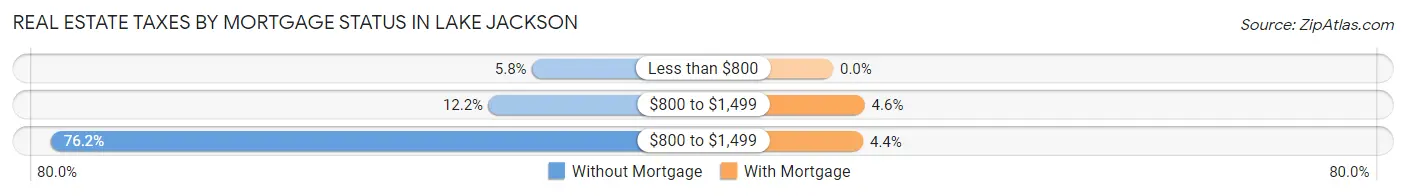
| Property Taxes | Without Mortgage | With Mortgage |
| Less than $800 | 192 (5.8%) | 0 (0.0%) |
| $800 to $1,499 | 402 (12.1%) | 155 (4.6%) |
| $800 to $1,499 | 2,520 (76.2%) | 147 (4.4%) |
| Total | 3,309 (100.0%) | 3,357 (100.0%) |
Health & Disability in Lake Jackson
Health Insurance Coverage by Age in Lake Jackson
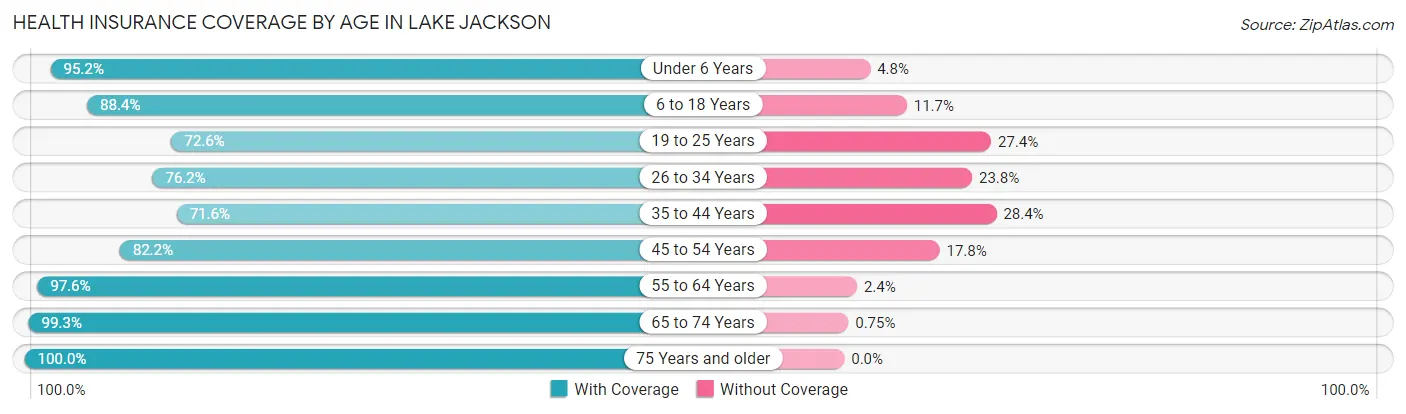
| Age Bracket | With Coverage | Without Coverage |
| Under 6 Years | 1,913 (95.2%) | 97 (4.8%) |
| 6 to 18 Years | 4,801 (88.3%) | 633 (11.7%) |
| 19 to 25 Years | 2,241 (72.6%) | 845 (27.4%) |
| 26 to 34 Years | 2,986 (76.2%) | 934 (23.8%) |
| 35 to 44 Years | 2,333 (71.6%) | 924 (28.4%) |
| 45 to 54 Years | 2,463 (82.2%) | 532 (17.8%) |
| 55 to 64 Years | 3,549 (97.6%) | 86 (2.4%) |
| 65 to 74 Years | 2,121 (99.3%) | 16 (0.7%) |
| 75 Years and older | 1,396 (100.0%) | 0 (0.0%) |
| Total | 23,803 (85.4%) | 4,067 (14.6%) |
Health Insurance Coverage by Citizenship Status in Lake Jackson
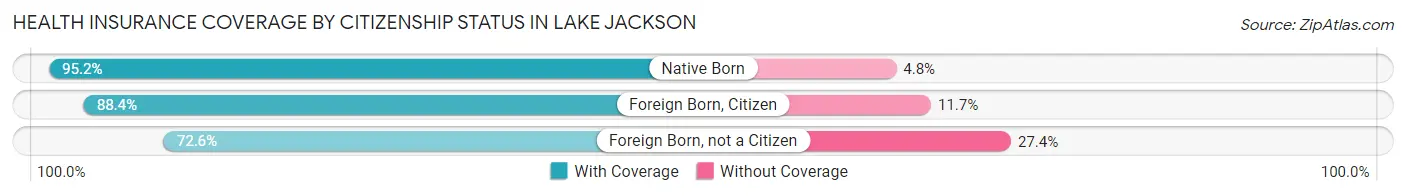
| Citizenship Status | With Coverage | Without Coverage |
| Native Born | 1,913 (95.2%) | 97 (4.8%) |
| Foreign Born, Citizen | 4,801 (88.3%) | 633 (11.7%) |
| Foreign Born, not a Citizen | 2,241 (72.6%) | 845 (27.4%) |
Health Insurance Coverage by Household Income in Lake Jackson
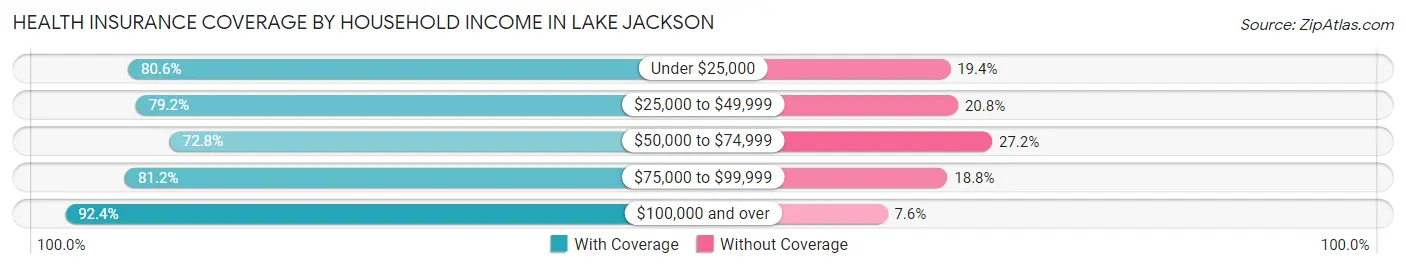
| Household Income | With Coverage | Without Coverage |
| Under $25,000 | 1,722 (80.6%) | 414 (19.4%) |
| $25,000 to $49,999 | 3,197 (79.2%) | 841 (20.8%) |
| $50,000 to $74,999 | 2,793 (72.8%) | 1,044 (27.2%) |
| $75,000 to $99,999 | 2,947 (81.2%) | 684 (18.8%) |
| $100,000 and over | 13,141 (92.4%) | 1,084 (7.6%) |
Public vs Private Health Insurance Coverage by Age in Lake Jackson
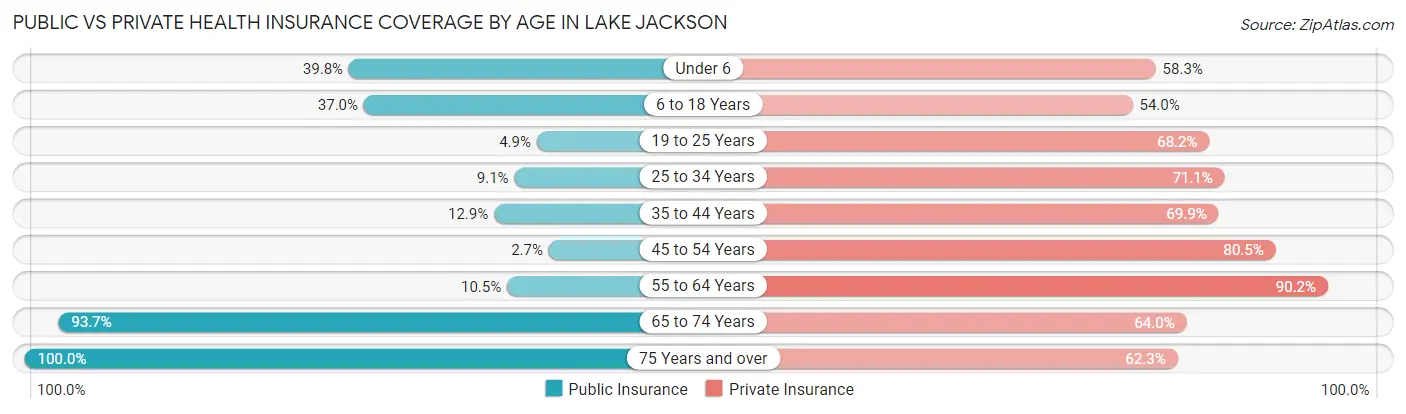
| Age Bracket | Public Insurance | Private Insurance |
| Under 6 | 800 (39.8%) | 1,171 (58.3%) |
| 6 to 18 Years | 2,012 (37.0%) | 2,932 (54.0%) |
| 19 to 25 Years | 152 (4.9%) | 2,105 (68.2%) |
| 25 to 34 Years | 356 (9.1%) | 2,786 (71.1%) |
| 35 to 44 Years | 419 (12.9%) | 2,278 (69.9%) |
| 45 to 54 Years | 81 (2.7%) | 2,411 (80.5%) |
| 55 to 64 Years | 380 (10.4%) | 3,279 (90.2%) |
| 65 to 74 Years | 2,003 (93.7%) | 1,367 (64.0%) |
| 75 Years and over | 1,396 (100.0%) | 870 (62.3%) |
| Total | 7,599 (27.3%) | 19,199 (68.9%) |
Disability Status by Sex by Age in Lake Jackson
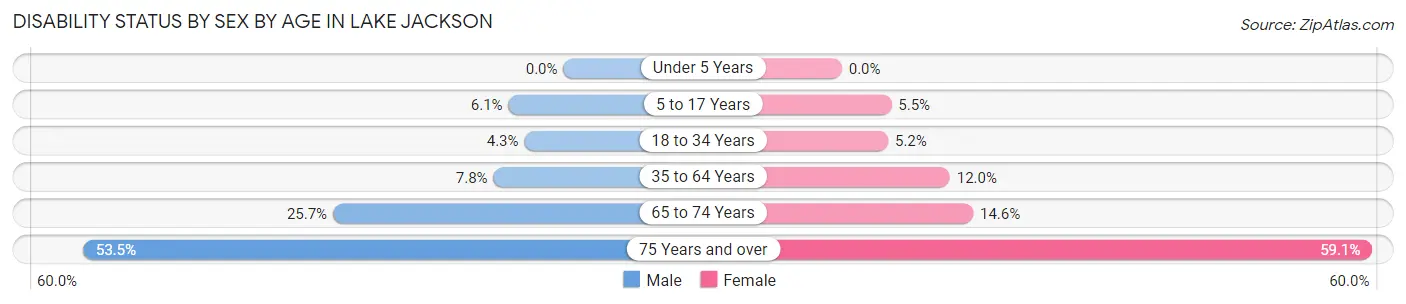
| Age Bracket | Male | Female |
| Under 5 Years | 0 (0.0%) | 0 (0.0%) |
| 5 to 17 Years | 168 (6.1%) | 142 (5.5%) |
| 18 to 34 Years | 185 (4.3%) | 161 (5.1%) |
| 35 to 64 Years | 369 (7.8%) | 620 (12.0%) |
| 65 to 74 Years | 264 (25.7%) | 162 (14.6%) |
| 75 Years and over | 266 (53.5%) | 531 (59.1%) |
Disability Class by Sex by Age in Lake Jackson
Disability Class: Hearing Difficulty
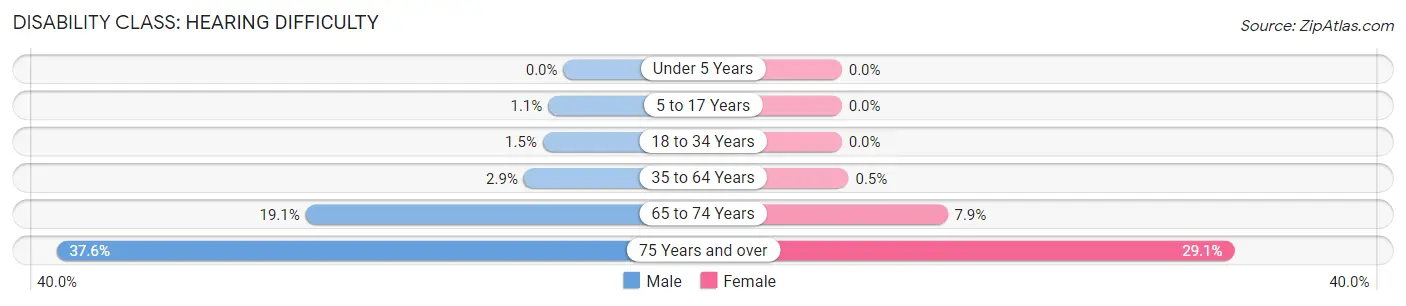
| Age Bracket | Male | Female |
| Under 5 Years | 0 (0.0%) | 0 (0.0%) |
| 5 to 17 Years | 31 (1.1%) | 0 (0.0%) |
| 18 to 34 Years | 65 (1.5%) | 0 (0.0%) |
| 35 to 64 Years | 139 (2.9%) | 26 (0.5%) |
| 65 to 74 Years | 197 (19.1%) | 87 (7.9%) |
| 75 Years and over | 187 (37.6%) | 262 (29.1%) |
Disability Class: Vision Difficulty
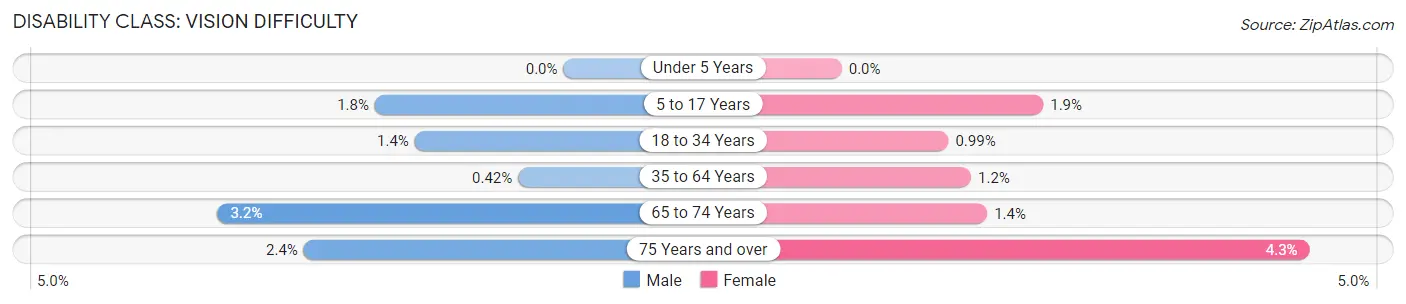
| Age Bracket | Male | Female |
| Under 5 Years | 0 (0.0%) | 0 (0.0%) |
| 5 to 17 Years | 48 (1.8%) | 48 (1.9%) |
| 18 to 34 Years | 59 (1.4%) | 31 (1.0%) |
| 35 to 64 Years | 20 (0.4%) | 62 (1.2%) |
| 65 to 74 Years | 33 (3.2%) | 15 (1.3%) |
| 75 Years and over | 12 (2.4%) | 39 (4.3%) |
Disability Class: Cognitive Difficulty
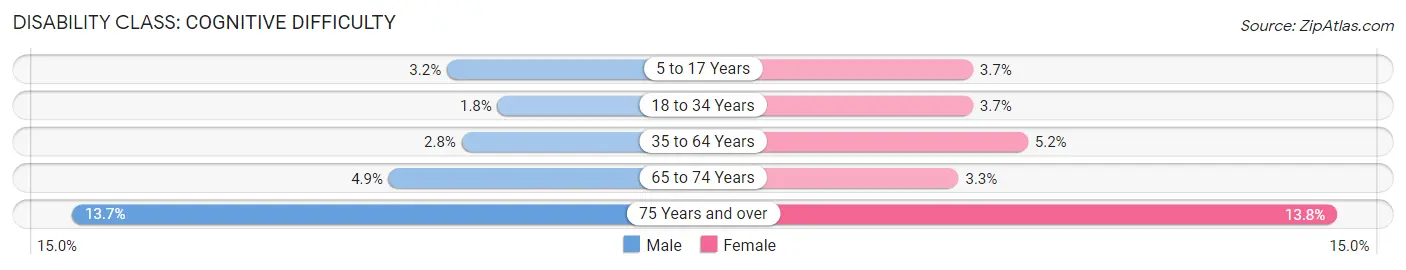
| Age Bracket | Male | Female |
| 5 to 17 Years | 89 (3.2%) | 94 (3.6%) |
| 18 to 34 Years | 78 (1.8%) | 114 (3.6%) |
| 35 to 64 Years | 134 (2.8%) | 267 (5.2%) |
| 65 to 74 Years | 50 (4.9%) | 36 (3.3%) |
| 75 Years and over | 68 (13.7%) | 124 (13.8%) |
Disability Class: Ambulatory Difficulty
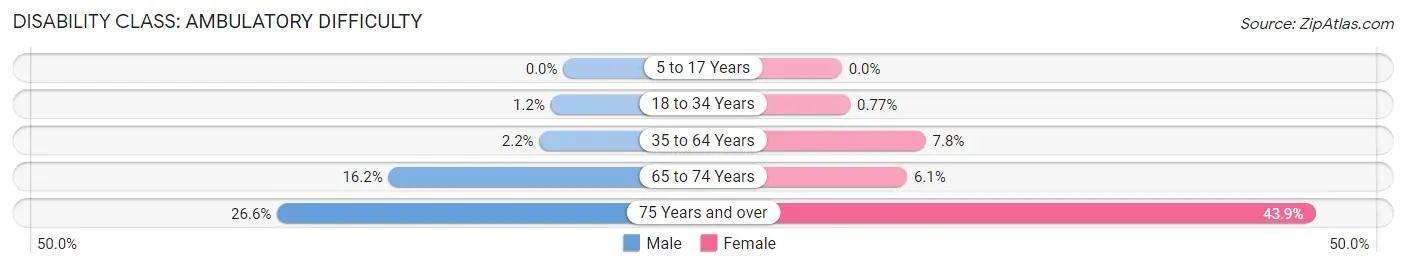
| Age Bracket | Male | Female |
| 5 to 17 Years | 0 (0.0%) | 0 (0.0%) |
| 18 to 34 Years | 50 (1.2%) | 24 (0.8%) |
| 35 to 64 Years | 105 (2.2%) | 401 (7.8%) |
| 65 to 74 Years | 167 (16.2%) | 67 (6.0%) |
| 75 Years and over | 132 (26.6%) | 395 (43.9%) |
Disability Class: Self-Care Difficulty
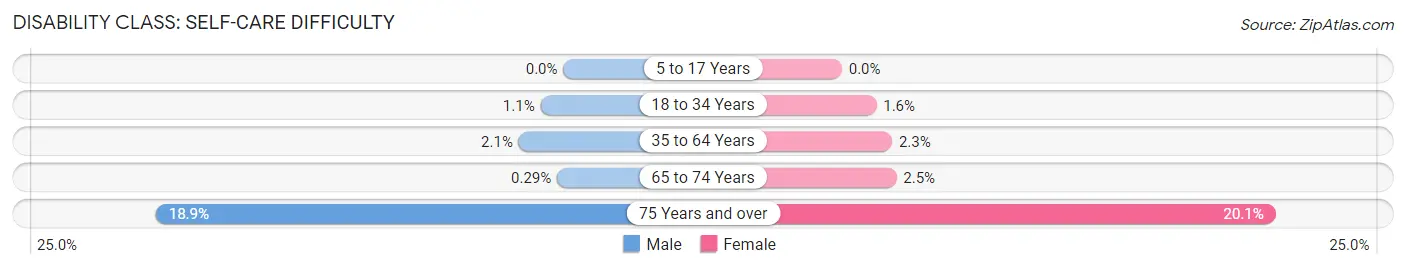
| Age Bracket | Male | Female |
| 5 to 17 Years | 0 (0.0%) | 0 (0.0%) |
| 18 to 34 Years | 45 (1.1%) | 50 (1.6%) |
| 35 to 64 Years | 98 (2.1%) | 120 (2.3%) |
| 65 to 74 Years | 3 (0.3%) | 28 (2.5%) |
| 75 Years and over | 94 (18.9%) | 181 (20.1%) |
Technology Access in Lake Jackson
Computing Device Access in Lake Jackson
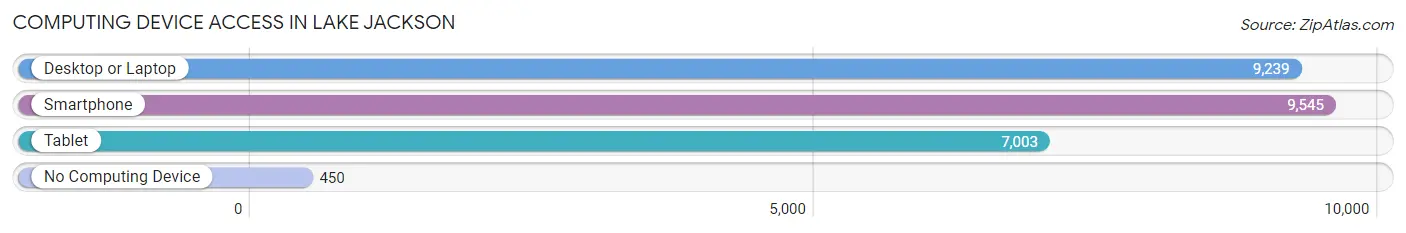
| Device Type | # Households | % Households |
| Desktop or Laptop | 9,239 | 87.5% |
| Smartphone | 9,545 | 90.4% |
| Tablet | 7,003 | 66.3% |
| No Computing Device | 450 | 4.3% |
| Total | 10,558 | 100.0% |
Internet Access in Lake Jackson
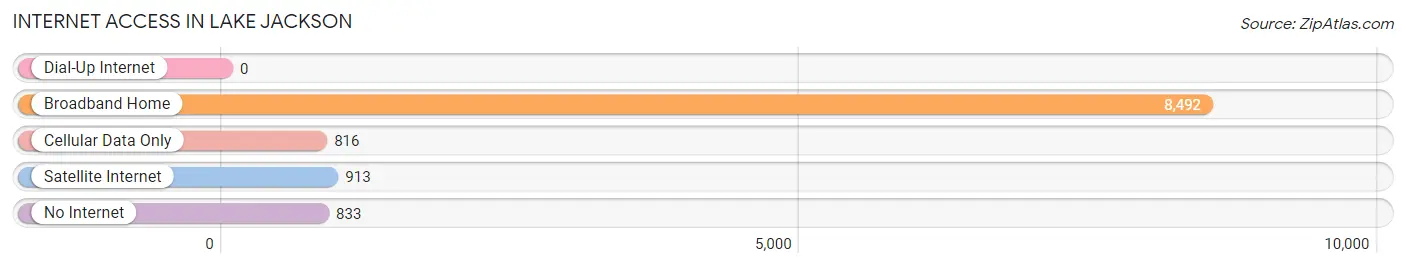
| Internet Type | # Households | % Households |
| Dial-Up Internet | 0 | 0.0% |
| Broadband Home | 8,492 | 80.4% |
| Cellular Data Only | 816 | 7.7% |
| Satellite Internet | 913 | 8.6% |
| No Internet | 833 | 7.9% |
| Total | 10,558 | 100.0% |
Lake Jackson Summary
History
Lake Jackson is a city located in Brazoria County, Texas, United States. It is situated approximately 40 miles south of Houston and is part of the Greater Houston metropolitan area. The city was founded in 1941 by the Dow Chemical Company and was named after a nearby lake. The city was incorporated in 1944 and has since grown to a population of over 27,000 people.
The area around Lake Jackson was originally inhabited by the Karankawa Indians, who were hunter-gatherers that lived along the coast of Texas. The first European settlers arrived in the area in the early 1800s and began to establish farms and ranches. The area was known as “Old Velasco” and was a popular trading post for the area.
In 1941, the Dow Chemical Company purchased a large tract of land in the area and began to develop a new city. The city was named after a nearby lake, which was named after the daughter of a local rancher. The city was officially incorporated in 1944 and quickly grew in population.
Geography
Lake Jackson is located in Brazoria County, Texas, approximately 40 miles south of Houston. The city is situated on the Gulf Coast and is bordered by the cities of Clute, Freeport, and Angleton. The city covers an area of approximately 11.5 square miles and has a population of over 27,000 people.
The city is located on the Gulf Coast and is surrounded by several bodies of water, including the Brazos River, Oyster Creek, and the San Bernard River. The city is also home to several parks, including the Lake Jackson City Park, the Brazosport Nature Center, and the Brazosport Museum of Natural Science.
Economy
The economy of Lake Jackson is largely driven by the petrochemical industry. The city is home to several major petrochemical companies, including Dow Chemical, BASF, and Chevron Phillips. The city is also home to several other industries, including manufacturing, retail, and healthcare.
The city is also home to several educational institutions, including Brazosport College, Texas A&M University at Galveston, and the University of Houston at Clear Lake. The city is also home to several major employers, including Dow Chemical, BASF, and Chevron Phillips.
Demographics
As of the 2010 census, the population of Lake Jackson was 27,614. The racial makeup of the city was 79.2% White, 11.2% African American, 0.7% Native American, 1.7% Asian, 0.1% Pacific Islander, 4.7% from other races, and 2.4% from two or more races. Hispanic or Latino of any race were 16.2% of the population.
The median income for a household in the city was $50,945, and the median income for a family was $60,945. The per capita income for the city was $25,945. About 8.2% of families and 10.3% of the population were below the poverty line, including 14.2% of those under age 18 and 6.2% of those age 65 or over.
Lake Jackson is a diverse city with a rich history and a vibrant economy. The city is home to several major employers and educational institutions, and is a popular destination for tourists and residents alike. The city is also home to several parks and recreational areas, making it a great place to live and visit.
Common Questions
What is Per Capita Income in Lake Jackson?
Per Capita income in Lake Jackson is $42,143.
What is the Median Family Income in Lake Jackson?
Median Family Income in Lake Jackson is $102,689.
What is the Median Household income in Lake Jackson?
Median Household Income in Lake Jackson is $89,215.
What is Income or Wage Gap in Lake Jackson?
Income or Wage Gap in Lake Jackson is 45.5%.
Women in Lake Jackson earn 54.5 cents for every dollar earned by a man.
What is Family Income Deficit in Lake Jackson?
Family Income Deficit in Lake Jackson is $7,599.
Families that are below poverty line in Lake Jackson earn $7,599 less on average than the poverty threshold level.
What is Inequality or Gini Index in Lake Jackson?
Inequality or Gini Index in Lake Jackson is 0.40.
What is the Total Population of Lake Jackson?
Total Population of Lake Jackson is 27,954.
What is the Total Male Population of Lake Jackson?
Total Male Population of Lake Jackson is 14,133.
What is the Total Female Population of Lake Jackson?
Total Female Population of Lake Jackson is 13,821.
What is the Ratio of Males per 100 Females in Lake Jackson?
There are 102.26 Males per 100 Females in Lake Jackson.
What is the Ratio of Females per 100 Males in Lake Jackson?
There are 97.79 Females per 100 Males in Lake Jackson.
What is the Median Population Age in Lake Jackson?
Median Population Age in Lake Jackson is 33.6 Years.
What is the Average Family Size in Lake Jackson
Average Family Size in Lake Jackson is 3.2 People.
What is the Average Household Size in Lake Jackson
Average Household Size in Lake Jackson is 2.6 People.
How Large is the Labor Force in Lake Jackson?
There are 14,591 People in the Labor Forcein in Lake Jackson.
What is the Percentage of People in the Labor Force in Lake Jackson?
67.4% of People are in the Labor Force in Lake Jackson.
What is the Unemployment Rate in Lake Jackson?
Unemployment Rate in Lake Jackson is 7.0%.