Zip Codes with the Highest Percentage of Population Employed in Architecture & Engineering in Athens, TX
RELATED REPORTS & OPTIONS
Architecture & Engineering
Athens
Compare Zip Codes
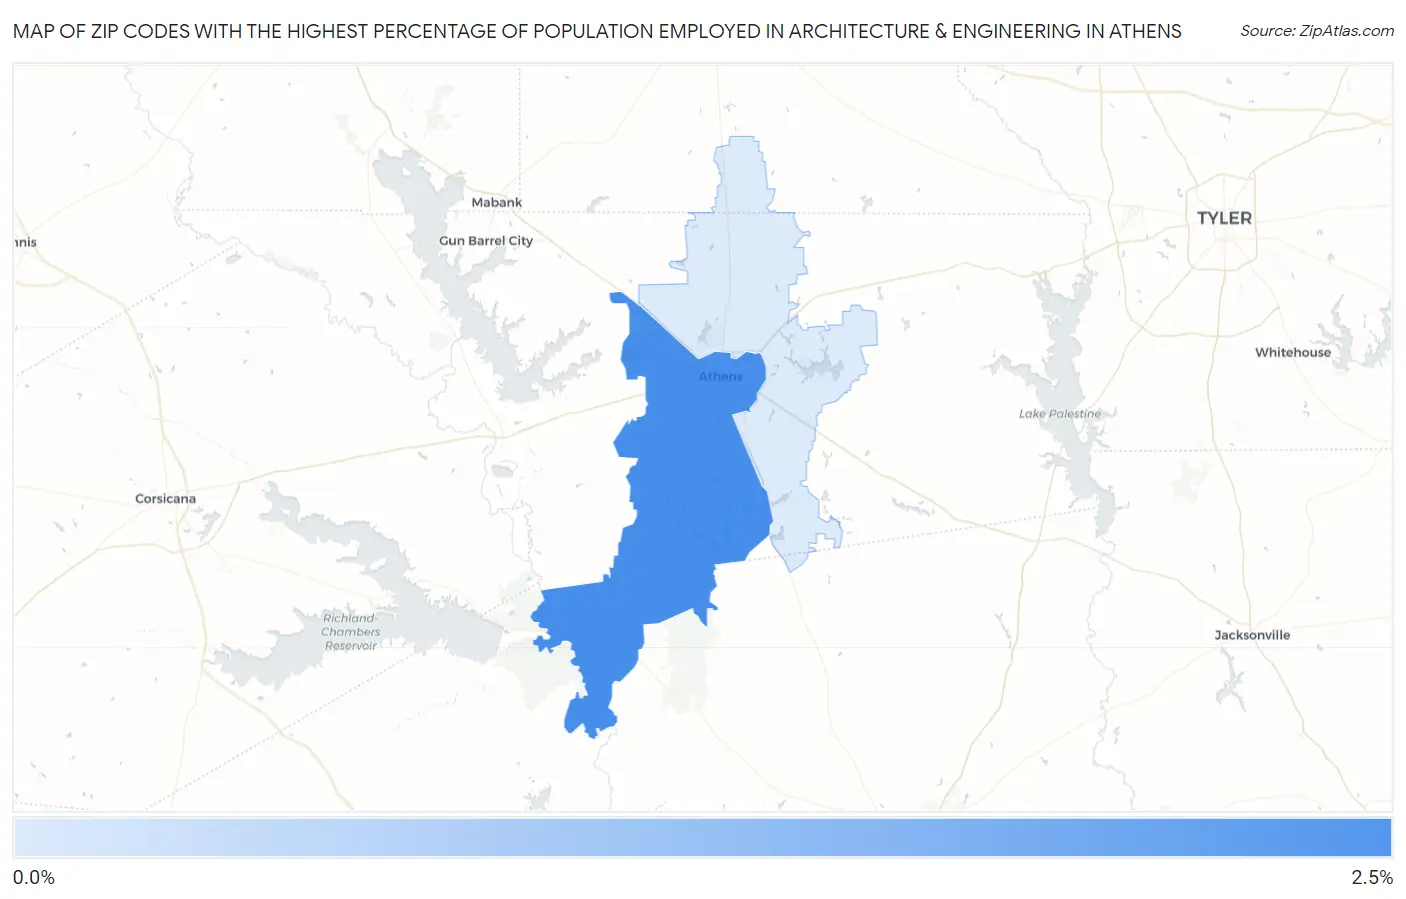
Map of Zip Codes with the Highest Percentage of Population Employed in Architecture & Engineering in Athens
0.50%
2.1%
Zip Codes with the Highest Percentage of Population Employed in Architecture & Engineering in Athens, TX
| Zip Code | % Employed | vs State | vs National | |
| 1. | 75751 | 2.1% | 2.2%(-0.127)#494 | 2.1%(-0.054)#9,070 |
| 2. | 75752 | 0.50% | 2.2%(-1.72)#1,127 | 2.1%(-1.65)#20,304 |
1
Common Questions
What are the Top Zip Codes with the Highest Percentage of Population Employed in Architecture & Engineering in Athens, TX?
Top Zip Codes with the Highest Percentage of Population Employed in Architecture & Engineering in Athens, TX are:
What zip code has the Highest Percentage of Population Employed in Architecture & Engineering in Athens, TX?
75751 has the Highest Percentage of Population Employed in Architecture & Engineering in Athens, TX with 2.1%.
What is the Percentage of Population Employed in Architecture & Engineering in Athens, TX?
Percentage of Population Employed in Architecture & Engineering in Athens is 2.2%.
What is the Percentage of Population Employed in Architecture & Engineering in Texas?
Percentage of Population Employed in Architecture & Engineering in Texas is 2.2%.
What is the Percentage of Population Employed in Architecture & Engineering in the United States?
Percentage of Population Employed in Architecture & Engineering in the United States is 2.1%.