Zip Codes with the Highest Percentage of Population Employed in Architecture & Engineering in Fort Worth, TX
RELATED REPORTS & OPTIONS
Architecture & Engineering
Fort Worth
Compare Zip Codes
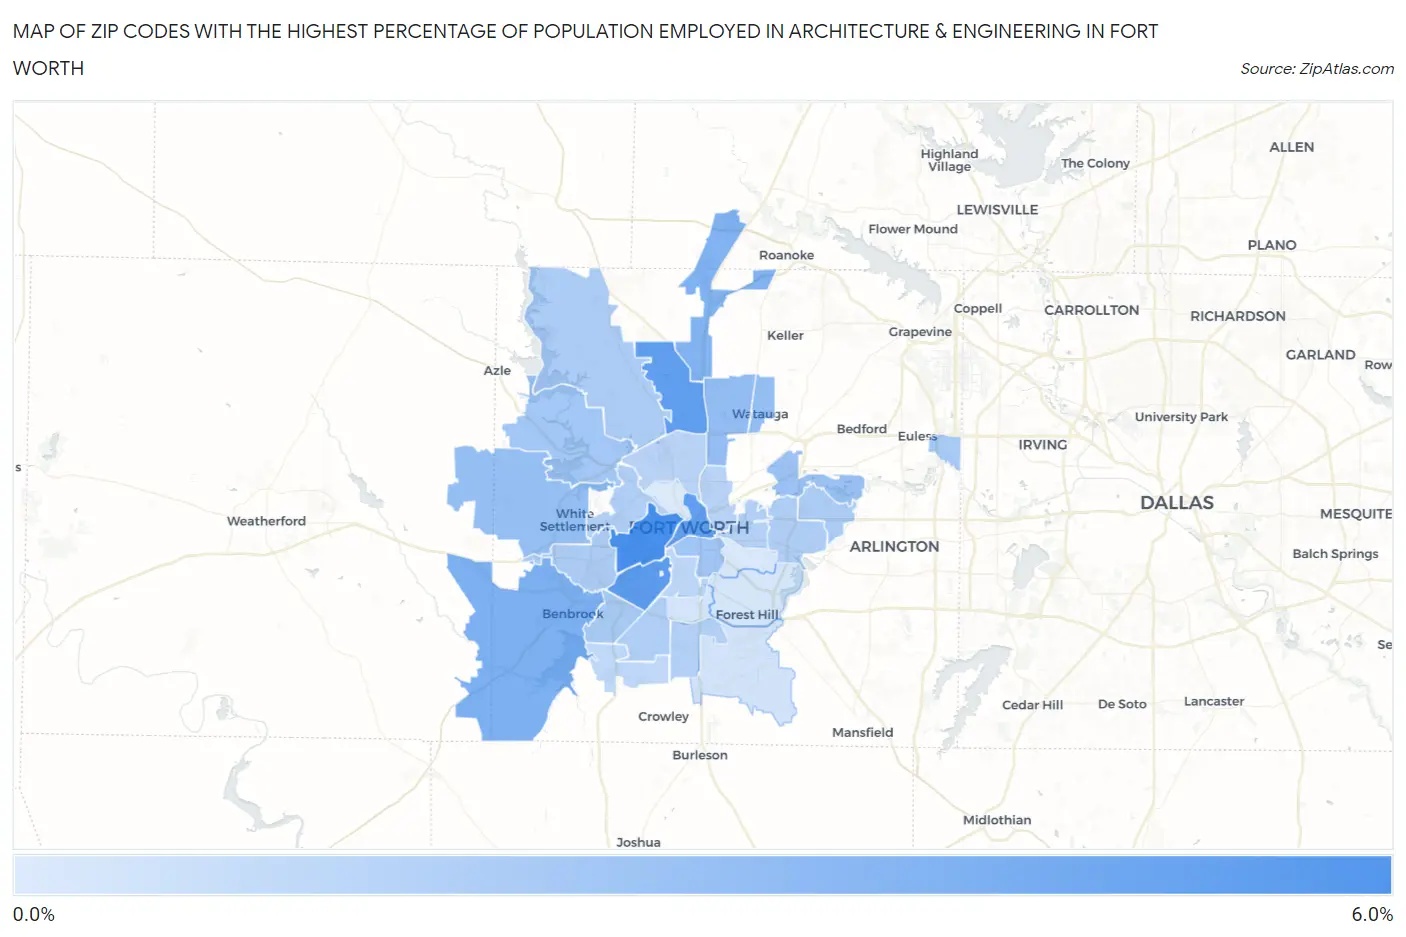
Map of Zip Codes with the Highest Percentage of Population Employed in Architecture & Engineering in Fort Worth
0.30%
5.1%
Zip Codes with the Highest Percentage of Population Employed in Architecture & Engineering in Fort Worth, TX
| Zip Code | % Employed | vs State | vs National | |
| 1. | 76107 | 5.1% | 2.2%(+2.85)#90 | 2.1%(+2.92)#1,617 |
| 2. | 76109 | 4.5% | 2.2%(+2.28)#116 | 2.1%(+2.35)#2,123 |
| 3. | 76131 | 4.3% | 2.2%(+2.05)#125 | 2.1%(+2.12)#2,406 |
| 4. | 76102 | 4.2% | 2.2%(+2.02)#126 | 2.1%(+2.09)#2,446 |
| 5. | 76126 | 3.3% | 2.2%(+1.10)#233 | 2.1%(+1.18)#4,130 |
| 6. | 76177 | 3.2% | 2.2%(+0.997)#254 | 2.1%(+1.07)#4,417 |
| 7. | 76137 | 2.6% | 2.2%(+0.386)#359 | 2.1%(+0.459)#6,543 |
| 8. | 76148 | 2.6% | 2.2%(+0.347)#367 | 2.1%(+0.420)#6,703 |
| 9. | 76108 | 2.5% | 2.2%(+0.292)#377 | 2.1%(+0.365)#6,935 |
| 10. | 76118 | 2.3% | 2.2%(+0.070)#430 | 2.1%(+0.143)#7,990 |
| 11. | 76104 | 2.1% | 2.2%(-0.074)#477 | 2.1%(-0.001)#8,770 |
| 12. | 76135 | 2.1% | 2.2%(-0.084)#482 | 2.1%(-0.011)#8,819 |
| 13. | 76155 | 2.0% | 2.2%(-0.255)#537 | 2.1%(-0.182)#9,813 |
| 14. | 76132 | 1.9% | 2.2%(-0.279)#545 | 2.1%(-0.206)#9,963 |
| 15. | 76120 | 1.8% | 2.2%(-0.405)#577 | 2.1%(-0.332)#10,735 |
| 16. | 76179 | 1.8% | 2.2%(-0.412)#579 | 2.1%(-0.339)#10,772 |
| 17. | 76116 | 1.8% | 2.2%(-0.415)#580 | 2.1%(-0.342)#10,783 |
| 18. | 76112 | 1.8% | 2.2%(-0.463)#598 | 2.1%(-0.390)#11,077 |
| 19. | 76114 | 1.7% | 2.2%(-0.561)#644 | 2.1%(-0.488)#11,762 |
| 20. | 76133 | 1.6% | 2.2%(-0.584)#654 | 2.1%(-0.511)#11,923 |
| 21. | 76134 | 1.6% | 2.2%(-0.602)#661 | 2.1%(-0.529)#12,052 |
| 22. | 76103 | 1.6% | 2.2%(-0.657)#681 | 2.1%(-0.584)#12,416 |
| 23. | 76106 | 1.5% | 2.2%(-0.743)#715 | 2.1%(-0.670)#13,024 |
| 24. | 76111 | 1.4% | 2.2%(-0.794)#731 | 2.1%(-0.721)#13,362 |
| 25. | 76110 | 1.3% | 2.2%(-0.921)#775 | 2.1%(-0.848)#14,292 |
| 26. | 76123 | 1.2% | 2.2%(-0.989)#797 | 2.1%(-0.916)#14,816 |
| 27. | 76140 | 0.68% | 2.2%(-1.55)#1,048 | 2.1%(-1.47)#19,058 |
| 28. | 76115 | 0.57% | 2.2%(-1.65)#1,099 | 2.1%(-1.58)#19,854 |
| 29. | 76119 | 0.48% | 2.2%(-1.74)#1,133 | 2.1%(-1.67)#20,378 |
| 30. | 76105 | 0.45% | 2.2%(-1.77)#1,145 | 2.1%(-1.70)#20,575 |
| 31. | 76164 | 0.30% | 2.2%(-1.92)#1,223 | 2.1%(-1.85)#21,573 |
1
Common Questions
What are the Top 10 Zip Codes with the Highest Percentage of Population Employed in Architecture & Engineering in Fort Worth, TX?
Top 10 Zip Codes with the Highest Percentage of Population Employed in Architecture & Engineering in Fort Worth, TX are:
What zip code has the Highest Percentage of Population Employed in Architecture & Engineering in Fort Worth, TX?
76107 has the Highest Percentage of Population Employed in Architecture & Engineering in Fort Worth, TX with 5.1%.
What is the Percentage of Population Employed in Architecture & Engineering in Fort Worth, TX?
Percentage of Population Employed in Architecture & Engineering in Fort Worth is 2.2%.
What is the Percentage of Population Employed in Architecture & Engineering in Texas?
Percentage of Population Employed in Architecture & Engineering in Texas is 2.2%.
What is the Percentage of Population Employed in Architecture & Engineering in the United States?
Percentage of Population Employed in Architecture & Engineering in the United States is 2.1%.