Hillcrest, TX Map & Demographics
Hillcrest Map
Hillcrest Overview
$44,356
PER CAPITA INCOME
$126,786
AVG FAMILY INCOME
$119,688
AVG HOUSEHOLD INCOME
60.8%
WAGE / INCOME GAP [ % ]
39.2¢/ $1
WAGE / INCOME GAP [ $ ]
0.36
INEQUALITY / GINI INDEX
727
TOTAL POPULATION
322
MALE POPULATION
405
FEMALE POPULATION
79.51
MALES / 100 FEMALES
125.78
FEMALES / 100 MALES
42.2
MEDIAN AGE
3.1
AVG FAMILY SIZE
2.8
AVG HOUSEHOLD SIZE
350
LABOR FORCE [ PEOPLE ]
60.2%
PERCENT IN LABOR FORCE
2.0%
UNEMPLOYMENT RATE
Income in Hillcrest
Income Overview in Hillcrest
Per Capita Income in Hillcrest is $44,356, while median incomes of families and households are $126,786 and $119,688 respectively.
| Characteristic | Number | Measure |
| Per Capita Income | 727 | $44,356 |
| Median Family Income | 210 | $126,786 |
| Mean Family Income | 210 | $138,387 |
| Median Household Income | 263 | $119,688 |
| Mean Household Income | 263 | $120,806 |
| Income Deficit | 210 | $0 |
| Wage / Income Gap (%) | 727 | 60.77% |
| Wage / Income Gap ($) | 727 | 39.23¢ per $1 |
| Gini / Inequality Index | 727 | 0.36 |
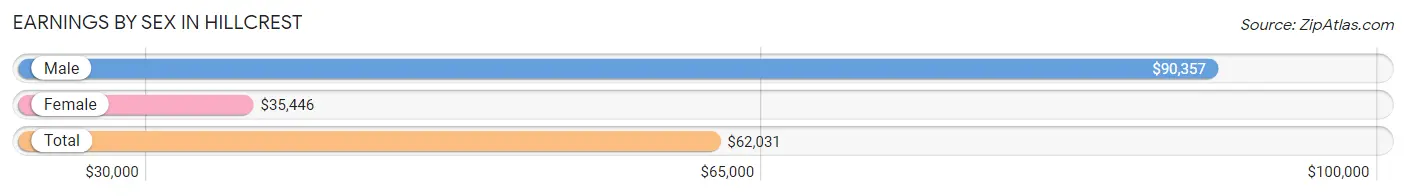
Earnings by Sex in Hillcrest
Average Earnings in Hillcrest are $62,031, $90,357 for men and $35,446 for women, a difference of 60.8%.
| Sex | Number | Average Earnings |
| Male | 180 (51.0%) | $90,357 |
| Female | 173 (49.0%) | $35,446 |
| Total | 353 (100.0%) | $62,031 |
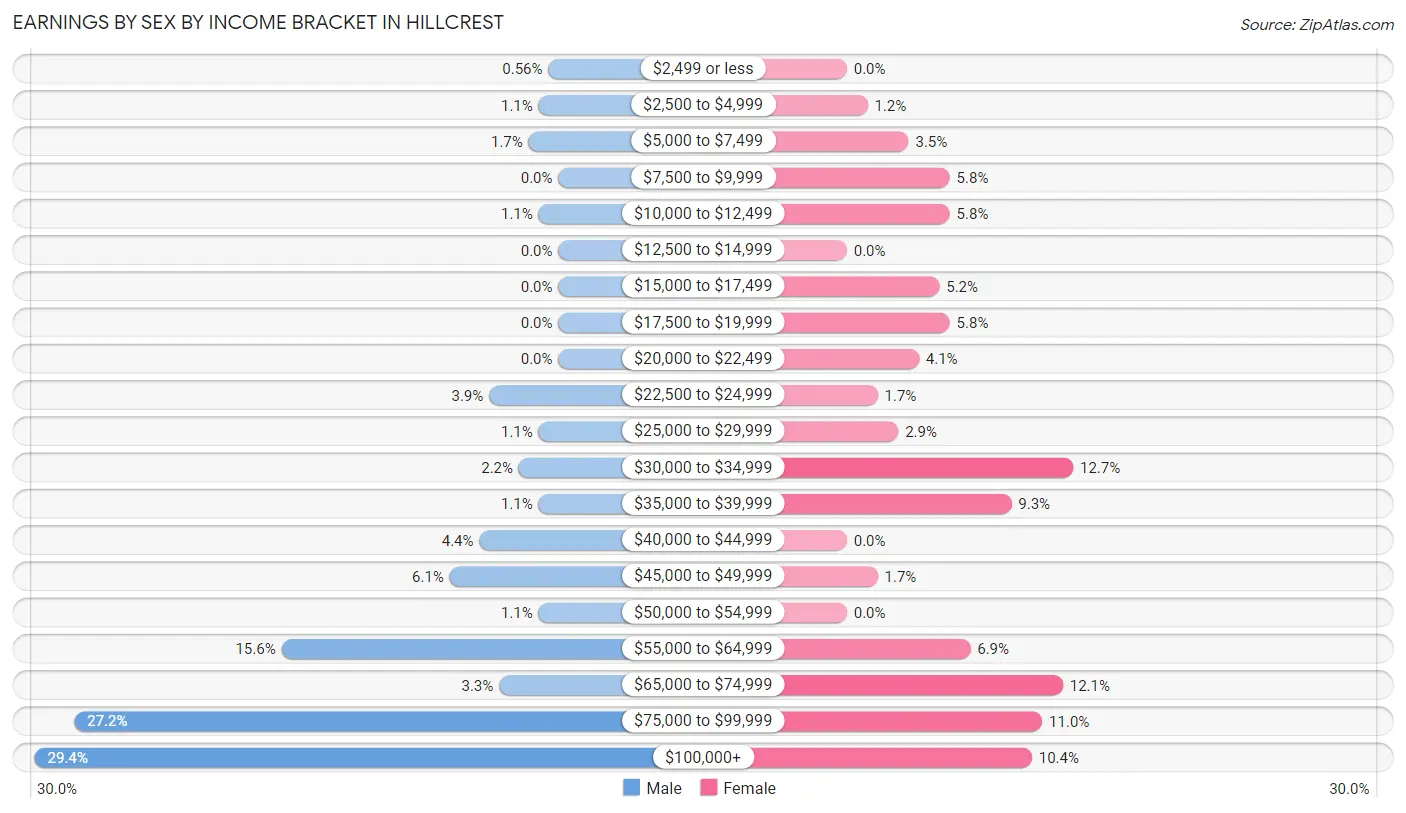
Earnings by Sex by Income Bracket in Hillcrest
The most common earnings brackets in Hillcrest are $100,000+ for men (53 | 29.4%) and $30,000 to $34,999 for women (22 | 12.7%).
| Income | Male | Female |
| $2,499 or less | 1 (0.6%) | 0 (0.0%) |
| $2,500 to $4,999 | 2 (1.1%) | 2 (1.2%) |
| $5,000 to $7,499 | 3 (1.7%) | 6 (3.5%) |
| $7,500 to $9,999 | 0 (0.0%) | 10 (5.8%) |
| $10,000 to $12,499 | 2 (1.1%) | 10 (5.8%) |
| $12,500 to $14,999 | 0 (0.0%) | 0 (0.0%) |
| $15,000 to $17,499 | 0 (0.0%) | 9 (5.2%) |
| $17,500 to $19,999 | 0 (0.0%) | 10 (5.8%) |
| $20,000 to $22,499 | 0 (0.0%) | 7 (4.1%) |
| $22,500 to $24,999 | 7 (3.9%) | 3 (1.7%) |
| $25,000 to $29,999 | 2 (1.1%) | 5 (2.9%) |
| $30,000 to $34,999 | 4 (2.2%) | 22 (12.7%) |
| $35,000 to $39,999 | 2 (1.1%) | 16 (9.2%) |
| $40,000 to $44,999 | 8 (4.4%) | 0 (0.0%) |
| $45,000 to $49,999 | 11 (6.1%) | 3 (1.7%) |
| $50,000 to $54,999 | 2 (1.1%) | 0 (0.0%) |
| $55,000 to $64,999 | 28 (15.6%) | 12 (6.9%) |
| $65,000 to $74,999 | 6 (3.3%) | 21 (12.1%) |
| $75,000 to $99,999 | 49 (27.2%) | 19 (11.0%) |
| $100,000+ | 53 (29.4%) | 18 (10.4%) |
| Total | 180 (100.0%) | 173 (100.0%) |
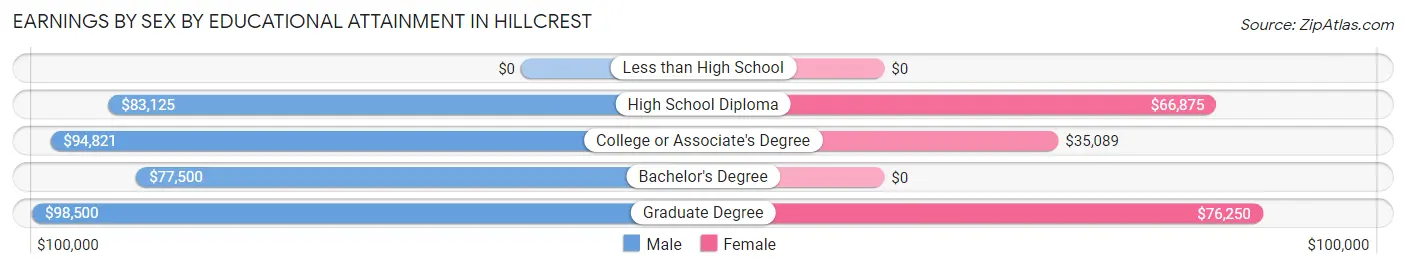
Earnings by Sex by Educational Attainment in Hillcrest
Average earnings in Hillcrest are $91,429 for men and $36,875 for women, a difference of 59.7%. Men with an educational attainment of graduate degree enjoy the highest average annual earnings of $98,500, while those with bachelor's degree education earn the least with $77,500. Women with an educational attainment of graduate degree earn the most with the average annual earnings of $76,250, while those with college or associate's degree education have the smallest earnings of $35,089.
| Educational Attainment | Male Income | Female Income |
| Less than High School | - | - |
| High School Diploma | $83,125 | $66,875 |
| College or Associate's Degree | $94,821 | $35,089 |
| Bachelor's Degree | $77,500 | $0 |
| Graduate Degree | $98,500 | $76,250 |
| Total | $91,429 | $36,875 |
Family Income in Hillcrest
Family Income Brackets in Hillcrest
According to the Hillcrest family income data, there are 63 families falling into the $150,000 to $199,999 income range, which is the most common income bracket and makes up 30.0% of all families.
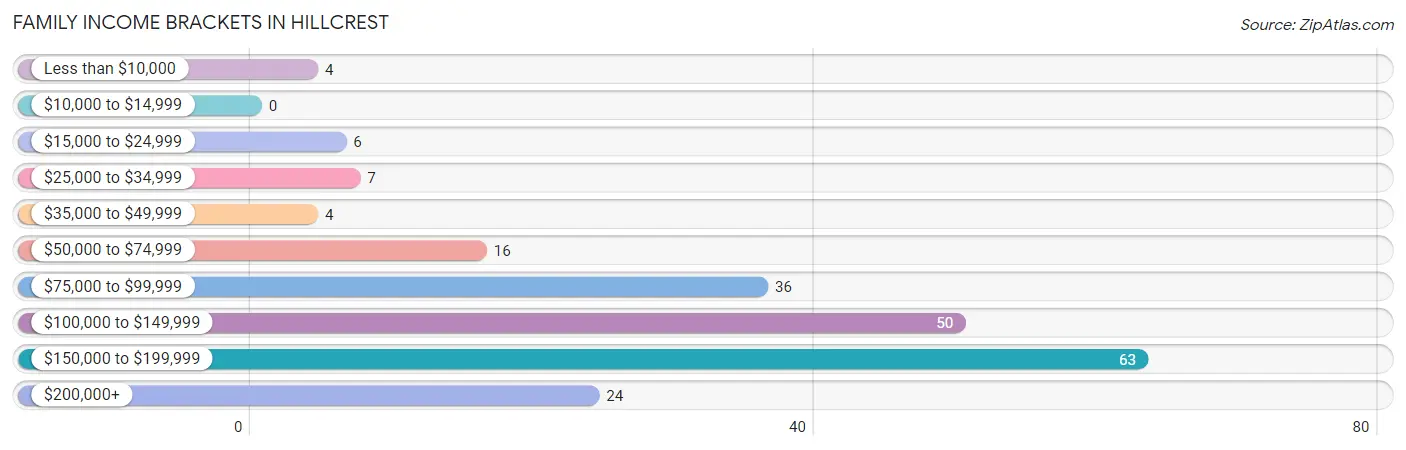
| Income Bracket | # Families | % Families |
| Less than $10,000 | 4 | 1.9% |
| $10,000 to $14,999 | 0 | 0.0% |
| $15,000 to $24,999 | 6 | 2.9% |
| $25,000 to $34,999 | 7 | 3.3% |
| $35,000 to $49,999 | 4 | 1.9% |
| $50,000 to $74,999 | 16 | 7.6% |
| $75,000 to $99,999 | 36 | 17.1% |
| $100,000 to $149,999 | 50 | 23.8% |
| $150,000 to $199,999 | 63 | 30.0% |
| $200,000+ | 24 | 11.4% |
Family Income by Famaliy Size in Hillcrest
4-person families (21 | 10.0%) account for the highest median family income in Hillcrest with $172,917 per family, while 2-person families (100 | 47.6%) have the highest median income of $70,250 per family member.
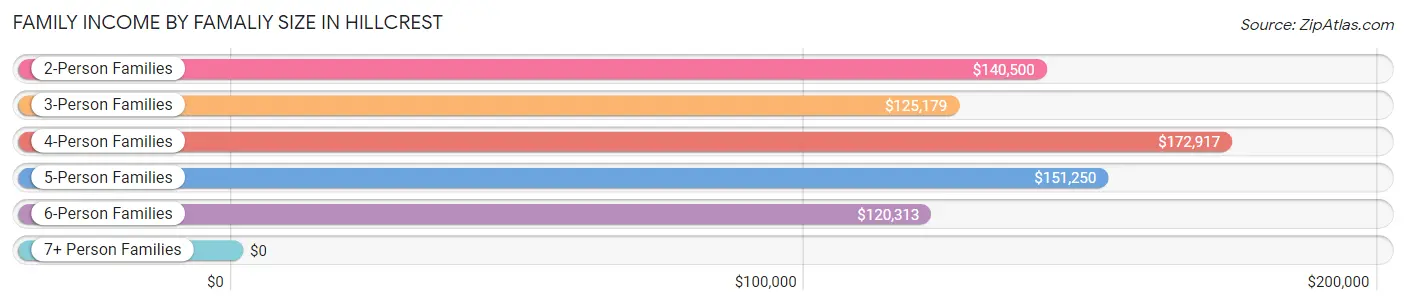
| Income Bracket | # Families | Median Income |
| 2-Person Families | 100 (47.6%) | $140,500 |
| 3-Person Families | 59 (28.1%) | $125,179 |
| 4-Person Families | 21 (10.0%) | $172,917 |
| 5-Person Families | 19 (9.0%) | $151,250 |
| 6-Person Families | 7 (3.3%) | $120,313 |
| 7+ Person Families | 4 (1.9%) | $0 |
| Total | 210 (100.0%) | $126,786 |
Family Income by Number of Earners in Hillcrest
The median family income in Hillcrest is $126,786, with families comprising 2 earners (89) having the highest median family income of $167,841, while families with no earners (45) have the lowest median family income of $71,250, accounting for 42.4% and 21.4% of families, respectively.
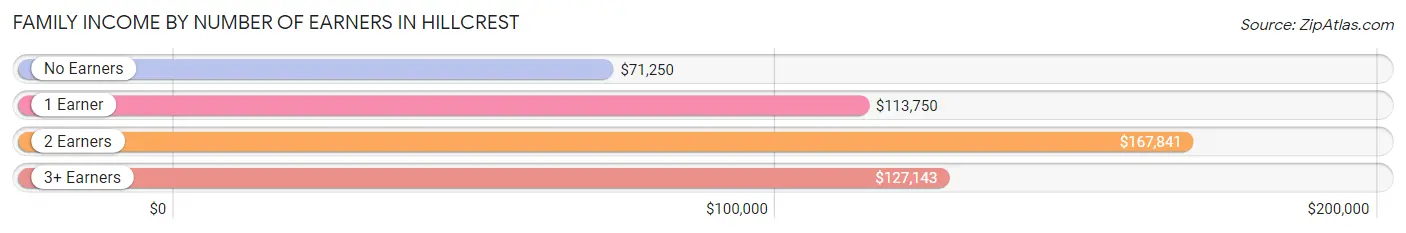
| Number of Earners | # Families | Median Income |
| No Earners | 45 (21.4%) | $71,250 |
| 1 Earner | 54 (25.7%) | $113,750 |
| 2 Earners | 89 (42.4%) | $167,841 |
| 3+ Earners | 22 (10.5%) | $127,143 |
| Total | 210 (100.0%) | $126,786 |
Household Income in Hillcrest
Household Income Brackets in Hillcrest
With 63 households falling in the category, the $150,000 to $199,999 income range is the most frequent in Hillcrest, accounting for 23.9% of all households.
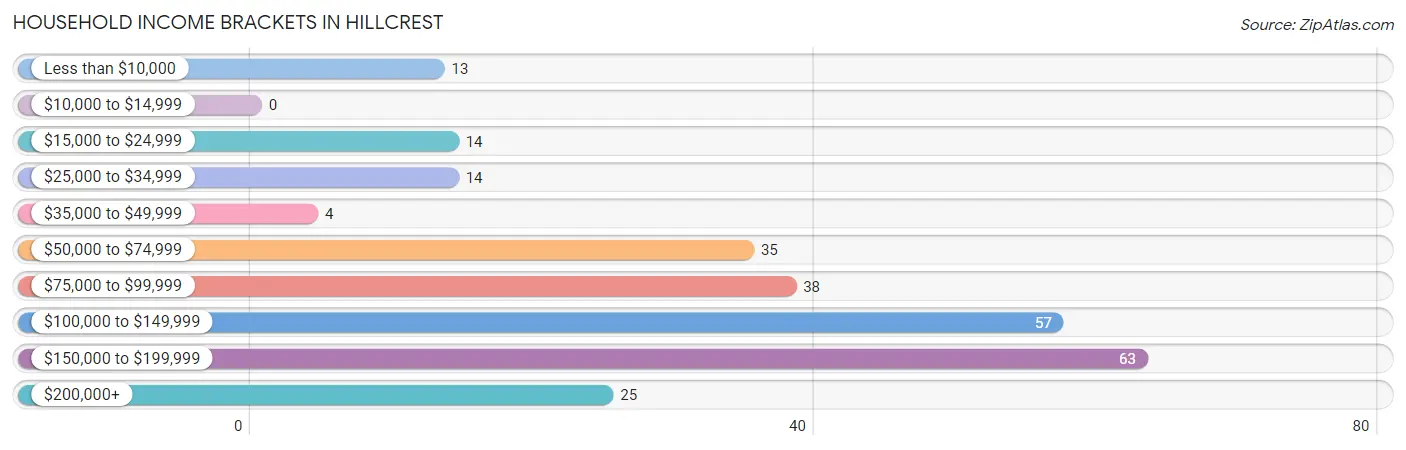
| Income Bracket | # Households | % Households |
| Less than $10,000 | 13 | 4.9% |
| $10,000 to $14,999 | 0 | 0.0% |
| $15,000 to $24,999 | 14 | 5.3% |
| $25,000 to $34,999 | 14 | 5.3% |
| $35,000 to $49,999 | 4 | 1.5% |
| $50,000 to $74,999 | 35 | 13.3% |
| $75,000 to $99,999 | 38 | 14.4% |
| $100,000 to $149,999 | 57 | 21.7% |
| $150,000 to $199,999 | 63 | 24.0% |
| $200,000+ | 25 | 9.5% |
Household Income by Householder Age in Hillcrest
The median household income in Hillcrest is $119,688, with the highest median household income of $154,107 found in the 25 to 44 years age bracket for the primary householder. A total of 83 households (31.6%) fall into this category. Meanwhile, the 15 to 24 years age bracket for the primary householder has the lowest median household income of $0, with 3 households (1.1%) in this group.
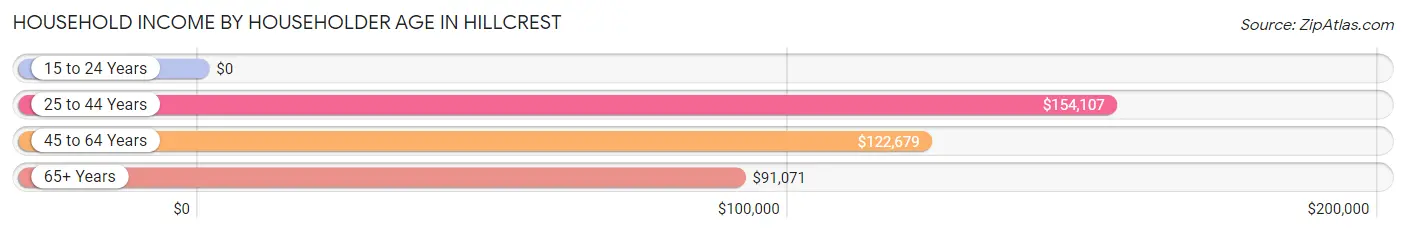
| Income Bracket | # Households | Median Income |
| 15 to 24 Years | 3 (1.1%) | $0 |
| 25 to 44 Years | 83 (31.6%) | $154,107 |
| 45 to 64 Years | 67 (25.5%) | $122,679 |
| 65+ Years | 110 (41.8%) | $91,071 |
| Total | 263 (100.0%) | $119,688 |
Poverty in Hillcrest
Income Below Poverty by Sex and Age in Hillcrest
With 6.8% poverty level for males and 8.4% for females among the residents of Hillcrest, 15 year old males and 45 to 54 year old females are the most vulnerable to poverty, with 3 males (100.0%) and 11 females (30.6%) in their respective age groups living below the poverty level.
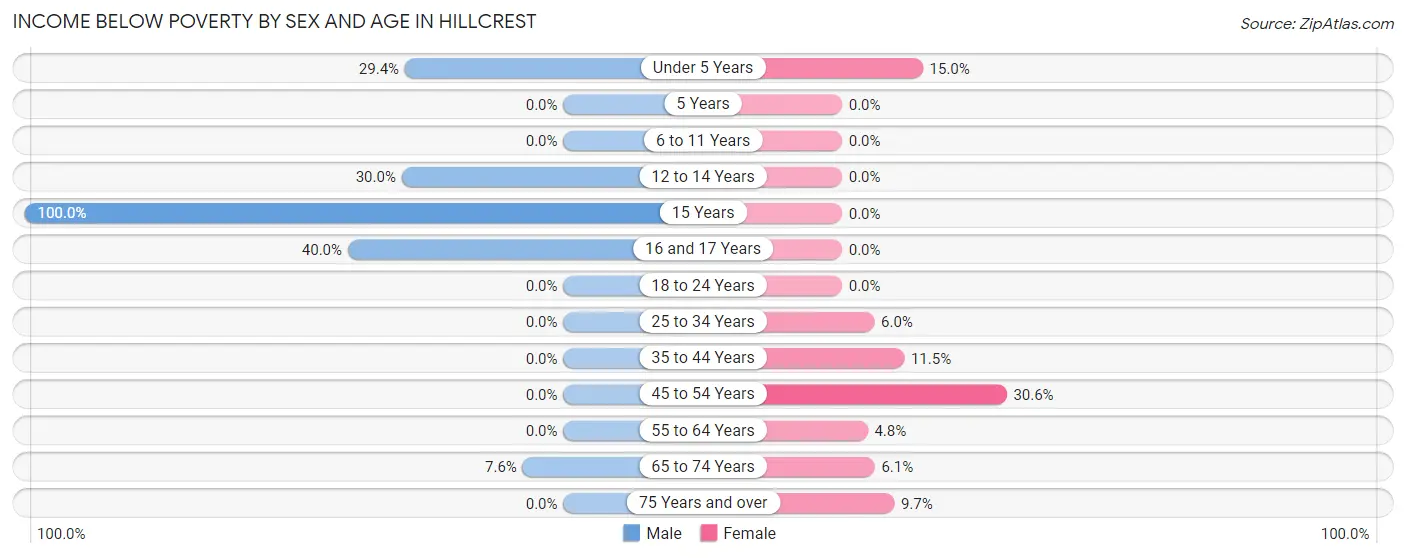
| Age Bracket | Male | Female |
| Under 5 Years | 10 (29.4%) | 3 (15.0%) |
| 5 Years | 0 (0.0%) | 0 (0.0%) |
| 6 to 11 Years | 0 (0.0%) | 0 (0.0%) |
| 12 to 14 Years | 3 (30.0%) | 0 (0.0%) |
| 15 Years | 3 (100.0%) | 0 (0.0%) |
| 16 and 17 Years | 2 (40.0%) | 0 (0.0%) |
| 18 to 24 Years | 0 (0.0%) | 0 (0.0%) |
| 25 to 34 Years | 0 (0.0%) | 3 (6.0%) |
| 35 to 44 Years | 0 (0.0%) | 6 (11.5%) |
| 45 to 54 Years | 0 (0.0%) | 11 (30.6%) |
| 55 to 64 Years | 0 (0.0%) | 3 (4.8%) |
| 65 to 74 Years | 4 (7.5%) | 2 (6.1%) |
| 75 Years and over | 0 (0.0%) | 6 (9.7%) |
| Total | 22 (6.8%) | 34 (8.4%) |
Income Above Poverty by Sex and Age in Hillcrest
According to the poverty statistics in Hillcrest, males aged 5 years and females aged 6 to 11 years are the age groups that are most secure financially, with 100.0% of males and 100.0% of females in these age groups living above the poverty line.
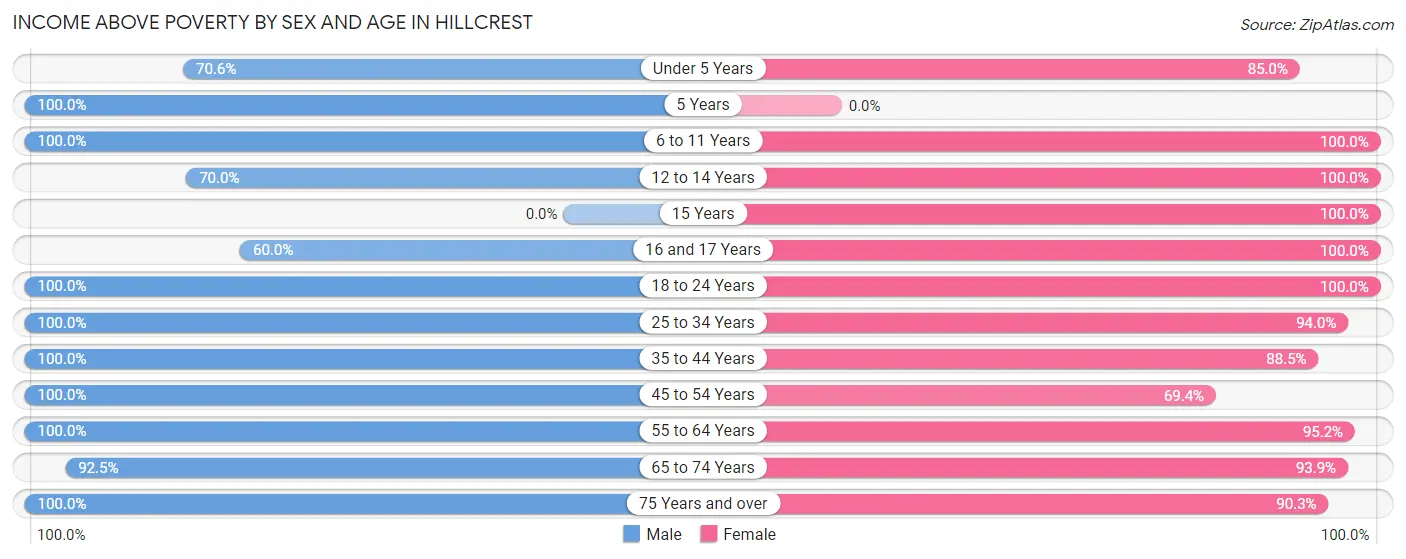
| Age Bracket | Male | Female |
| Under 5 Years | 24 (70.6%) | 17 (85.0%) |
| 5 Years | 8 (100.0%) | 0 (0.0%) |
| 6 to 11 Years | 13 (100.0%) | 37 (100.0%) |
| 12 to 14 Years | 7 (70.0%) | 19 (100.0%) |
| 15 Years | 0 (0.0%) | 2 (100.0%) |
| 16 and 17 Years | 3 (60.0%) | 14 (100.0%) |
| 18 to 24 Years | 18 (100.0%) | 17 (100.0%) |
| 25 to 34 Years | 24 (100.0%) | 47 (94.0%) |
| 35 to 44 Years | 55 (100.0%) | 46 (88.5%) |
| 45 to 54 Years | 24 (100.0%) | 25 (69.4%) |
| 55 to 64 Years | 41 (100.0%) | 60 (95.2%) |
| 65 to 74 Years | 49 (92.4%) | 31 (93.9%) |
| 75 Years and over | 34 (100.0%) | 56 (90.3%) |
| Total | 300 (93.2%) | 371 (91.6%) |
Income Below Poverty Among Married-Couple Families in Hillcrest
The poverty statistics for married-couple families in Hillcrest show that 1.6% or 3 of the total 190 families live below the poverty line. Families with no children have the highest poverty rate of 2.4%, comprising of 3 families. On the other hand, families with 1 or 2 children have the lowest poverty rate of 0.0%, which includes 0 families.
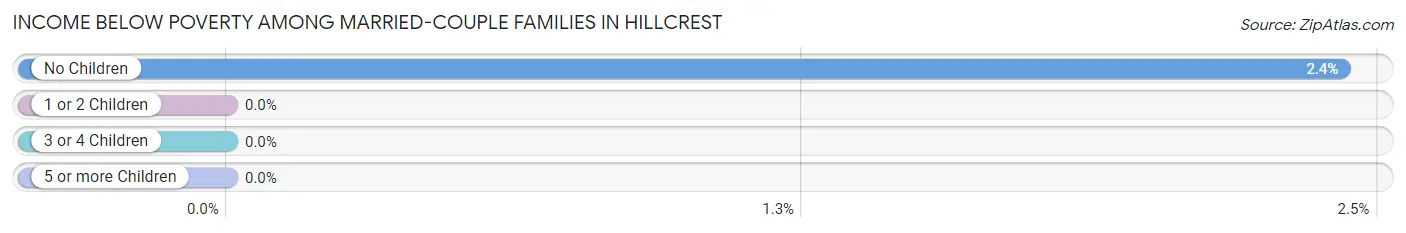
| Children | Above Poverty | Below Poverty |
| No Children | 121 (97.6%) | 3 (2.4%) |
| 1 or 2 Children | 43 (100.0%) | 0 (0.0%) |
| 3 or 4 Children | 19 (100.0%) | 0 (0.0%) |
| 5 or more Children | 4 (100.0%) | 0 (0.0%) |
| Total | 187 (98.4%) | 3 (1.6%) |
Income Below Poverty Among Single-Parent Households in Hillcrest
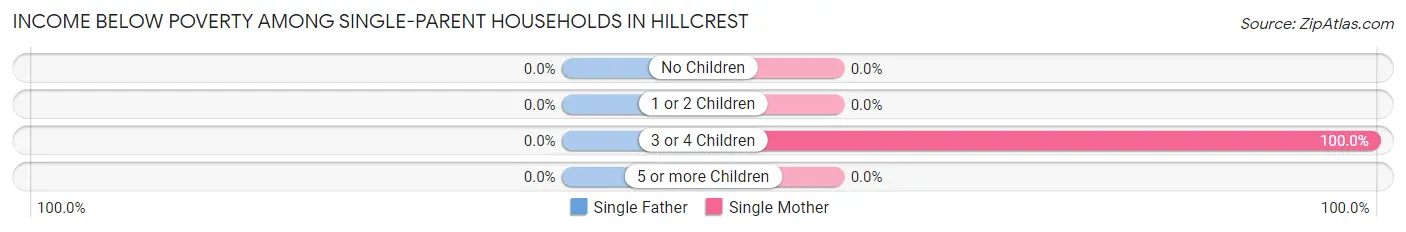
| Children | Single Father | Single Mother |
| No Children | 0 (0.0%) | 0 (0.0%) |
| 1 or 2 Children | 0 (0.0%) | 0 (0.0%) |
| 3 or 4 Children | 0 (0.0%) | 5 (100.0%) |
| 5 or more Children | 0 (0.0%) | 0 (0.0%) |
| Total | 0 (0.0%) | 5 (71.4%) |
Income Below Poverty Among Married-Couple vs Single-Parent Households in Hillcrest
The poverty data for Hillcrest shows that 3 of the married-couple family households (1.6%) and 5 of the single-parent households (25.0%) are living below the poverty level. Within the married-couple family households, those with no children have the highest poverty rate, with 3 households (2.4%) falling below the poverty line. Among the single-parent households, those with 3 or 4 children have the highest poverty rate, with 5 household (100.0%) living below poverty.
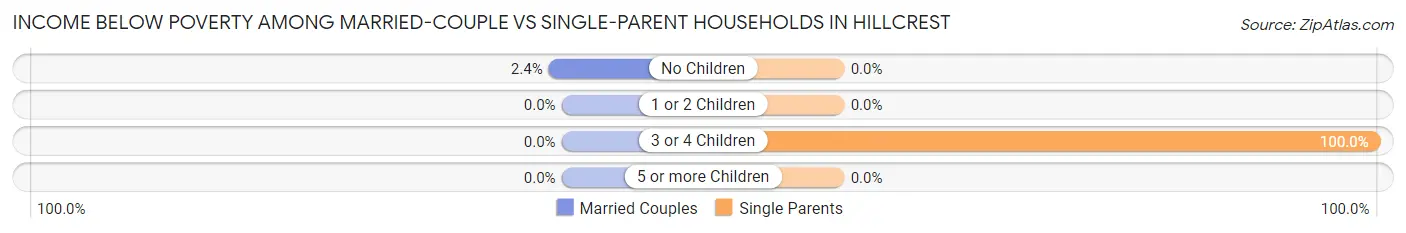
| Children | Married-Couple Families | Single-Parent Households |
| No Children | 3 (2.4%) | 0 (0.0%) |
| 1 or 2 Children | 0 (0.0%) | 0 (0.0%) |
| 3 or 4 Children | 0 (0.0%) | 5 (100.0%) |
| 5 or more Children | 0 (0.0%) | 0 (0.0%) |
| Total | 3 (1.6%) | 5 (25.0%) |
Race in Hillcrest
The most populous races in Hillcrest are White / Caucasian (690 | 94.9%), Hispanic or Latino (102 | 14.0%), and Two or more Races (18 | 2.5%).
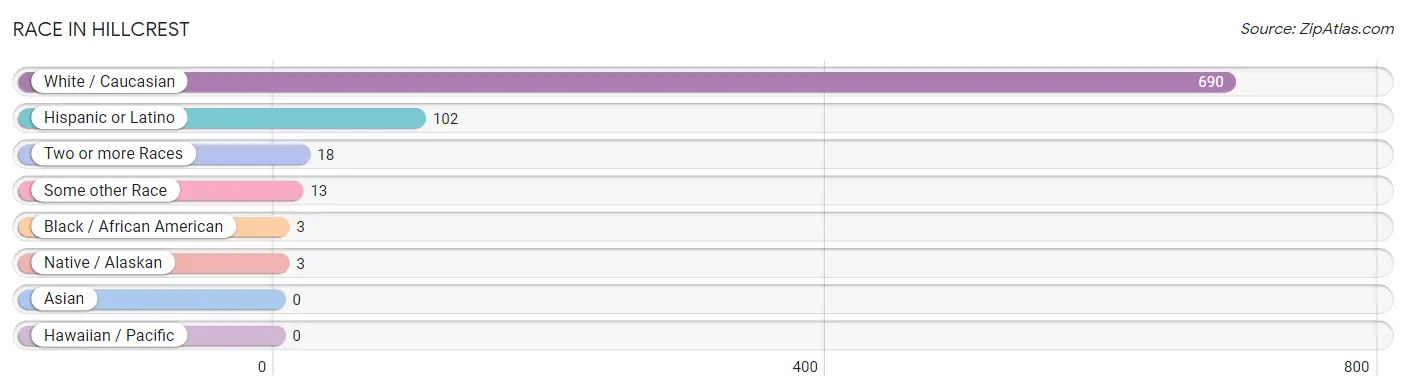
| Race | # Population | % Population |
| Asian | 0 | 0.0% |
| Black / African American | 3 | 0.4% |
| Hawaiian / Pacific | 0 | 0.0% |
| Hispanic or Latino | 102 | 14.0% |
| Native / Alaskan | 3 | 0.4% |
| White / Caucasian | 690 | 94.9% |
| Two or more Races | 18 | 2.5% |
| Some other Race | 13 | 1.8% |
| Total | 727 | 100.0% |
Ancestry in Hillcrest
The most populous ancestries reported in Hillcrest are German (109 | 15.0%), English (101 | 13.9%), Mexican (94 | 12.9%), Irish (77 | 10.6%), and Czech (58 | 8.0%), together accounting for 60.4% of all Hillcrest residents.
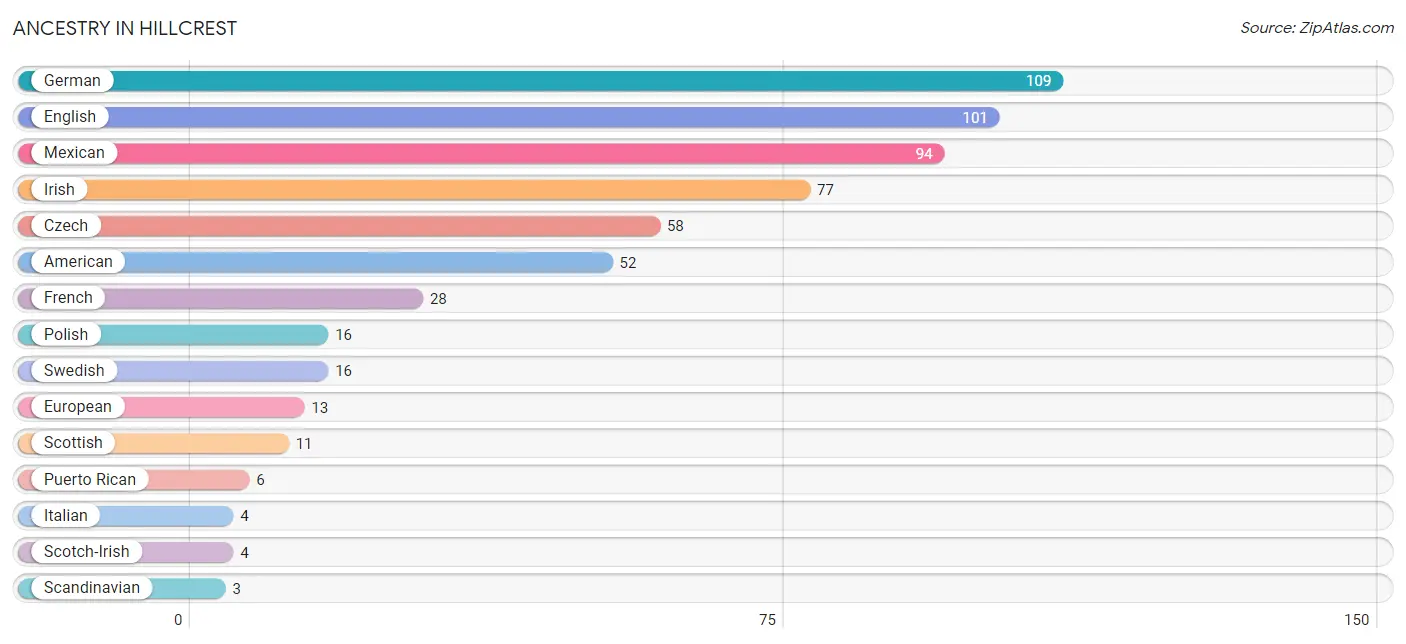
| Ancestry | # Population | % Population |
| American | 52 | 7.1% |
| British | 2 | 0.3% |
| Canadian | 1 | 0.1% |
| Creek | 2 | 0.3% |
| Czech | 58 | 8.0% |
| Danish | 2 | 0.3% |
| Dutch | 1 | 0.1% |
| English | 101 | 13.9% |
| European | 13 | 1.8% |
| Finnish | 2 | 0.3% |
| French | 28 | 3.8% |
| French Canadian | 1 | 0.1% |
| German | 109 | 15.0% |
| Hungarian | 2 | 0.3% |
| Irish | 77 | 10.6% |
| Iroquois | 1 | 0.1% |
| Italian | 4 | 0.5% |
| Mexican | 94 | 12.9% |
| Polish | 16 | 2.2% |
| Puerto Rican | 6 | 0.8% |
| Scandinavian | 3 | 0.4% |
| Scotch-Irish | 4 | 0.5% |
| Scottish | 11 | 1.5% |
| Slavic | 1 | 0.1% |
| Spaniard | 2 | 0.3% |
| Swedish | 16 | 2.2% |
| Welsh | 3 | 0.4% | View All 27 Rows |
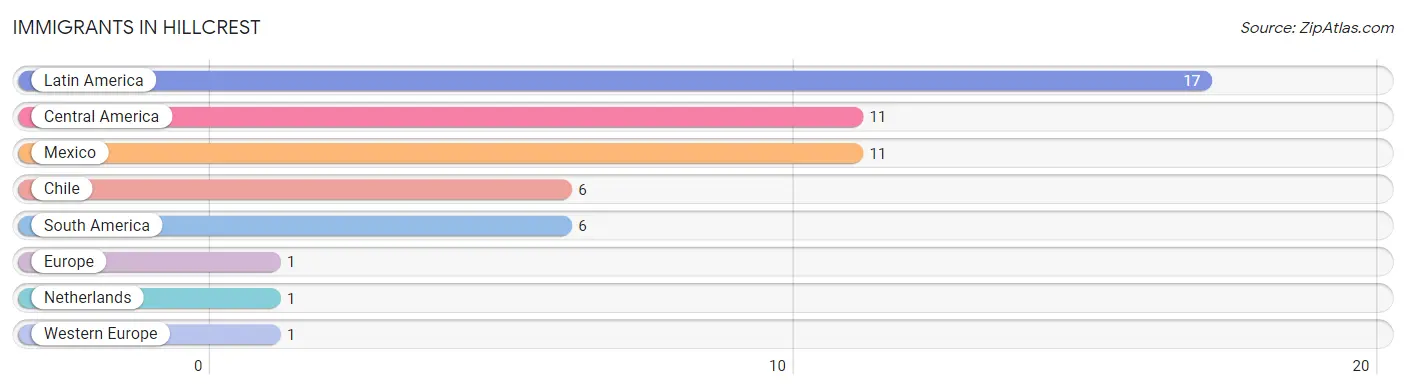
Immigrants in Hillcrest
The most numerous immigrant groups reported in Hillcrest came from Latin America (17 | 2.3%), Central America (11 | 1.5%), Mexico (11 | 1.5%), Chile (6 | 0.8%), and South America (6 | 0.8%), together accounting for 7.0% of all Hillcrest residents.
| Immigration Origin | # Population | % Population |
| Central America | 11 | 1.5% |
| Chile | 6 | 0.8% |
| Europe | 1 | 0.1% |
| Latin America | 17 | 2.3% |
| Mexico | 11 | 1.5% |
| Netherlands | 1 | 0.1% |
| South America | 6 | 0.8% |
| Western Europe | 1 | 0.1% | View All 8 Rows |
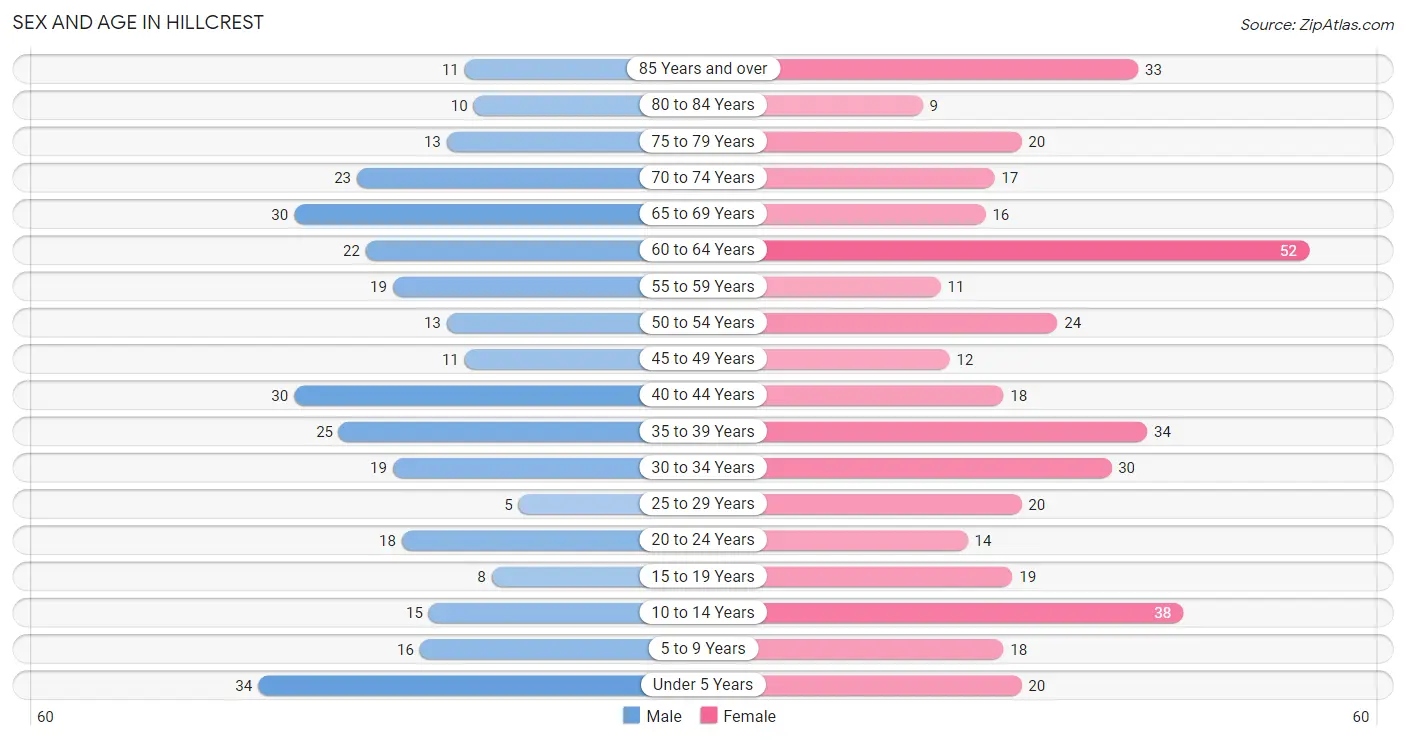
Sex and Age in Hillcrest
Sex and Age in Hillcrest
The most populous age groups in Hillcrest are Under 5 Years (34 | 10.6%) for men and 60 to 64 Years (52 | 12.8%) for women.
| Age Bracket | Male | Female |
| Under 5 Years | 34 (10.6%) | 20 (4.9%) |
| 5 to 9 Years | 16 (5.0%) | 18 (4.4%) |
| 10 to 14 Years | 15 (4.7%) | 38 (9.4%) |
| 15 to 19 Years | 8 (2.5%) | 19 (4.7%) |
| 20 to 24 Years | 18 (5.6%) | 14 (3.5%) |
| 25 to 29 Years | 5 (1.5%) | 20 (4.9%) |
| 30 to 34 Years | 19 (5.9%) | 30 (7.4%) |
| 35 to 39 Years | 25 (7.8%) | 34 (8.4%) |
| 40 to 44 Years | 30 (9.3%) | 18 (4.4%) |
| 45 to 49 Years | 11 (3.4%) | 12 (3.0%) |
| 50 to 54 Years | 13 (4.0%) | 24 (5.9%) |
| 55 to 59 Years | 19 (5.9%) | 11 (2.7%) |
| 60 to 64 Years | 22 (6.8%) | 52 (12.8%) |
| 65 to 69 Years | 30 (9.3%) | 16 (4.0%) |
| 70 to 74 Years | 23 (7.1%) | 17 (4.2%) |
| 75 to 79 Years | 13 (4.0%) | 20 (4.9%) |
| 80 to 84 Years | 10 (3.1%) | 9 (2.2%) |
| 85 Years and over | 11 (3.4%) | 33 (8.2%) |
| Total | 322 (100.0%) | 405 (100.0%) |
Families and Households in Hillcrest
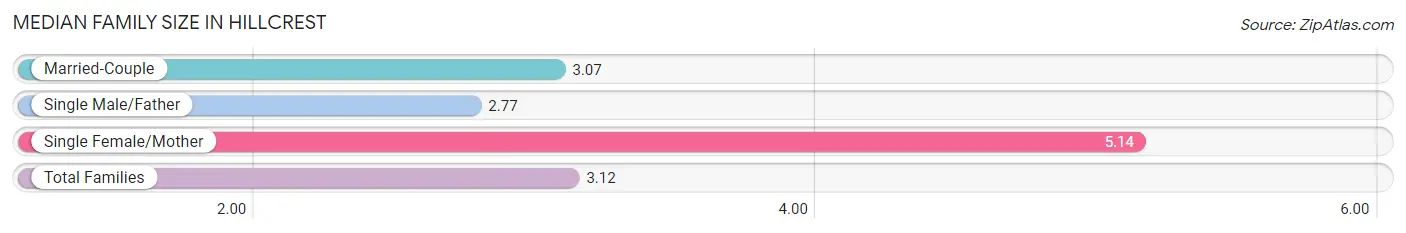
Median Family Size in Hillcrest
The median family size in Hillcrest is 3.12 persons per family, with single female/mother families (7 | 3.3%) accounting for the largest median family size of 5.14 persons per family. On the other hand, single male/father families (13 | 6.2%) represent the smallest median family size with 2.77 persons per family.
| Family Type | # Families | Family Size |
| Married-Couple | 190 (90.5%) | 3.07 |
| Single Male/Father | 13 (6.2%) | 2.77 |
| Single Female/Mother | 7 (3.3%) | 5.14 |
| Total Families | 210 (100.0%) | 3.12 |
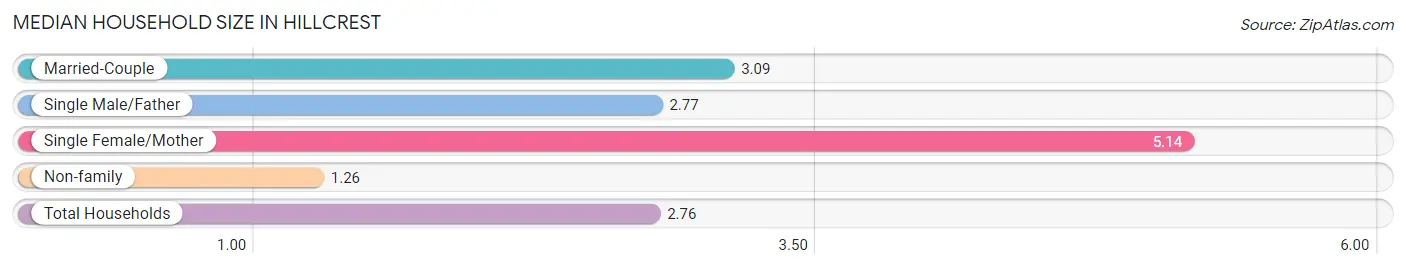
Median Household Size in Hillcrest
The median household size in Hillcrest is 2.76 persons per household, with single female/mother households (7 | 2.7%) accounting for the largest median household size of 5.14 persons per household. non-family households (53 | 20.2%) represent the smallest median household size with 1.26 persons per household.
| Household Type | # Households | Household Size |
| Married-Couple | 190 (72.2%) | 3.09 |
| Single Male/Father | 13 (4.9%) | 2.77 |
| Single Female/Mother | 7 (2.7%) | 5.14 |
| Non-family | 53 (20.2%) | 1.26 |
| Total Households | 263 (100.0%) | 2.76 |
Household Size by Marriage Status in Hillcrest
Out of a total of 263 households in Hillcrest, 210 (79.8%) are family households, while 53 (20.2%) are nonfamily households. The most numerous type of family households are 2-person households, comprising 98, and the most common type of nonfamily households are 1-person households, comprising 41.
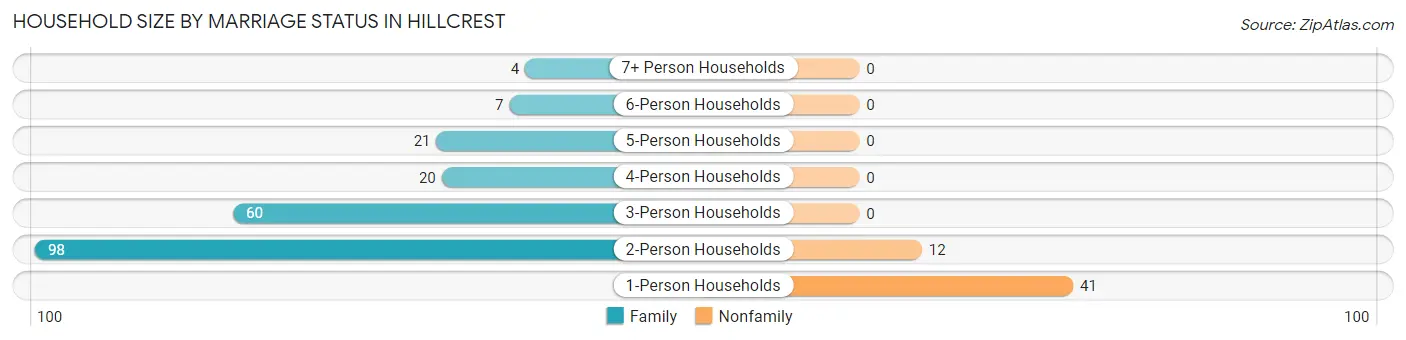
| Household Size | Family Households | Nonfamily Households |
| 1-Person Households | - | 41 (15.6%) |
| 2-Person Households | 98 (37.3%) | 12 (4.6%) |
| 3-Person Households | 60 (22.8%) | 0 (0.0%) |
| 4-Person Households | 20 (7.6%) | 0 (0.0%) |
| 5-Person Households | 21 (8.0%) | 0 (0.0%) |
| 6-Person Households | 7 (2.7%) | 0 (0.0%) |
| 7+ Person Households | 4 (1.5%) | 0 (0.0%) |
| Total | 210 (79.8%) | 53 (20.2%) |
Female Fertility in Hillcrest
Fertility by Age in Hillcrest
Average fertility rate in Hillcrest is 109.0 births per 1,000 women. Women in the age bracket of 20 to 34 years have the highest fertility rate with 219.0 births per 1,000 women. Women in the age bracket of 20 to 34 years acount for 87.5% of all women with births.
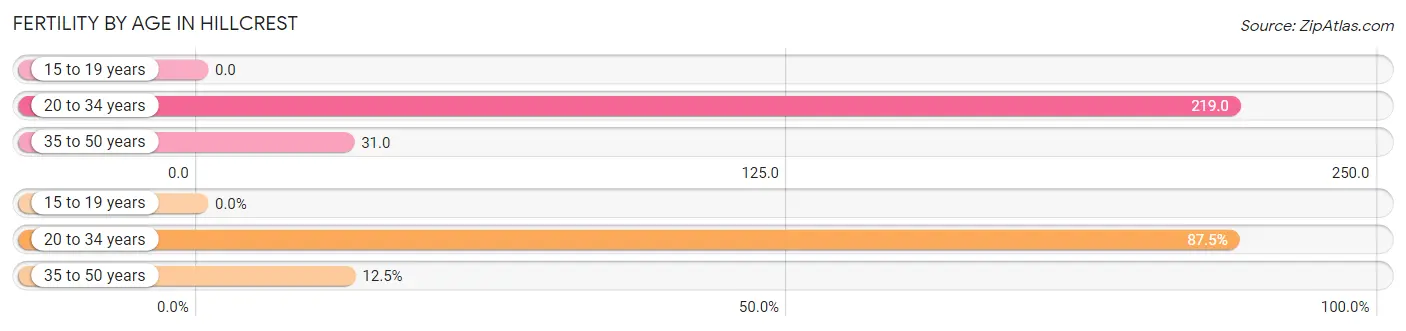
| Age Bracket | Women with Births | Births / 1,000 Women |
| 15 to 19 years | 0 (0.0%) | 0.0 |
| 20 to 34 years | 14 (87.5%) | 219.0 |
| 35 to 50 years | 2 (12.5%) | 31.0 |
| Total | 16 (100.0%) | 109.0 |
Fertility by Age by Marriage Status in Hillcrest
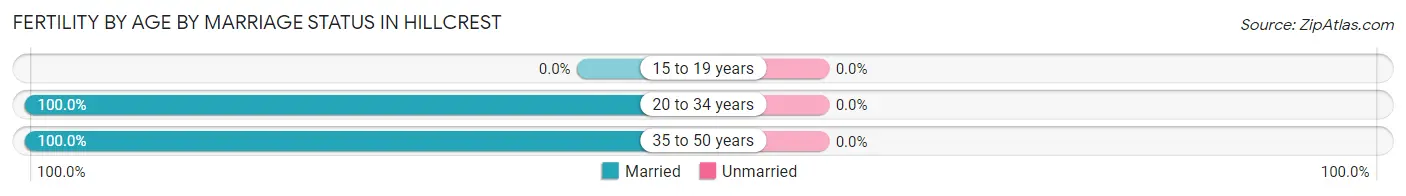
| Age Bracket | Married | Unmarried |
| 15 to 19 years | 0 (0.0%) | 0 (0.0%) |
| 20 to 34 years | 14 (100.0%) | 0 (0.0%) |
| 35 to 50 years | 2 (100.0%) | 0 (0.0%) |
| Total | 16 (100.0%) | 0 (0.0%) |
Fertility by Education in Hillcrest
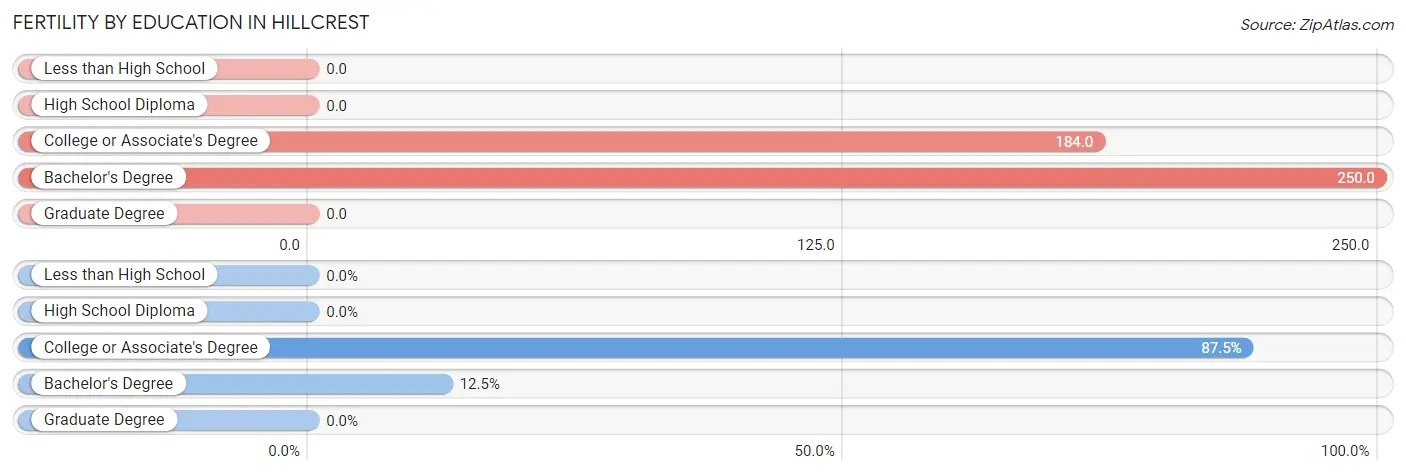
| Educational Attainment | Women with Births | Births / 1,000 Women |
| Less than High School | 0 (0.0%) | 0.0 |
| High School Diploma | 0 (0.0%) | 0.0 |
| College or Associate's Degree | 14 (87.5%) | 184.0 |
| Bachelor's Degree | 2 (12.5%) | 250.0 |
| Graduate Degree | 0 (0.0%) | 0.0 |
| Total | 16 (100.0%) | 109.0 |
Fertility by Education by Marriage Status in Hillcrest
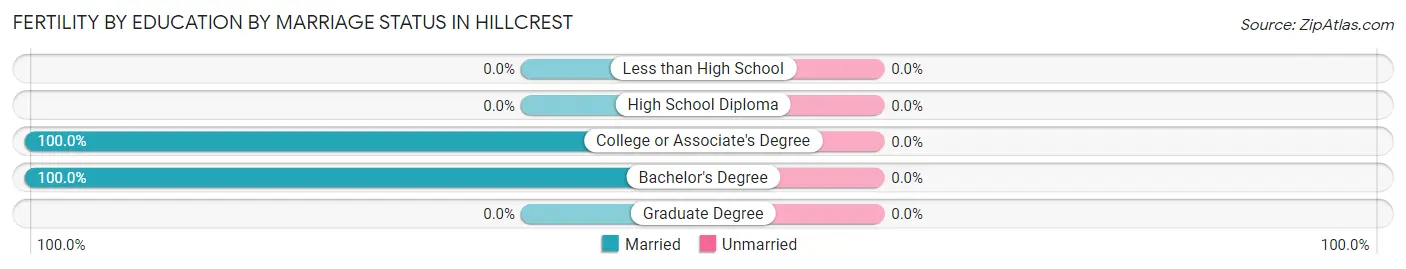
| Educational Attainment | Married | Unmarried |
| Less than High School | 0 (0.0%) | 0 (0.0%) |
| High School Diploma | 0 (0.0%) | 0 (0.0%) |
| College or Associate's Degree | 14 (100.0%) | 0 (0.0%) |
| Bachelor's Degree | 2 (100.0%) | 0 (0.0%) |
| Graduate Degree | 0 (0.0%) | 0 (0.0%) |
| Total | 16 (100.0%) | 0 (0.0%) |
Employment Characteristics in Hillcrest
Employment by Class of Employer in Hillcrest
Among the 326 employed individuals in Hillcrest, private company employees (219 | 67.2%), local government employees (43 | 13.2%), and state government employees (34 | 10.4%) make up the most common classes of employment.
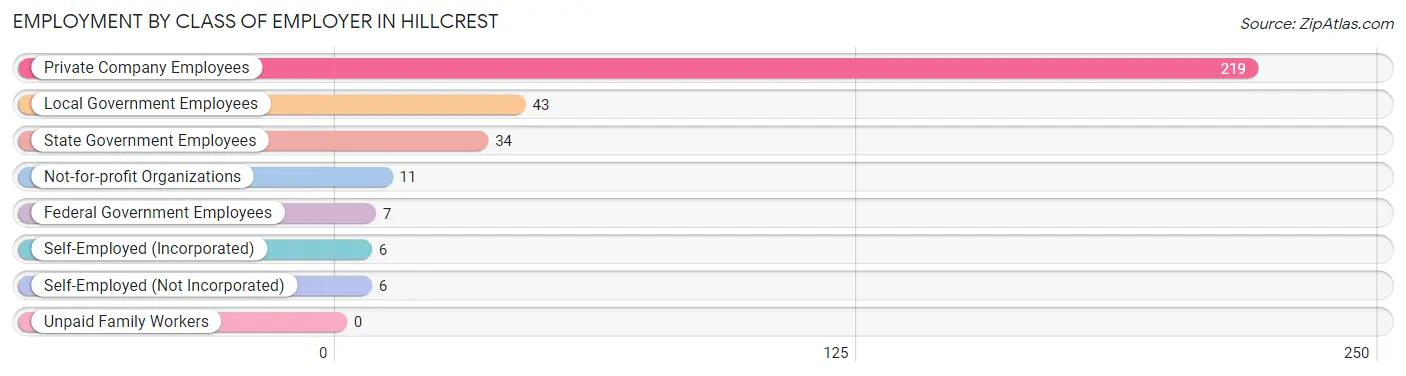
| Employer Class | # Employees | % Employees |
| Private Company Employees | 219 | 67.2% |
| Self-Employed (Incorporated) | 6 | 1.8% |
| Self-Employed (Not Incorporated) | 6 | 1.8% |
| Not-for-profit Organizations | 11 | 3.4% |
| Local Government Employees | 43 | 13.2% |
| State Government Employees | 34 | 10.4% |
| Federal Government Employees | 7 | 2.1% |
| Unpaid Family Workers | 0 | 0.0% |
| Total | 326 | 100.0% |
Employment Status by Age in Hillcrest
According to the labor force statistics for Hillcrest, out of the total population over 16 years of age (581), 60.2% or 350 individuals are in the labor force, with 2.0% or 7 of them unemployed. The age group with the highest labor force participation rate is 20 to 24 years, with 100.0% or 32 individuals in the labor force. Within the labor force, the 35 to 44 years age range has the highest percentage of unemployed individuals, with 7.4% or 6 of them being unemployed.
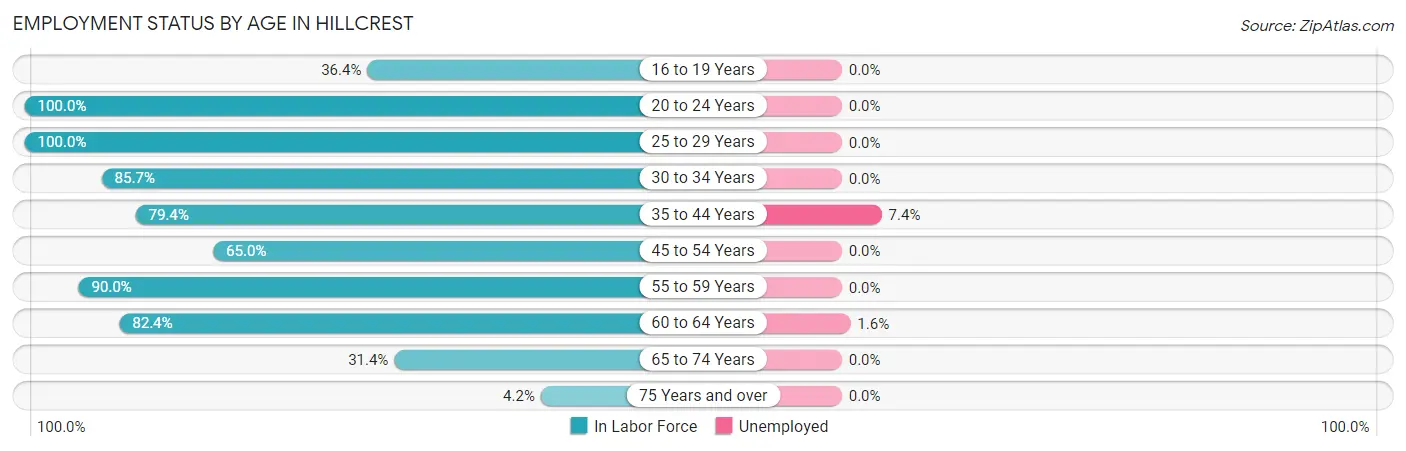
| Age Bracket | In Labor Force | Unemployed |
| 16 to 19 Years | 8 (36.4%) | 0 (0.0%) |
| 20 to 24 Years | 32 (100.0%) | 0 (0.0%) |
| 25 to 29 Years | 25 (100.0%) | 0 (0.0%) |
| 30 to 34 Years | 42 (85.7%) | 0 (0.0%) |
| 35 to 44 Years | 85 (79.4%) | 6 (7.4%) |
| 45 to 54 Years | 39 (65.0%) | 0 (0.0%) |
| 55 to 59 Years | 27 (90.0%) | 0 (0.0%) |
| 60 to 64 Years | 61 (82.4%) | 1 (1.6%) |
| 65 to 74 Years | 27 (31.4%) | 0 (0.0%) |
| 75 Years and over | 4 (4.2%) | 0 (0.0%) |
| Total | 350 (60.2%) | 7 (2.0%) |
Employment Status by Educational Attainment in Hillcrest
According to labor force statistics for Hillcrest, 80.9% of individuals (279) out of the total population between 25 and 64 years of age (345) are in the labor force, with 2.5% or 7 of them being unemployed. The group with the highest labor force participation rate are those with the educational attainment of less than high school, with 100.0% or 7 individuals in the labor force. Within the labor force, individuals with college / associate degree education have the highest percentage of unemployment, with 4.3% or 6 of them being unemployed.
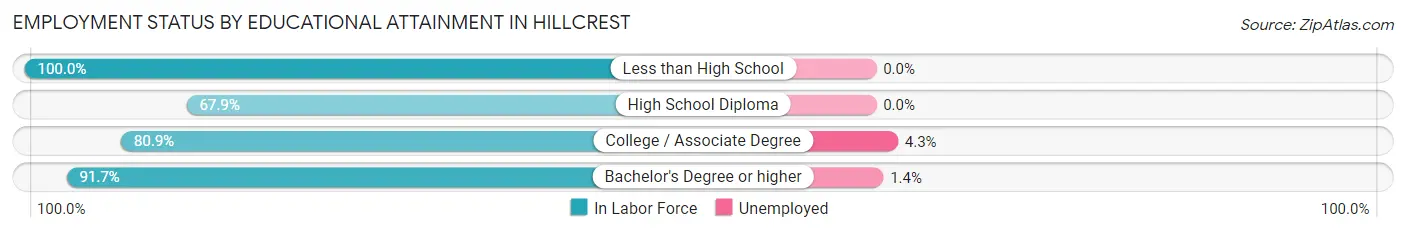
| Educational Attainment | In Labor Force | Unemployed |
| Less than High School | 7 (100.0%) | 0 (0.0%) |
| High School Diploma | 55 (67.9%) | 0 (0.0%) |
| College / Associate Degree | 140 (80.9%) | 7 (4.3%) |
| Bachelor's Degree or higher | 77 (91.7%) | 1 (1.4%) |
| Total | 279 (80.9%) | 9 (2.5%) |
Employment Occupations by Sex in Hillcrest
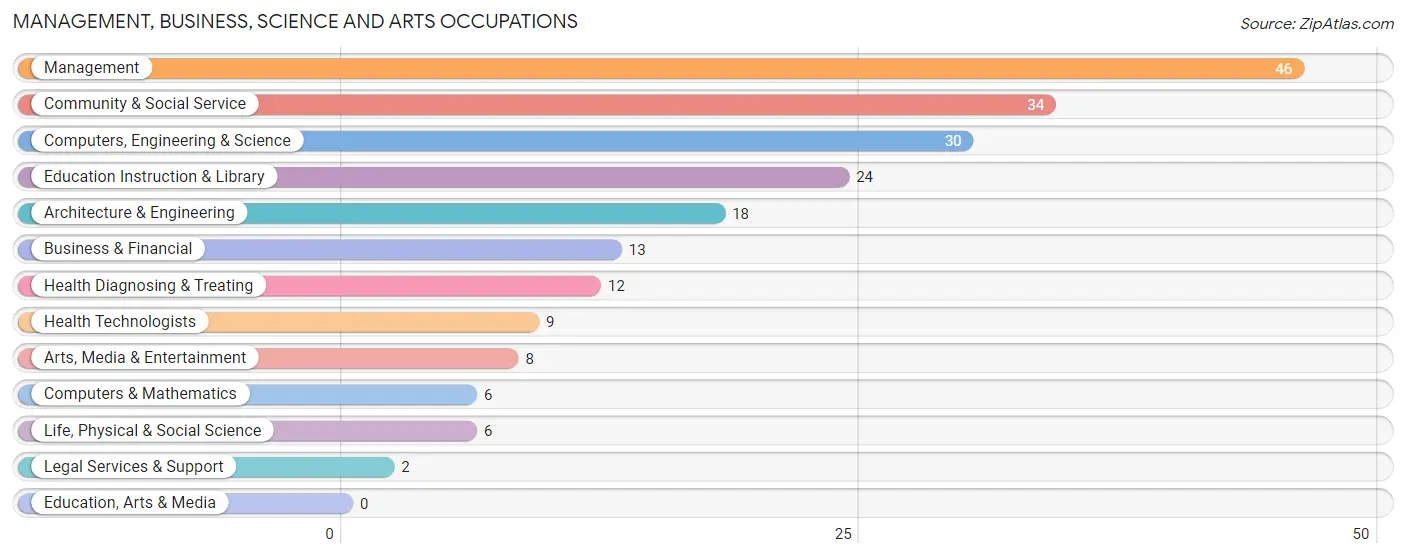
Management, Business, Science and Arts Occupations
The most common Management, Business, Science and Arts occupations in Hillcrest are Management (46 | 13.6%), Community & Social Service (34 | 10.0%), Computers, Engineering & Science (30 | 8.8%), Education Instruction & Library (24 | 7.1%), and Architecture & Engineering (18 | 5.3%).
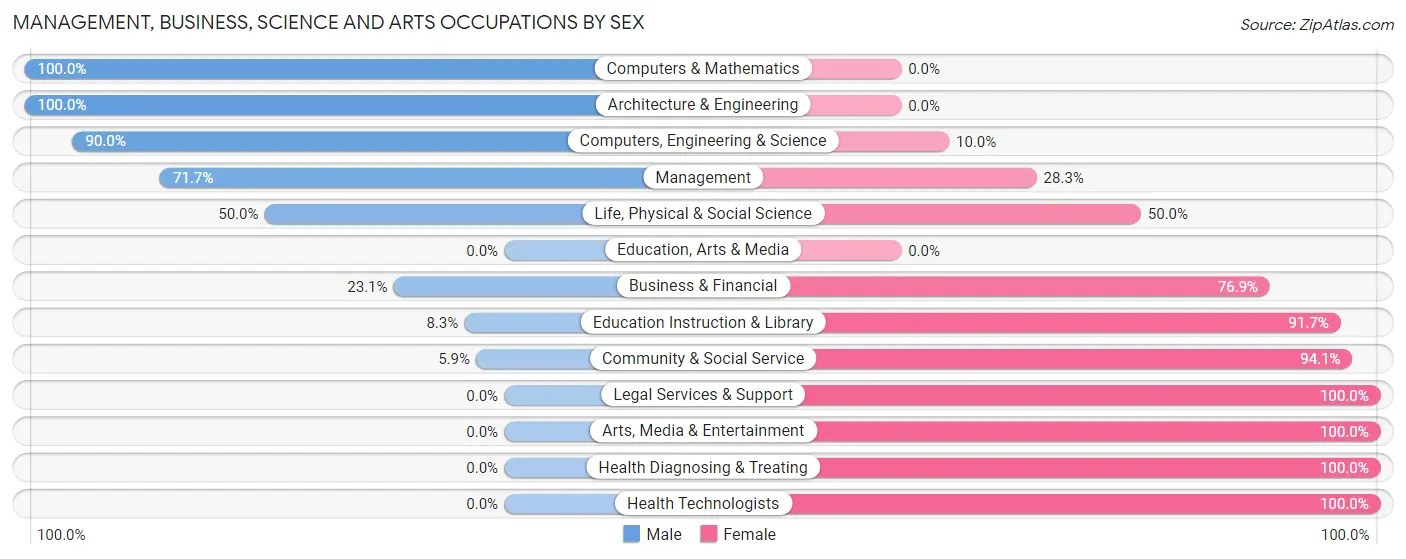
Management, Business, Science and Arts Occupations by Sex
Within the Management, Business, Science and Arts occupations in Hillcrest, the most male-oriented occupations are Computers & Mathematics (100.0%), Architecture & Engineering (100.0%), and Computers, Engineering & Science (90.0%), while the most female-oriented occupations are Legal Services & Support (100.0%), Arts, Media & Entertainment (100.0%), and Health Diagnosing & Treating (100.0%).
| Occupation | Male | Female |
| Management | 33 (71.7%) | 13 (28.3%) |
| Business & Financial | 3 (23.1%) | 10 (76.9%) |
| Computers, Engineering & Science | 27 (90.0%) | 3 (10.0%) |
| Computers & Mathematics | 6 (100.0%) | 0 (0.0%) |
| Architecture & Engineering | 18 (100.0%) | 0 (0.0%) |
| Life, Physical & Social Science | 3 (50.0%) | 3 (50.0%) |
| Community & Social Service | 2 (5.9%) | 32 (94.1%) |
| Education, Arts & Media | 0 (0.0%) | 0 (0.0%) |
| Legal Services & Support | 0 (0.0%) | 2 (100.0%) |
| Education Instruction & Library | 2 (8.3%) | 22 (91.7%) |
| Arts, Media & Entertainment | 0 (0.0%) | 8 (100.0%) |
| Health Diagnosing & Treating | 0 (0.0%) | 12 (100.0%) |
| Health Technologists | 0 (0.0%) | 9 (100.0%) |
| Total (Category) | 65 (48.1%) | 70 (51.8%) |
| Total (Overall) | 173 (51.0%) | 166 (49.0%) |
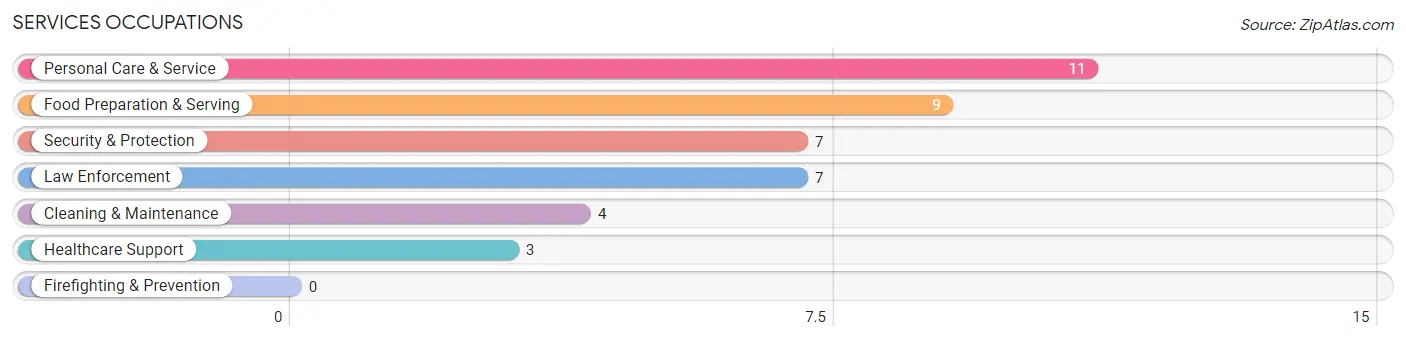
Services Occupations
The most common Services occupations in Hillcrest are Personal Care & Service (11 | 3.2%), Food Preparation & Serving (9 | 2.6%), Security & Protection (7 | 2.1%), Law Enforcement (7 | 2.1%), and Cleaning & Maintenance (4 | 1.2%).
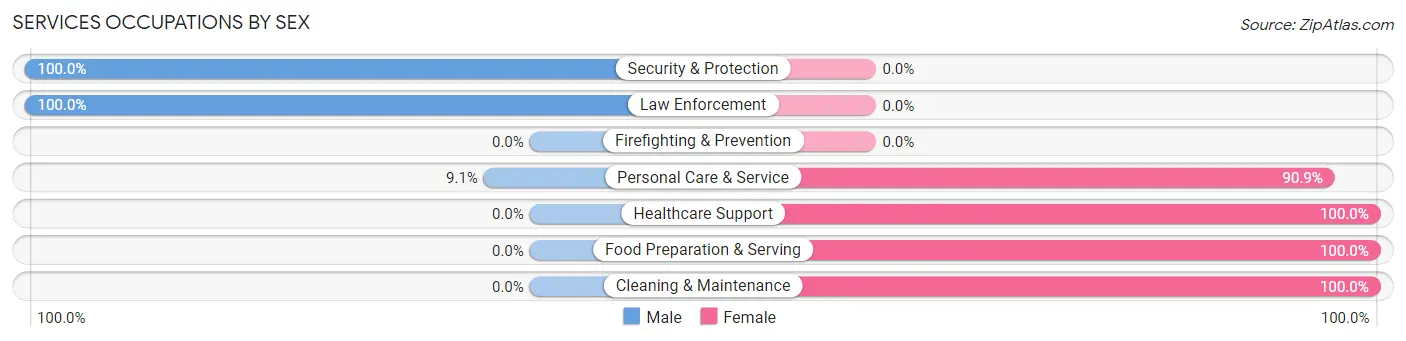
Services Occupations by Sex
Within the Services occupations in Hillcrest, the most male-oriented occupations are Security & Protection (100.0%), Law Enforcement (100.0%), and Personal Care & Service (9.1%), while the most female-oriented occupations are Healthcare Support (100.0%), Food Preparation & Serving (100.0%), and Cleaning & Maintenance (100.0%).
| Occupation | Male | Female |
| Healthcare Support | 0 (0.0%) | 3 (100.0%) |
| Security & Protection | 7 (100.0%) | 0 (0.0%) |
| Firefighting & Prevention | 0 (0.0%) | 0 (0.0%) |
| Law Enforcement | 7 (100.0%) | 0 (0.0%) |
| Food Preparation & Serving | 0 (0.0%) | 9 (100.0%) |
| Cleaning & Maintenance | 0 (0.0%) | 4 (100.0%) |
| Personal Care & Service | 1 (9.1%) | 10 (90.9%) |
| Total (Category) | 8 (23.5%) | 26 (76.5%) |
| Total (Overall) | 173 (51.0%) | 166 (49.0%) |
Sales and Office Occupations
The most common Sales and Office occupations in Hillcrest are Office & Administration (44 | 13.0%), and Sales & Related (25 | 7.4%).
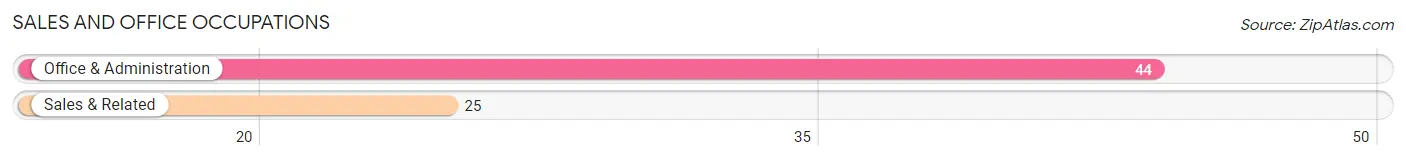
Sales and Office Occupations by Sex
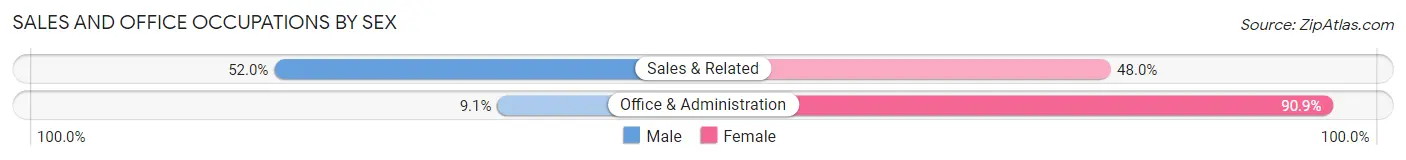
| Occupation | Male | Female |
| Sales & Related | 13 (52.0%) | 12 (48.0%) |
| Office & Administration | 4 (9.1%) | 40 (90.9%) |
| Total (Category) | 17 (24.6%) | 52 (75.4%) |
| Total (Overall) | 173 (51.0%) | 166 (49.0%) |
Natural Resources, Construction and Maintenance Occupations
The most common Natural Resources, Construction and Maintenance occupations in Hillcrest are Construction & Extraction (13 | 3.8%), and Installation, Maintenance & Repair (5 | 1.5%).
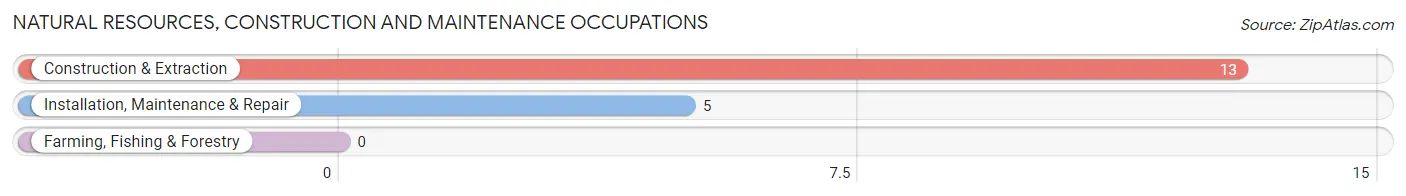
Natural Resources, Construction and Maintenance Occupations by Sex
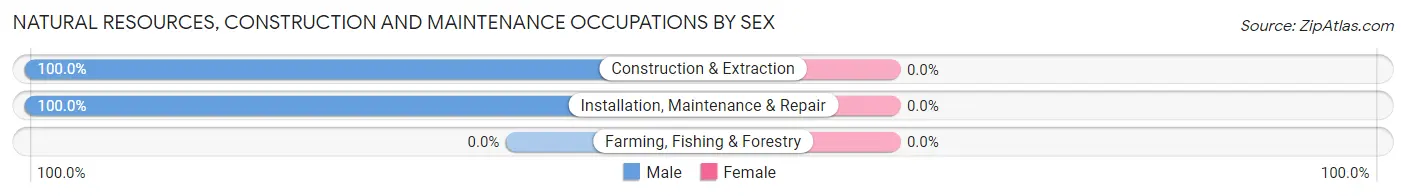
| Occupation | Male | Female |
| Farming, Fishing & Forestry | 0 (0.0%) | 0 (0.0%) |
| Construction & Extraction | 13 (100.0%) | 0 (0.0%) |
| Installation, Maintenance & Repair | 5 (100.0%) | 0 (0.0%) |
| Total (Category) | 18 (100.0%) | 0 (0.0%) |
| Total (Overall) | 173 (51.0%) | 166 (49.0%) |
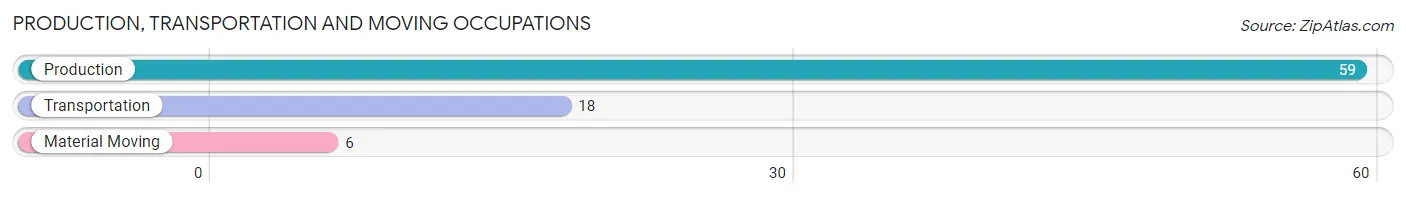
Production, Transportation and Moving Occupations
The most common Production, Transportation and Moving occupations in Hillcrest are Production (59 | 17.4%), Transportation (18 | 5.3%), and Material Moving (6 | 1.8%).
Production, Transportation and Moving Occupations by Sex
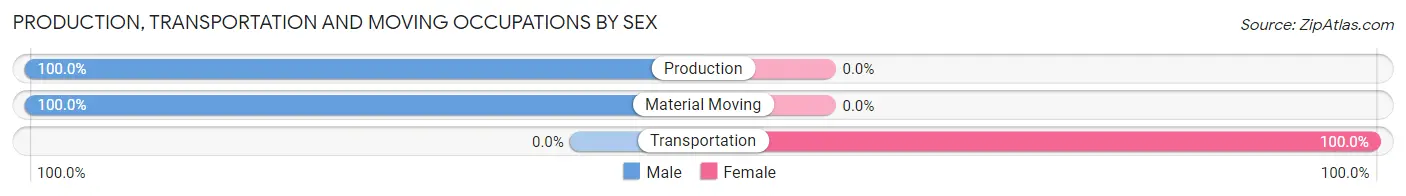
| Occupation | Male | Female |
| Production | 59 (100.0%) | 0 (0.0%) |
| Transportation | 0 (0.0%) | 18 (100.0%) |
| Material Moving | 6 (100.0%) | 0 (0.0%) |
| Total (Category) | 65 (78.3%) | 18 (21.7%) |
| Total (Overall) | 173 (51.0%) | 166 (49.0%) |
Employment Industries by Sex in Hillcrest
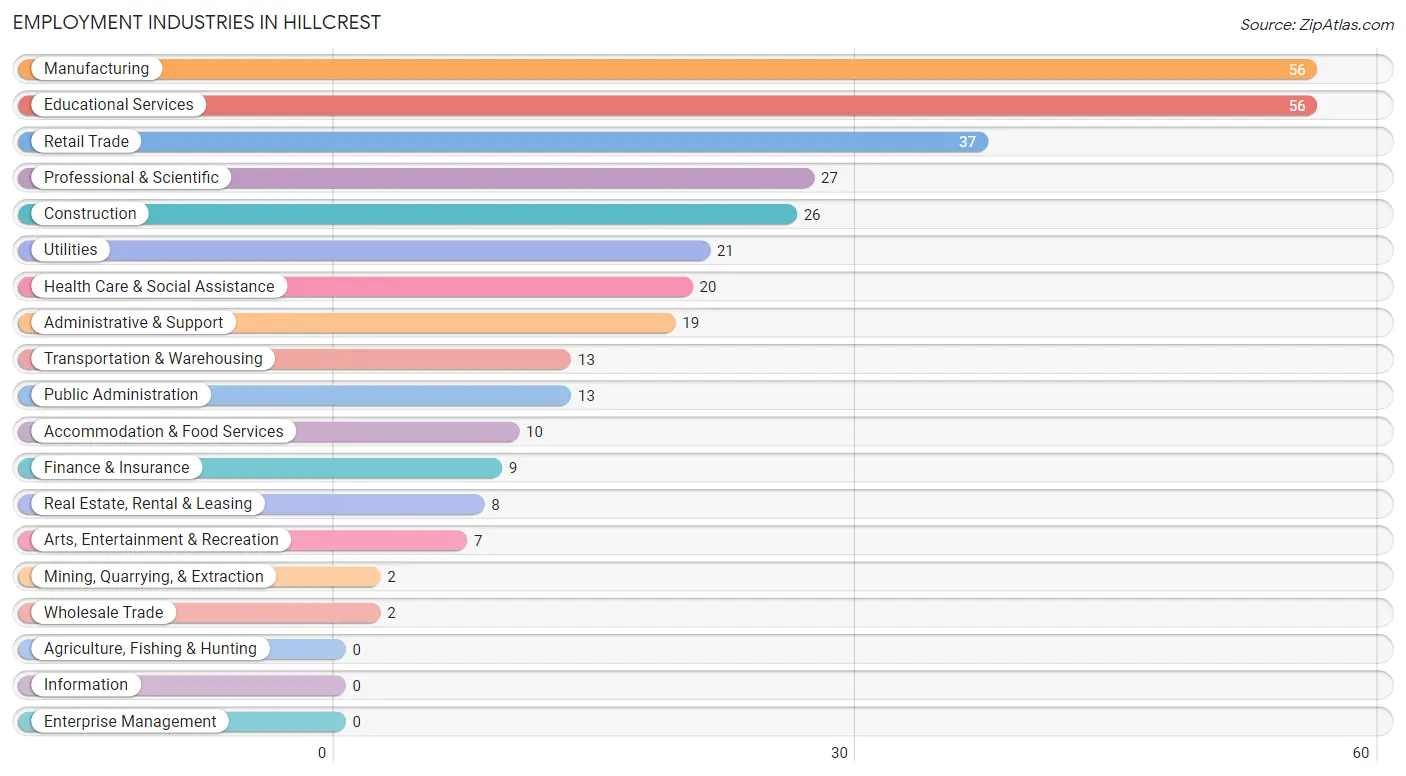
Employment Industries in Hillcrest
The major employment industries in Hillcrest include Manufacturing (56 | 16.5%), Educational Services (56 | 16.5%), Retail Trade (37 | 10.9%), Professional & Scientific (27 | 8.0%), and Construction (26 | 7.7%).
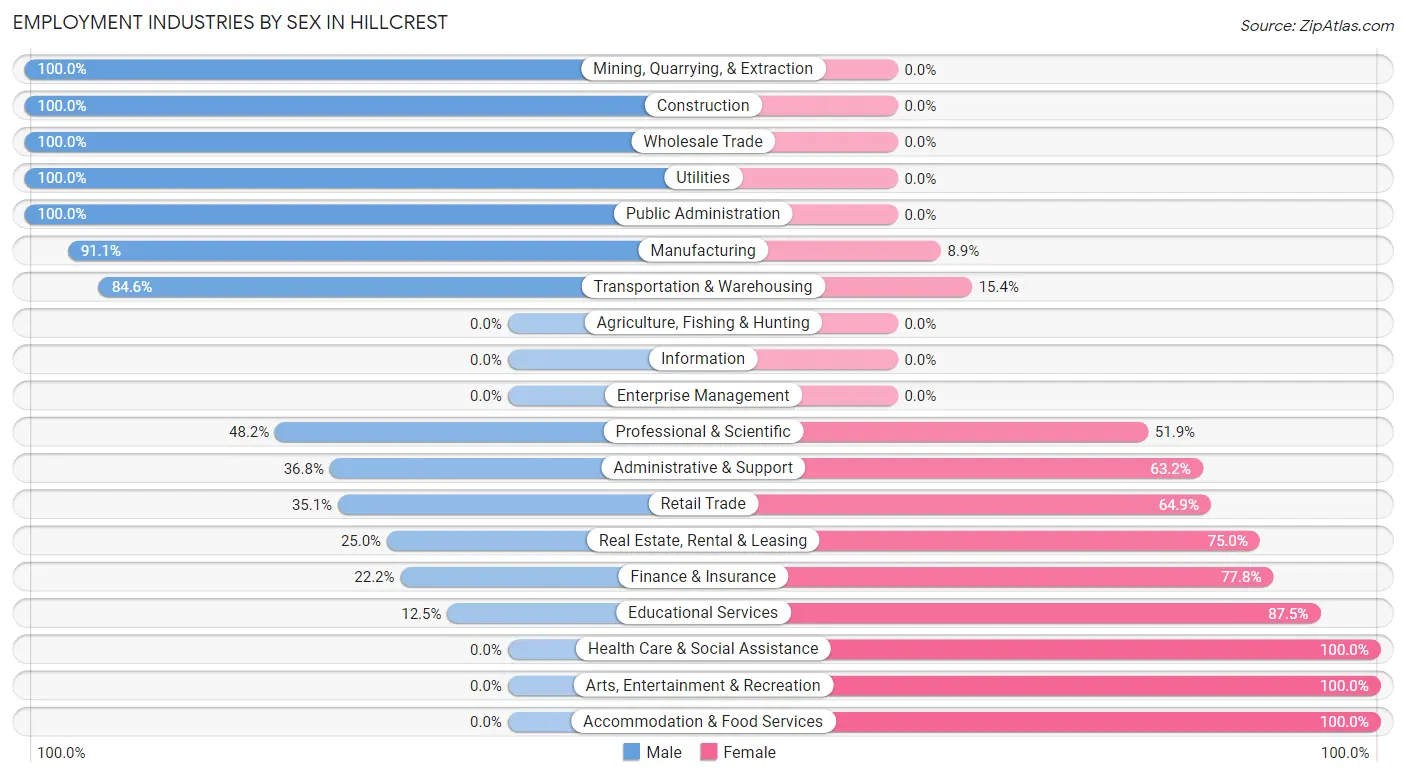
Employment Industries by Sex in Hillcrest
The Hillcrest industries that see more men than women are Mining, Quarrying, & Extraction (100.0%), Construction (100.0%), and Wholesale Trade (100.0%), whereas the industries that tend to have a higher number of women are Health Care & Social Assistance (100.0%), Arts, Entertainment & Recreation (100.0%), and Accommodation & Food Services (100.0%).
| Industry | Male | Female |
| Agriculture, Fishing & Hunting | 0 (0.0%) | 0 (0.0%) |
| Mining, Quarrying, & Extraction | 2 (100.0%) | 0 (0.0%) |
| Construction | 26 (100.0%) | 0 (0.0%) |
| Manufacturing | 51 (91.1%) | 5 (8.9%) |
| Wholesale Trade | 2 (100.0%) | 0 (0.0%) |
| Retail Trade | 13 (35.1%) | 24 (64.9%) |
| Transportation & Warehousing | 11 (84.6%) | 2 (15.4%) |
| Utilities | 21 (100.0%) | 0 (0.0%) |
| Information | 0 (0.0%) | 0 (0.0%) |
| Finance & Insurance | 2 (22.2%) | 7 (77.8%) |
| Real Estate, Rental & Leasing | 2 (25.0%) | 6 (75.0%) |
| Professional & Scientific | 13 (48.1%) | 14 (51.8%) |
| Enterprise Management | 0 (0.0%) | 0 (0.0%) |
| Administrative & Support | 7 (36.8%) | 12 (63.2%) |
| Educational Services | 7 (12.5%) | 49 (87.5%) |
| Health Care & Social Assistance | 0 (0.0%) | 20 (100.0%) |
| Arts, Entertainment & Recreation | 0 (0.0%) | 7 (100.0%) |
| Accommodation & Food Services | 0 (0.0%) | 10 (100.0%) |
| Public Administration | 13 (100.0%) | 0 (0.0%) |
| Total | 173 (51.0%) | 166 (49.0%) |
Education in Hillcrest
School Enrollment in Hillcrest
The most common levels of schooling among the 142 students in Hillcrest are middle school (48 | 33.8%), high school (37 | 26.1%), and elementary school (24 | 16.9%).
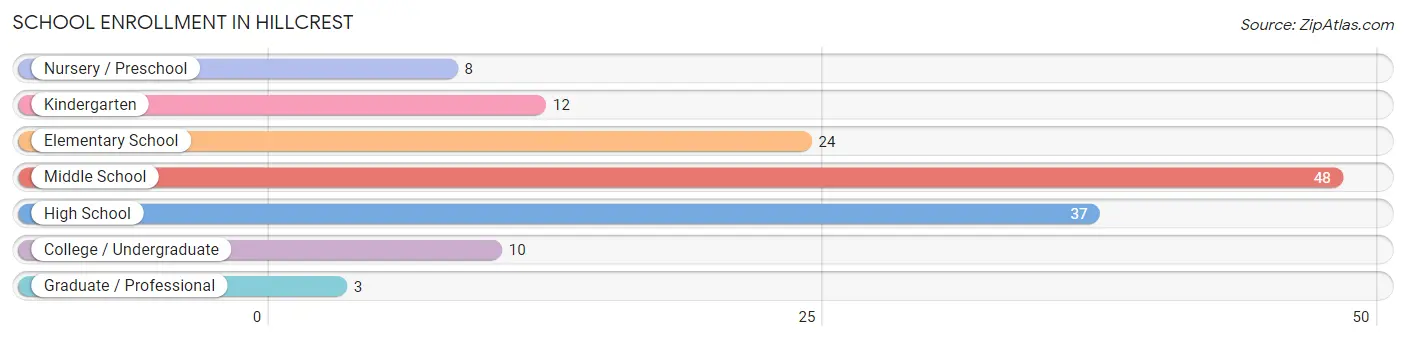
| School Level | # Students | % Students |
| Nursery / Preschool | 8 | 5.6% |
| Kindergarten | 12 | 8.5% |
| Elementary School | 24 | 16.9% |
| Middle School | 48 | 33.8% |
| High School | 37 | 26.1% |
| College / Undergraduate | 10 | 7.0% |
| Graduate / Professional | 3 | 2.1% |
| Total | 142 | 100.0% |
School Enrollment by Age by Funding Source in Hillcrest
Out of a total of 142 students who are enrolled in schools in Hillcrest, 23 (16.2%) attend a private institution, while the remaining 119 (83.8%) are enrolled in public schools. The age group of 20 to 24 year olds has the highest likelihood of being enrolled in private schools, with 7 (63.6% in the age bracket) enrolled. Conversely, the age group of 15 to 17 year olds has the lowest likelihood of being enrolled in a private school, with 24 (100.0% in the age bracket) attending a public institution.
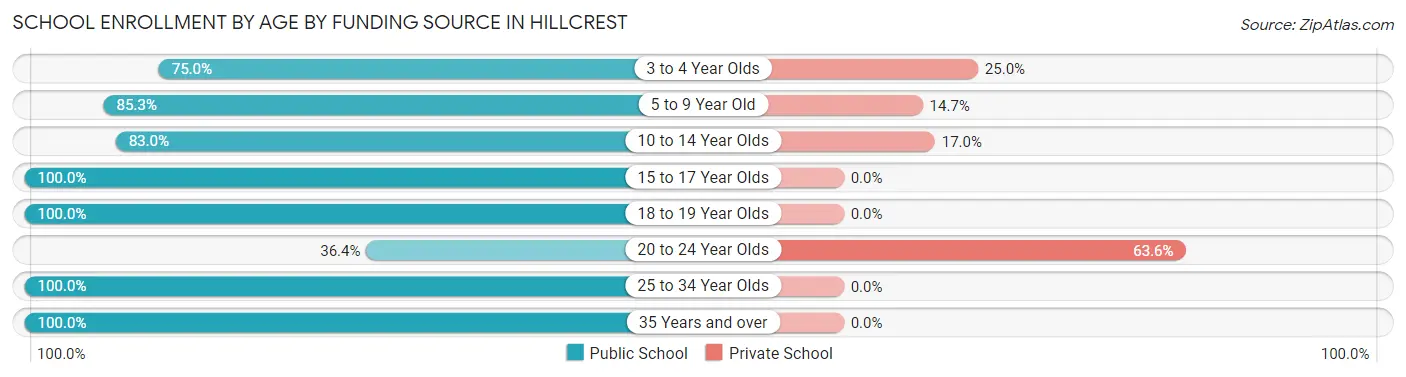
| Age Bracket | Public School | Private School |
| 3 to 4 Year Olds | 6 (75.0%) | 2 (25.0%) |
| 5 to 9 Year Old | 29 (85.3%) | 5 (14.7%) |
| 10 to 14 Year Olds | 44 (83.0%) | 9 (17.0%) |
| 15 to 17 Year Olds | 24 (100.0%) | 0 (0.0%) |
| 18 to 19 Year Olds | 3 (100.0%) | 0 (0.0%) |
| 20 to 24 Year Olds | 4 (36.4%) | 7 (63.6%) |
| 25 to 34 Year Olds | 1 (100.0%) | 0 (0.0%) |
| 35 Years and over | 8 (100.0%) | 0 (0.0%) |
| Total | 119 (83.8%) | 23 (16.2%) |
Educational Attainment by Field of Study in Hillcrest
Education (30 | 21.4%), business (24 | 17.1%), engineering (16 | 11.4%), bio, nature & agricultural (15 | 10.7%), and arts & humanities (13 | 9.3%) are the most common fields of study among 140 individuals in Hillcrest who have obtained a bachelor's degree or higher.
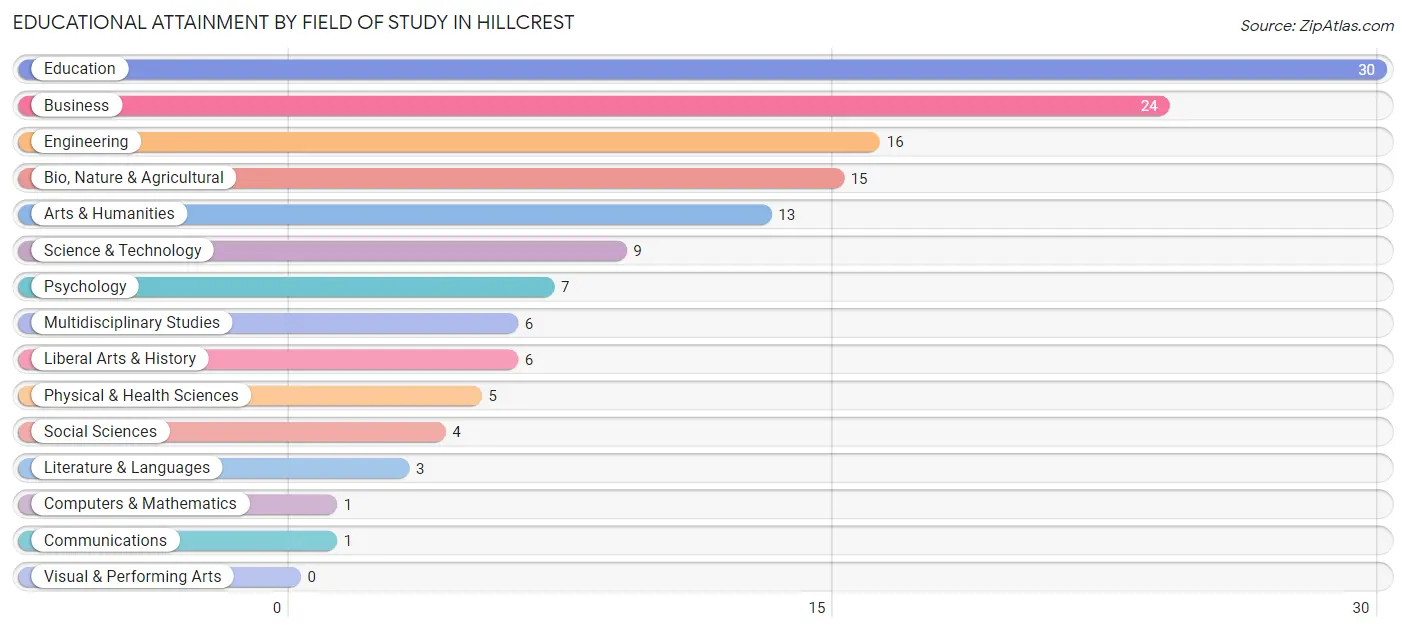
| Field of Study | # Graduates | % Graduates |
| Computers & Mathematics | 1 | 0.7% |
| Bio, Nature & Agricultural | 15 | 10.7% |
| Physical & Health Sciences | 5 | 3.6% |
| Psychology | 7 | 5.0% |
| Social Sciences | 4 | 2.9% |
| Engineering | 16 | 11.4% |
| Multidisciplinary Studies | 6 | 4.3% |
| Science & Technology | 9 | 6.4% |
| Business | 24 | 17.1% |
| Education | 30 | 21.4% |
| Literature & Languages | 3 | 2.1% |
| Liberal Arts & History | 6 | 4.3% |
| Visual & Performing Arts | 0 | 0.0% |
| Communications | 1 | 0.7% |
| Arts & Humanities | 13 | 9.3% |
| Total | 140 | 100.0% |
Transportation & Commute in Hillcrest
Vehicle Availability by Sex in Hillcrest
The most prevalent vehicle ownership categories in Hillcrest are males with 2 vehicles (69, accounting for 40.8%) and females with 2 vehicles (45, making up 44.0%).
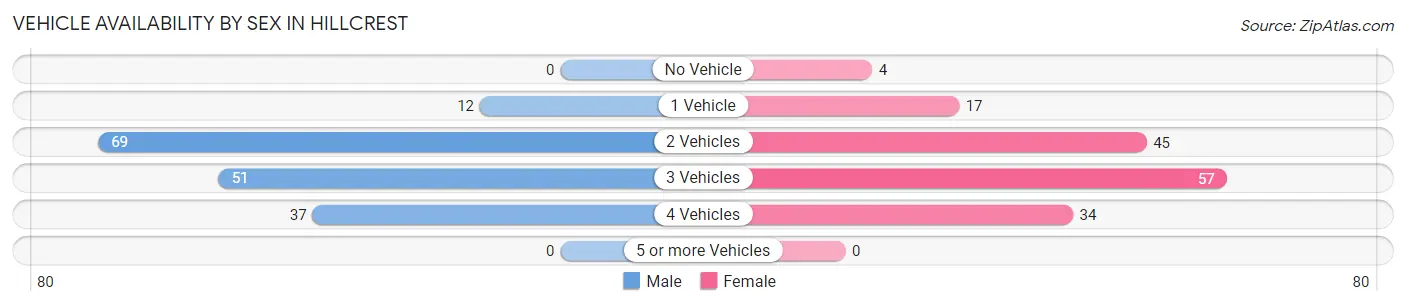
| Vehicles Available | Male | Female |
| No Vehicle | 0 (0.0%) | 4 (2.5%) |
| 1 Vehicle | 12 (7.1%) | 17 (10.8%) |
| 2 Vehicles | 69 (40.8%) | 45 (28.7%) |
| 3 Vehicles | 51 (30.2%) | 57 (36.3%) |
| 4 Vehicles | 37 (21.9%) | 34 (21.7%) |
| 5 or more Vehicles | 0 (0.0%) | 0 (0.0%) |
| Total | 169 (100.0%) | 157 (100.0%) |
Commute Time in Hillcrest
The most frequently occuring commute durations in Hillcrest are 20 to 24 minutes (54 commuters, 17.4%), 10 to 14 minutes (53 commuters, 17.0%), and 60 to 89 minutes (34 commuters, 10.9%).
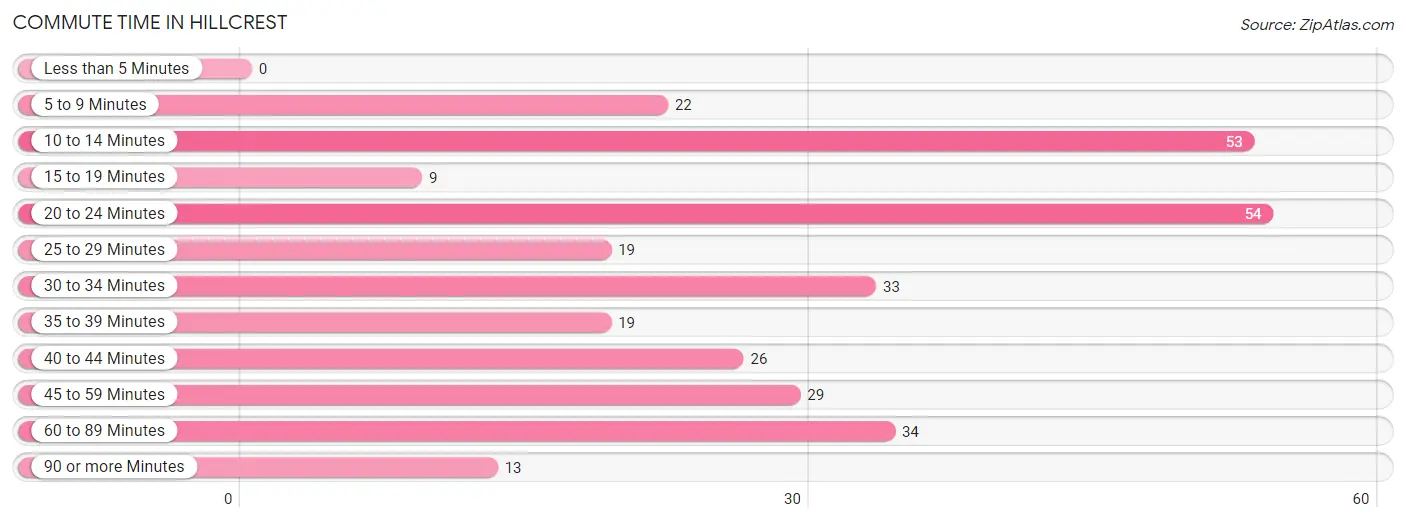
| Commute Time | # Commuters | % Commuters |
| Less than 5 Minutes | 0 | 0.0% |
| 5 to 9 Minutes | 22 | 7.1% |
| 10 to 14 Minutes | 53 | 17.0% |
| 15 to 19 Minutes | 9 | 2.9% |
| 20 to 24 Minutes | 54 | 17.4% |
| 25 to 29 Minutes | 19 | 6.1% |
| 30 to 34 Minutes | 33 | 10.6% |
| 35 to 39 Minutes | 19 | 6.1% |
| 40 to 44 Minutes | 26 | 8.4% |
| 45 to 59 Minutes | 29 | 9.3% |
| 60 to 89 Minutes | 34 | 10.9% |
| 90 or more Minutes | 13 | 4.2% |
Commute Time by Sex in Hillcrest
The most common commute times in Hillcrest are 60 to 89 minutes (30 commuters, 19.0%) for males and 10 to 14 minutes (39 commuters, 25.5%) for females.
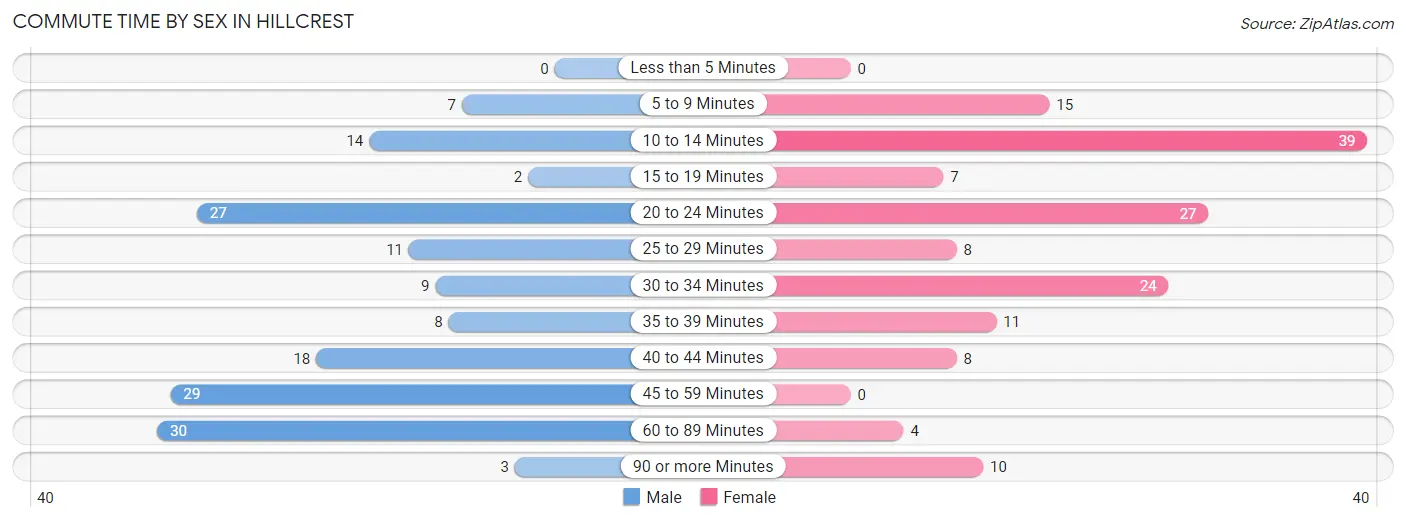
| Commute Time | Male | Female |
| Less than 5 Minutes | 0 (0.0%) | 0 (0.0%) |
| 5 to 9 Minutes | 7 (4.4%) | 15 (9.8%) |
| 10 to 14 Minutes | 14 (8.9%) | 39 (25.5%) |
| 15 to 19 Minutes | 2 (1.3%) | 7 (4.6%) |
| 20 to 24 Minutes | 27 (17.1%) | 27 (17.6%) |
| 25 to 29 Minutes | 11 (7.0%) | 8 (5.2%) |
| 30 to 34 Minutes | 9 (5.7%) | 24 (15.7%) |
| 35 to 39 Minutes | 8 (5.1%) | 11 (7.2%) |
| 40 to 44 Minutes | 18 (11.4%) | 8 (5.2%) |
| 45 to 59 Minutes | 29 (18.3%) | 0 (0.0%) |
| 60 to 89 Minutes | 30 (19.0%) | 4 (2.6%) |
| 90 or more Minutes | 3 (1.9%) | 10 (6.5%) |
Time of Departure to Work by Sex in Hillcrest
The most frequent times of departure to work in Hillcrest are 5:00 AM to 5:29 AM (30, 19.0%) for males and 7:30 AM to 7:59 AM (37, 24.2%) for females.
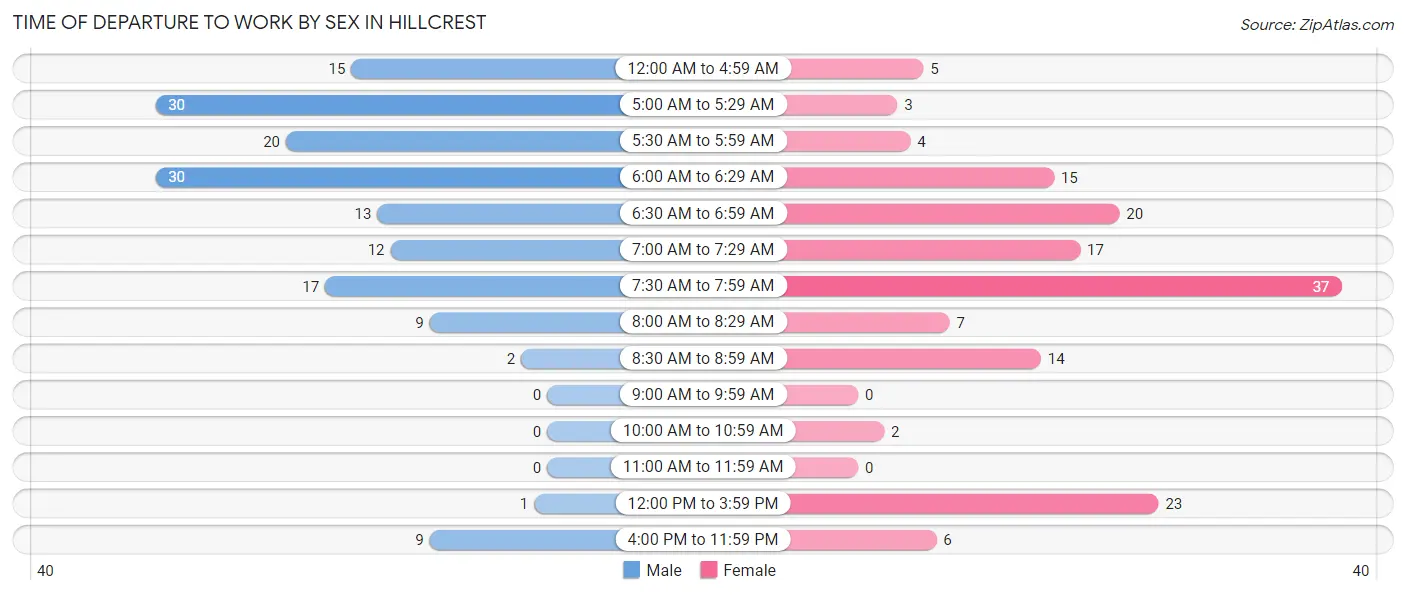
| Time of Departure | Male | Female |
| 12:00 AM to 4:59 AM | 15 (9.5%) | 5 (3.3%) |
| 5:00 AM to 5:29 AM | 30 (19.0%) | 3 (2.0%) |
| 5:30 AM to 5:59 AM | 20 (12.7%) | 4 (2.6%) |
| 6:00 AM to 6:29 AM | 30 (19.0%) | 15 (9.8%) |
| 6:30 AM to 6:59 AM | 13 (8.2%) | 20 (13.1%) |
| 7:00 AM to 7:29 AM | 12 (7.6%) | 17 (11.1%) |
| 7:30 AM to 7:59 AM | 17 (10.8%) | 37 (24.2%) |
| 8:00 AM to 8:29 AM | 9 (5.7%) | 7 (4.6%) |
| 8:30 AM to 8:59 AM | 2 (1.3%) | 14 (9.1%) |
| 9:00 AM to 9:59 AM | 0 (0.0%) | 0 (0.0%) |
| 10:00 AM to 10:59 AM | 0 (0.0%) | 2 (1.3%) |
| 11:00 AM to 11:59 AM | 0 (0.0%) | 0 (0.0%) |
| 12:00 PM to 3:59 PM | 1 (0.6%) | 23 (15.0%) |
| 4:00 PM to 11:59 PM | 9 (5.7%) | 6 (3.9%) |
| Total | 158 (100.0%) | 153 (100.0%) |
Housing Occupancy in Hillcrest
Occupancy by Ownership in Hillcrest
Of the total 263 dwellings in Hillcrest, owner-occupied units account for 238 (90.5%), while renter-occupied units make up 25 (9.5%).
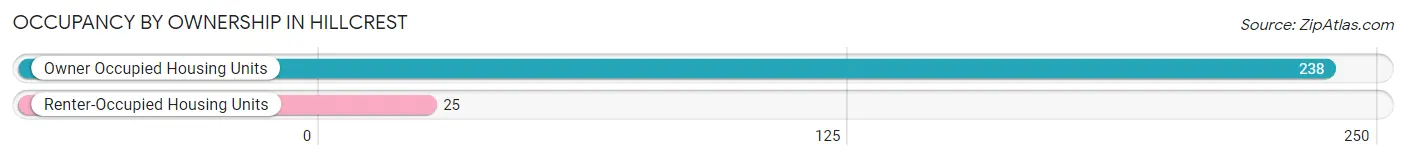
| Occupancy | # Housing Units | % Housing Units |
| Owner Occupied Housing Units | 238 | 90.5% |
| Renter-Occupied Housing Units | 25 | 9.5% |
| Total Occupied Housing Units | 263 | 100.0% |
Occupancy by Household Size in Hillcrest
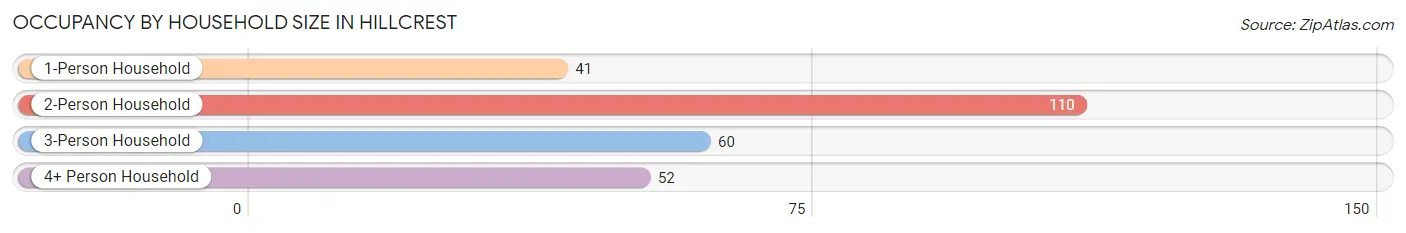
| Household Size | # Housing Units | % Housing Units |
| 1-Person Household | 41 | 15.6% |
| 2-Person Household | 110 | 41.8% |
| 3-Person Household | 60 | 22.8% |
| 4+ Person Household | 52 | 19.8% |
| Total Housing Units | 263 | 100.0% |
Occupancy by Ownership by Household Size in Hillcrest
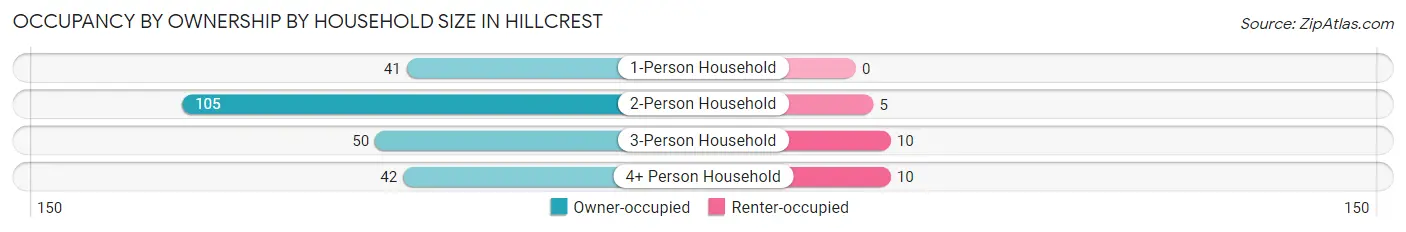
| Household Size | Owner-occupied | Renter-occupied |
| 1-Person Household | 41 (100.0%) | 0 (0.0%) |
| 2-Person Household | 105 (95.5%) | 5 (4.5%) |
| 3-Person Household | 50 (83.3%) | 10 (16.7%) |
| 4+ Person Household | 42 (80.8%) | 10 (19.2%) |
| Total Housing Units | 238 (90.5%) | 25 (9.5%) |
Occupancy by Educational Attainment in Hillcrest
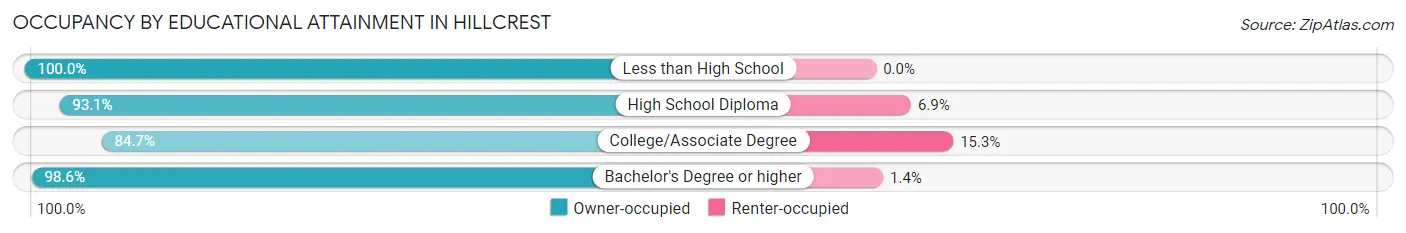
| Household Size | Owner-occupied | Renter-occupied |
| Less than High School | 1 (100.0%) | 0 (0.0%) |
| High School Diploma | 54 (93.1%) | 4 (6.9%) |
| College/Associate Degree | 111 (84.7%) | 20 (15.3%) |
| Bachelor's Degree or higher | 72 (98.6%) | 1 (1.4%) |
Occupancy by Age of Householder in Hillcrest
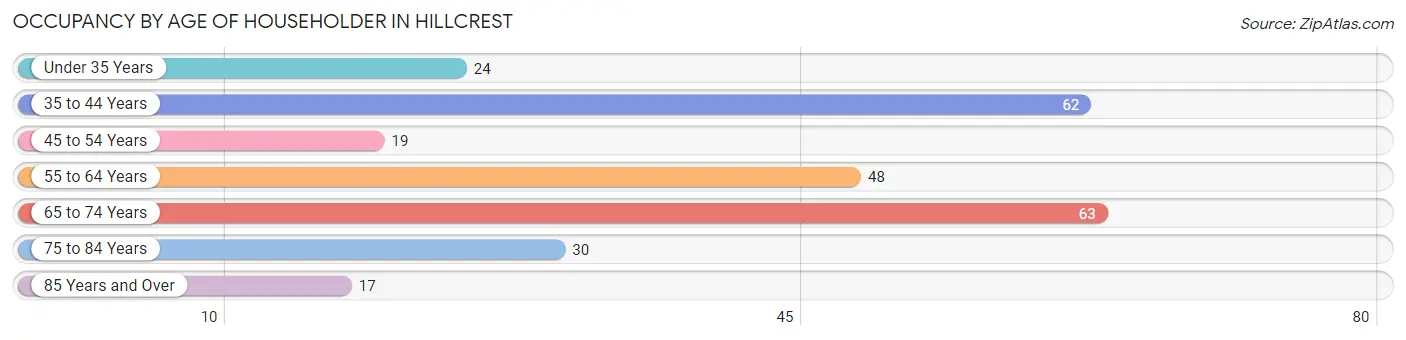
| Age Bracket | # Households | % Households |
| Under 35 Years | 24 | 9.1% |
| 35 to 44 Years | 62 | 23.6% |
| 45 to 54 Years | 19 | 7.2% |
| 55 to 64 Years | 48 | 18.2% |
| 65 to 74 Years | 63 | 23.9% |
| 75 to 84 Years | 30 | 11.4% |
| 85 Years and Over | 17 | 6.5% |
| Total | 263 | 100.0% |
Housing Finances in Hillcrest
Median Income by Occupancy in Hillcrest
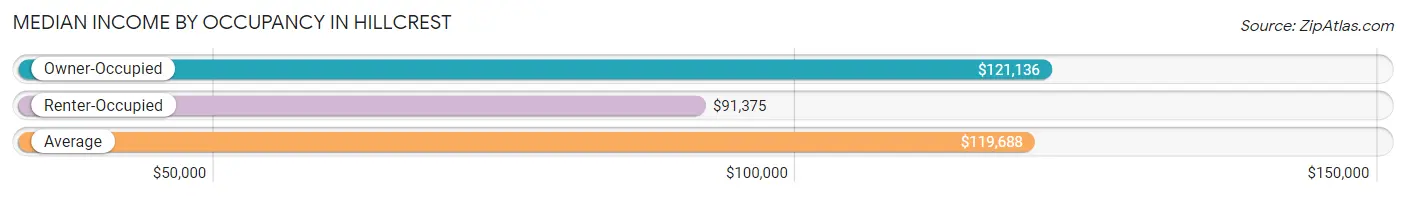
| Occupancy Type | # Households | Median Income |
| Owner-Occupied | 238 (90.5%) | $121,136 |
| Renter-Occupied | 25 (9.5%) | $91,375 |
| Average | 263 (100.0%) | $119,688 |
Occupancy by Householder Income Bracket in Hillcrest
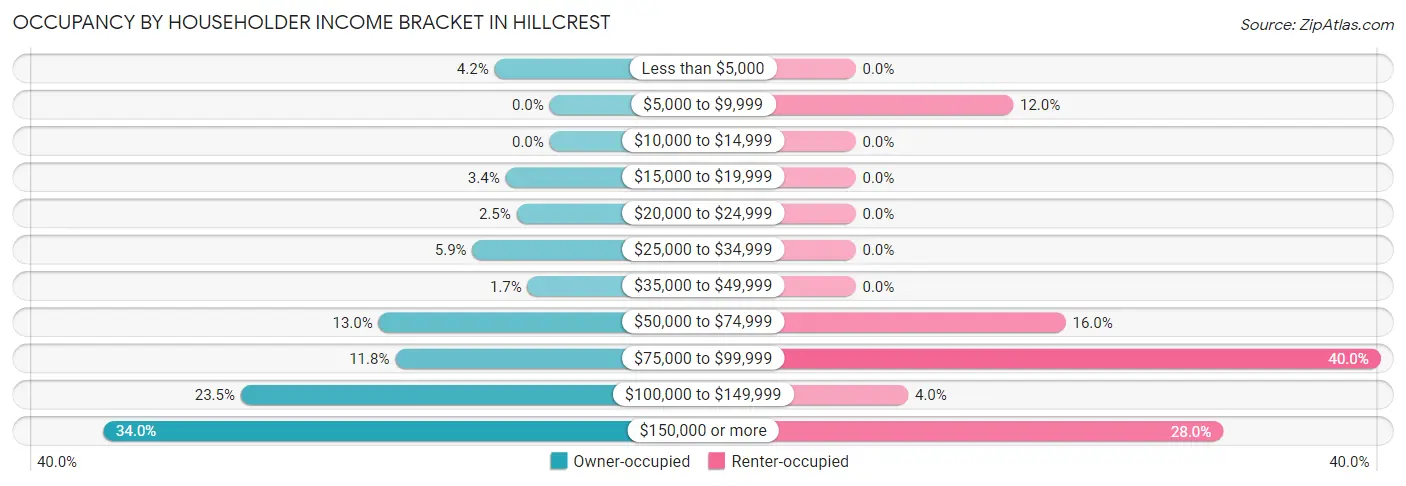
| Income Bracket | Owner-occupied | Renter-occupied |
| Less than $5,000 | 10 (4.2%) | 0 (0.0%) |
| $5,000 to $9,999 | 0 (0.0%) | 3 (12.0%) |
| $10,000 to $14,999 | 0 (0.0%) | 0 (0.0%) |
| $15,000 to $19,999 | 8 (3.4%) | 0 (0.0%) |
| $20,000 to $24,999 | 6 (2.5%) | 0 (0.0%) |
| $25,000 to $34,999 | 14 (5.9%) | 0 (0.0%) |
| $35,000 to $49,999 | 4 (1.7%) | 0 (0.0%) |
| $50,000 to $74,999 | 31 (13.0%) | 4 (16.0%) |
| $75,000 to $99,999 | 28 (11.8%) | 10 (40.0%) |
| $100,000 to $149,999 | 56 (23.5%) | 1 (4.0%) |
| $150,000 or more | 81 (34.0%) | 7 (28.0%) |
| Total | 238 (100.0%) | 25 (100.0%) |
Monthly Housing Cost Tiers in Hillcrest
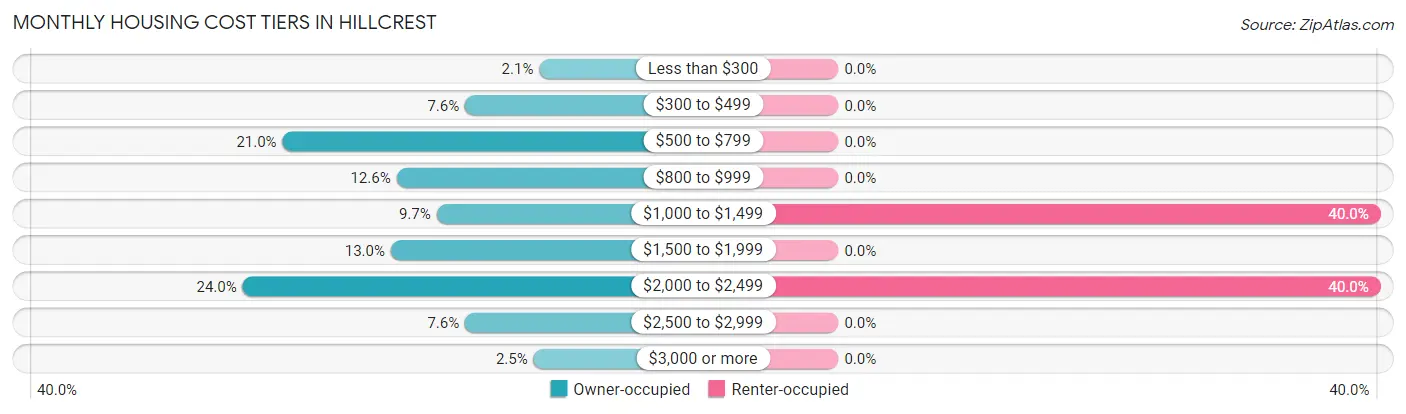
| Monthly Cost | Owner-occupied | Renter-occupied |
| Less than $300 | 5 (2.1%) | 0 (0.0%) |
| $300 to $499 | 18 (7.6%) | 0 (0.0%) |
| $500 to $799 | 50 (21.0%) | 0 (0.0%) |
| $800 to $999 | 30 (12.6%) | 0 (0.0%) |
| $1,000 to $1,499 | 23 (9.7%) | 10 (40.0%) |
| $1,500 to $1,999 | 31 (13.0%) | 0 (0.0%) |
| $2,000 to $2,499 | 57 (23.9%) | 10 (40.0%) |
| $2,500 to $2,999 | 18 (7.6%) | 0 (0.0%) |
| $3,000 or more | 6 (2.5%) | 0 (0.0%) |
| Total | 238 (100.0%) | 25 (100.0%) |
Physical Housing Characteristics in Hillcrest
Housing Structures in Hillcrest
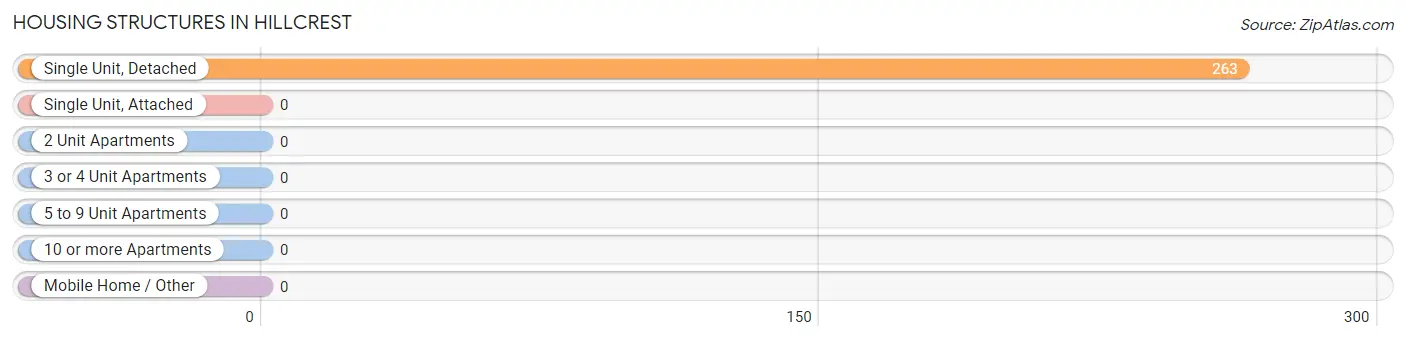
| Structure Type | # Housing Units | % Housing Units |
| Single Unit, Detached | 263 | 100.0% |
| Single Unit, Attached | 0 | 0.0% |
| 2 Unit Apartments | 0 | 0.0% |
| 3 or 4 Unit Apartments | 0 | 0.0% |
| 5 to 9 Unit Apartments | 0 | 0.0% |
| 10 or more Apartments | 0 | 0.0% |
| Mobile Home / Other | 0 | 0.0% |
| Total | 263 | 100.0% |
Housing Structures by Occupancy in Hillcrest
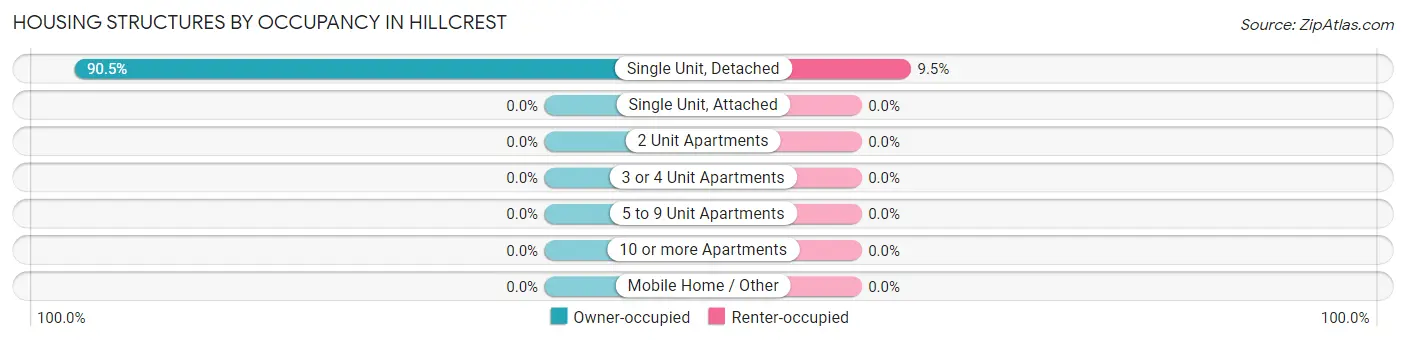
| Structure Type | Owner-occupied | Renter-occupied |
| Single Unit, Detached | 238 (90.5%) | 25 (9.5%) |
| Single Unit, Attached | 0 (0.0%) | 0 (0.0%) |
| 2 Unit Apartments | 0 (0.0%) | 0 (0.0%) |
| 3 or 4 Unit Apartments | 0 (0.0%) | 0 (0.0%) |
| 5 to 9 Unit Apartments | 0 (0.0%) | 0 (0.0%) |
| 10 or more Apartments | 0 (0.0%) | 0 (0.0%) |
| Mobile Home / Other | 0 (0.0%) | 0 (0.0%) |
| Total | 238 (90.5%) | 25 (9.5%) |
Housing Structures by Number of Rooms in Hillcrest
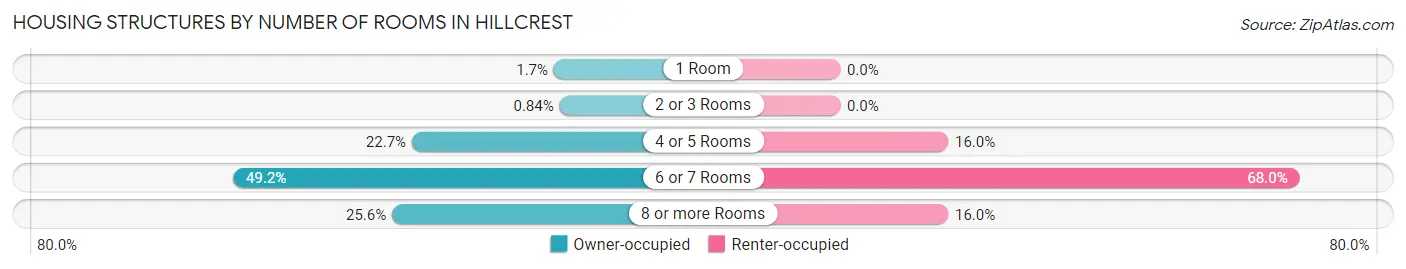
| Number of Rooms | Owner-occupied | Renter-occupied |
| 1 Room | 4 (1.7%) | 0 (0.0%) |
| 2 or 3 Rooms | 2 (0.8%) | 0 (0.0%) |
| 4 or 5 Rooms | 54 (22.7%) | 4 (16.0%) |
| 6 or 7 Rooms | 117 (49.2%) | 17 (68.0%) |
| 8 or more Rooms | 61 (25.6%) | 4 (16.0%) |
| Total | 238 (100.0%) | 25 (100.0%) |
Housing Structure by Heating Type in Hillcrest
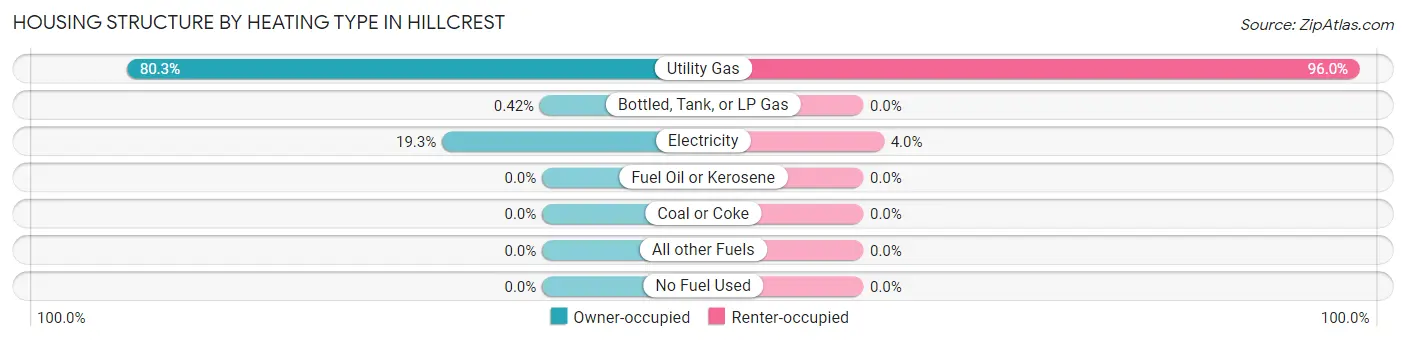
| Heating Type | Owner-occupied | Renter-occupied |
| Utility Gas | 191 (80.2%) | 24 (96.0%) |
| Bottled, Tank, or LP Gas | 1 (0.4%) | 0 (0.0%) |
| Electricity | 46 (19.3%) | 1 (4.0%) |
| Fuel Oil or Kerosene | 0 (0.0%) | 0 (0.0%) |
| Coal or Coke | 0 (0.0%) | 0 (0.0%) |
| All other Fuels | 0 (0.0%) | 0 (0.0%) |
| No Fuel Used | 0 (0.0%) | 0 (0.0%) |
| Total | 238 (100.0%) | 25 (100.0%) |
Household Vehicle Usage in Hillcrest
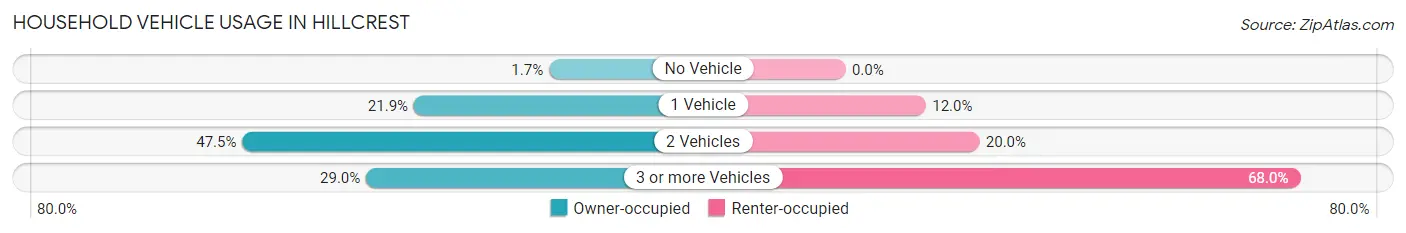
| Vehicles per Household | Owner-occupied | Renter-occupied |
| No Vehicle | 4 (1.7%) | 0 (0.0%) |
| 1 Vehicle | 52 (21.8%) | 3 (12.0%) |
| 2 Vehicles | 113 (47.5%) | 5 (20.0%) |
| 3 or more Vehicles | 69 (29.0%) | 17 (68.0%) |
| Total | 238 (100.0%) | 25 (100.0%) |
Real Estate & Mortgages in Hillcrest
Real Estate and Mortgage Overview in Hillcrest
| Characteristic | Without Mortgage | With Mortgage |
| Housing Units | 112 | 126 |
| Median Property Value | $226,100 | $249,000 |
| Median Household Income | $77,500 | $59 |
| Monthly Housing Costs | $719 | $6 |
| Real Estate Taxes | $3,522 | $0 |
Property Value by Mortgage Status in Hillcrest
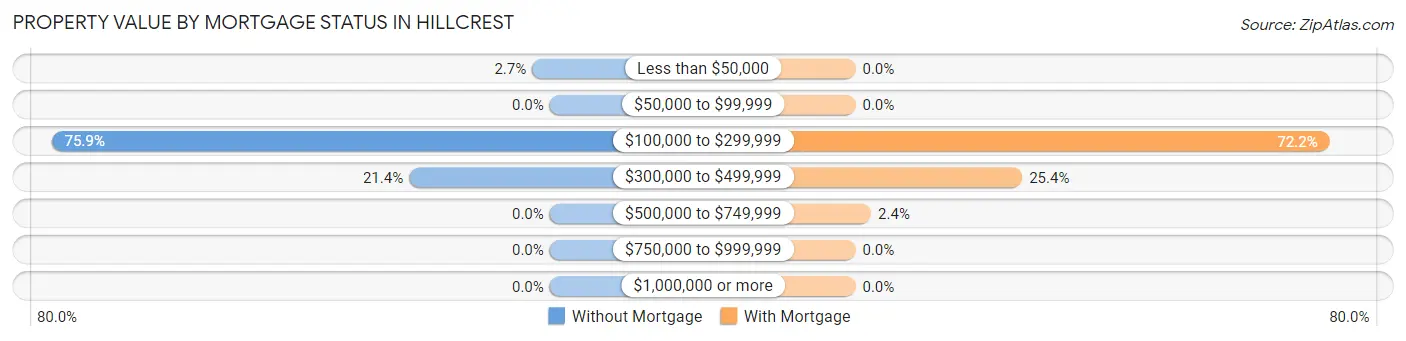
| Property Value | Without Mortgage | With Mortgage |
| Less than $50,000 | 3 (2.7%) | 0 (0.0%) |
| $50,000 to $99,999 | 0 (0.0%) | 0 (0.0%) |
| $100,000 to $299,999 | 85 (75.9%) | 91 (72.2%) |
| $300,000 to $499,999 | 24 (21.4%) | 32 (25.4%) |
| $500,000 to $749,999 | 0 (0.0%) | 3 (2.4%) |
| $750,000 to $999,999 | 0 (0.0%) | 0 (0.0%) |
| $1,000,000 or more | 0 (0.0%) | 0 (0.0%) |
| Total | 112 (100.0%) | 126 (100.0%) |
Household Income by Mortgage Status in Hillcrest
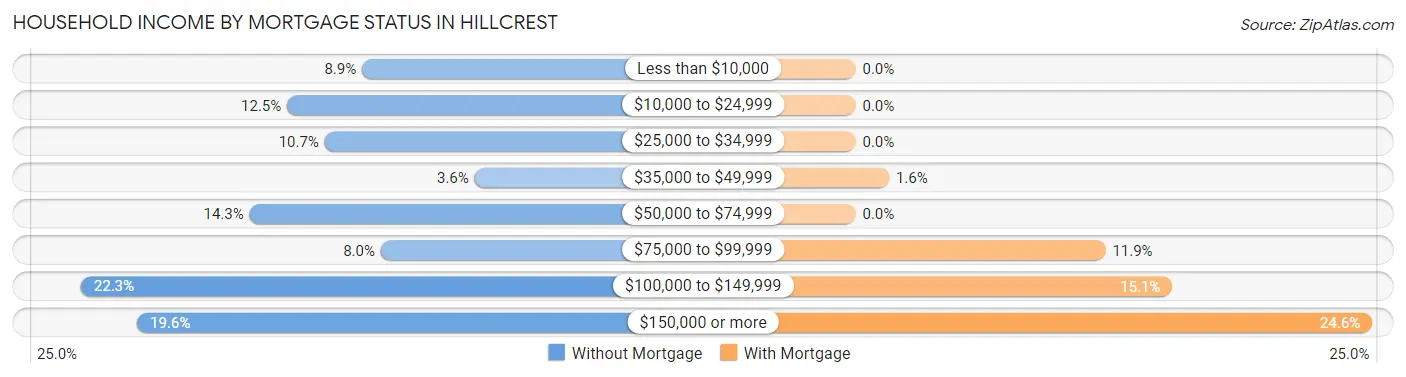
| Household Income | Without Mortgage | With Mortgage |
| Less than $10,000 | 10 (8.9%) | 0 (0.0%) |
| $10,000 to $24,999 | 14 (12.5%) | 0 (0.0%) |
| $25,000 to $34,999 | 12 (10.7%) | 0 (0.0%) |
| $35,000 to $49,999 | 4 (3.6%) | 2 (1.6%) |
| $50,000 to $74,999 | 16 (14.3%) | 0 (0.0%) |
| $75,000 to $99,999 | 9 (8.0%) | 15 (11.9%) |
| $100,000 to $149,999 | 25 (22.3%) | 19 (15.1%) |
| $150,000 or more | 22 (19.6%) | 31 (24.6%) |
| Total | 112 (100.0%) | 126 (100.0%) |
Property Value to Household Income Ratio in Hillcrest
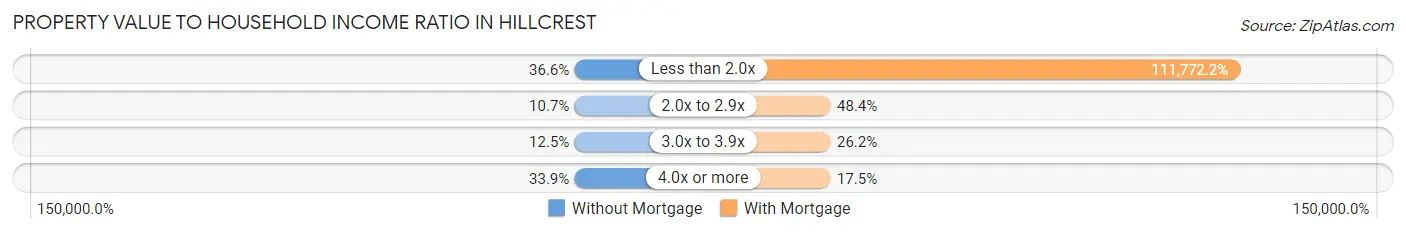
| Value-to-Income Ratio | Without Mortgage | With Mortgage |
| Less than 2.0x | 41 (36.6%) | 140,833 (111,772.2%) |
| 2.0x to 2.9x | 12 (10.7%) | 61 (48.4%) |
| 3.0x to 3.9x | 14 (12.5%) | 33 (26.2%) |
| 4.0x or more | 38 (33.9%) | 22 (17.5%) |
| Total | 112 (100.0%) | 126 (100.0%) |
Real Estate Taxes by Mortgage Status in Hillcrest
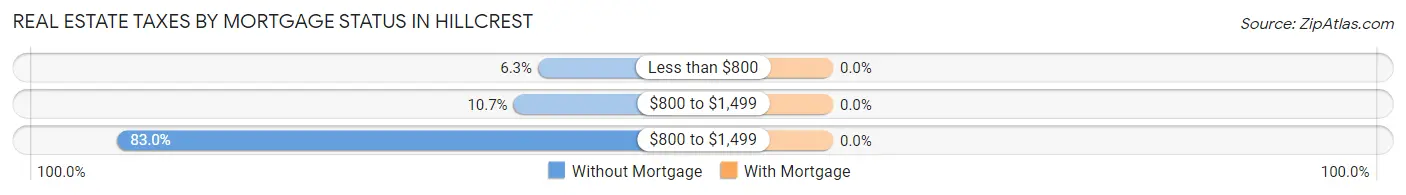
| Property Taxes | Without Mortgage | With Mortgage |
| Less than $800 | 7 (6.2%) | 0 (0.0%) |
| $800 to $1,499 | 12 (10.7%) | 0 (0.0%) |
| $800 to $1,499 | 93 (83.0%) | 0 (0.0%) |
| Total | 112 (100.0%) | 126 (100.0%) |
Health & Disability in Hillcrest
Health Insurance Coverage by Age in Hillcrest
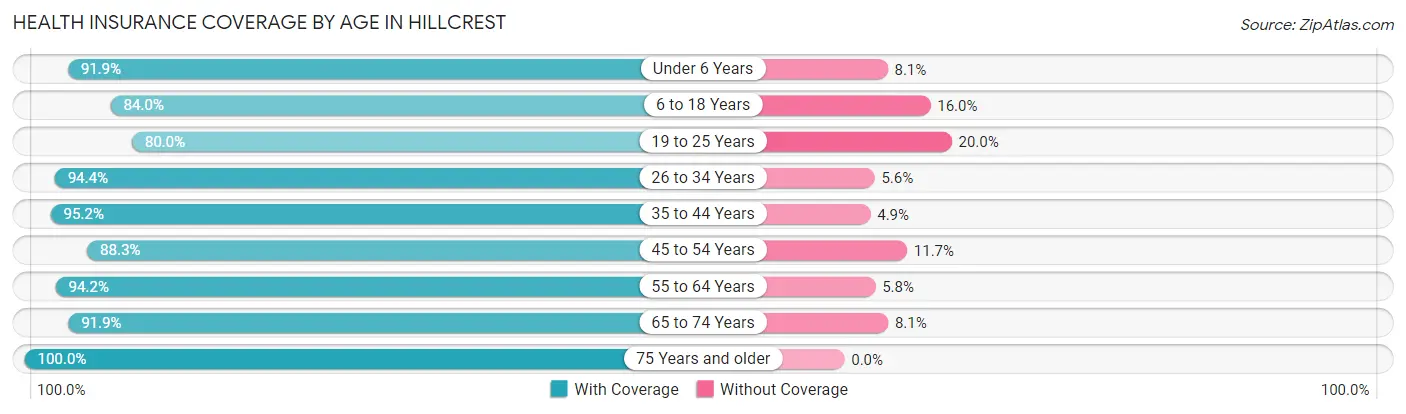
| Age Bracket | With Coverage | Without Coverage |
| Under 6 Years | 57 (91.9%) | 5 (8.1%) |
| 6 to 18 Years | 89 (84.0%) | 17 (16.0%) |
| 19 to 25 Years | 28 (80.0%) | 7 (20.0%) |
| 26 to 34 Years | 67 (94.4%) | 4 (5.6%) |
| 35 to 44 Years | 98 (95.2%) | 5 (4.9%) |
| 45 to 54 Years | 53 (88.3%) | 7 (11.7%) |
| 55 to 64 Years | 98 (94.2%) | 6 (5.8%) |
| 65 to 74 Years | 79 (91.9%) | 7 (8.1%) |
| 75 Years and older | 96 (100.0%) | 0 (0.0%) |
| Total | 665 (92.0%) | 58 (8.0%) |
Health Insurance Coverage by Citizenship Status in Hillcrest
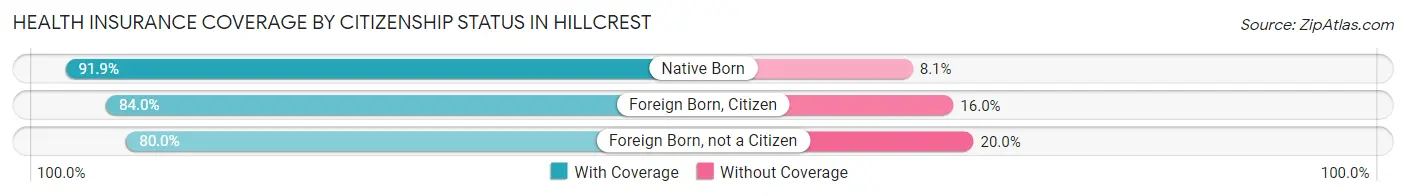
| Citizenship Status | With Coverage | Without Coverage |
| Native Born | 57 (91.9%) | 5 (8.1%) |
| Foreign Born, Citizen | 89 (84.0%) | 17 (16.0%) |
| Foreign Born, not a Citizen | 28 (80.0%) | 7 (20.0%) |
Health Insurance Coverage by Household Income in Hillcrest
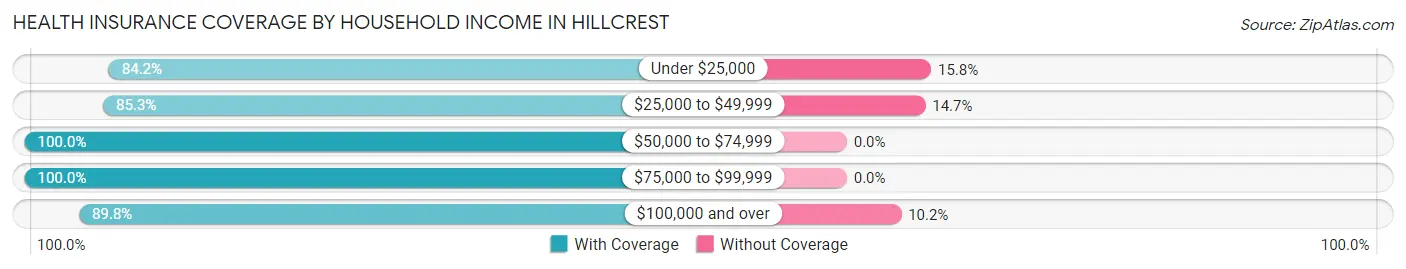
| Household Income | With Coverage | Without Coverage |
| Under $25,000 | 48 (84.2%) | 9 (15.8%) |
| $25,000 to $49,999 | 29 (85.3%) | 5 (14.7%) |
| $50,000 to $74,999 | 64 (100.0%) | 0 (0.0%) |
| $75,000 to $99,999 | 136 (100.0%) | 0 (0.0%) |
| $100,000 and over | 388 (89.8%) | 44 (10.2%) |
Public vs Private Health Insurance Coverage by Age in Hillcrest
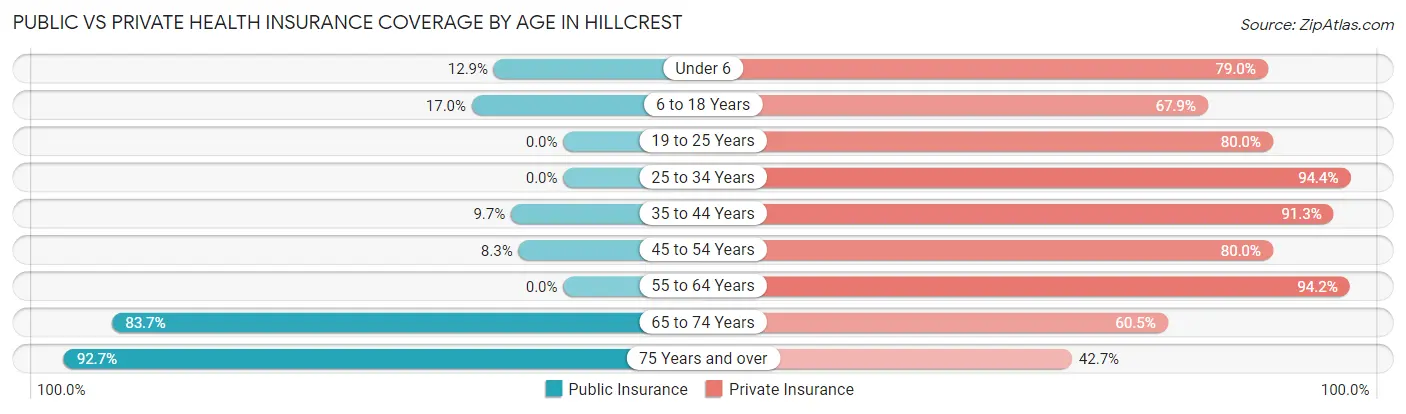
| Age Bracket | Public Insurance | Private Insurance |
| Under 6 | 8 (12.9%) | 49 (79.0%) |
| 6 to 18 Years | 18 (17.0%) | 72 (67.9%) |
| 19 to 25 Years | 0 (0.0%) | 28 (80.0%) |
| 25 to 34 Years | 0 (0.0%) | 67 (94.4%) |
| 35 to 44 Years | 10 (9.7%) | 94 (91.3%) |
| 45 to 54 Years | 5 (8.3%) | 48 (80.0%) |
| 55 to 64 Years | 0 (0.0%) | 98 (94.2%) |
| 65 to 74 Years | 72 (83.7%) | 52 (60.5%) |
| 75 Years and over | 89 (92.7%) | 41 (42.7%) |
| Total | 202 (27.9%) | 549 (75.9%) |
Disability Status by Sex by Age in Hillcrest
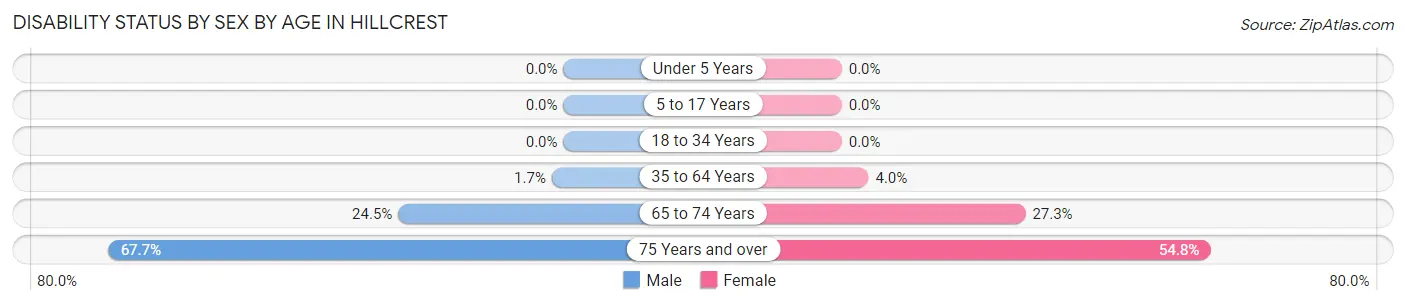
| Age Bracket | Male | Female |
| Under 5 Years | 0 (0.0%) | 0 (0.0%) |
| 5 to 17 Years | 0 (0.0%) | 0 (0.0%) |
| 18 to 34 Years | 0 (0.0%) | 0 (0.0%) |
| 35 to 64 Years | 2 (1.7%) | 6 (4.0%) |
| 65 to 74 Years | 13 (24.5%) | 9 (27.3%) |
| 75 Years and over | 23 (67.6%) | 34 (54.8%) |
Disability Class by Sex by Age in Hillcrest
Disability Class: Hearing Difficulty
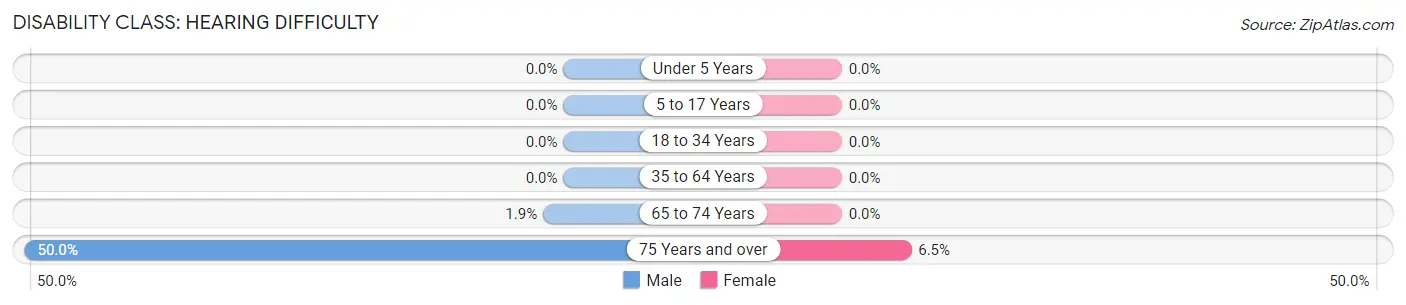
| Age Bracket | Male | Female |
| Under 5 Years | 0 (0.0%) | 0 (0.0%) |
| 5 to 17 Years | 0 (0.0%) | 0 (0.0%) |
| 18 to 34 Years | 0 (0.0%) | 0 (0.0%) |
| 35 to 64 Years | 0 (0.0%) | 0 (0.0%) |
| 65 to 74 Years | 1 (1.9%) | 0 (0.0%) |
| 75 Years and over | 17 (50.0%) | 4 (6.5%) |
Disability Class: Vision Difficulty
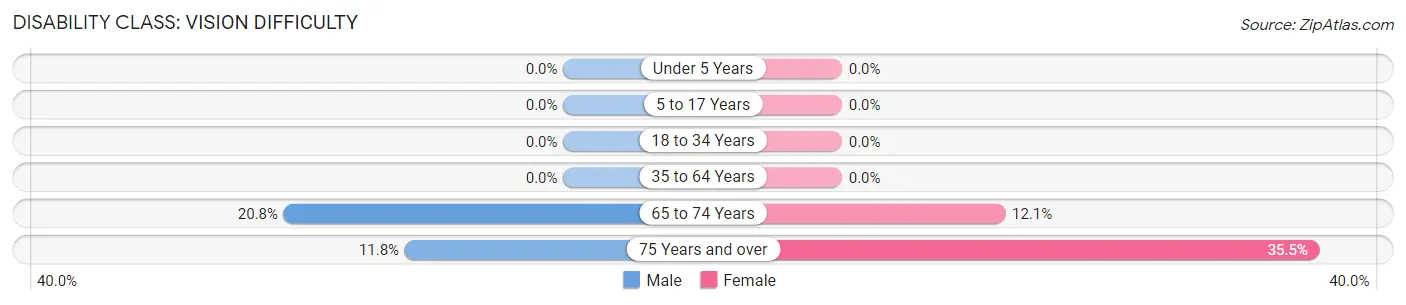
| Age Bracket | Male | Female |
| Under 5 Years | 0 (0.0%) | 0 (0.0%) |
| 5 to 17 Years | 0 (0.0%) | 0 (0.0%) |
| 18 to 34 Years | 0 (0.0%) | 0 (0.0%) |
| 35 to 64 Years | 0 (0.0%) | 0 (0.0%) |
| 65 to 74 Years | 11 (20.7%) | 4 (12.1%) |
| 75 Years and over | 4 (11.8%) | 22 (35.5%) |
Disability Class: Cognitive Difficulty
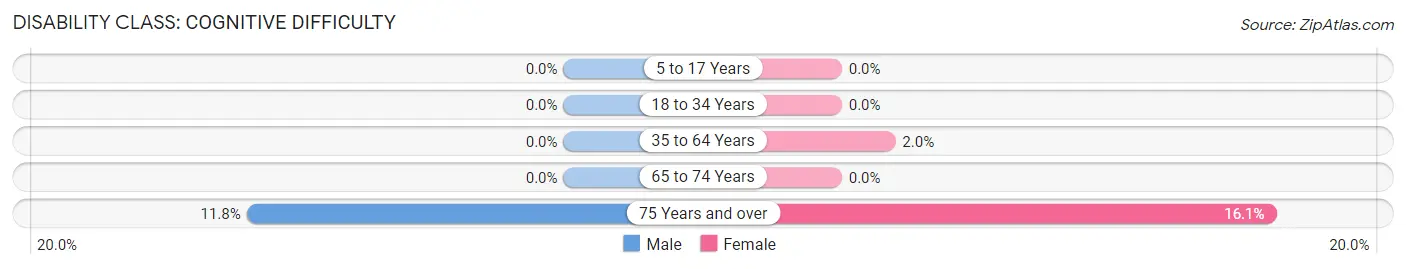
| Age Bracket | Male | Female |
| 5 to 17 Years | 0 (0.0%) | 0 (0.0%) |
| 18 to 34 Years | 0 (0.0%) | 0 (0.0%) |
| 35 to 64 Years | 0 (0.0%) | 3 (2.0%) |
| 65 to 74 Years | 0 (0.0%) | 0 (0.0%) |
| 75 Years and over | 4 (11.8%) | 10 (16.1%) |
Disability Class: Ambulatory Difficulty
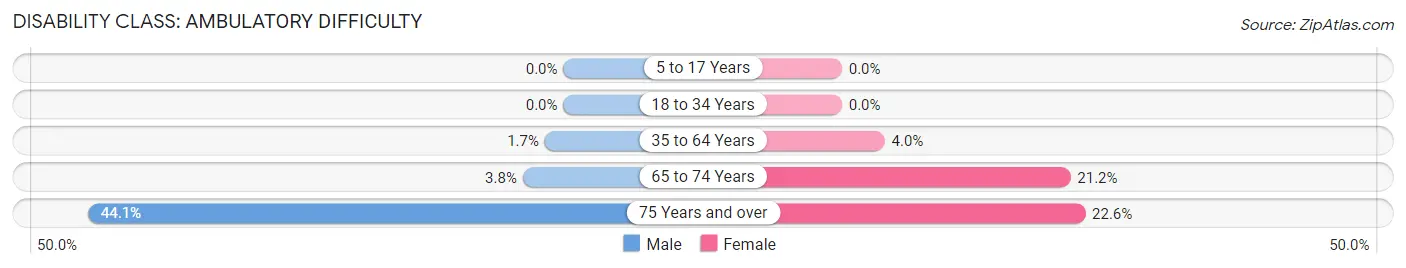
| Age Bracket | Male | Female |
| 5 to 17 Years | 0 (0.0%) | 0 (0.0%) |
| 18 to 34 Years | 0 (0.0%) | 0 (0.0%) |
| 35 to 64 Years | 2 (1.7%) | 6 (4.0%) |
| 65 to 74 Years | 2 (3.8%) | 7 (21.2%) |
| 75 Years and over | 15 (44.1%) | 14 (22.6%) |
Disability Class: Self-Care Difficulty
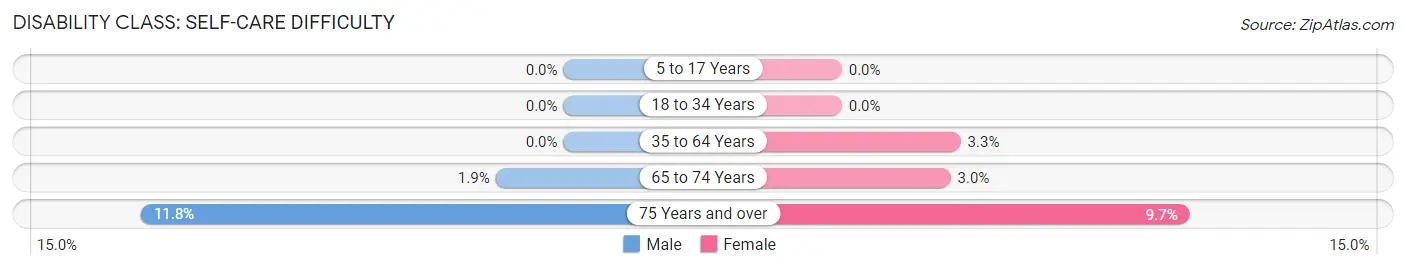
| Age Bracket | Male | Female |
| 5 to 17 Years | 0 (0.0%) | 0 (0.0%) |
| 18 to 34 Years | 0 (0.0%) | 0 (0.0%) |
| 35 to 64 Years | 0 (0.0%) | 5 (3.3%) |
| 65 to 74 Years | 1 (1.9%) | 1 (3.0%) |
| 75 Years and over | 4 (11.8%) | 6 (9.7%) |
Technology Access in Hillcrest
Computing Device Access in Hillcrest
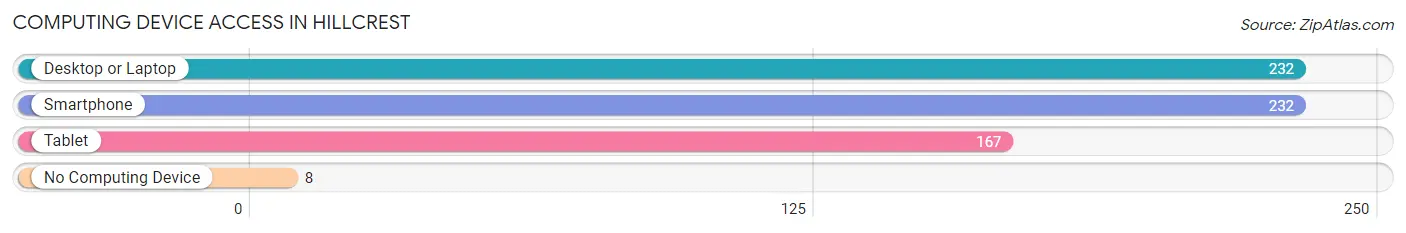
| Device Type | # Households | % Households |
| Desktop or Laptop | 232 | 88.2% |
| Smartphone | 232 | 88.2% |
| Tablet | 167 | 63.5% |
| No Computing Device | 8 | 3.0% |
| Total | 263 | 100.0% |
Internet Access in Hillcrest
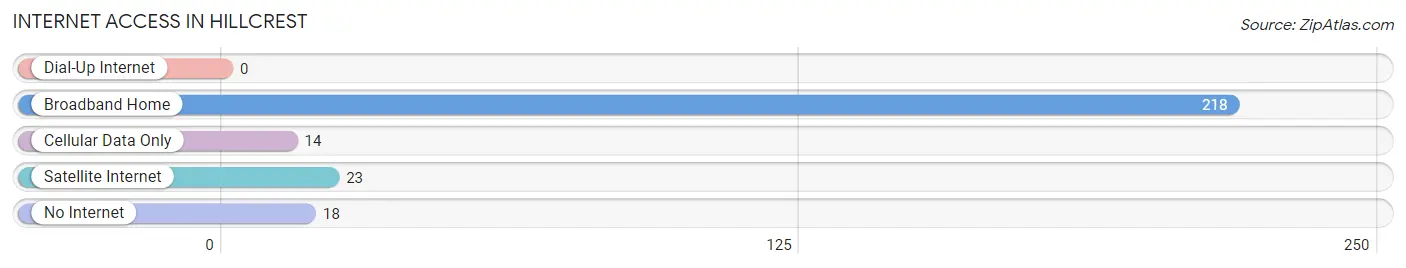
| Internet Type | # Households | % Households |
| Dial-Up Internet | 0 | 0.0% |
| Broadband Home | 218 | 82.9% |
| Cellular Data Only | 14 | 5.3% |
| Satellite Internet | 23 | 8.7% |
| No Internet | 18 | 6.8% |
| Total | 263 | 100.0% |
Hillcrest Summary
Hillcrest, Texas is a small town located in the southeastern corner of Texas, in the county of Nueces. It is situated on the Gulf Coast, approximately 30 miles south of Corpus Christi. The town has a population of just over 1,000 people, and is known for its small-town charm and friendly atmosphere.
History
The area that is now Hillcrest was first settled in the late 1800s by a group of German immigrants. The town was originally called “New Berlin”, and was founded in 1891. The town was renamed Hillcrest in 1895, after the nearby hill that overlooked the town.
In the early 1900s, Hillcrest was a thriving agricultural community, with cotton, corn, and other crops being grown in the area. The town also had a number of businesses, including a general store, a blacksmith, and a hotel.
In the 1920s, the town began to decline, as many of the residents moved away to larger cities. The Great Depression of the 1930s further exacerbated the decline, and by the 1940s, the town was nearly abandoned.
In the 1950s, the town began to experience a resurgence, as new businesses and residents moved into the area. The town was incorporated in 1959, and has since grown to its current population of just over 1,000 people.
Geography
Hillcrest is located in the southeastern corner of Texas, in the county of Nueces. It is situated on the Gulf Coast, approximately 30 miles south of Corpus Christi. The town is located on the banks of the Nueces River, and is surrounded by rolling hills and farmland.
The climate in Hillcrest is generally warm and humid, with temperatures ranging from the mid-60s in the winter to the mid-90s in the summer. The town receives an average of 40 inches of rain per year, and is prone to occasional flooding.
Economy
The economy of Hillcrest is largely based on agriculture and tourism. The town is home to a number of farms, which produce cotton, corn, and other crops. The town also has a number of small businesses, including restaurants, shops, and a hotel.
Tourism is an important part of the local economy, as the town is a popular destination for visitors from nearby cities. The town is home to a number of attractions, including a historic downtown area, a museum, and a number of parks and outdoor recreation areas.
Demographics
As of the 2010 census, the population of Hillcrest was 1,072. The town is predominantly white, with a small Hispanic population. The median household income is $37,000, and the median home value is $90,000.
The town is served by the Nueces County School District, which includes two elementary schools, a middle school, and a high school. The town also has a number of churches, including Baptist, Methodist, and Catholic.
Conclusion
Hillcrest, Texas is a small town located in the southeastern corner of Texas, in the county of Nueces. It is situated on the Gulf Coast, approximately 30 miles south of Corpus Christi. The town has a population of just over 1,000 people, and is known for its small-town charm and friendly atmosphere. The economy of Hillcrest is largely based on agriculture and tourism, and the town is home to a number of attractions, including a historic downtown area, a museum, and a number of parks and outdoor recreation areas. The town is predominantly white, with a small Hispanic population, and is served by the Nueces County School District.
Common Questions
What is Per Capita Income in Hillcrest?
Per Capita income in Hillcrest is $44,356.
What is the Median Family Income in Hillcrest?
Median Family Income in Hillcrest is $126,786.
What is the Median Household income in Hillcrest?
Median Household Income in Hillcrest is $119,688.
What is Income or Wage Gap in Hillcrest?
Income or Wage Gap in Hillcrest is 60.8%.
Women in Hillcrest earn 39.2 cents for every dollar earned by a man.
What is Inequality or Gini Index in Hillcrest?
Inequality or Gini Index in Hillcrest is 0.36.
What is the Total Population of Hillcrest?
Total Population of Hillcrest is 727.
What is the Total Male Population of Hillcrest?
Total Male Population of Hillcrest is 322.
What is the Total Female Population of Hillcrest?
Total Female Population of Hillcrest is 405.
What is the Ratio of Males per 100 Females in Hillcrest?
There are 79.51 Males per 100 Females in Hillcrest.
What is the Ratio of Females per 100 Males in Hillcrest?
There are 125.78 Females per 100 Males in Hillcrest.
What is the Median Population Age in Hillcrest?
Median Population Age in Hillcrest is 42.2 Years.
What is the Average Family Size in Hillcrest
Average Family Size in Hillcrest is 3.1 People.
What is the Average Household Size in Hillcrest
Average Household Size in Hillcrest is 2.8 People.
How Large is the Labor Force in Hillcrest?
There are 350 People in the Labor Forcein in Hillcrest.
What is the Percentage of People in the Labor Force in Hillcrest?
60.2% of People are in the Labor Force in Hillcrest.
What is the Unemployment Rate in Hillcrest?
Unemployment Rate in Hillcrest is 2.0%.