Zip Codes with the Highest Percentage of Population Employed in Architecture & Engineering in Corsicana, TX
RELATED REPORTS & OPTIONS
Architecture & Engineering
Corsicana
Compare Zip Codes
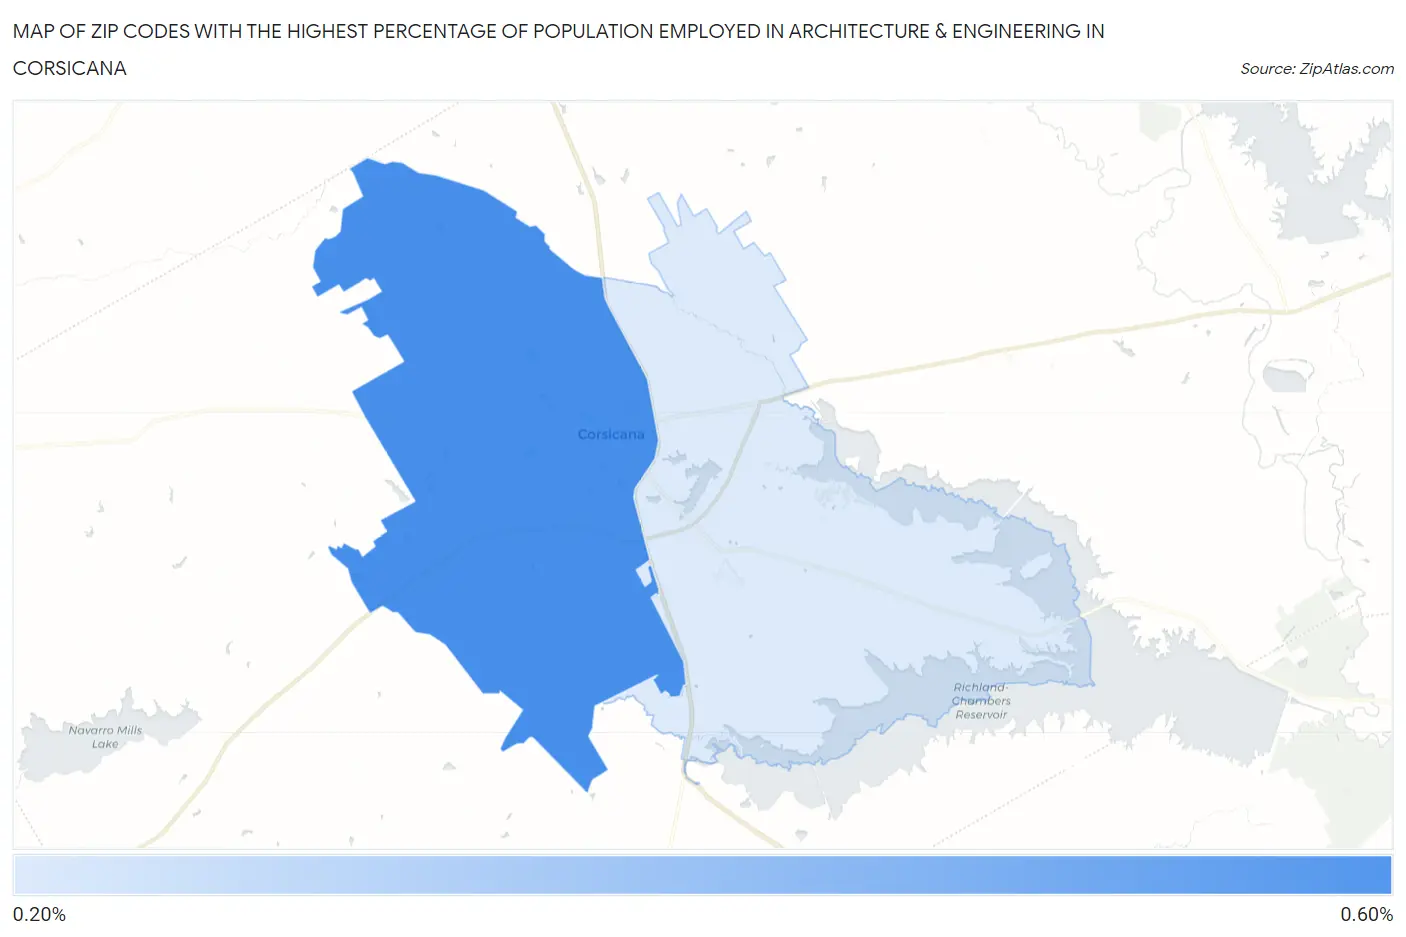
Map of Zip Codes with the Highest Percentage of Population Employed in Architecture & Engineering in Corsicana
0.21%
0.57%
Zip Codes with the Highest Percentage of Population Employed in Architecture & Engineering in Corsicana, TX
| Zip Code | % Employed | vs State | vs National | |
| 1. | 75110 | 0.57% | 2.2%(-1.65)#1,098 | 2.1%(-1.58)#19,814 |
| 2. | 75109 | 0.21% | 2.2%(-2.01)#1,257 | 2.1%(-1.94)#21,993 |
1
Common Questions
What are the Top Zip Codes with the Highest Percentage of Population Employed in Architecture & Engineering in Corsicana, TX?
Top Zip Codes with the Highest Percentage of Population Employed in Architecture & Engineering in Corsicana, TX are:
What zip code has the Highest Percentage of Population Employed in Architecture & Engineering in Corsicana, TX?
75110 has the Highest Percentage of Population Employed in Architecture & Engineering in Corsicana, TX with 0.57%.
What is the Percentage of Population Employed in Architecture & Engineering in Corsicana, TX?
Percentage of Population Employed in Architecture & Engineering in Corsicana is 0.68%.
What is the Percentage of Population Employed in Architecture & Engineering in Texas?
Percentage of Population Employed in Architecture & Engineering in Texas is 2.2%.
What is the Percentage of Population Employed in Architecture & Engineering in the United States?
Percentage of Population Employed in Architecture & Engineering in the United States is 2.1%.