Zip Codes with the Highest Percentage of Population Employed in Architecture & Engineering in El Paso, TX
RELATED REPORTS & OPTIONS
Architecture & Engineering
El Paso
Compare Zip Codes
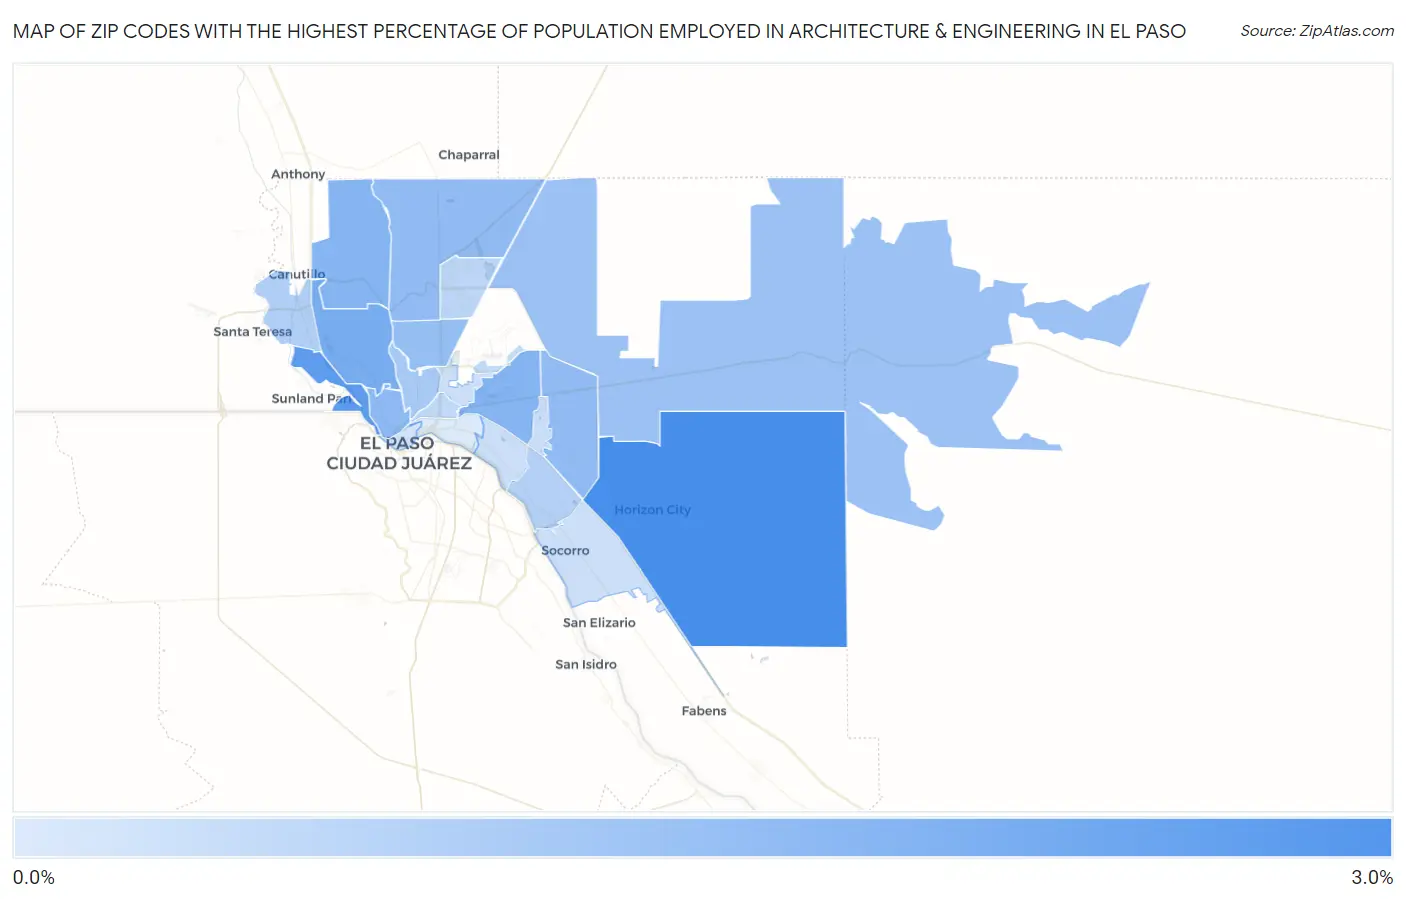
Map of Zip Codes with the Highest Percentage of Population Employed in Architecture & Engineering in El Paso
0.18%
2.8%
Zip Codes with the Highest Percentage of Population Employed in Architecture & Engineering in El Paso, TX
| Zip Code | % Employed | vs State | vs National | |
| 1. | 79928 | 2.8% | 2.2%(+0.539)#331 | 2.1%(+0.612)#5,921 |
| 2. | 79922 | 2.4% | 2.2%(+0.151)#417 | 2.1%(+0.224)#7,608 |
| 3. | 79912 | 1.9% | 2.2%(-0.294)#550 | 2.1%(-0.222)#10,056 |
| 4. | 79925 | 1.7% | 2.2%(-0.523)#626 | 2.1%(-0.451)#11,499 |
| 5. | 79911 | 1.7% | 2.2%(-0.534)#633 | 2.1%(-0.462)#11,593 |
| 6. | 79902 | 1.5% | 2.2%(-0.703)#699 | 2.1%(-0.630)#12,740 |
| 7. | 79936 | 1.5% | 2.2%(-0.755)#719 | 2.1%(-0.682)#13,111 |
| 8. | 79934 | 1.5% | 2.2%(-0.756)#722 | 2.1%(-0.683)#13,121 |
| 9. | 79904 | 1.4% | 2.2%(-0.808)#740 | 2.1%(-0.735)#13,486 |
| 10. | 79938 | 1.3% | 2.2%(-0.930)#780 | 2.1%(-0.857)#14,357 |
| 11. | 79930 | 1.1% | 2.2%(-1.14)#856 | 2.1%(-1.06)#15,992 |
| 12. | 79932 | 0.95% | 2.2%(-1.28)#922 | 2.1%(-1.20)#17,003 |
| 13. | 79907 | 0.90% | 2.2%(-1.32)#937 | 2.1%(-1.25)#17,338 |
| 14. | 79924 | 0.73% | 2.2%(-1.50)#1,017 | 2.1%(-1.42)#18,716 |
| 15. | 79903 | 0.68% | 2.2%(-1.54)#1,046 | 2.1%(-1.47)#19,029 |
| 16. | 79908 | 0.60% | 2.2%(-1.62)#1,088 | 2.1%(-1.55)#19,602 |
| 17. | 79935 | 0.52% | 2.2%(-1.71)#1,119 | 2.1%(-1.63)#20,167 |
| 18. | 79915 | 0.47% | 2.2%(-1.75)#1,136 | 2.1%(-1.68)#20,450 |
| 19. | 79906 | 0.47% | 2.2%(-1.75)#1,138 | 2.1%(-1.68)#20,479 |
| 20. | 79927 | 0.46% | 2.2%(-1.76)#1,142 | 2.1%(-1.69)#20,531 |
| 21. | 79901 | 0.36% | 2.2%(-1.86)#1,204 | 2.1%(-1.79)#21,244 |
| 22. | 79905 | 0.18% | 2.2%(-2.04)#1,263 | 2.1%(-1.97)#22,122 |
1
Common Questions
What are the Top 10 Zip Codes with the Highest Percentage of Population Employed in Architecture & Engineering in El Paso, TX?
Top 10 Zip Codes with the Highest Percentage of Population Employed in Architecture & Engineering in El Paso, TX are:
What zip code has the Highest Percentage of Population Employed in Architecture & Engineering in El Paso, TX?
79928 has the Highest Percentage of Population Employed in Architecture & Engineering in El Paso, TX with 2.8%.
What is the Percentage of Population Employed in Architecture & Engineering in El Paso, TX?
Percentage of Population Employed in Architecture & Engineering in El Paso is 1.4%.
What is the Percentage of Population Employed in Architecture & Engineering in Texas?
Percentage of Population Employed in Architecture & Engineering in Texas is 2.2%.
What is the Percentage of Population Employed in Architecture & Engineering in the United States?
Percentage of Population Employed in Architecture & Engineering in the United States is 2.1%.