Zip Codes with the Highest Percentage of Population Employed in Architecture & Engineering in Keller, TX
RELATED REPORTS & OPTIONS
Architecture & Engineering
Keller
Compare Zip Codes
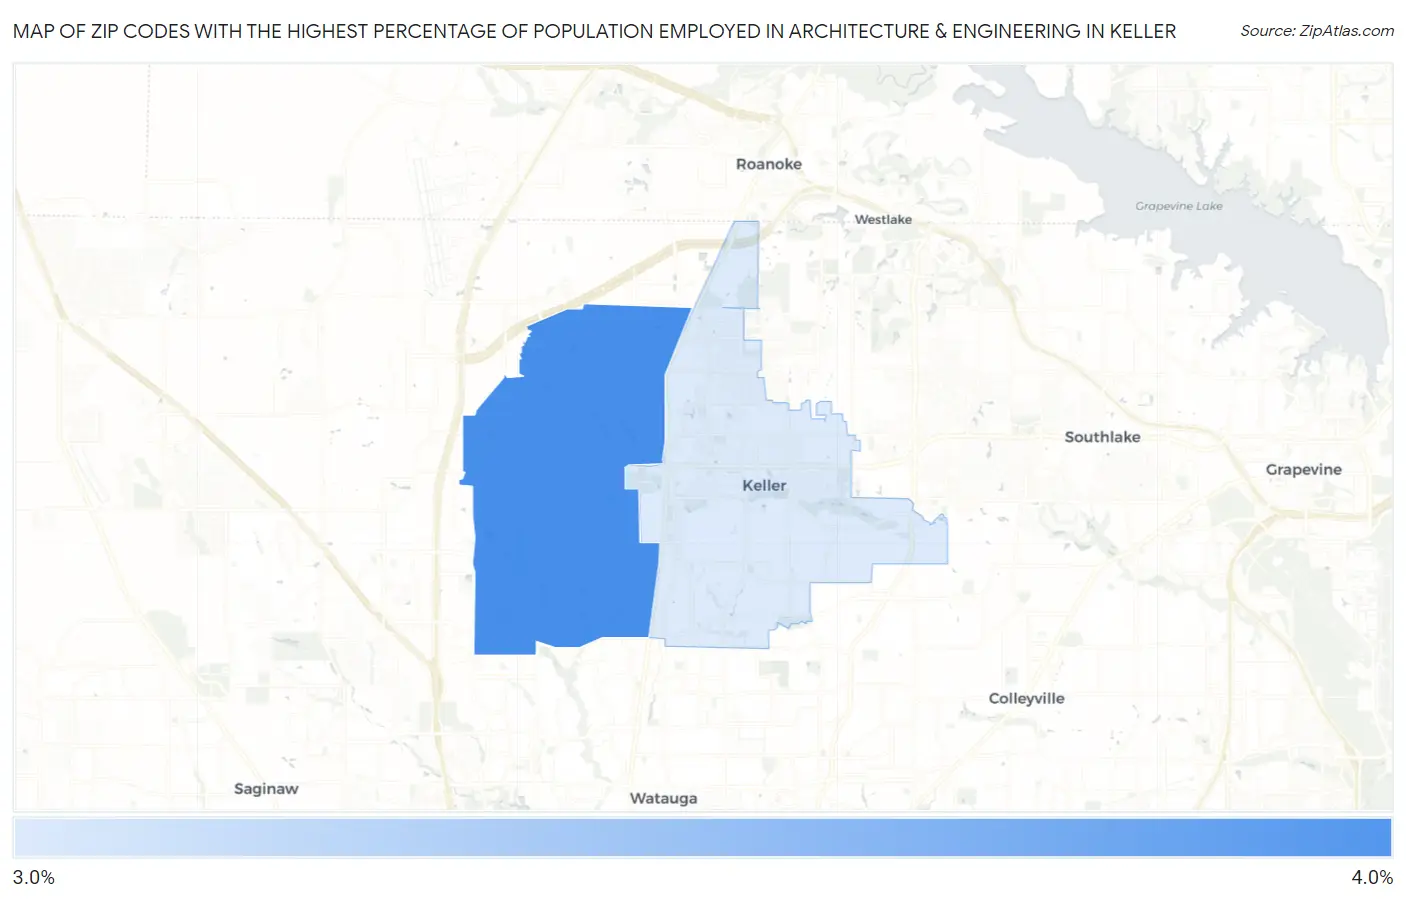
Map of Zip Codes with the Highest Percentage of Population Employed in Architecture & Engineering in Keller
3.5%
3.6%
Zip Codes with the Highest Percentage of Population Employed in Architecture & Engineering in Keller, TX
| Zip Code | % Employed | vs State | vs National | |
| 1. | 76244 | 3.6% | 2.2%(+1.39)#197 | 2.1%(+1.46)#3,482 |
| 2. | 76248 | 3.5% | 2.2%(+1.26)#220 | 2.1%(+1.34)#3,770 |
1
Common Questions
What are the Top Zip Codes with the Highest Percentage of Population Employed in Architecture & Engineering in Keller, TX?
Top Zip Codes with the Highest Percentage of Population Employed in Architecture & Engineering in Keller, TX are:
What zip code has the Highest Percentage of Population Employed in Architecture & Engineering in Keller, TX?
76244 has the Highest Percentage of Population Employed in Architecture & Engineering in Keller, TX with 3.6%.
What is the Percentage of Population Employed in Architecture & Engineering in Keller, TX?
Percentage of Population Employed in Architecture & Engineering in Keller is 3.2%.
What is the Percentage of Population Employed in Architecture & Engineering in Texas?
Percentage of Population Employed in Architecture & Engineering in Texas is 2.2%.
What is the Percentage of Population Employed in Architecture & Engineering in the United States?
Percentage of Population Employed in Architecture & Engineering in the United States is 2.1%.