Zip Codes with the Highest Percentage of Population Employed in Architecture & Engineering in Terrell, TX
RELATED REPORTS & OPTIONS
Architecture & Engineering
Terrell
Compare Zip Codes
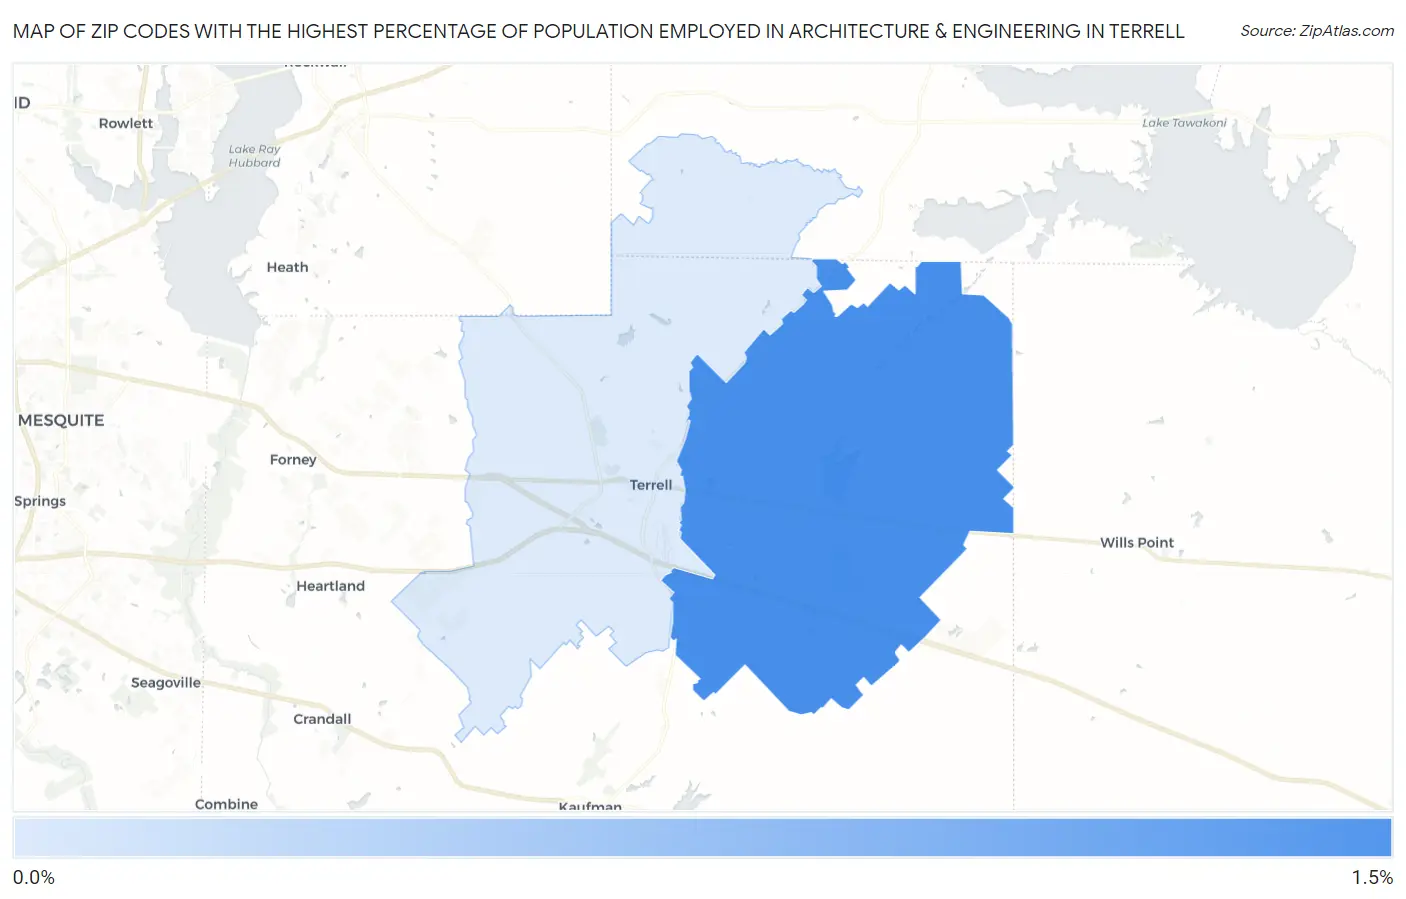
Map of Zip Codes with the Highest Percentage of Population Employed in Architecture & Engineering in Terrell
0.39%
1.0%
Zip Codes with the Highest Percentage of Population Employed in Architecture & Engineering in Terrell, TX
| Zip Code | % Employed | vs State | vs National | |
| 1. | 75161 | 1.0% | 2.2%(-1.21)#890 | 2.1%(-1.13)#16,495 |
| 2. | 75160 | 0.39% | 2.2%(-1.83)#1,184 | 2.1%(-1.76)#21,007 |
1
Common Questions
What are the Top Zip Codes with the Highest Percentage of Population Employed in Architecture & Engineering in Terrell, TX?
Top Zip Codes with the Highest Percentage of Population Employed in Architecture & Engineering in Terrell, TX are:
What zip code has the Highest Percentage of Population Employed in Architecture & Engineering in Terrell, TX?
75161 has the Highest Percentage of Population Employed in Architecture & Engineering in Terrell, TX with 1.0%.
What is the Percentage of Population Employed in Architecture & Engineering in Terrell, TX?
Percentage of Population Employed in Architecture & Engineering in Terrell is 0.40%.
What is the Percentage of Population Employed in Architecture & Engineering in Texas?
Percentage of Population Employed in Architecture & Engineering in Texas is 2.2%.
What is the Percentage of Population Employed in Architecture & Engineering in the United States?
Percentage of Population Employed in Architecture & Engineering in the United States is 2.1%.