Alamo Heights, TX Map & Demographics
Alamo Heights Map
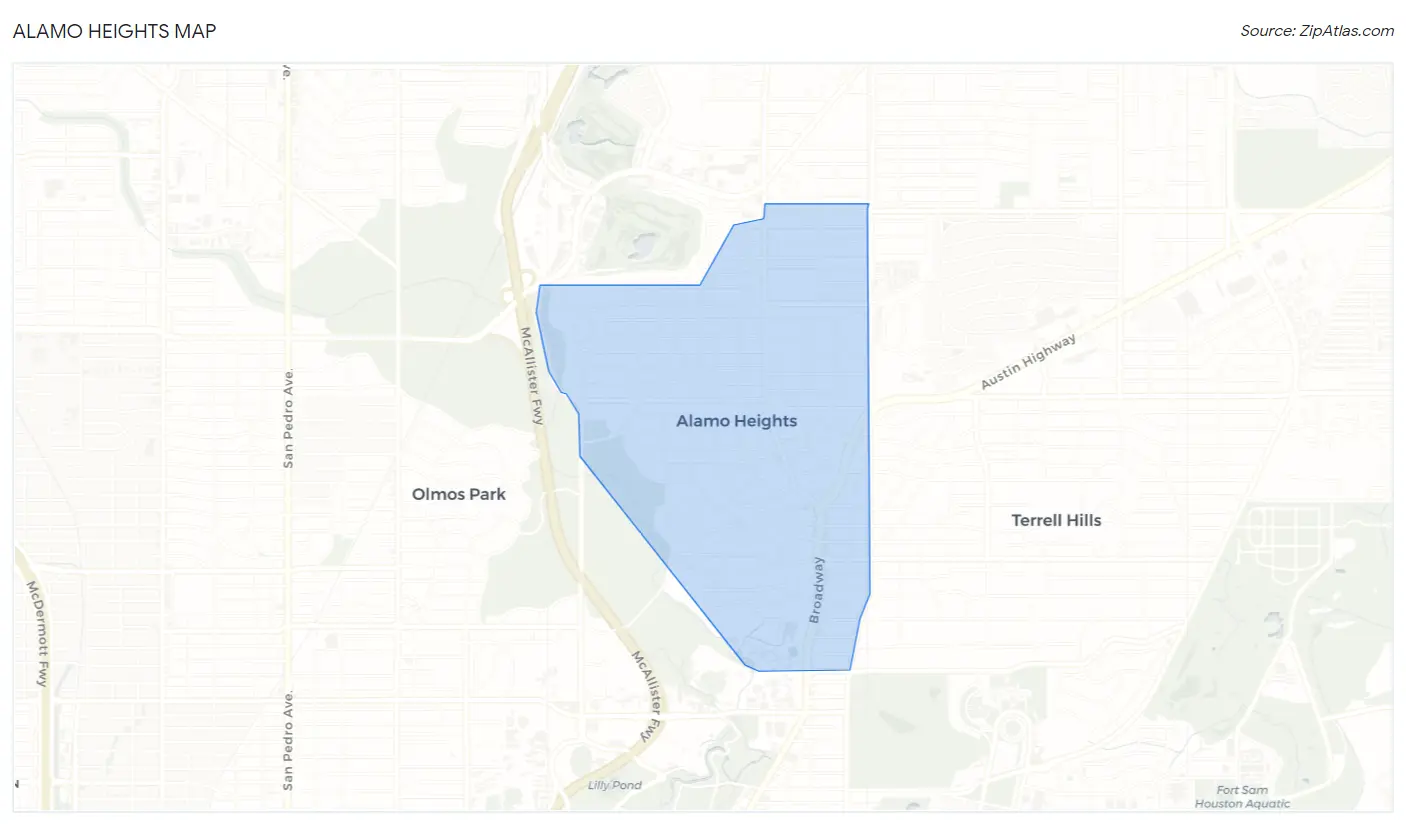
Alamo Heights Overview
$105,887
PER CAPITA INCOME
$234,839
AVG FAMILY INCOME
$149,332
AVG HOUSEHOLD INCOME
36.6%
WAGE / INCOME GAP [ % ]
63.4¢/ $1
WAGE / INCOME GAP [ $ ]
0.55
INEQUALITY / GINI INDEX
7,417
TOTAL POPULATION
3,697
MALE POPULATION
3,720
FEMALE POPULATION
99.38
MALES / 100 FEMALES
100.62
FEMALES / 100 MALES
40.7
MEDIAN AGE
3.1
AVG FAMILY SIZE
2.4
AVG HOUSEHOLD SIZE
4,140
LABOR FORCE [ PEOPLE ]
69.6%
PERCENT IN LABOR FORCE
1.1%
UNEMPLOYMENT RATE
Alamo Heights Area Codes
Income in Alamo Heights
Income Overview in Alamo Heights
Per Capita Income in Alamo Heights is $105,887, while median incomes of families and households are $234,839 and $149,332 respectively.
| Characteristic | Number | Measure |
| Per Capita Income | 7,417 | $105,887 |
| Median Family Income | 1,908 | $234,839 |
| Mean Family Income | 1,908 | $344,740 |
| Median Household Income | 3,037 | $149,332 |
| Mean Household Income | 3,037 | $256,262 |
| Income Deficit | 1,908 | $0 |
| Wage / Income Gap (%) | 7,417 | 36.55% |
| Wage / Income Gap ($) | 7,417 | 63.45¢ per $1 |
| Gini / Inequality Index | 7,417 | 0.55 |
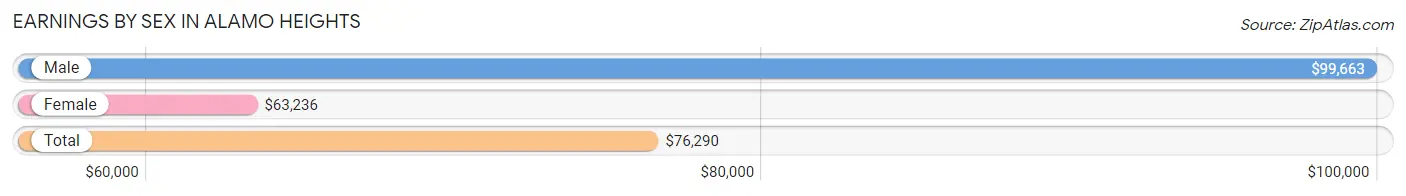
Earnings by Sex in Alamo Heights
Average Earnings in Alamo Heights are $76,290, $99,663 for men and $63,236 for women, a difference of 36.5%.
| Sex | Number | Average Earnings |
| Male | 2,418 (55.9%) | $99,663 |
| Female | 1,908 (44.1%) | $63,236 |
| Total | 4,326 (100.0%) | $76,290 |
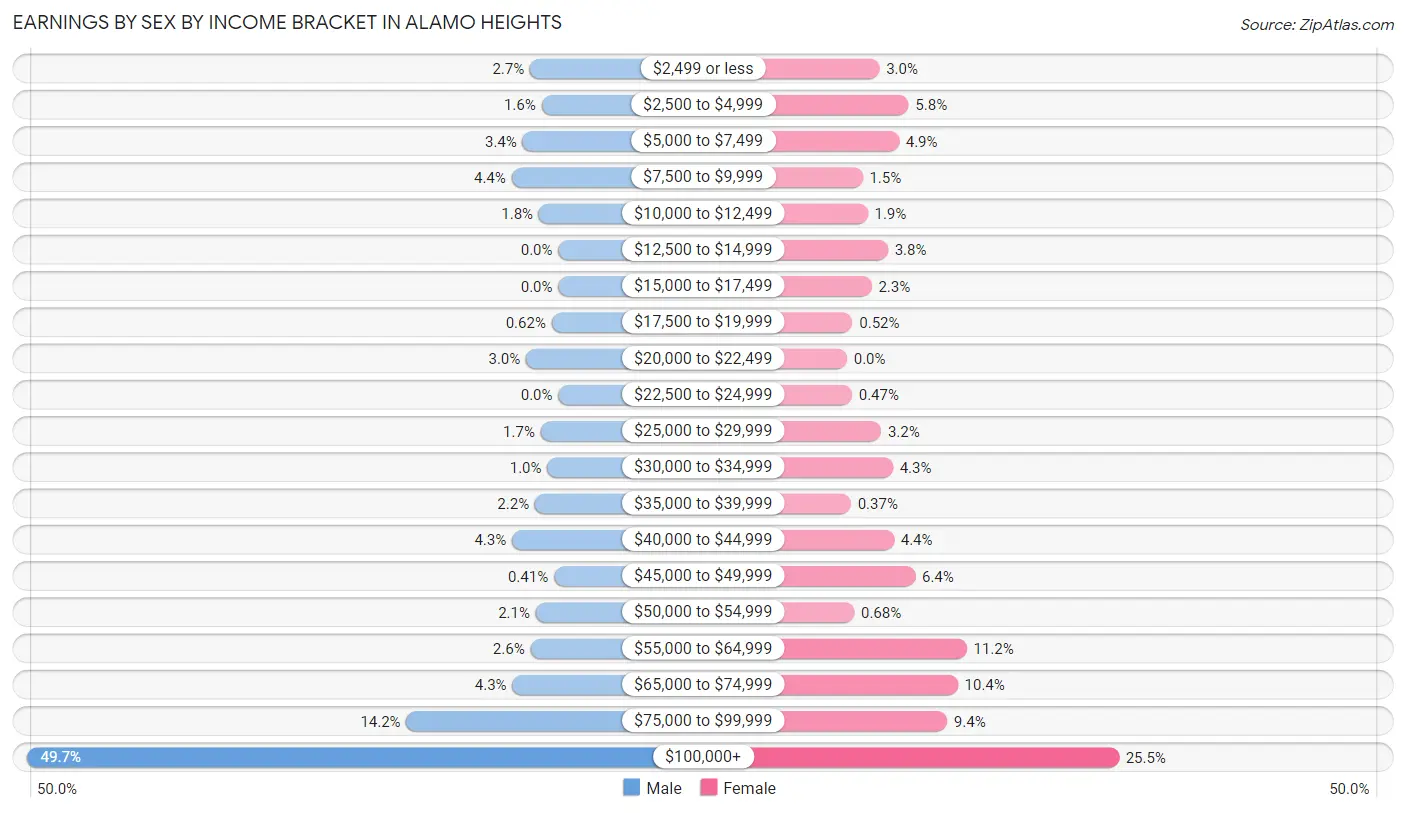
Earnings by Sex by Income Bracket in Alamo Heights
The most common earnings brackets in Alamo Heights are $100,000+ for men (1,202 | 49.7%) and $100,000+ for women (486 | 25.5%).
| Income | Male | Female |
| $2,499 or less | 64 (2.6%) | 58 (3.0%) |
| $2,500 to $4,999 | 38 (1.6%) | 110 (5.8%) |
| $5,000 to $7,499 | 81 (3.4%) | 93 (4.9%) |
| $7,500 to $9,999 | 106 (4.4%) | 28 (1.5%) |
| $10,000 to $12,499 | 44 (1.8%) | 37 (1.9%) |
| $12,500 to $14,999 | 0 (0.0%) | 73 (3.8%) |
| $15,000 to $17,499 | 0 (0.0%) | 44 (2.3%) |
| $17,500 to $19,999 | 15 (0.6%) | 10 (0.5%) |
| $20,000 to $22,499 | 73 (3.0%) | 0 (0.0%) |
| $22,500 to $24,999 | 0 (0.0%) | 9 (0.5%) |
| $25,000 to $29,999 | 40 (1.7%) | 61 (3.2%) |
| $30,000 to $34,999 | 25 (1.0%) | 82 (4.3%) |
| $35,000 to $39,999 | 53 (2.2%) | 7 (0.4%) |
| $40,000 to $44,999 | 105 (4.3%) | 84 (4.4%) |
| $45,000 to $49,999 | 10 (0.4%) | 122 (6.4%) |
| $50,000 to $54,999 | 51 (2.1%) | 13 (0.7%) |
| $55,000 to $64,999 | 63 (2.6%) | 214 (11.2%) |
| $65,000 to $74,999 | 104 (4.3%) | 198 (10.4%) |
| $75,000 to $99,999 | 344 (14.2%) | 179 (9.4%) |
| $100,000+ | 1,202 (49.7%) | 486 (25.5%) |
| Total | 2,418 (100.0%) | 1,908 (100.0%) |
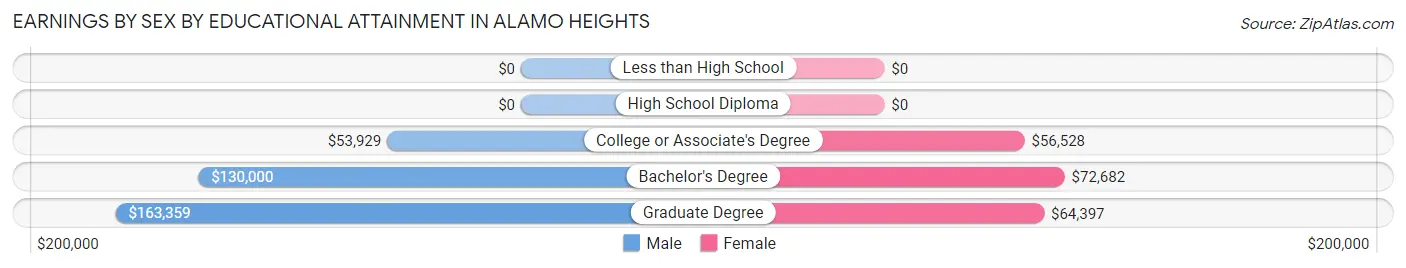
Earnings by Sex by Educational Attainment in Alamo Heights
Average earnings in Alamo Heights are $135,849 for men and $67,984 for women, a difference of 50.0%. Men with an educational attainment of graduate degree enjoy the highest average annual earnings of $163,359, while those with college or associate's degree education earn the least with $53,929. Women with an educational attainment of bachelor's degree earn the most with the average annual earnings of $72,682, while those with college or associate's degree education have the smallest earnings of $56,528.
| Educational Attainment | Male Income | Female Income |
| Less than High School | - | - |
| High School Diploma | - | - |
| College or Associate's Degree | $53,929 | $56,528 |
| Bachelor's Degree | $130,000 | $72,682 |
| Graduate Degree | $163,359 | $64,397 |
| Total | $135,849 | $67,984 |
Family Income in Alamo Heights
Family Income Brackets in Alamo Heights
According to the Alamo Heights family income data, there are 1,168 families falling into the $200,000+ income range, which is the most common income bracket and makes up 61.2% of all families.
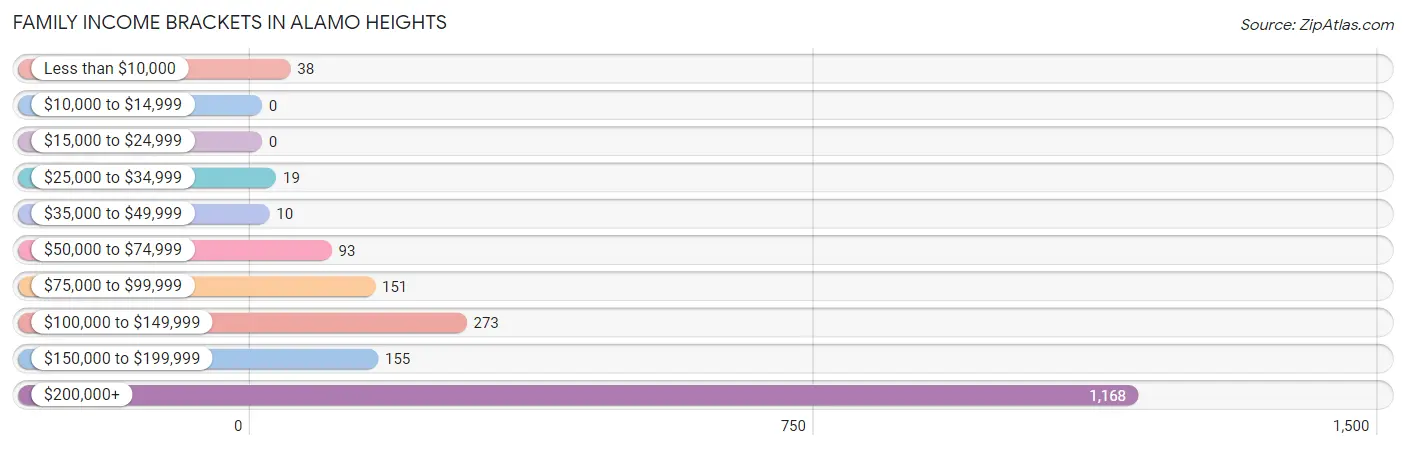
| Income Bracket | # Families | % Families |
| Less than $10,000 | 38 | 2.0% |
| $10,000 to $14,999 | 0 | 0.0% |
| $15,000 to $24,999 | 0 | 0.0% |
| $25,000 to $34,999 | 19 | 1.0% |
| $35,000 to $49,999 | 10 | 0.5% |
| $50,000 to $74,999 | 93 | 4.9% |
| $75,000 to $99,999 | 151 | 7.9% |
| $100,000 to $149,999 | 273 | 14.3% |
| $150,000 to $199,999 | 155 | 8.1% |
| $200,000+ | 1,168 | 61.2% |
Family Income by Famaliy Size in Alamo Heights
3-person families (475 | 24.9%) account for the highest median family income in Alamo Heights with $250,001 per family, while 2-person families (863 | 45.2%) have the highest median income of $100,102 per family member.
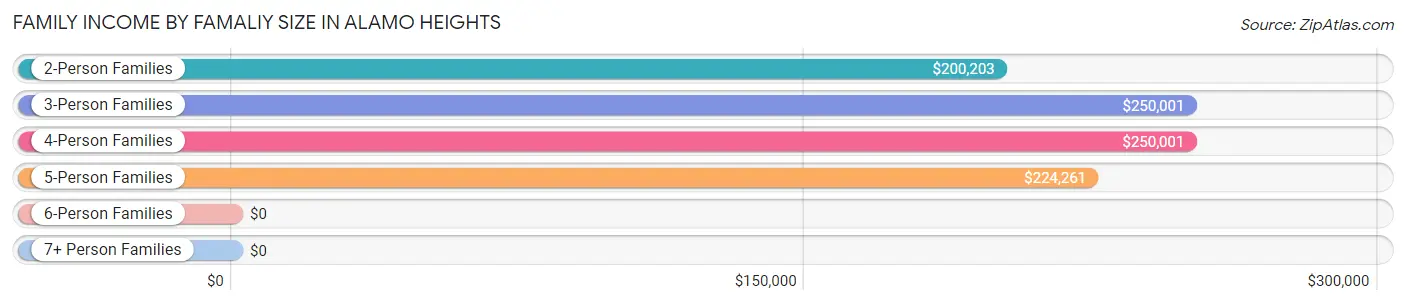
| Income Bracket | # Families | Median Income |
| 2-Person Families | 863 (45.2%) | $200,203 |
| 3-Person Families | 475 (24.9%) | $250,001 |
| 4-Person Families | 502 (26.3%) | $250,001 |
| 5-Person Families | 55 (2.9%) | $224,261 |
| 6-Person Families | 0 (0.0%) | $0 |
| 7+ Person Families | 13 (0.7%) | $0 |
| Total | 1,908 (100.0%) | $234,839 |
Family Income by Number of Earners in Alamo Heights
The median family income in Alamo Heights is $234,839, with families comprising 2 earners (933) having the highest median family income of $250,001, while families with no earners (65) have the lowest median family income of $182,981, accounting for 48.9% and 3.4% of families, respectively.
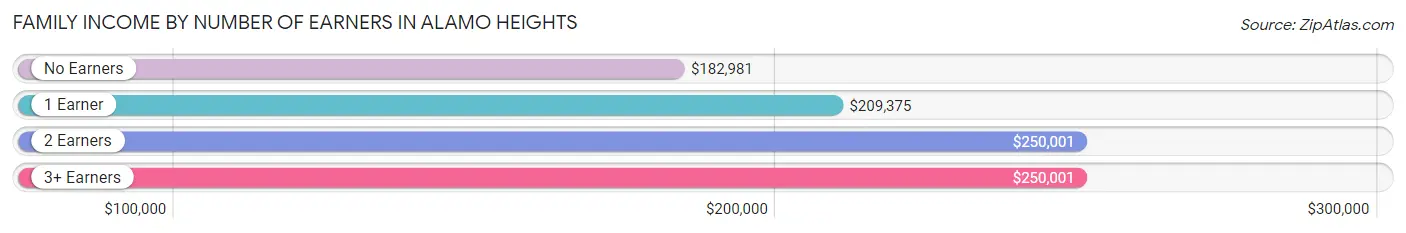
| Number of Earners | # Families | Median Income |
| No Earners | 65 (3.4%) | $182,981 |
| 1 Earner | 698 (36.6%) | $209,375 |
| 2 Earners | 933 (48.9%) | $250,001 |
| 3+ Earners | 212 (11.1%) | $250,001 |
| Total | 1,908 (100.0%) | $234,839 |
Household Income in Alamo Heights
Household Income Brackets in Alamo Heights
With 1,221 households falling in the category, the $200,000+ income range is the most frequent in Alamo Heights, accounting for 40.2% of all households. In contrast, only 12 households (0.4%) fall into the $10,000 to $14,999 income bracket, making it the least populous group.
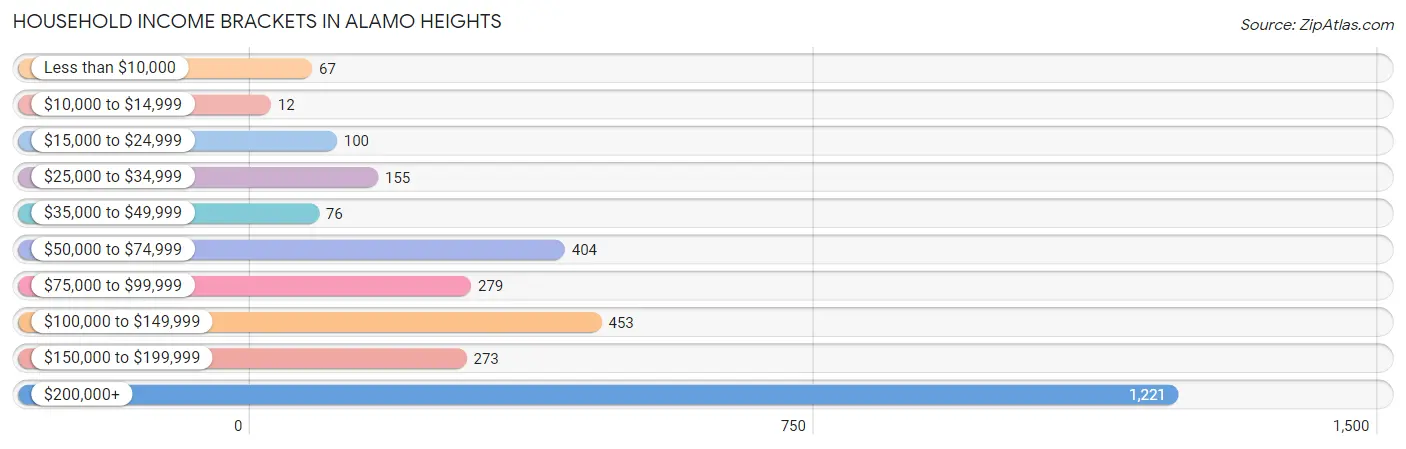
| Income Bracket | # Households | % Households |
| Less than $10,000 | 67 | 2.2% |
| $10,000 to $14,999 | 12 | 0.4% |
| $15,000 to $24,999 | 100 | 3.3% |
| $25,000 to $34,999 | 155 | 5.1% |
| $35,000 to $49,999 | 76 | 2.5% |
| $50,000 to $74,999 | 404 | 13.3% |
| $75,000 to $99,999 | 279 | 9.2% |
| $100,000 to $149,999 | 453 | 14.9% |
| $150,000 to $199,999 | 273 | 9.0% |
| $200,000+ | 1,221 | 40.2% |
Household Income by Householder Age in Alamo Heights
The median household income in Alamo Heights is $149,332, with the highest median household income of $234,879 found in the 45 to 64 years age bracket for the primary householder. A total of 1,120 households (36.9%) fall into this category. Meanwhile, the 15 to 24 years age bracket for the primary householder has the lowest median household income of $76,719, with 71 households (2.3%) in this group.
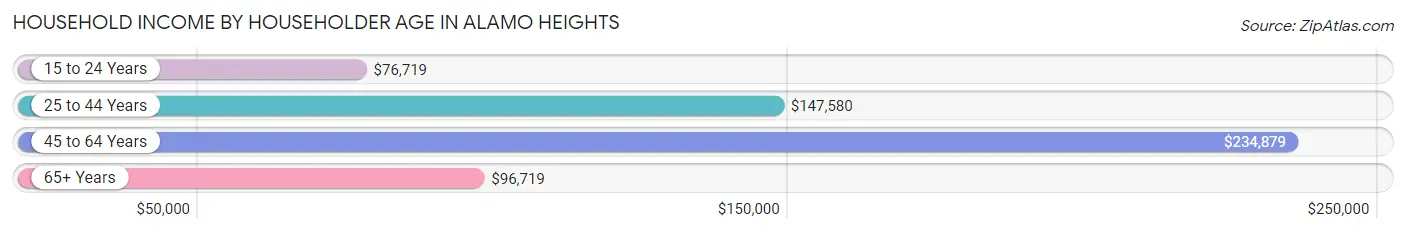
| Income Bracket | # Households | Median Income |
| 15 to 24 Years | 71 (2.3%) | $76,719 |
| 25 to 44 Years | 1,017 (33.5%) | $147,580 |
| 45 to 64 Years | 1,120 (36.9%) | $234,879 |
| 65+ Years | 829 (27.3%) | $96,719 |
| Total | 3,037 (100.0%) | $149,332 |
Poverty in Alamo Heights
Income Below Poverty by Sex and Age in Alamo Heights
With 3.4% poverty level for males and 3.4% for females among the residents of Alamo Heights, 12 to 14 year old males and 25 to 34 year old females are the most vulnerable to poverty, with 40 males (19.4%) and 55 females (13.2%) in their respective age groups living below the poverty level.
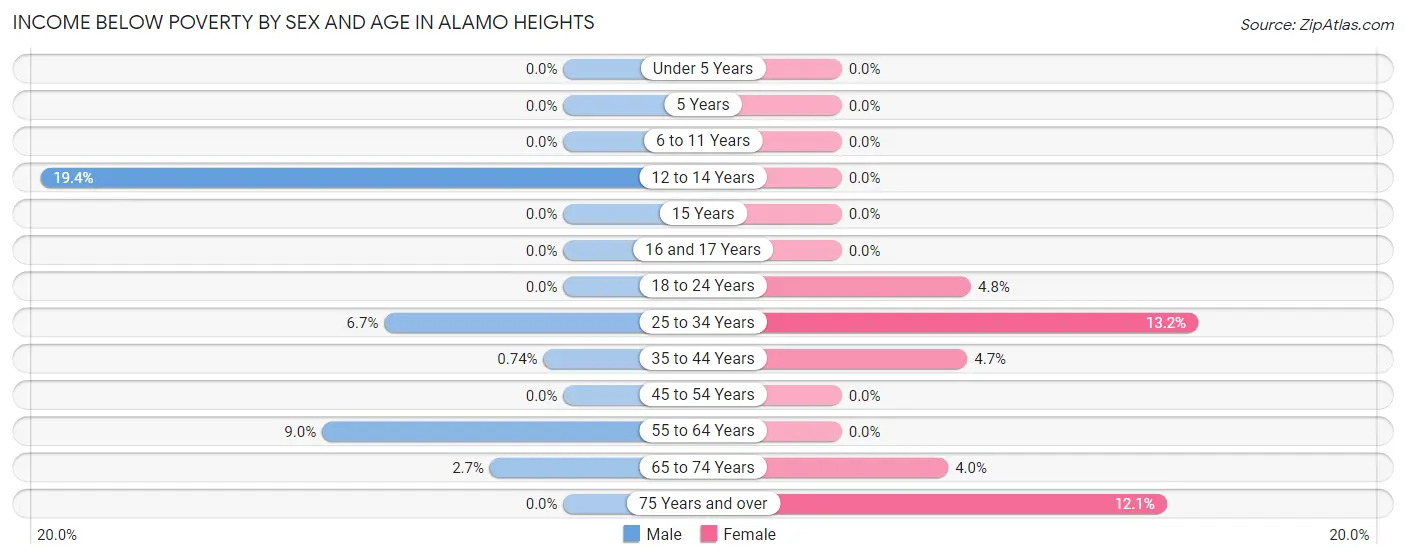
| Age Bracket | Male | Female |
| Under 5 Years | 0 (0.0%) | 0 (0.0%) |
| 5 Years | 0 (0.0%) | 0 (0.0%) |
| 6 to 11 Years | 0 (0.0%) | 0 (0.0%) |
| 12 to 14 Years | 40 (19.4%) | 0 (0.0%) |
| 15 Years | 0 (0.0%) | 0 (0.0%) |
| 16 and 17 Years | 0 (0.0%) | 0 (0.0%) |
| 18 to 24 Years | 0 (0.0%) | 11 (4.8%) |
| 25 to 34 Years | 34 (6.7%) | 55 (13.2%) |
| 35 to 44 Years | 4 (0.7%) | 24 (4.7%) |
| 45 to 54 Years | 0 (0.0%) | 0 (0.0%) |
| 55 to 64 Years | 37 (9.0%) | 0 (0.0%) |
| 65 to 74 Years | 10 (2.7%) | 10 (4.0%) |
| 75 Years and over | 0 (0.0%) | 24 (12.1%) |
| Total | 125 (3.4%) | 124 (3.4%) |
Income Above Poverty by Sex and Age in Alamo Heights
According to the poverty statistics in Alamo Heights, males aged under 5 years and females aged under 5 years are the age groups that are most secure financially, with 100.0% of males and 100.0% of females in these age groups living above the poverty line.
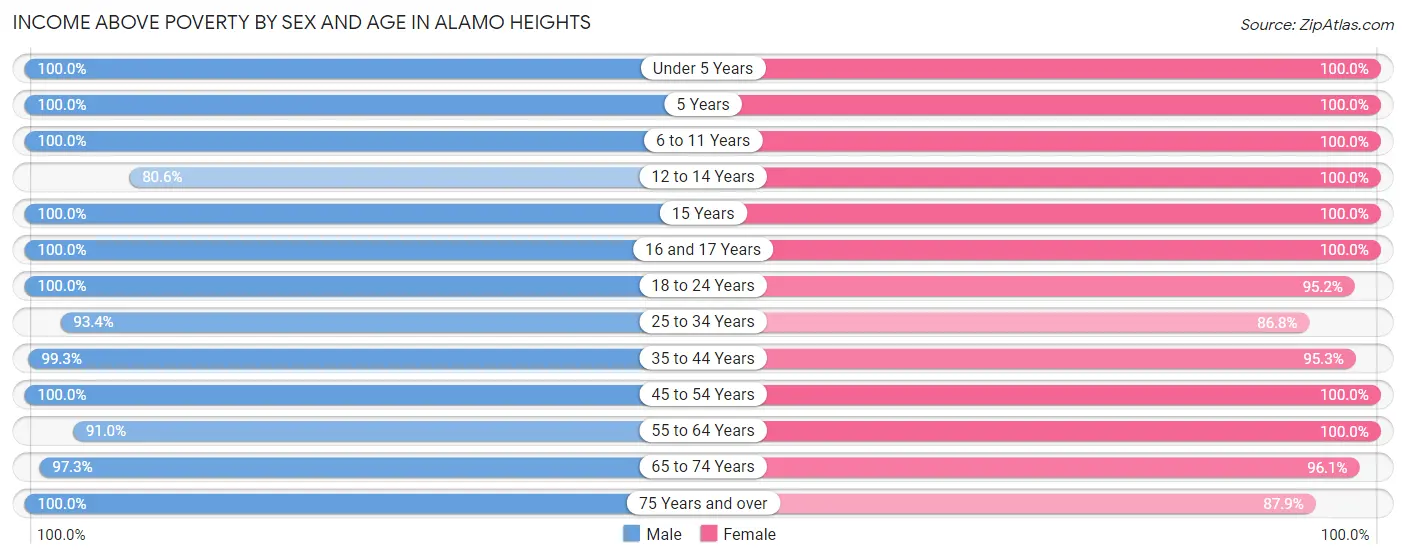
| Age Bracket | Male | Female |
| Under 5 Years | 199 (100.0%) | 119 (100.0%) |
| 5 Years | 4 (100.0%) | 24 (100.0%) |
| 6 to 11 Years | 181 (100.0%) | 311 (100.0%) |
| 12 to 14 Years | 166 (80.6%) | 222 (100.0%) |
| 15 Years | 43 (100.0%) | 160 (100.0%) |
| 16 and 17 Years | 147 (100.0%) | 45 (100.0%) |
| 18 to 24 Years | 331 (100.0%) | 218 (95.2%) |
| 25 to 34 Years | 477 (93.3%) | 361 (86.8%) |
| 35 to 44 Years | 538 (99.3%) | 491 (95.3%) |
| 45 to 54 Years | 405 (100.0%) | 503 (100.0%) |
| 55 to 64 Years | 376 (91.0%) | 633 (100.0%) |
| 65 to 74 Years | 356 (97.3%) | 243 (96.1%) |
| 75 Years and over | 349 (100.0%) | 175 (87.9%) |
| Total | 3,572 (96.6%) | 3,505 (96.6%) |
Income Below Poverty Among Married-Couple Families in Alamo Heights
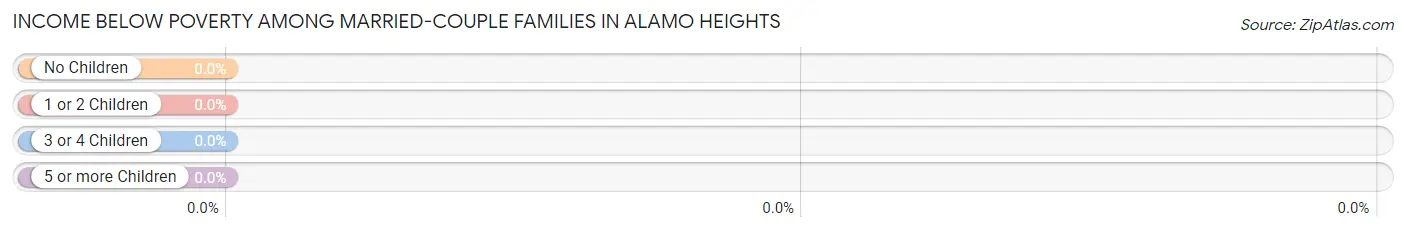
| Children | Above Poverty | Below Poverty |
| No Children | 926 (100.0%) | 0 (0.0%) |
| 1 or 2 Children | 572 (100.0%) | 0 (0.0%) |
| 3 or 4 Children | 55 (100.0%) | 0 (0.0%) |
| 5 or more Children | 13 (100.0%) | 0 (0.0%) |
| Total | 1,566 (100.0%) | 0 (0.0%) |
Income Below Poverty Among Single-Parent Households in Alamo Heights
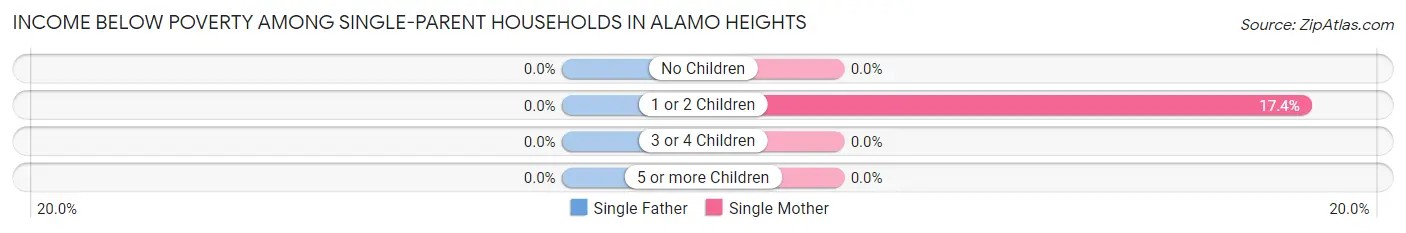
| Children | Single Father | Single Mother |
| No Children | 0 (0.0%) | 0 (0.0%) |
| 1 or 2 Children | 0 (0.0%) | 38 (17.4%) |
| 3 or 4 Children | 0 (0.0%) | 0 (0.0%) |
| 5 or more Children | 0 (0.0%) | 0 (0.0%) |
| Total | 0 (0.0%) | 38 (13.9%) |
Income Below Poverty Among Married-Couple vs Single-Parent Households in Alamo Heights
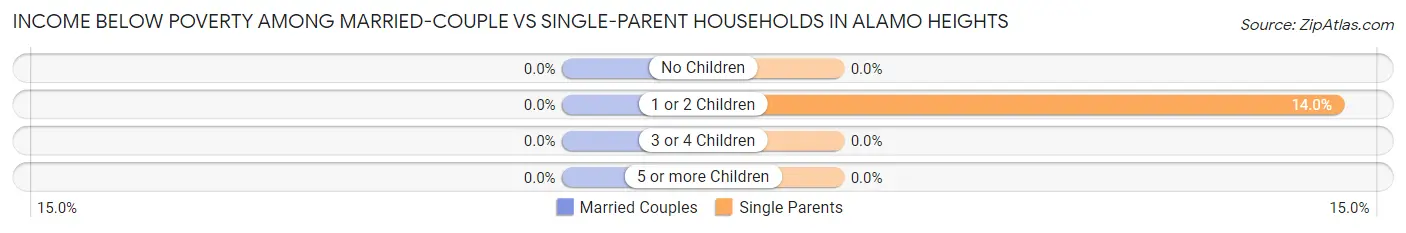
| Children | Married-Couple Families | Single-Parent Households |
| No Children | 0 (0.0%) | 0 (0.0%) |
| 1 or 2 Children | 0 (0.0%) | 38 (14.0%) |
| 3 or 4 Children | 0 (0.0%) | 0 (0.0%) |
| 5 or more Children | 0 (0.0%) | 0 (0.0%) |
| Total | 0 (0.0%) | 38 (11.1%) |
Race in Alamo Heights
The most populous races in Alamo Heights are White / Caucasian (5,945 | 80.1%), Hispanic or Latino (1,745 | 23.5%), and Two or more Races (1,234 | 16.6%).
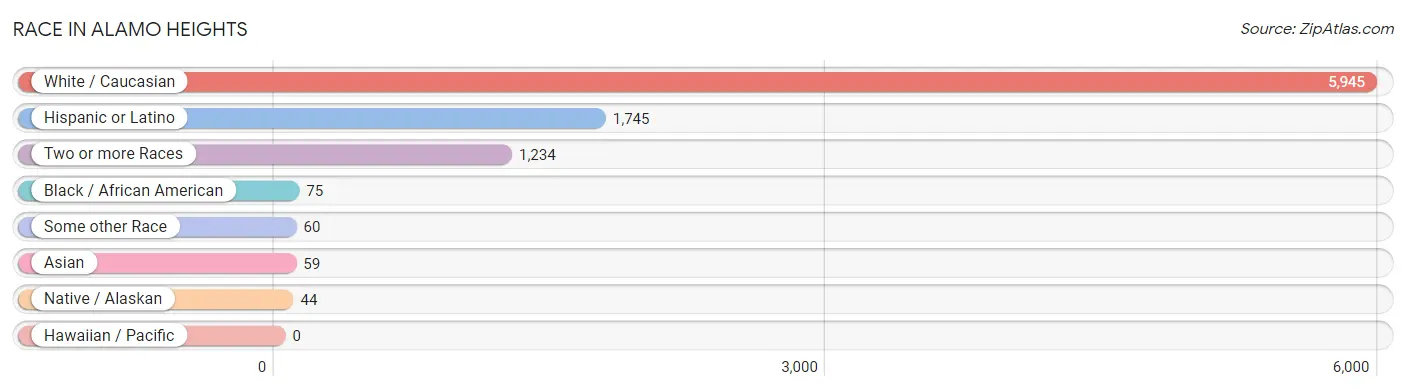
| Race | # Population | % Population |
| Asian | 59 | 0.8% |
| Black / African American | 75 | 1.0% |
| Hawaiian / Pacific | 0 | 0.0% |
| Hispanic or Latino | 1,745 | 23.5% |
| Native / Alaskan | 44 | 0.6% |
| White / Caucasian | 5,945 | 80.1% |
| Two or more Races | 1,234 | 16.6% |
| Some other Race | 60 | 0.8% |
| Total | 7,417 | 100.0% |
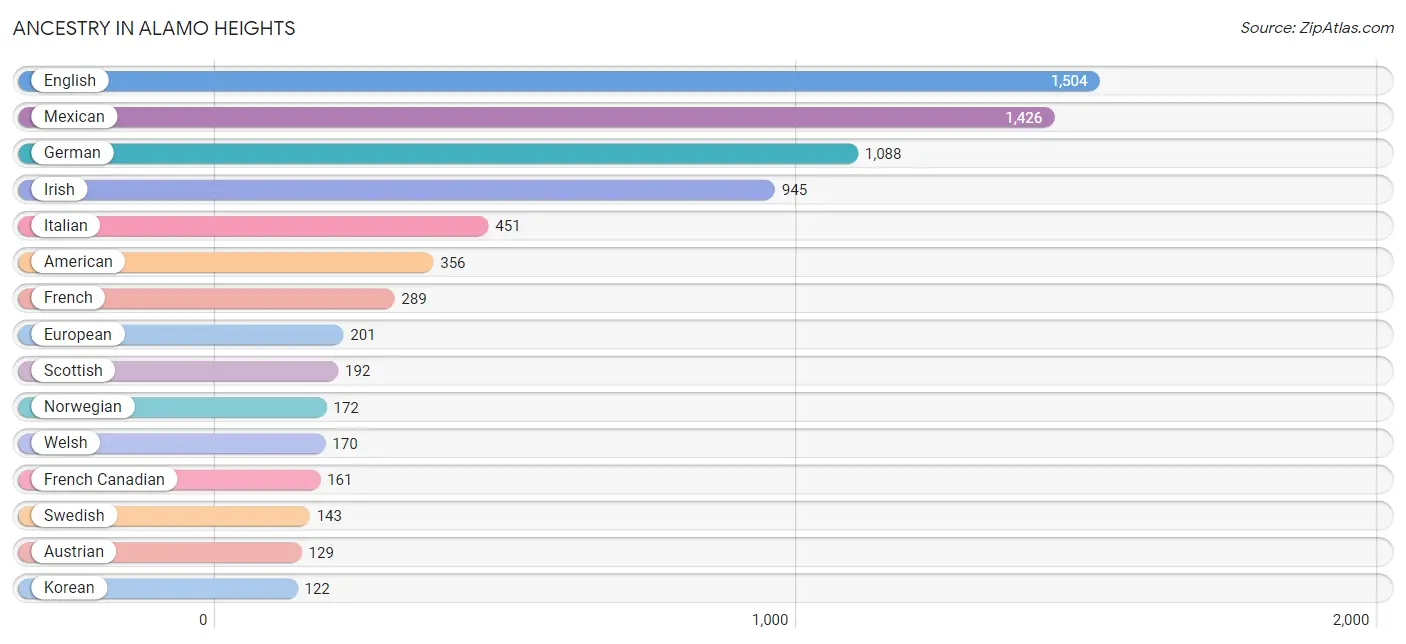
Ancestry in Alamo Heights
The most populous ancestries reported in Alamo Heights are English (1,504 | 20.3%), Mexican (1,426 | 19.2%), German (1,088 | 14.7%), Irish (945 | 12.7%), and Italian (451 | 6.1%), together accounting for 73.0% of all Alamo Heights residents.
| Ancestry | # Population | % Population |
| Alsatian | 20 | 0.3% |
| American | 356 | 4.8% |
| Argentinean | 40 | 0.5% |
| Australian | 44 | 0.6% |
| Austrian | 129 | 1.7% |
| Bhutanese | 18 | 0.2% |
| Blackfeet | 4 | 0.1% |
| British | 34 | 0.5% |
| Burmese | 52 | 0.7% |
| Central American | 35 | 0.5% |
| Central American Indian | 10 | 0.1% |
| Cherokee | 16 | 0.2% |
| Chickasaw | 28 | 0.4% |
| Chippewa | 1 | 0.0% |
| Colombian | 9 | 0.1% |
| Croatian | 35 | 0.5% |
| Cuban | 120 | 1.6% |
| Czech | 31 | 0.4% |
| Dutch | 30 | 0.4% |
| English | 1,504 | 20.3% |
| European | 201 | 2.7% |
| Finnish | 75 | 1.0% |
| French | 289 | 3.9% |
| French Canadian | 161 | 2.2% |
| German | 1,088 | 14.7% |
| Guatemalan | 10 | 0.1% |
| Honduran | 10 | 0.1% |
| Hungarian | 7 | 0.1% |
| Indian (Asian) | 16 | 0.2% |
| Indonesian | 9 | 0.1% |
| Irish | 945 | 12.7% |
| Italian | 451 | 6.1% |
| Korean | 122 | 1.6% |
| Mexican | 1,426 | 19.2% |
| Mexican American Indian | 15 | 0.2% |
| Nicaraguan | 15 | 0.2% |
| Northern European | 23 | 0.3% |
| Norwegian | 172 | 2.3% |
| Polish | 80 | 1.1% |
| Puerto Rican | 37 | 0.5% |
| Russian | 15 | 0.2% |
| Scotch-Irish | 60 | 0.8% |
| Scottish | 192 | 2.6% |
| Slovak | 18 | 0.2% |
| South American | 49 | 0.7% |
| Sri Lankan | 16 | 0.2% |
| Swedish | 143 | 1.9% |
| Ukrainian | 8 | 0.1% |
| Welsh | 170 | 2.3% | View All 49 Rows |
Immigrants in Alamo Heights
The most numerous immigrant groups reported in Alamo Heights came from Latin America (132 | 1.8%), Canada (102 | 1.4%), Europe (97 | 1.3%), Northern Europe (97 | 1.3%), and Central America (84 | 1.1%), together accounting for 6.9% of all Alamo Heights residents.
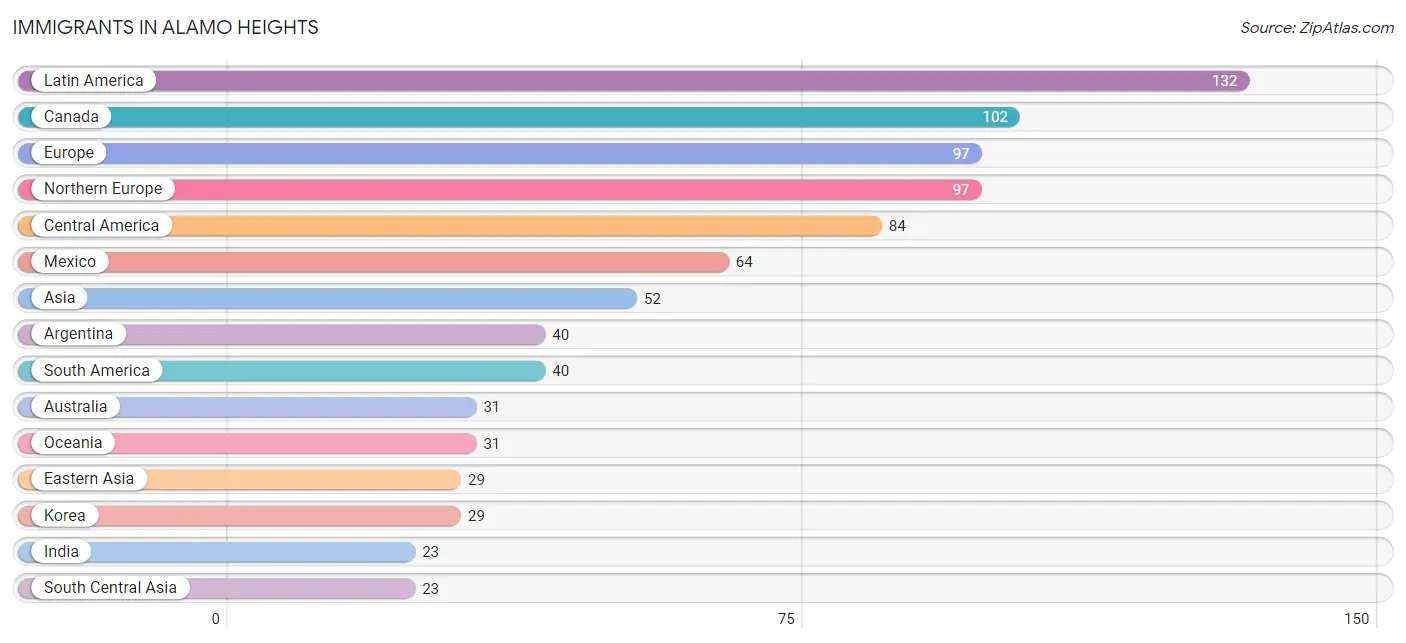
| Immigration Origin | # Population | % Population |
| Africa | 13 | 0.2% |
| Argentina | 40 | 0.5% |
| Asia | 52 | 0.7% |
| Australia | 31 | 0.4% |
| Canada | 102 | 1.4% |
| Caribbean | 8 | 0.1% |
| Central America | 84 | 1.1% |
| Cuba | 8 | 0.1% |
| Eastern Asia | 29 | 0.4% |
| Europe | 97 | 1.3% |
| Guatemala | 10 | 0.1% |
| Honduras | 10 | 0.1% |
| India | 23 | 0.3% |
| Korea | 29 | 0.4% |
| Latin America | 132 | 1.8% |
| Mexico | 64 | 0.9% |
| Northern Europe | 97 | 1.3% |
| Oceania | 31 | 0.4% |
| South Africa | 13 | 0.2% |
| South America | 40 | 0.5% |
| South Central Asia | 23 | 0.3% | View All 21 Rows |
Sex and Age in Alamo Heights
Sex and Age in Alamo Heights
The most populous age groups in Alamo Heights are 25 to 29 Years (432 | 11.7%) for men and 55 to 59 Years (408 | 11.0%) for women.
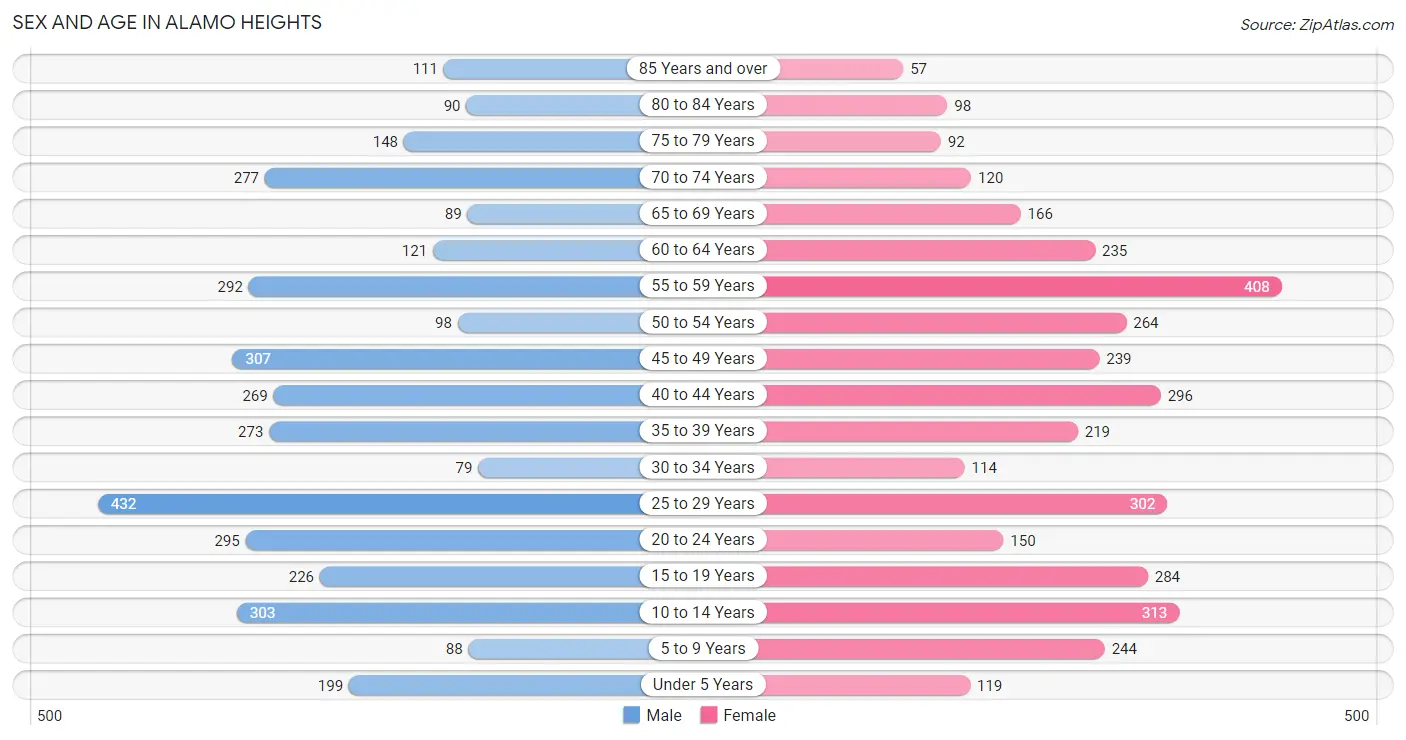
| Age Bracket | Male | Female |
| Under 5 Years | 199 (5.4%) | 119 (3.2%) |
| 5 to 9 Years | 88 (2.4%) | 244 (6.6%) |
| 10 to 14 Years | 303 (8.2%) | 313 (8.4%) |
| 15 to 19 Years | 226 (6.1%) | 284 (7.6%) |
| 20 to 24 Years | 295 (8.0%) | 150 (4.0%) |
| 25 to 29 Years | 432 (11.7%) | 302 (8.1%) |
| 30 to 34 Years | 79 (2.1%) | 114 (3.1%) |
| 35 to 39 Years | 273 (7.4%) | 219 (5.9%) |
| 40 to 44 Years | 269 (7.3%) | 296 (8.0%) |
| 45 to 49 Years | 307 (8.3%) | 239 (6.4%) |
| 50 to 54 Years | 98 (2.6%) | 264 (7.1%) |
| 55 to 59 Years | 292 (7.9%) | 408 (11.0%) |
| 60 to 64 Years | 121 (3.3%) | 235 (6.3%) |
| 65 to 69 Years | 89 (2.4%) | 166 (4.5%) |
| 70 to 74 Years | 277 (7.5%) | 120 (3.2%) |
| 75 to 79 Years | 148 (4.0%) | 92 (2.5%) |
| 80 to 84 Years | 90 (2.4%) | 98 (2.6%) |
| 85 Years and over | 111 (3.0%) | 57 (1.5%) |
| Total | 3,697 (100.0%) | 3,720 (100.0%) |
Families and Households in Alamo Heights
Median Family Size in Alamo Heights
The median family size in Alamo Heights is 3.10 persons per family, with married-couple families (1,566 | 82.1%) accounting for the largest median family size of 3.21 persons per family. On the other hand, single male/father families (69 | 3.6%) represent the smallest median family size with 1.97 persons per family.
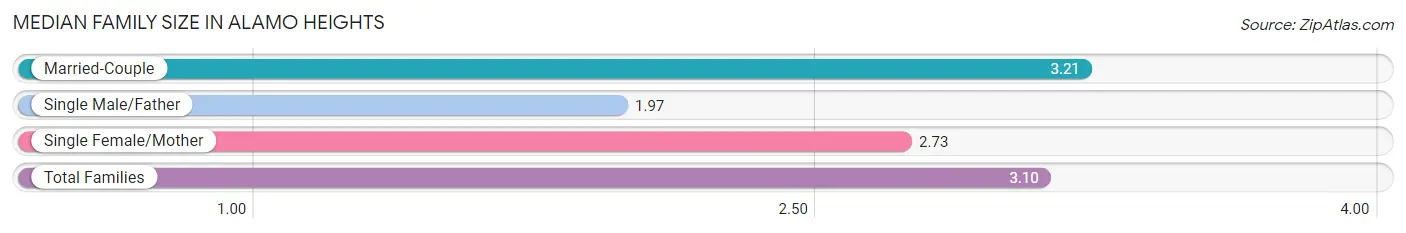
| Family Type | # Families | Family Size |
| Married-Couple | 1,566 (82.1%) | 3.21 |
| Single Male/Father | 69 (3.6%) | 1.97 |
| Single Female/Mother | 273 (14.3%) | 2.73 |
| Total Families | 1,908 (100.0%) | 3.10 |
Median Household Size in Alamo Heights
The median household size in Alamo Heights is 2.40 persons per household, with married-couple households (1,566 | 51.6%) accounting for the largest median household size of 3.22 persons per household. non-family households (1,129 | 37.2%) represent the smallest median household size with 1.18 persons per household.
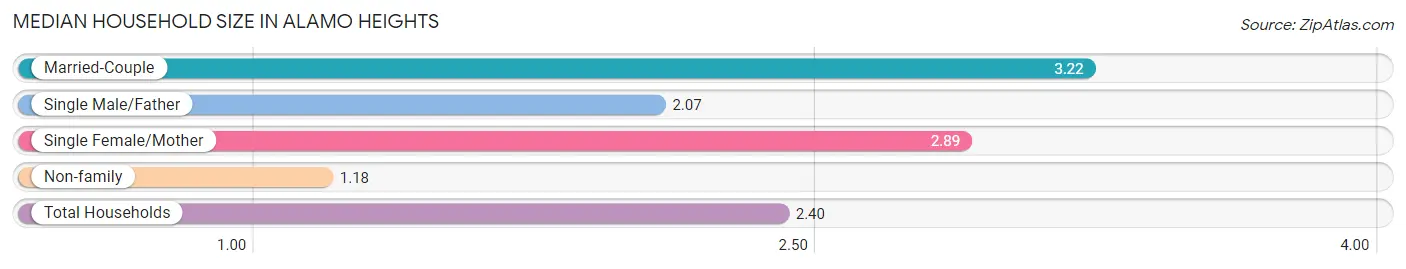
| Household Type | # Households | Household Size |
| Married-Couple | 1,566 (51.6%) | 3.22 |
| Single Male/Father | 69 (2.3%) | 2.07 |
| Single Female/Mother | 273 (9.0%) | 2.89 |
| Non-family | 1,129 (37.2%) | 1.18 |
| Total Households | 3,037 (100.0%) | 2.40 |
Household Size by Marriage Status in Alamo Heights
Out of a total of 3,037 households in Alamo Heights, 1,908 (62.8%) are family households, while 1,129 (37.2%) are nonfamily households. The most numerous type of family households are 2-person households, comprising 815, and the most common type of nonfamily households are 1-person households, comprising 930.
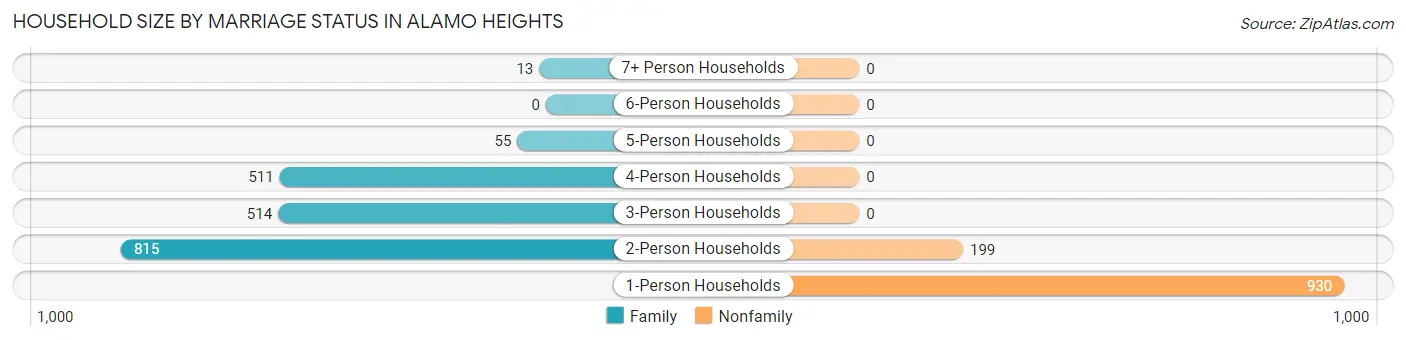
| Household Size | Family Households | Nonfamily Households |
| 1-Person Households | - | 930 (30.6%) |
| 2-Person Households | 815 (26.8%) | 199 (6.6%) |
| 3-Person Households | 514 (16.9%) | 0 (0.0%) |
| 4-Person Households | 511 (16.8%) | 0 (0.0%) |
| 5-Person Households | 55 (1.8%) | 0 (0.0%) |
| 6-Person Households | 0 (0.0%) | 0 (0.0%) |
| 7+ Person Households | 13 (0.4%) | 0 (0.0%) |
| Total | 1,908 (62.8%) | 1,129 (37.2%) |
Female Fertility in Alamo Heights
Fertility by Age in Alamo Heights
Average fertility rate in Alamo Heights is 33.0 births per 1,000 women. Women in the age bracket of 20 to 34 years have the highest fertility rate with 95.0 births per 1,000 women. Women in the age bracket of 20 to 34 years acount for 100.0% of all women with births.
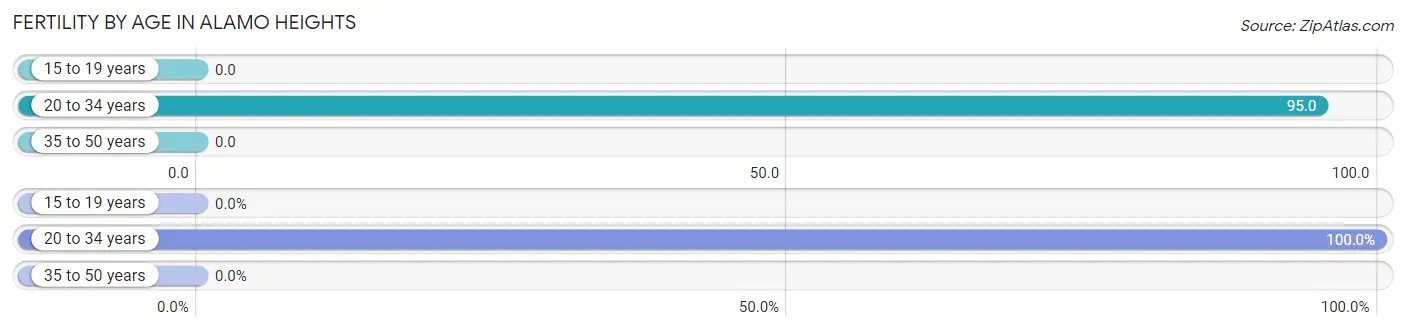
| Age Bracket | Women with Births | Births / 1,000 Women |
| 15 to 19 years | 0 (0.0%) | 0.0 |
| 20 to 34 years | 54 (100.0%) | 95.0 |
| 35 to 50 years | 0 (0.0%) | 0.0 |
| Total | 54 (100.0%) | 33.0 |
Fertility by Age by Marriage Status in Alamo Heights
87.0% of women with births (54) in Alamo Heights are married. The highest percentage of unmarried women with births falls into 20 to 34 years age bracket with 13.0% of them unmarried at the time of birth, while the lowest percentage of unmarried women with births belong to 20 to 34 years age bracket with 13.0% of them unmarried.
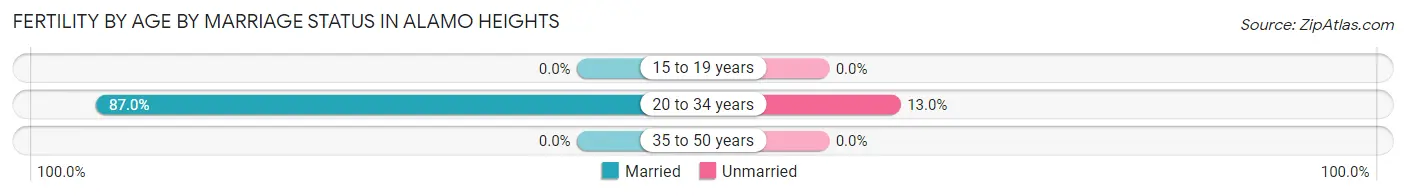
| Age Bracket | Married | Unmarried |
| 15 to 19 years | 0 (0.0%) | 0 (0.0%) |
| 20 to 34 years | 47 (87.0%) | 7 (13.0%) |
| 35 to 50 years | 0 (0.0%) | 0 (0.0%) |
| Total | 47 (87.0%) | 7 (13.0%) |
Fertility by Education in Alamo Heights
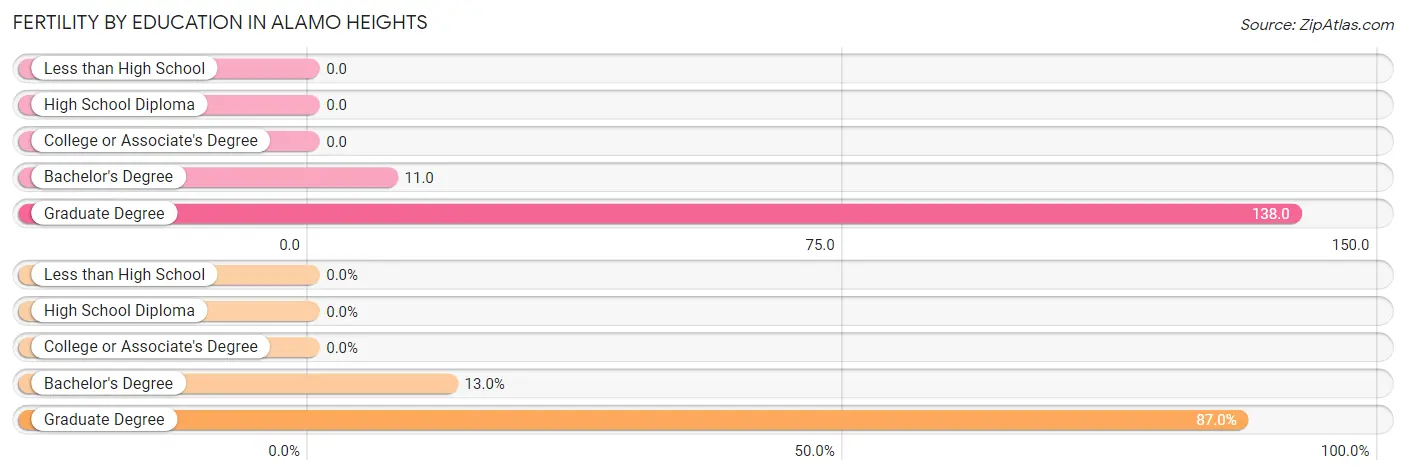
| Educational Attainment | Women with Births | Births / 1,000 Women |
| Less than High School | 0 (0.0%) | 0.0 |
| High School Diploma | 0 (0.0%) | 0.0 |
| College or Associate's Degree | 0 (0.0%) | 0.0 |
| Bachelor's Degree | 7 (13.0%) | 11.0 |
| Graduate Degree | 47 (87.0%) | 138.0 |
| Total | 54 (100.0%) | 33.0 |
Fertility by Education by Marriage Status in Alamo Heights
13.0% of women with births in Alamo Heights are unmarried. Women with the educational attainment of graduate degree are most likely to be married with 100.0% of them married at childbirth, while women with the educational attainment of bachelor's degree are least likely to be married with 100.0% of them unmarried at childbirth.
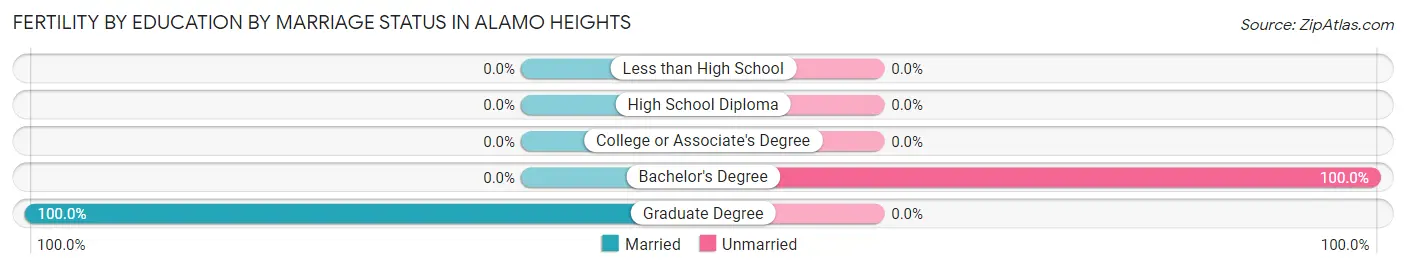
| Educational Attainment | Married | Unmarried |
| Less than High School | 0 (0.0%) | 0 (0.0%) |
| High School Diploma | 0 (0.0%) | 0 (0.0%) |
| College or Associate's Degree | 0 (0.0%) | 0 (0.0%) |
| Bachelor's Degree | 0 (0.0%) | 7 (100.0%) |
| Graduate Degree | 47 (100.0%) | 0 (0.0%) |
| Total | 47 (87.0%) | 7 (13.0%) |
Employment Characteristics in Alamo Heights
Employment by Class of Employer in Alamo Heights
Among the 4,069 employed individuals in Alamo Heights, private company employees (2,546 | 62.6%), self-employed (not incorporated) (536 | 13.2%), and not-for-profit organizations (368 | 9.0%) make up the most common classes of employment.
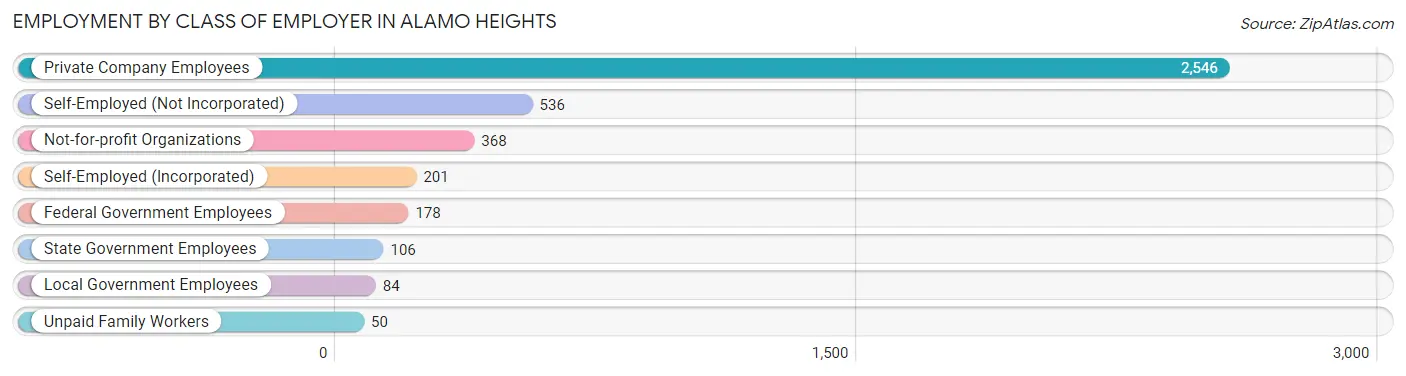
| Employer Class | # Employees | % Employees |
| Private Company Employees | 2,546 | 62.6% |
| Self-Employed (Incorporated) | 201 | 4.9% |
| Self-Employed (Not Incorporated) | 536 | 13.2% |
| Not-for-profit Organizations | 368 | 9.0% |
| Local Government Employees | 84 | 2.1% |
| State Government Employees | 106 | 2.6% |
| Federal Government Employees | 178 | 4.4% |
| Unpaid Family Workers | 50 | 1.2% |
| Total | 4,069 | 100.0% |
Employment Status by Age in Alamo Heights
According to the labor force statistics for Alamo Heights, out of the total population over 16 years of age (5,948), 69.6% or 4,140 individuals are in the labor force, with 1.1% or 46 of them unemployed. The age group with the highest labor force participation rate is 30 to 34 years, with 92.7% or 179 individuals in the labor force. Within the labor force, the 65 to 74 years age range has the highest percentage of unemployed individuals, with 4.7% or 12 of them being unemployed.
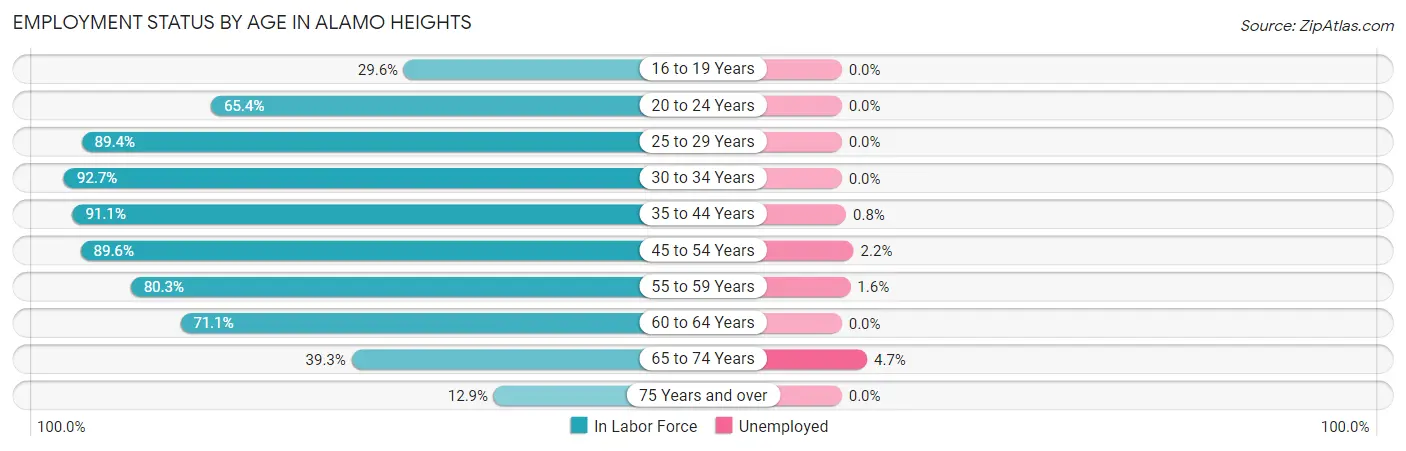
| Age Bracket | In Labor Force | Unemployed |
| 16 to 19 Years | 91 (29.6%) | 0 (0.0%) |
| 20 to 24 Years | 291 (65.4%) | 0 (0.0%) |
| 25 to 29 Years | 656 (89.4%) | 0 (0.0%) |
| 30 to 34 Years | 179 (92.7%) | 0 (0.0%) |
| 35 to 44 Years | 963 (91.1%) | 8 (0.8%) |
| 45 to 54 Years | 814 (89.6%) | 18 (2.2%) |
| 55 to 59 Years | 562 (80.3%) | 9 (1.6%) |
| 60 to 64 Years | 253 (71.1%) | 0 (0.0%) |
| 65 to 74 Years | 256 (39.3%) | 12 (4.7%) |
| 75 Years and over | 77 (12.9%) | 0 (0.0%) |
| Total | 4,140 (69.6%) | 46 (1.1%) |
Employment Status by Educational Attainment in Alamo Heights
According to labor force statistics for Alamo Heights, 86.8% of individuals (3,427) out of the total population between 25 and 64 years of age (3,948) are in the labor force, with 1.0% or 34 of them being unemployed. The group with the highest labor force participation rate are those with the educational attainment of bachelor's degree or higher, with 88.6% or 2,785 individuals in the labor force. Within the labor force, individuals with bachelor's degree or higher education have the highest percentage of unemployment, with 1.2% or 33 of them being unemployed.
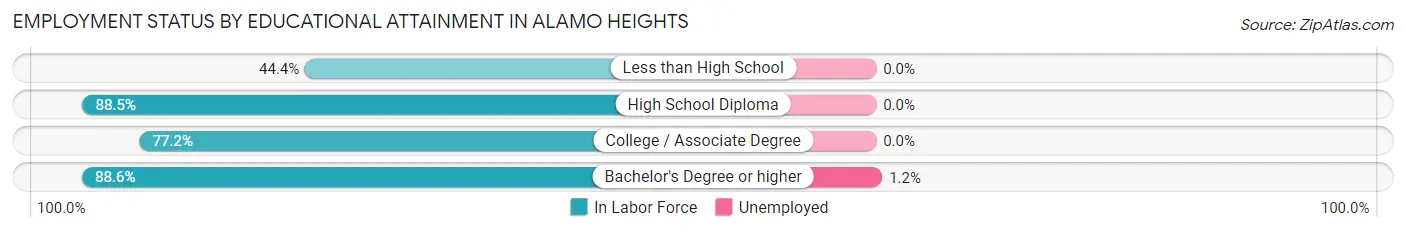
| Educational Attainment | In Labor Force | Unemployed |
| Less than High School | 8 (44.4%) | 0 (0.0%) |
| High School Diploma | 215 (88.5%) | 0 (0.0%) |
| College / Associate Degree | 420 (77.2%) | 0 (0.0%) |
| Bachelor's Degree or higher | 2,785 (88.6%) | 38 (1.2%) |
| Total | 3,427 (86.8%) | 39 (1.0%) |
Employment Occupations by Sex in Alamo Heights
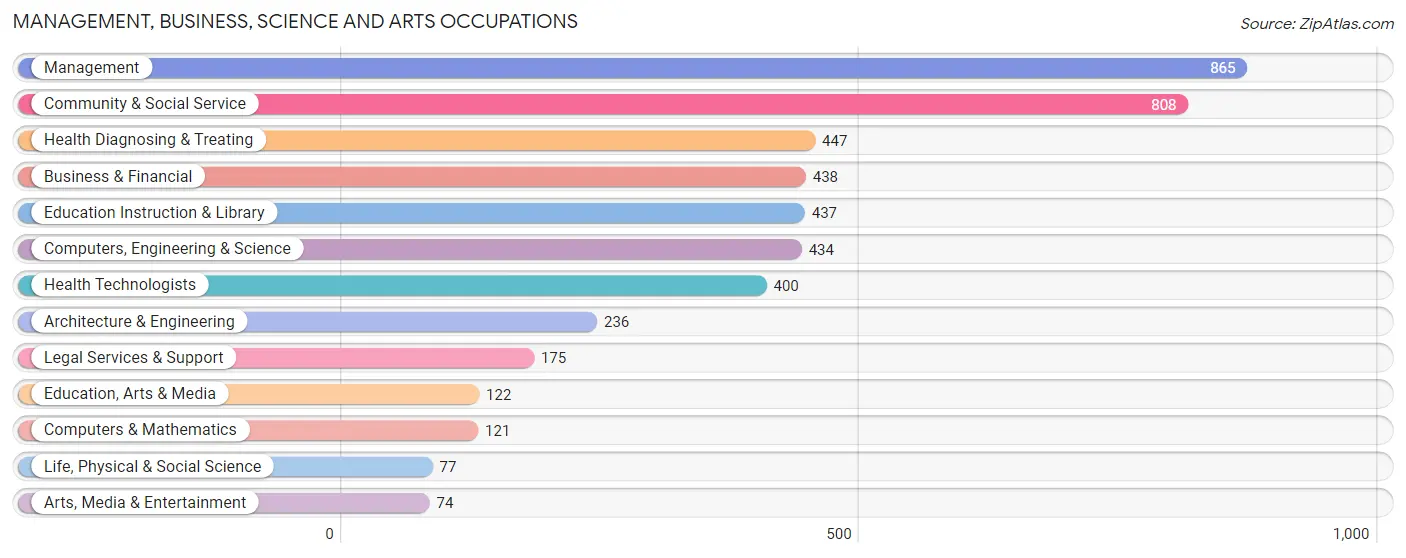
Management, Business, Science and Arts Occupations
The most common Management, Business, Science and Arts occupations in Alamo Heights are Management (865 | 21.4%), Community & Social Service (808 | 20.0%), Health Diagnosing & Treating (447 | 11.0%), Business & Financial (438 | 10.8%), and Education Instruction & Library (437 | 10.8%).
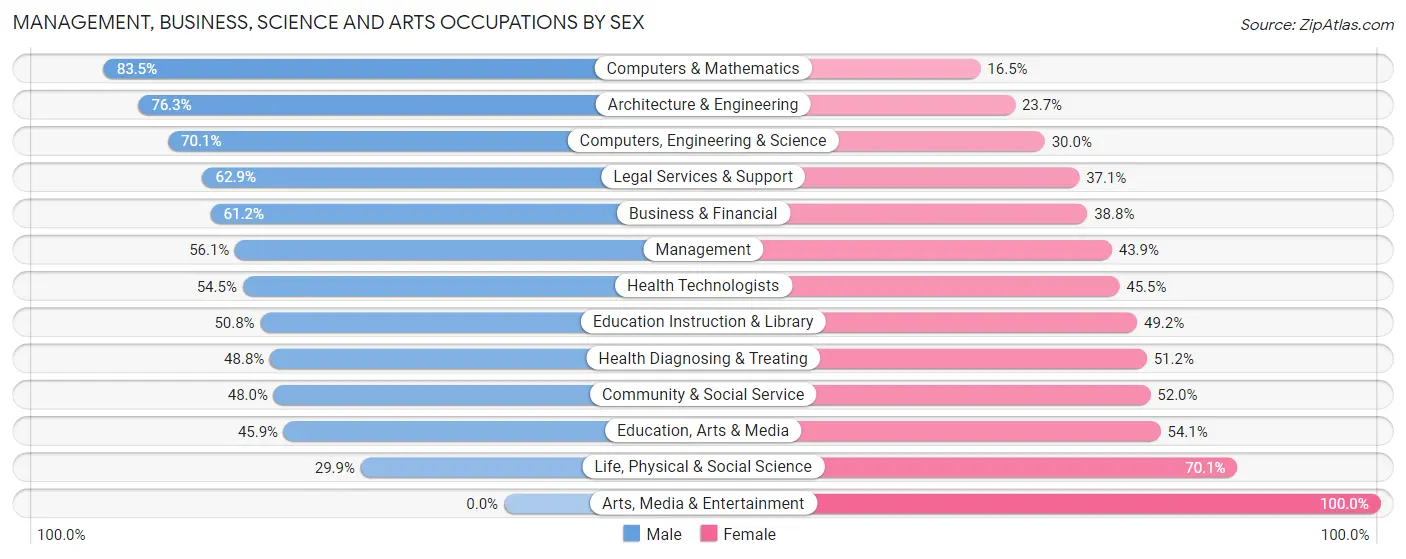
Management, Business, Science and Arts Occupations by Sex
Within the Management, Business, Science and Arts occupations in Alamo Heights, the most male-oriented occupations are Computers & Mathematics (83.5%), Architecture & Engineering (76.3%), and Computers, Engineering & Science (70.1%), while the most female-oriented occupations are Arts, Media & Entertainment (100.0%), Life, Physical & Social Science (70.1%), and Education, Arts & Media (54.1%).
| Occupation | Male | Female |
| Management | 485 (56.1%) | 380 (43.9%) |
| Business & Financial | 268 (61.2%) | 170 (38.8%) |
| Computers, Engineering & Science | 304 (70.1%) | 130 (29.9%) |
| Computers & Mathematics | 101 (83.5%) | 20 (16.5%) |
| Architecture & Engineering | 180 (76.3%) | 56 (23.7%) |
| Life, Physical & Social Science | 23 (29.9%) | 54 (70.1%) |
| Community & Social Service | 388 (48.0%) | 420 (52.0%) |
| Education, Arts & Media | 56 (45.9%) | 66 (54.1%) |
| Legal Services & Support | 110 (62.9%) | 65 (37.1%) |
| Education Instruction & Library | 222 (50.8%) | 215 (49.2%) |
| Arts, Media & Entertainment | 0 (0.0%) | 74 (100.0%) |
| Health Diagnosing & Treating | 218 (48.8%) | 229 (51.2%) |
| Health Technologists | 218 (54.5%) | 182 (45.5%) |
| Total (Category) | 1,663 (55.6%) | 1,329 (44.4%) |
| Total (Overall) | 2,237 (55.2%) | 1,813 (44.8%) |
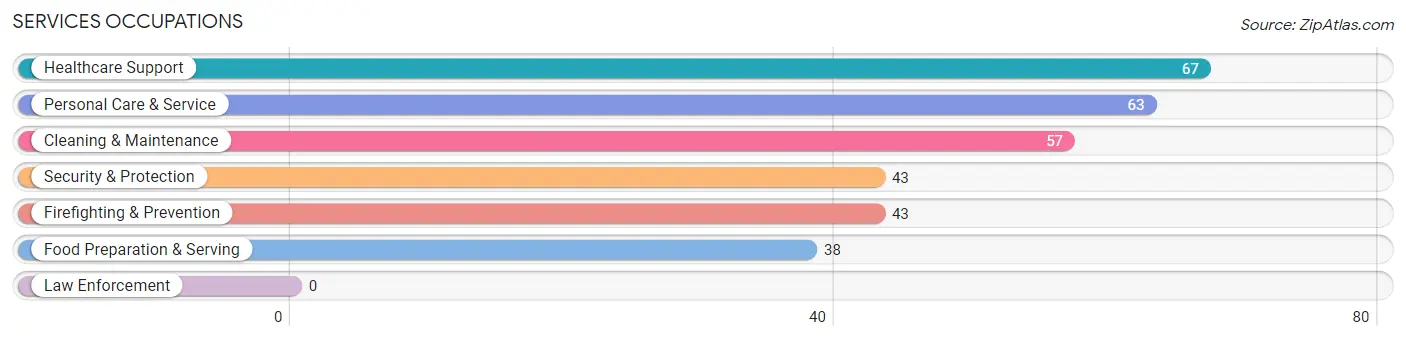
Services Occupations
The most common Services occupations in Alamo Heights are Healthcare Support (67 | 1.7%), Personal Care & Service (63 | 1.6%), Cleaning & Maintenance (57 | 1.4%), Security & Protection (43 | 1.1%), and Firefighting & Prevention (43 | 1.1%).
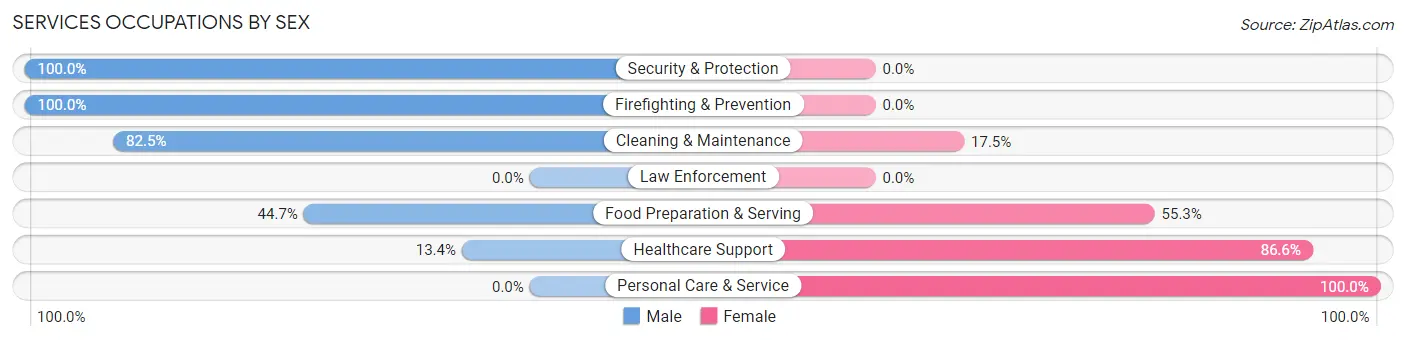
Services Occupations by Sex
Within the Services occupations in Alamo Heights, the most male-oriented occupations are Security & Protection (100.0%), Firefighting & Prevention (100.0%), and Cleaning & Maintenance (82.5%), while the most female-oriented occupations are Personal Care & Service (100.0%), Healthcare Support (86.6%), and Food Preparation & Serving (55.3%).
| Occupation | Male | Female |
| Healthcare Support | 9 (13.4%) | 58 (86.6%) |
| Security & Protection | 43 (100.0%) | 0 (0.0%) |
| Firefighting & Prevention | 43 (100.0%) | 0 (0.0%) |
| Law Enforcement | 0 (0.0%) | 0 (0.0%) |
| Food Preparation & Serving | 17 (44.7%) | 21 (55.3%) |
| Cleaning & Maintenance | 47 (82.5%) | 10 (17.5%) |
| Personal Care & Service | 0 (0.0%) | 63 (100.0%) |
| Total (Category) | 116 (43.3%) | 152 (56.7%) |
| Total (Overall) | 2,237 (55.2%) | 1,813 (44.8%) |
Sales and Office Occupations
The most common Sales and Office occupations in Alamo Heights are Sales & Related (454 | 11.2%), and Office & Administration (174 | 4.3%).

Sales and Office Occupations by Sex
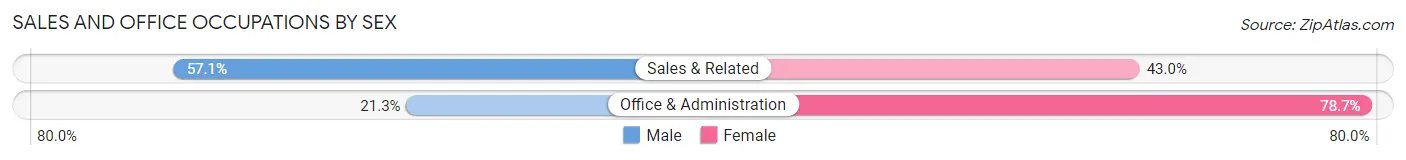
| Occupation | Male | Female |
| Sales & Related | 259 (57.1%) | 195 (42.9%) |
| Office & Administration | 37 (21.3%) | 137 (78.7%) |
| Total (Category) | 296 (47.1%) | 332 (52.9%) |
| Total (Overall) | 2,237 (55.2%) | 1,813 (44.8%) |
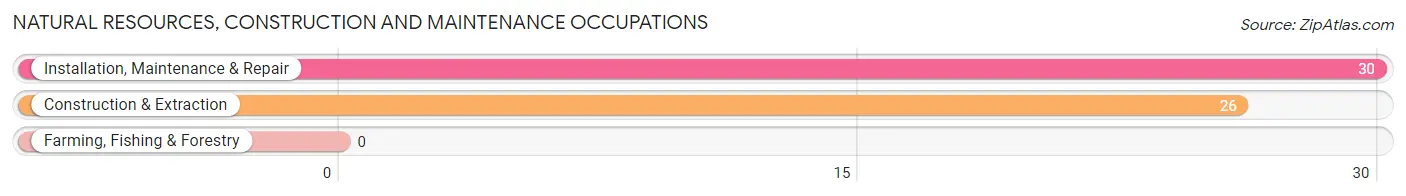
Natural Resources, Construction and Maintenance Occupations
The most common Natural Resources, Construction and Maintenance occupations in Alamo Heights are Installation, Maintenance & Repair (30 | 0.7%), and Construction & Extraction (26 | 0.6%).
Natural Resources, Construction and Maintenance Occupations by Sex
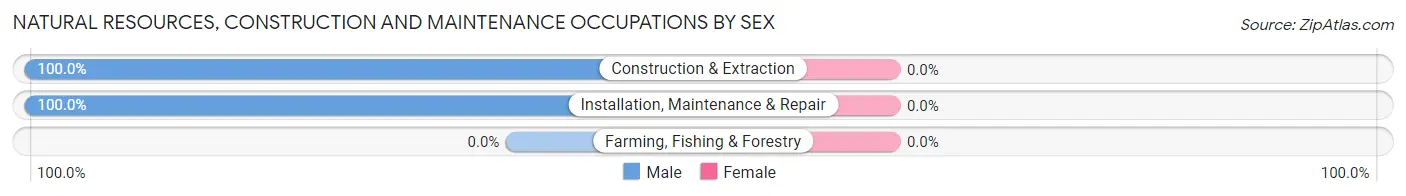
| Occupation | Male | Female |
| Farming, Fishing & Forestry | 0 (0.0%) | 0 (0.0%) |
| Construction & Extraction | 26 (100.0%) | 0 (0.0%) |
| Installation, Maintenance & Repair | 30 (100.0%) | 0 (0.0%) |
| Total (Category) | 56 (100.0%) | 0 (0.0%) |
| Total (Overall) | 2,237 (55.2%) | 1,813 (44.8%) |
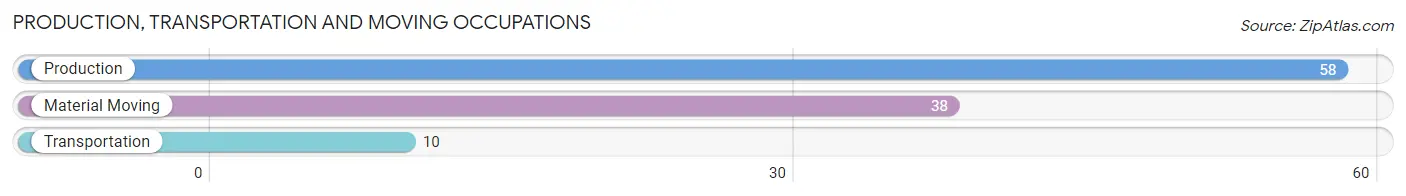
Production, Transportation and Moving Occupations
The most common Production, Transportation and Moving occupations in Alamo Heights are Production (58 | 1.4%), Material Moving (38 | 0.9%), and Transportation (10 | 0.3%).
Production, Transportation and Moving Occupations by Sex
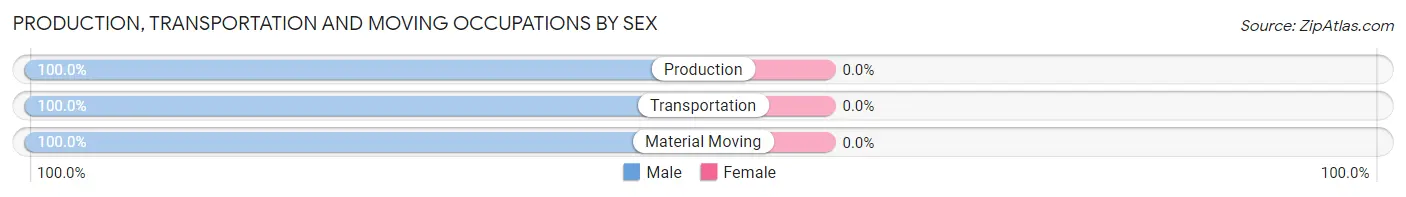
| Occupation | Male | Female |
| Production | 58 (100.0%) | 0 (0.0%) |
| Transportation | 10 (100.0%) | 0 (0.0%) |
| Material Moving | 38 (100.0%) | 0 (0.0%) |
| Total (Category) | 106 (100.0%) | 0 (0.0%) |
| Total (Overall) | 2,237 (55.2%) | 1,813 (44.8%) |
Employment Industries by Sex in Alamo Heights
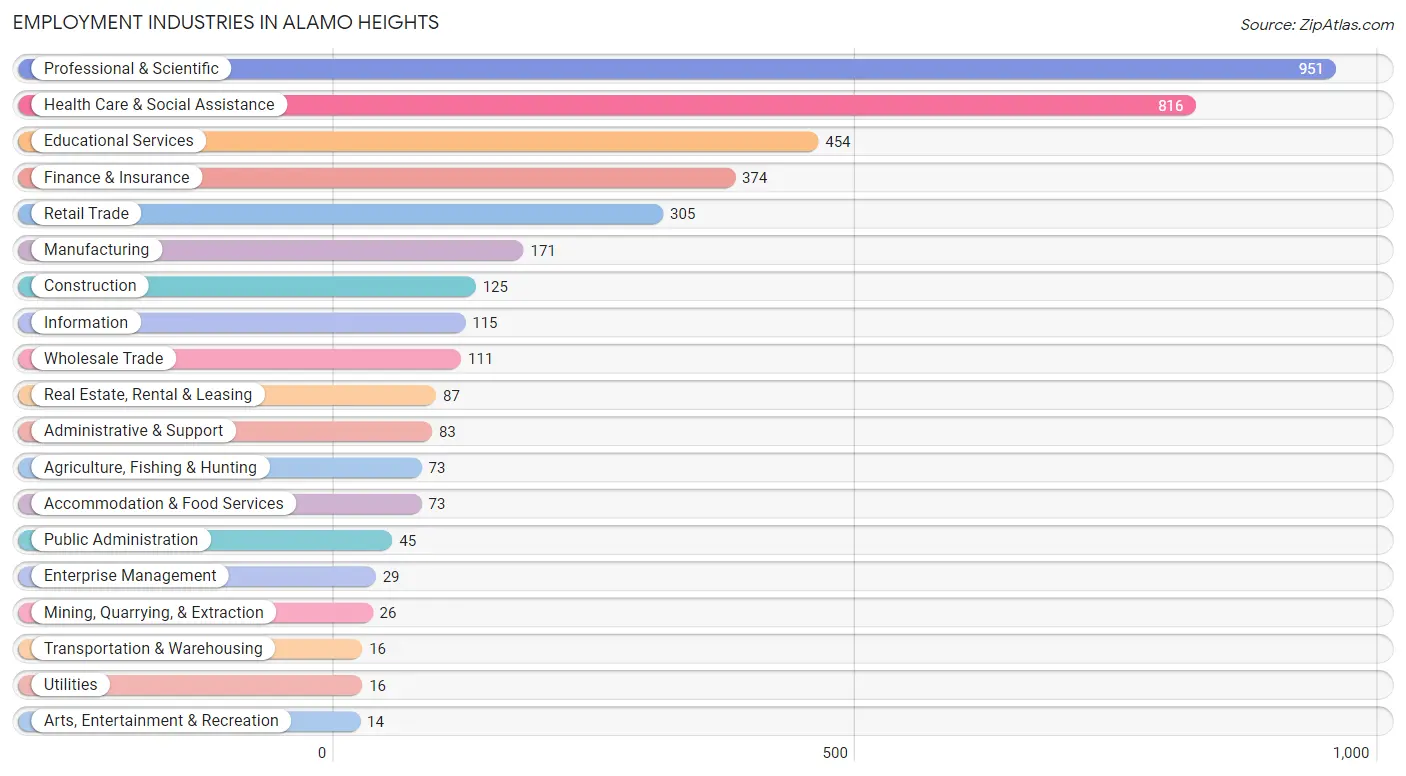
Employment Industries in Alamo Heights
The major employment industries in Alamo Heights include Professional & Scientific (951 | 23.5%), Health Care & Social Assistance (816 | 20.2%), Educational Services (454 | 11.2%), Finance & Insurance (374 | 9.2%), and Retail Trade (305 | 7.5%).
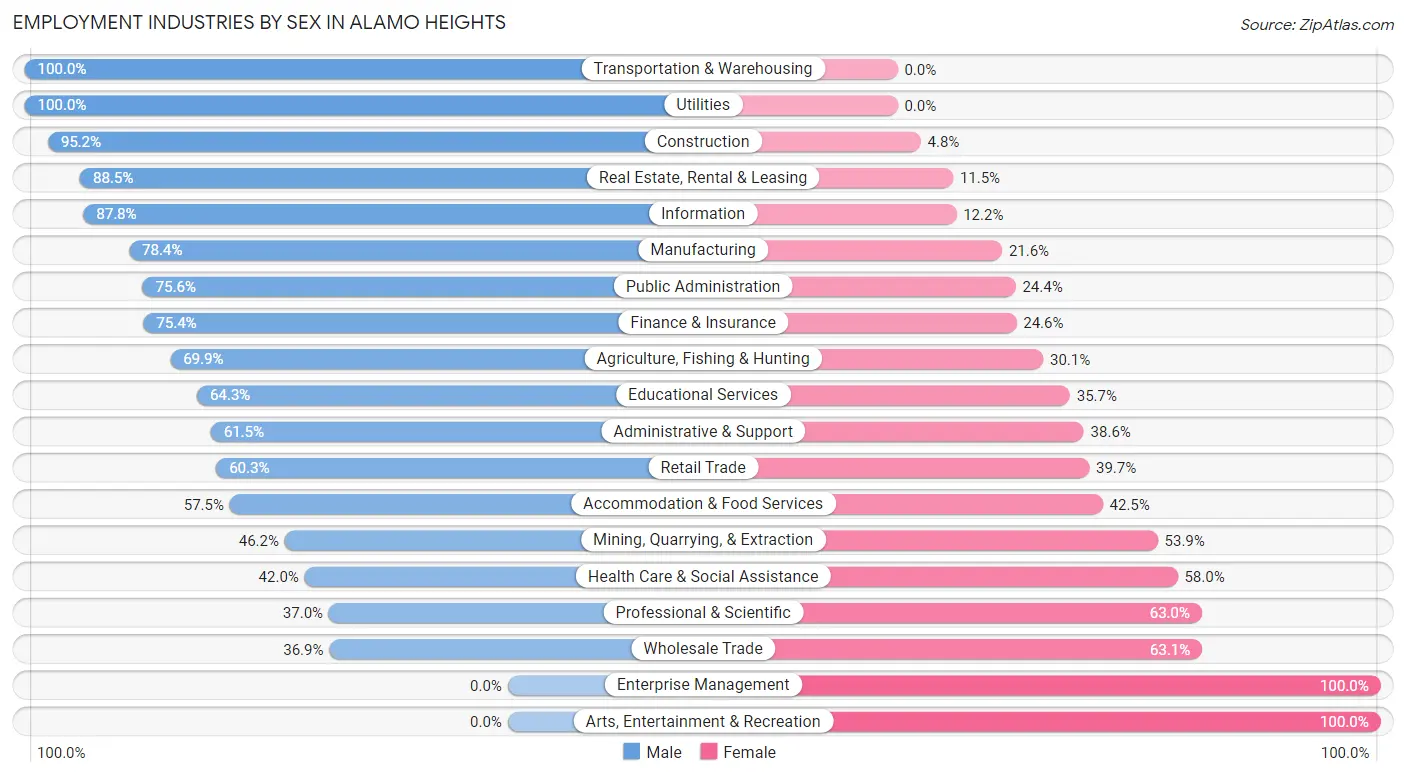
Employment Industries by Sex in Alamo Heights
The Alamo Heights industries that see more men than women are Transportation & Warehousing (100.0%), Utilities (100.0%), and Construction (95.2%), whereas the industries that tend to have a higher number of women are Enterprise Management (100.0%), Arts, Entertainment & Recreation (100.0%), and Wholesale Trade (63.1%).
| Industry | Male | Female |
| Agriculture, Fishing & Hunting | 51 (69.9%) | 22 (30.1%) |
| Mining, Quarrying, & Extraction | 12 (46.2%) | 14 (53.8%) |
| Construction | 119 (95.2%) | 6 (4.8%) |
| Manufacturing | 134 (78.4%) | 37 (21.6%) |
| Wholesale Trade | 41 (36.9%) | 70 (63.1%) |
| Retail Trade | 184 (60.3%) | 121 (39.7%) |
| Transportation & Warehousing | 16 (100.0%) | 0 (0.0%) |
| Utilities | 16 (100.0%) | 0 (0.0%) |
| Information | 101 (87.8%) | 14 (12.2%) |
| Finance & Insurance | 282 (75.4%) | 92 (24.6%) |
| Real Estate, Rental & Leasing | 77 (88.5%) | 10 (11.5%) |
| Professional & Scientific | 352 (37.0%) | 599 (63.0%) |
| Enterprise Management | 0 (0.0%) | 29 (100.0%) |
| Administrative & Support | 51 (61.5%) | 32 (38.6%) |
| Educational Services | 292 (64.3%) | 162 (35.7%) |
| Health Care & Social Assistance | 343 (42.0%) | 473 (58.0%) |
| Arts, Entertainment & Recreation | 0 (0.0%) | 14 (100.0%) |
| Accommodation & Food Services | 42 (57.5%) | 31 (42.5%) |
| Public Administration | 34 (75.6%) | 11 (24.4%) |
| Total | 2,237 (55.2%) | 1,813 (44.8%) |
Education in Alamo Heights
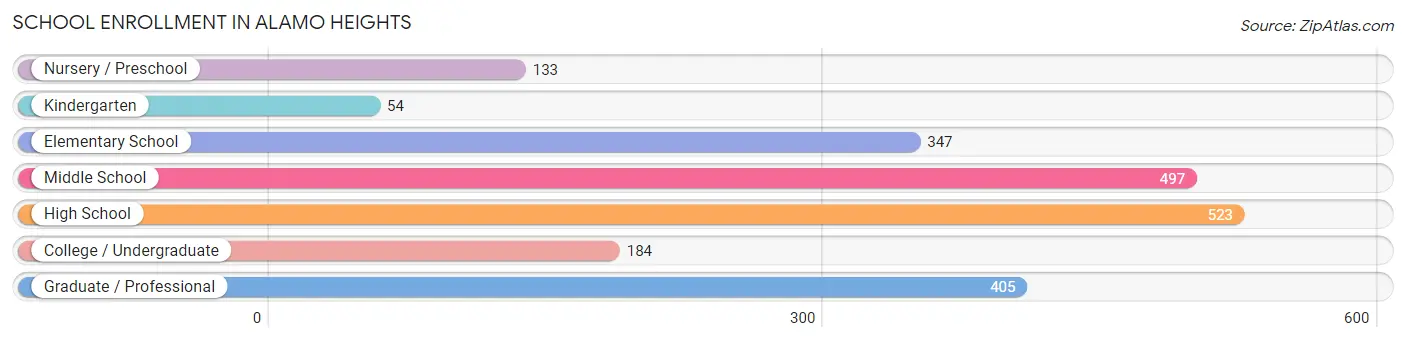
School Enrollment in Alamo Heights
The most common levels of schooling among the 2,143 students in Alamo Heights are high school (523 | 24.4%), middle school (497 | 23.2%), and graduate / professional (405 | 18.9%).
| School Level | # Students | % Students |
| Nursery / Preschool | 133 | 6.2% |
| Kindergarten | 54 | 2.5% |
| Elementary School | 347 | 16.2% |
| Middle School | 497 | 23.2% |
| High School | 523 | 24.4% |
| College / Undergraduate | 184 | 8.6% |
| Graduate / Professional | 405 | 18.9% |
| Total | 2,143 | 100.0% |
School Enrollment by Age by Funding Source in Alamo Heights
Out of a total of 2,143 students who are enrolled in schools in Alamo Heights, 684 (31.9%) attend a private institution, while the remaining 1,459 (68.1%) are enrolled in public schools. The age group of 3 to 4 year olds has the highest likelihood of being enrolled in private schools, with 120 (100.0% in the age bracket) enrolled. Conversely, the age group of 18 to 19 year olds has the lowest likelihood of being enrolled in a private school, with 91 (100.0% in the age bracket) attending a public institution.
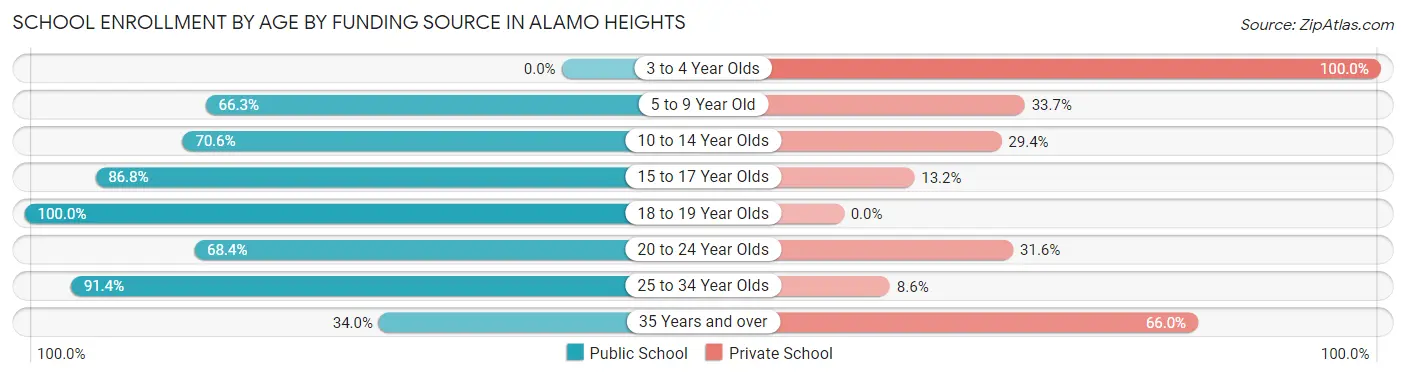
| Age Bracket | Public School | Private School |
| 3 to 4 Year Olds | 0 (0.0%) | 120 (100.0%) |
| 5 to 9 Year Old | 220 (66.3%) | 112 (33.7%) |
| 10 to 14 Year Olds | 435 (70.6%) | 181 (29.4%) |
| 15 to 17 Year Olds | 343 (86.8%) | 52 (13.2%) |
| 18 to 19 Year Olds | 91 (100.0%) | 0 (0.0%) |
| 20 to 24 Year Olds | 167 (68.4%) | 77 (31.6%) |
| 25 to 34 Year Olds | 138 (91.4%) | 13 (8.6%) |
| 35 Years and over | 66 (34.0%) | 128 (66.0%) |
| Total | 1,459 (68.1%) | 684 (31.9%) |
Educational Attainment by Field of Study in Alamo Heights
Business (777 | 19.2%), science & technology (434 | 10.7%), engineering (403 | 9.9%), social sciences (368 | 9.1%), and bio, nature & agricultural (330 | 8.1%) are the most common fields of study among 4,057 individuals in Alamo Heights who have obtained a bachelor's degree or higher.
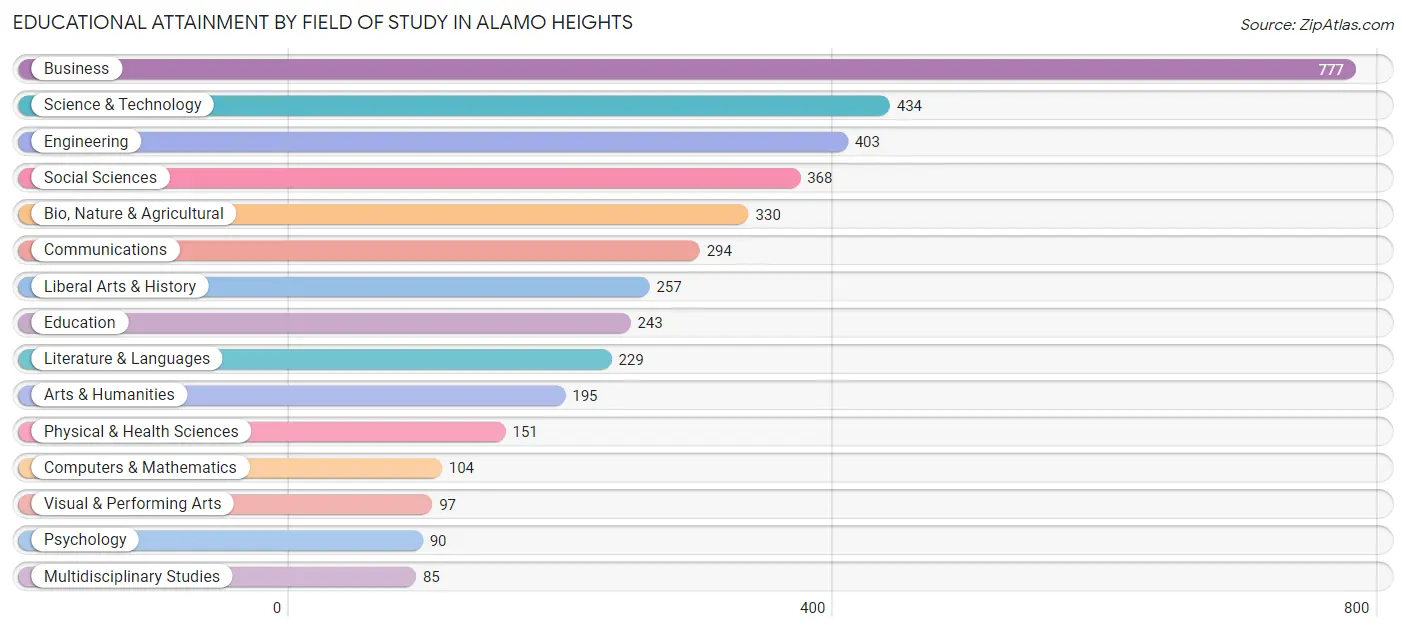
| Field of Study | # Graduates | % Graduates |
| Computers & Mathematics | 104 | 2.6% |
| Bio, Nature & Agricultural | 330 | 8.1% |
| Physical & Health Sciences | 151 | 3.7% |
| Psychology | 90 | 2.2% |
| Social Sciences | 368 | 9.1% |
| Engineering | 403 | 9.9% |
| Multidisciplinary Studies | 85 | 2.1% |
| Science & Technology | 434 | 10.7% |
| Business | 777 | 19.2% |
| Education | 243 | 6.0% |
| Literature & Languages | 229 | 5.6% |
| Liberal Arts & History | 257 | 6.3% |
| Visual & Performing Arts | 97 | 2.4% |
| Communications | 294 | 7.2% |
| Arts & Humanities | 195 | 4.8% |
| Total | 4,057 | 100.0% |
Transportation & Commute in Alamo Heights
Vehicle Availability by Sex in Alamo Heights
The most prevalent vehicle ownership categories in Alamo Heights are males with 2 vehicles (1,269, accounting for 56.3%) and females with 2 vehicles (923, making up 70.0%).
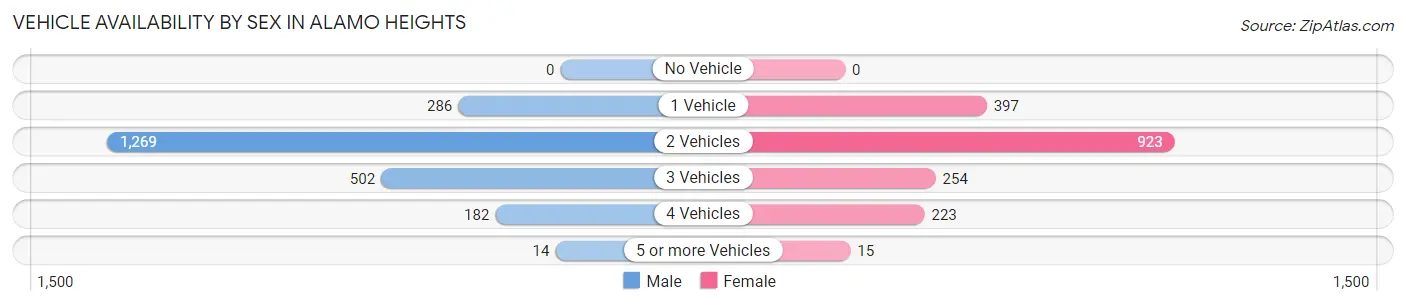
| Vehicles Available | Male | Female |
| No Vehicle | 0 (0.0%) | 0 (0.0%) |
| 1 Vehicle | 286 (12.7%) | 397 (21.9%) |
| 2 Vehicles | 1,269 (56.3%) | 923 (50.9%) |
| 3 Vehicles | 502 (22.3%) | 254 (14.0%) |
| 4 Vehicles | 182 (8.1%) | 223 (12.3%) |
| 5 or more Vehicles | 14 (0.6%) | 15 (0.8%) |
| Total | 2,253 (100.0%) | 1,812 (100.0%) |
Commute Time in Alamo Heights
The most frequently occuring commute durations in Alamo Heights are 15 to 19 minutes (743 commuters, 21.0%), 10 to 14 minutes (717 commuters, 20.3%), and 20 to 24 minutes (656 commuters, 18.6%).
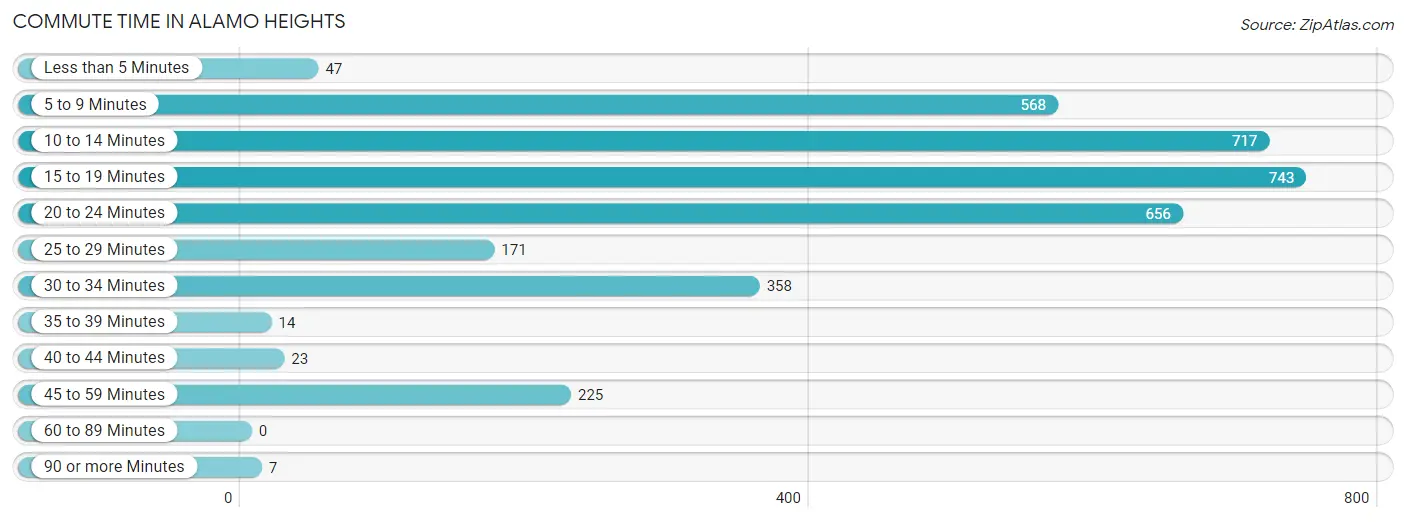
| Commute Time | # Commuters | % Commuters |
| Less than 5 Minutes | 47 | 1.3% |
| 5 to 9 Minutes | 568 | 16.1% |
| 10 to 14 Minutes | 717 | 20.3% |
| 15 to 19 Minutes | 743 | 21.0% |
| 20 to 24 Minutes | 656 | 18.6% |
| 25 to 29 Minutes | 171 | 4.9% |
| 30 to 34 Minutes | 358 | 10.1% |
| 35 to 39 Minutes | 14 | 0.4% |
| 40 to 44 Minutes | 23 | 0.6% |
| 45 to 59 Minutes | 225 | 6.4% |
| 60 to 89 Minutes | 0 | 0.0% |
| 90 or more Minutes | 7 | 0.2% |
Commute Time by Sex in Alamo Heights
The most common commute times in Alamo Heights are 15 to 19 minutes (465 commuters, 22.4%) for males and 20 to 24 minutes (376 commuters, 25.9%) for females.
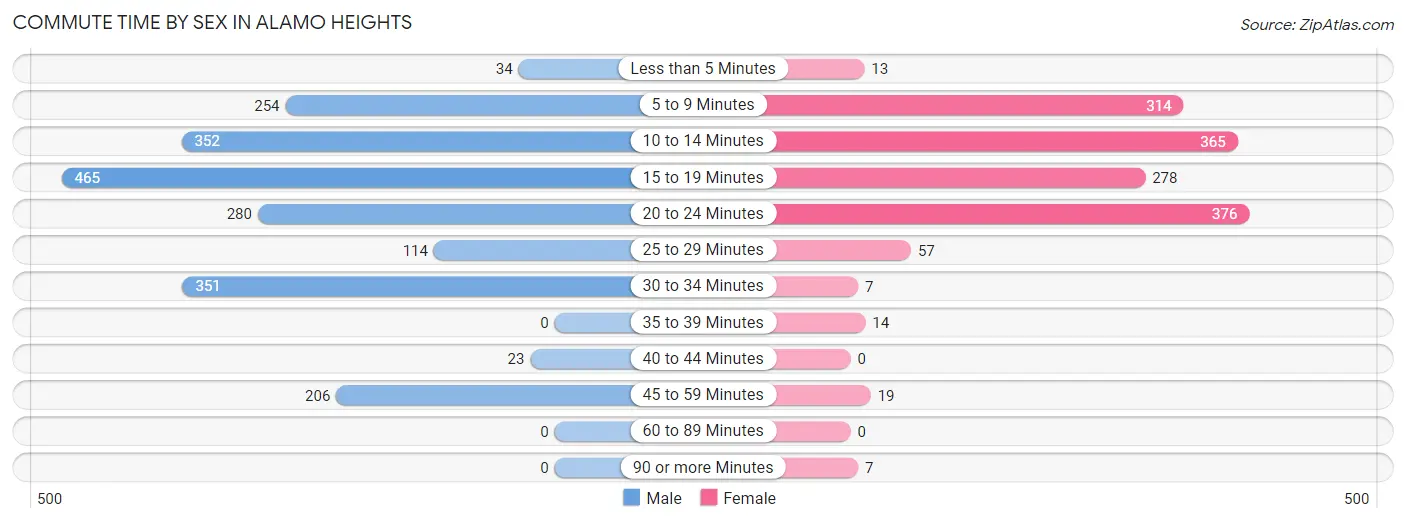
| Commute Time | Male | Female |
| Less than 5 Minutes | 34 (1.6%) | 13 (0.9%) |
| 5 to 9 Minutes | 254 (12.2%) | 314 (21.7%) |
| 10 to 14 Minutes | 352 (16.9%) | 365 (25.2%) |
| 15 to 19 Minutes | 465 (22.4%) | 278 (19.2%) |
| 20 to 24 Minutes | 280 (13.5%) | 376 (25.9%) |
| 25 to 29 Minutes | 114 (5.5%) | 57 (3.9%) |
| 30 to 34 Minutes | 351 (16.9%) | 7 (0.5%) |
| 35 to 39 Minutes | 0 (0.0%) | 14 (1.0%) |
| 40 to 44 Minutes | 23 (1.1%) | 0 (0.0%) |
| 45 to 59 Minutes | 206 (9.9%) | 19 (1.3%) |
| 60 to 89 Minutes | 0 (0.0%) | 0 (0.0%) |
| 90 or more Minutes | 0 (0.0%) | 7 (0.5%) |
Time of Departure to Work by Sex in Alamo Heights
The most frequent times of departure to work in Alamo Heights are 7:00 AM to 7:29 AM (398, 19.1%) for males and 8:00 AM to 8:29 AM (626, 43.2%) for females.
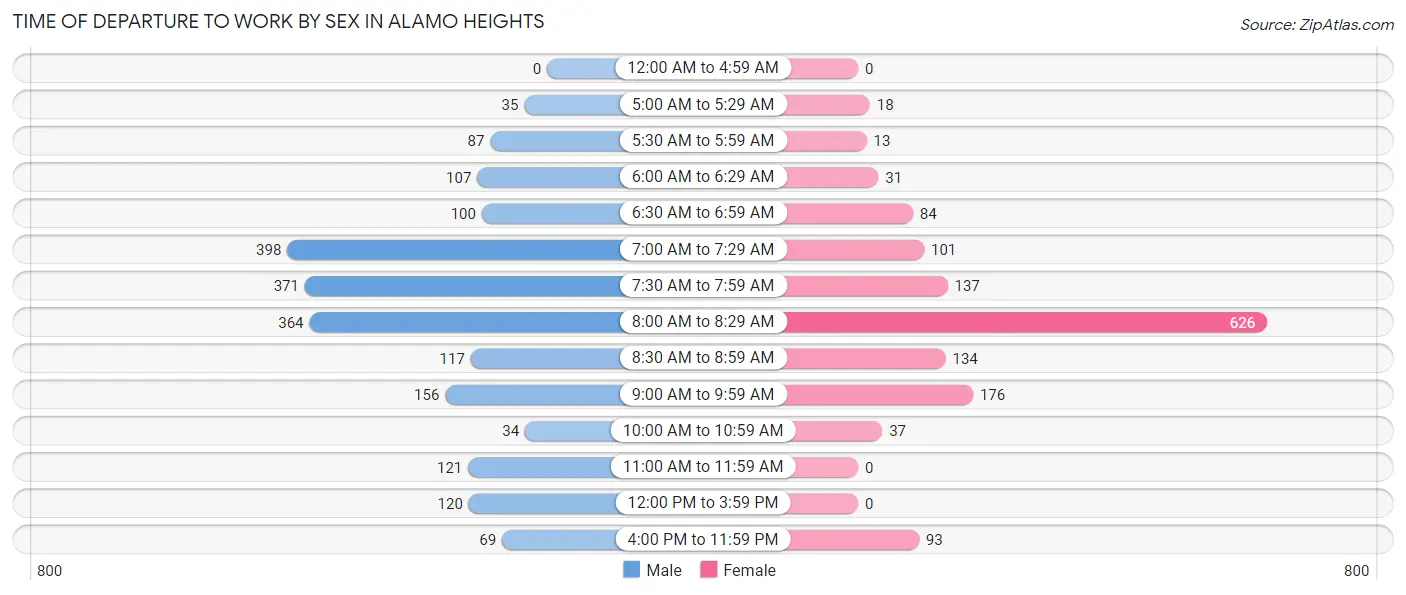
| Time of Departure | Male | Female |
| 12:00 AM to 4:59 AM | 0 (0.0%) | 0 (0.0%) |
| 5:00 AM to 5:29 AM | 35 (1.7%) | 18 (1.2%) |
| 5:30 AM to 5:59 AM | 87 (4.2%) | 13 (0.9%) |
| 6:00 AM to 6:29 AM | 107 (5.1%) | 31 (2.1%) |
| 6:30 AM to 6:59 AM | 100 (4.8%) | 84 (5.8%) |
| 7:00 AM to 7:29 AM | 398 (19.1%) | 101 (7.0%) |
| 7:30 AM to 7:59 AM | 371 (17.8%) | 137 (9.5%) |
| 8:00 AM to 8:29 AM | 364 (17.5%) | 626 (43.2%) |
| 8:30 AM to 8:59 AM | 117 (5.6%) | 134 (9.2%) |
| 9:00 AM to 9:59 AM | 156 (7.5%) | 176 (12.1%) |
| 10:00 AM to 10:59 AM | 34 (1.6%) | 37 (2.5%) |
| 11:00 AM to 11:59 AM | 121 (5.8%) | 0 (0.0%) |
| 12:00 PM to 3:59 PM | 120 (5.8%) | 0 (0.0%) |
| 4:00 PM to 11:59 PM | 69 (3.3%) | 93 (6.4%) |
| Total | 2,079 (100.0%) | 1,450 (100.0%) |
Housing Occupancy in Alamo Heights
Occupancy by Ownership in Alamo Heights
Of the total 3,037 dwellings in Alamo Heights, owner-occupied units account for 2,236 (73.6%), while renter-occupied units make up 801 (26.4%).
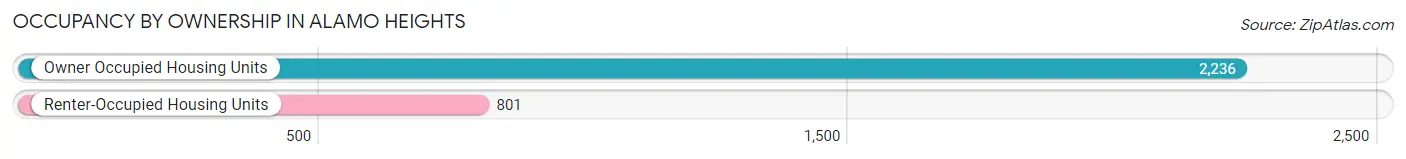
| Occupancy | # Housing Units | % Housing Units |
| Owner Occupied Housing Units | 2,236 | 73.6% |
| Renter-Occupied Housing Units | 801 | 26.4% |
| Total Occupied Housing Units | 3,037 | 100.0% |
Occupancy by Household Size in Alamo Heights
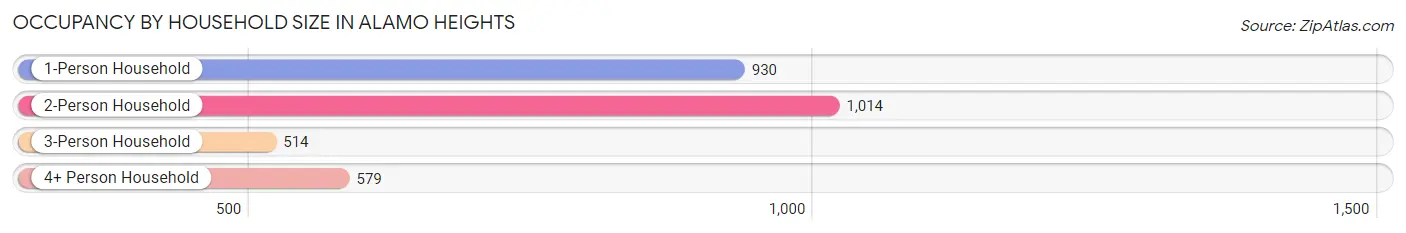
| Household Size | # Housing Units | % Housing Units |
| 1-Person Household | 930 | 30.6% |
| 2-Person Household | 1,014 | 33.4% |
| 3-Person Household | 514 | 16.9% |
| 4+ Person Household | 579 | 19.1% |
| Total Housing Units | 3,037 | 100.0% |
Occupancy by Ownership by Household Size in Alamo Heights
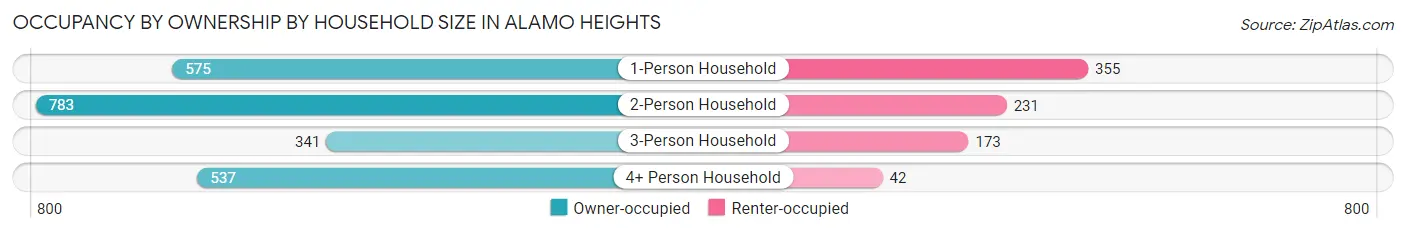
| Household Size | Owner-occupied | Renter-occupied |
| 1-Person Household | 575 (61.8%) | 355 (38.2%) |
| 2-Person Household | 783 (77.2%) | 231 (22.8%) |
| 3-Person Household | 341 (66.3%) | 173 (33.7%) |
| 4+ Person Household | 537 (92.7%) | 42 (7.2%) |
| Total Housing Units | 2,236 (73.6%) | 801 (26.4%) |
Occupancy by Educational Attainment in Alamo Heights
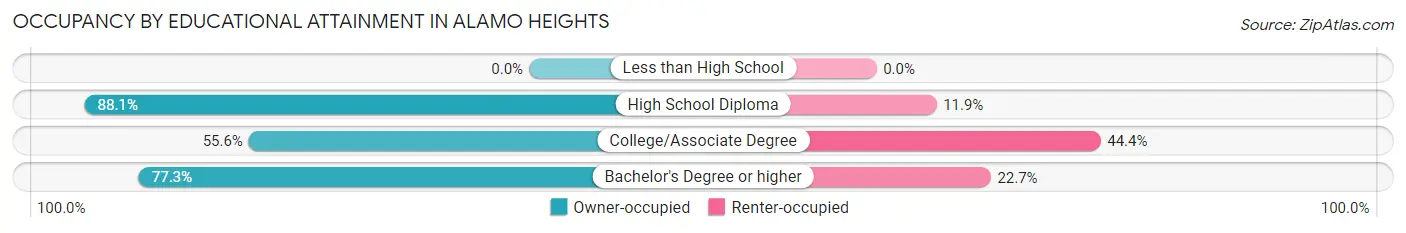
| Household Size | Owner-occupied | Renter-occupied |
| Less than High School | 0 (0.0%) | 0 (0.0%) |
| High School Diploma | 148 (88.1%) | 20 (11.9%) |
| College/Associate Degree | 334 (55.6%) | 267 (44.4%) |
| Bachelor's Degree or higher | 1,754 (77.3%) | 514 (22.7%) |
Occupancy by Age of Householder in Alamo Heights
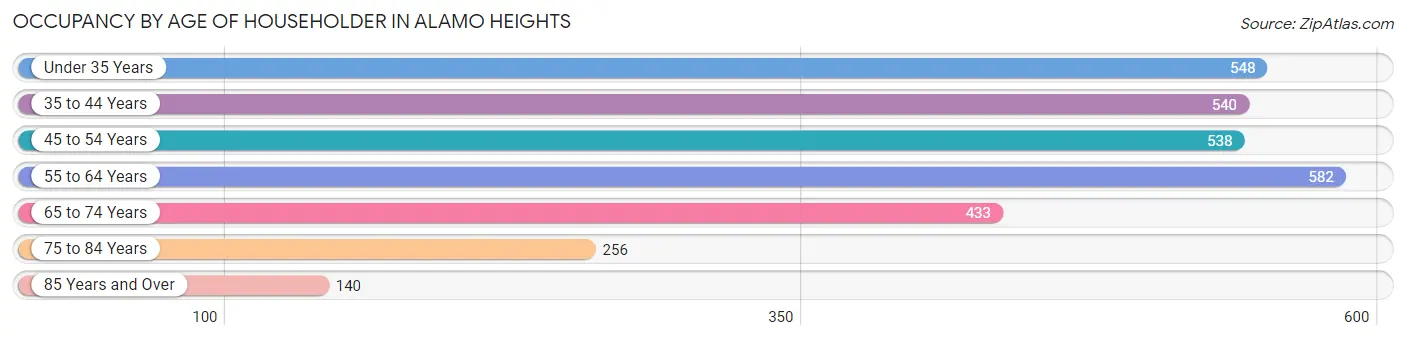
| Age Bracket | # Households | % Households |
| Under 35 Years | 548 | 18.0% |
| 35 to 44 Years | 540 | 17.8% |
| 45 to 54 Years | 538 | 17.7% |
| 55 to 64 Years | 582 | 19.2% |
| 65 to 74 Years | 433 | 14.3% |
| 75 to 84 Years | 256 | 8.4% |
| 85 Years and Over | 140 | 4.6% |
| Total | 3,037 | 100.0% |
Housing Finances in Alamo Heights
Median Income by Occupancy in Alamo Heights
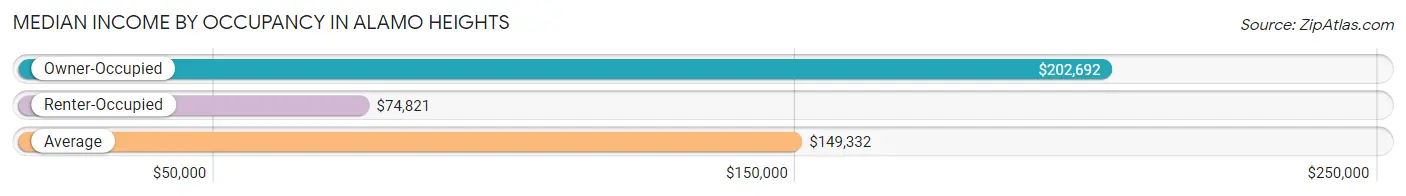
| Occupancy Type | # Households | Median Income |
| Owner-Occupied | 2,236 (73.6%) | $202,692 |
| Renter-Occupied | 801 (26.4%) | $74,821 |
| Average | 3,037 (100.0%) | $149,332 |
Occupancy by Householder Income Bracket in Alamo Heights
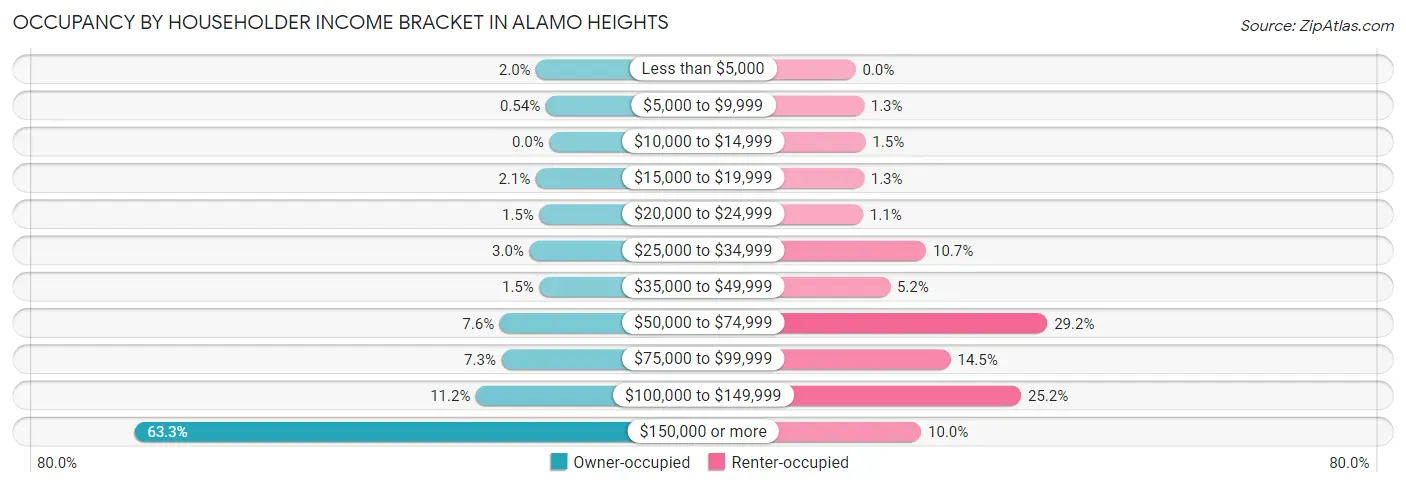
| Income Bracket | Owner-occupied | Renter-occupied |
| Less than $5,000 | 45 (2.0%) | 0 (0.0%) |
| $5,000 to $9,999 | 12 (0.5%) | 10 (1.3%) |
| $10,000 to $14,999 | 0 (0.0%) | 12 (1.5%) |
| $15,000 to $19,999 | 46 (2.1%) | 10 (1.3%) |
| $20,000 to $24,999 | 34 (1.5%) | 9 (1.1%) |
| $25,000 to $34,999 | 68 (3.0%) | 86 (10.7%) |
| $35,000 to $49,999 | 34 (1.5%) | 42 (5.2%) |
| $50,000 to $74,999 | 169 (7.6%) | 234 (29.2%) |
| $75,000 to $99,999 | 163 (7.3%) | 116 (14.5%) |
| $100,000 to $149,999 | 250 (11.2%) | 202 (25.2%) |
| $150,000 or more | 1,415 (63.3%) | 80 (10.0%) |
| Total | 2,236 (100.0%) | 801 (100.0%) |
Monthly Housing Cost Tiers in Alamo Heights
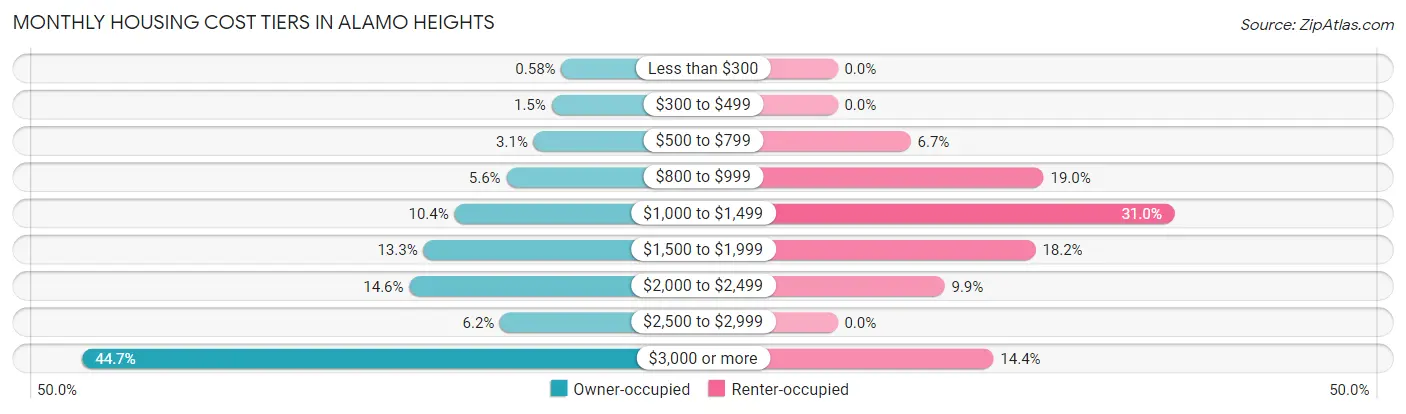
| Monthly Cost | Owner-occupied | Renter-occupied |
| Less than $300 | 13 (0.6%) | 0 (0.0%) |
| $300 to $499 | 33 (1.5%) | 0 (0.0%) |
| $500 to $799 | 70 (3.1%) | 54 (6.7%) |
| $800 to $999 | 126 (5.6%) | 152 (19.0%) |
| $1,000 to $1,499 | 233 (10.4%) | 248 (31.0%) |
| $1,500 to $1,999 | 297 (13.3%) | 146 (18.2%) |
| $2,000 to $2,499 | 326 (14.6%) | 79 (9.9%) |
| $2,500 to $2,999 | 139 (6.2%) | 0 (0.0%) |
| $3,000 or more | 999 (44.7%) | 115 (14.4%) |
| Total | 2,236 (100.0%) | 801 (100.0%) |
Physical Housing Characteristics in Alamo Heights
Housing Structures in Alamo Heights
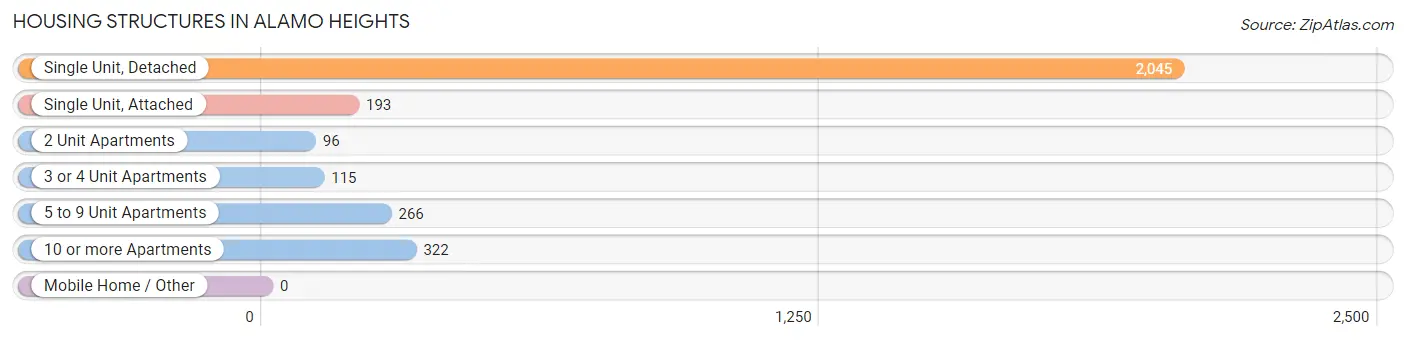
| Structure Type | # Housing Units | % Housing Units |
| Single Unit, Detached | 2,045 | 67.3% |
| Single Unit, Attached | 193 | 6.4% |
| 2 Unit Apartments | 96 | 3.2% |
| 3 or 4 Unit Apartments | 115 | 3.8% |
| 5 to 9 Unit Apartments | 266 | 8.8% |
| 10 or more Apartments | 322 | 10.6% |
| Mobile Home / Other | 0 | 0.0% |
| Total | 3,037 | 100.0% |
Housing Structures by Occupancy in Alamo Heights
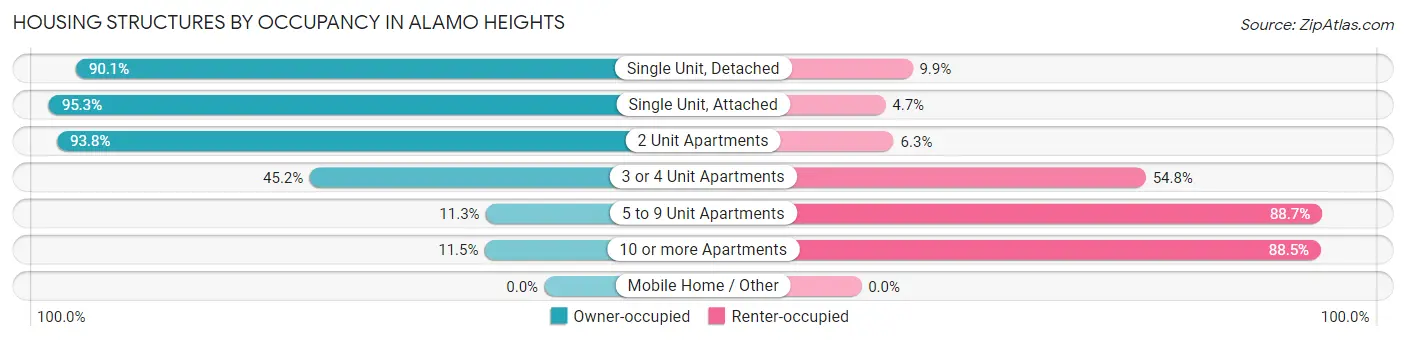
| Structure Type | Owner-occupied | Renter-occupied |
| Single Unit, Detached | 1,843 (90.1%) | 202 (9.9%) |
| Single Unit, Attached | 184 (95.3%) | 9 (4.7%) |
| 2 Unit Apartments | 90 (93.8%) | 6 (6.2%) |
| 3 or 4 Unit Apartments | 52 (45.2%) | 63 (54.8%) |
| 5 to 9 Unit Apartments | 30 (11.3%) | 236 (88.7%) |
| 10 or more Apartments | 37 (11.5%) | 285 (88.5%) |
| Mobile Home / Other | 0 (0.0%) | 0 (0.0%) |
| Total | 2,236 (73.6%) | 801 (26.4%) |
Housing Structures by Number of Rooms in Alamo Heights
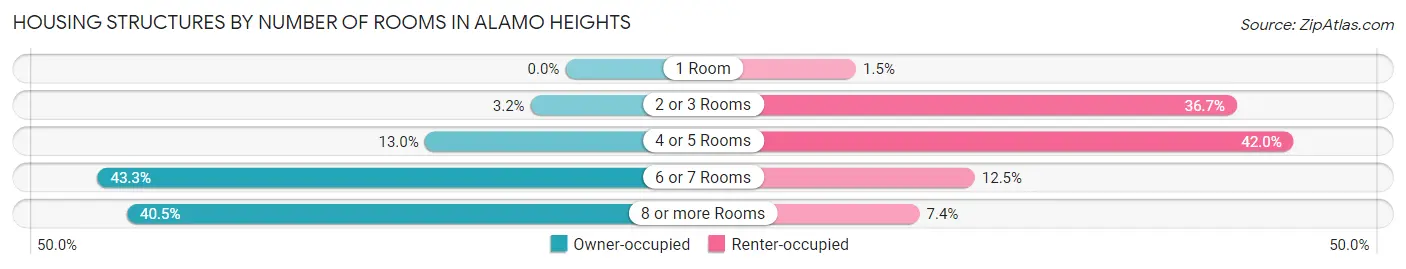
| Number of Rooms | Owner-occupied | Renter-occupied |
| 1 Room | 0 (0.0%) | 12 (1.5%) |
| 2 or 3 Rooms | 72 (3.2%) | 294 (36.7%) |
| 4 or 5 Rooms | 291 (13.0%) | 336 (41.9%) |
| 6 or 7 Rooms | 967 (43.2%) | 100 (12.5%) |
| 8 or more Rooms | 906 (40.5%) | 59 (7.4%) |
| Total | 2,236 (100.0%) | 801 (100.0%) |
Housing Structure by Heating Type in Alamo Heights
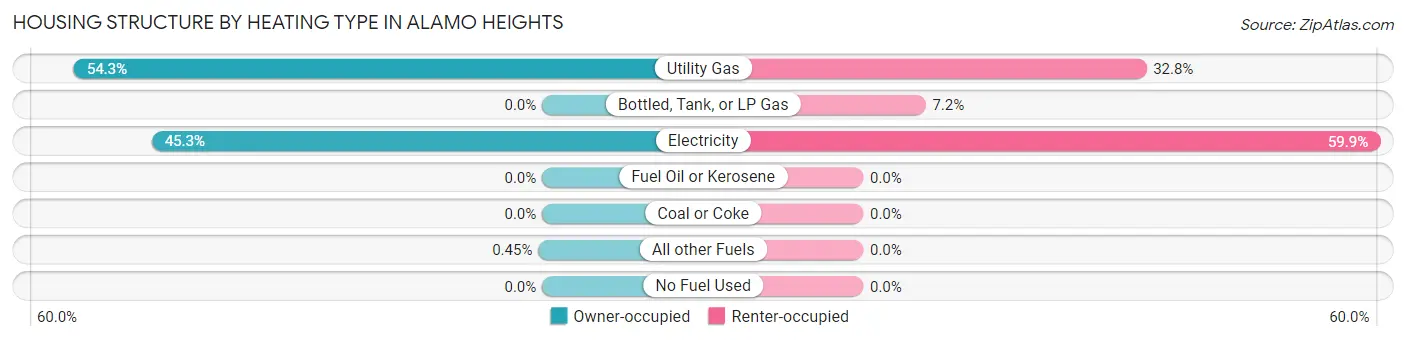
| Heating Type | Owner-occupied | Renter-occupied |
| Utility Gas | 1,214 (54.3%) | 263 (32.8%) |
| Bottled, Tank, or LP Gas | 0 (0.0%) | 58 (7.2%) |
| Electricity | 1,012 (45.3%) | 480 (59.9%) |
| Fuel Oil or Kerosene | 0 (0.0%) | 0 (0.0%) |
| Coal or Coke | 0 (0.0%) | 0 (0.0%) |
| All other Fuels | 10 (0.4%) | 0 (0.0%) |
| No Fuel Used | 0 (0.0%) | 0 (0.0%) |
| Total | 2,236 (100.0%) | 801 (100.0%) |
Household Vehicle Usage in Alamo Heights
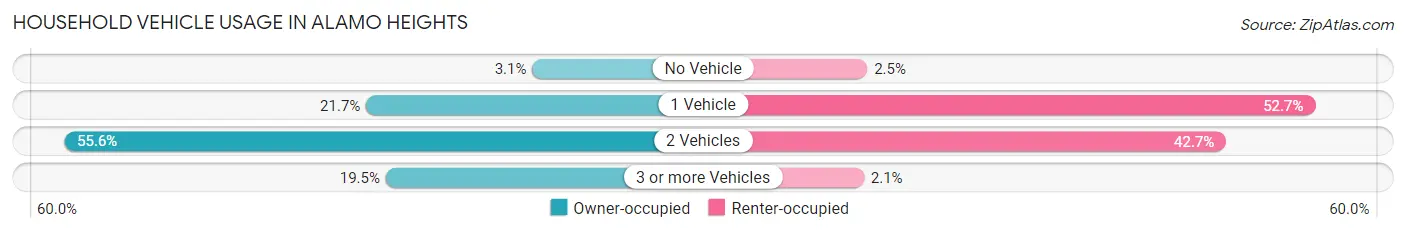
| Vehicles per Household | Owner-occupied | Renter-occupied |
| No Vehicle | 70 (3.1%) | 20 (2.5%) |
| 1 Vehicle | 486 (21.7%) | 422 (52.7%) |
| 2 Vehicles | 1,243 (55.6%) | 342 (42.7%) |
| 3 or more Vehicles | 437 (19.5%) | 17 (2.1%) |
| Total | 2,236 (100.0%) | 801 (100.0%) |
Real Estate & Mortgages in Alamo Heights
Real Estate and Mortgage Overview in Alamo Heights
| Characteristic | Without Mortgage | With Mortgage |
| Housing Units | 819 | 1,417 |
| Median Property Value | $706,800 | $703,400 |
| Median Household Income | $109,358 | $1,085 |
| Monthly Housing Costs | $1,501 | $956 |
| Real Estate Taxes | $10,001 | $77 |
Property Value by Mortgage Status in Alamo Heights
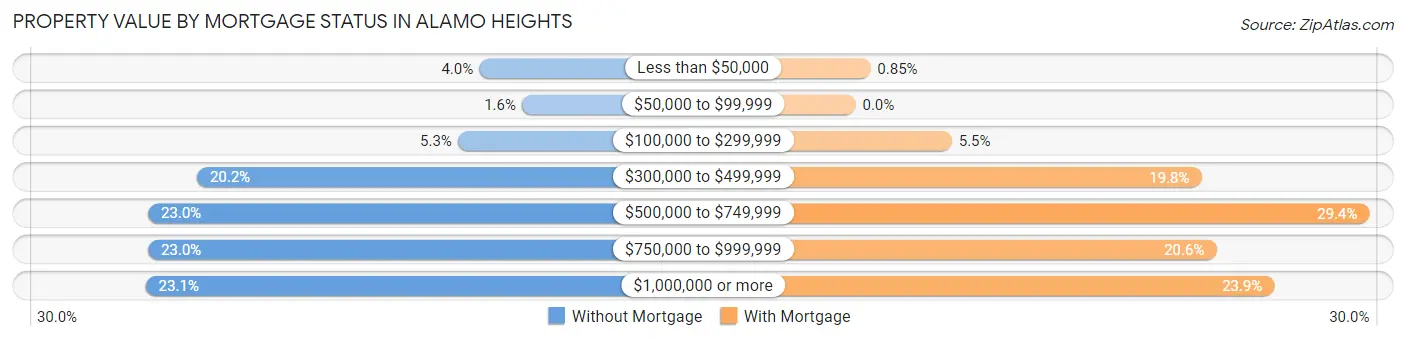
| Property Value | Without Mortgage | With Mortgage |
| Less than $50,000 | 33 (4.0%) | 12 (0.9%) |
| $50,000 to $99,999 | 13 (1.6%) | 0 (0.0%) |
| $100,000 to $299,999 | 43 (5.2%) | 78 (5.5%) |
| $300,000 to $499,999 | 165 (20.2%) | 280 (19.8%) |
| $500,000 to $749,999 | 188 (23.0%) | 416 (29.4%) |
| $750,000 to $999,999 | 188 (23.0%) | 292 (20.6%) |
| $1,000,000 or more | 189 (23.1%) | 339 (23.9%) |
| Total | 819 (100.0%) | 1,417 (100.0%) |
Household Income by Mortgage Status in Alamo Heights
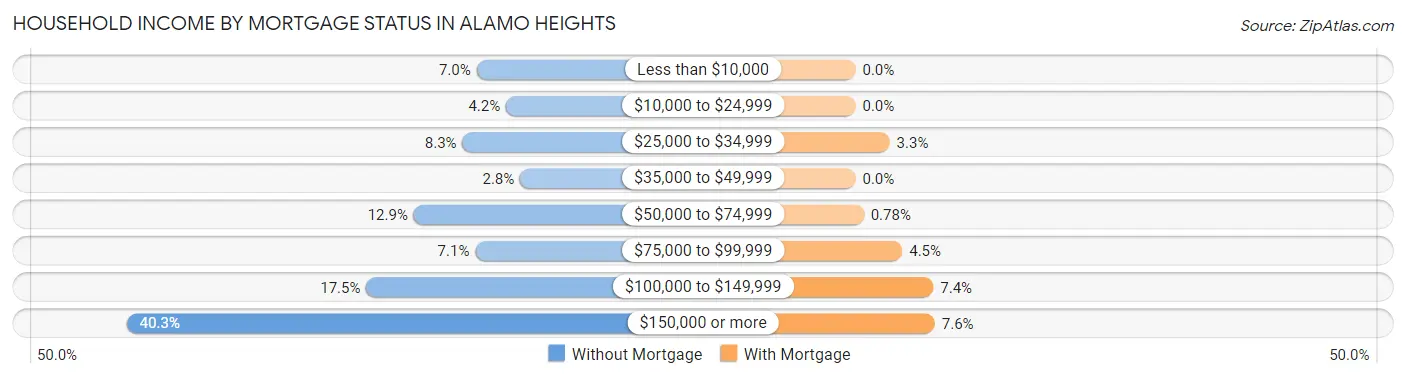
| Household Income | Without Mortgage | With Mortgage |
| Less than $10,000 | 57 (7.0%) | 0 (0.0%) |
| $10,000 to $24,999 | 34 (4.2%) | 0 (0.0%) |
| $25,000 to $34,999 | 68 (8.3%) | 46 (3.3%) |
| $35,000 to $49,999 | 23 (2.8%) | 0 (0.0%) |
| $50,000 to $74,999 | 106 (12.9%) | 11 (0.8%) |
| $75,000 to $99,999 | 58 (7.1%) | 63 (4.4%) |
| $100,000 to $149,999 | 143 (17.5%) | 105 (7.4%) |
| $150,000 or more | 330 (40.3%) | 107 (7.5%) |
| Total | 819 (100.0%) | 1,417 (100.0%) |
Property Value to Household Income Ratio in Alamo Heights
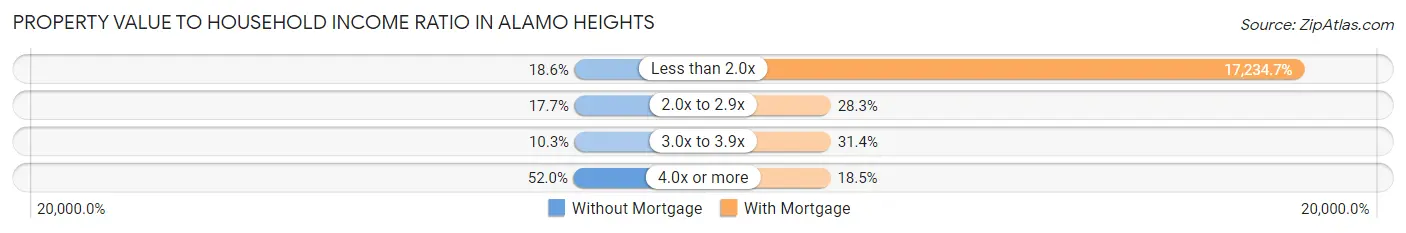
| Value-to-Income Ratio | Without Mortgage | With Mortgage |
| Less than 2.0x | 152 (18.6%) | 244,215 (17,234.6%) |
| 2.0x to 2.9x | 145 (17.7%) | 401 (28.3%) |
| 3.0x to 3.9x | 84 (10.3%) | 445 (31.4%) |
| 4.0x or more | 426 (52.0%) | 262 (18.5%) |
| Total | 819 (100.0%) | 1,417 (100.0%) |
Real Estate Taxes by Mortgage Status in Alamo Heights
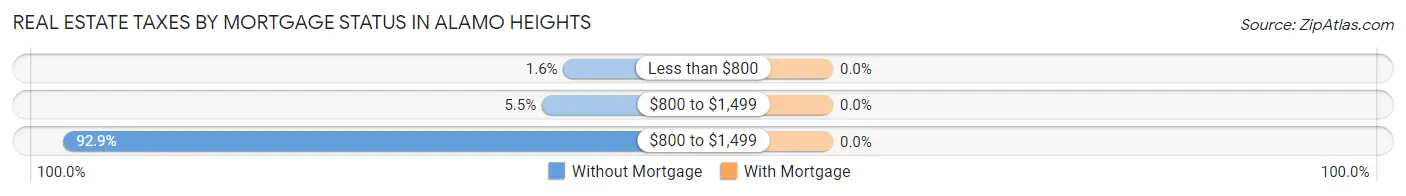
| Property Taxes | Without Mortgage | With Mortgage |
| Less than $800 | 13 (1.6%) | 0 (0.0%) |
| $800 to $1,499 | 45 (5.5%) | 0 (0.0%) |
| $800 to $1,499 | 761 (92.9%) | 0 (0.0%) |
| Total | 819 (100.0%) | 1,417 (100.0%) |
Health & Disability in Alamo Heights
Health Insurance Coverage by Age in Alamo Heights
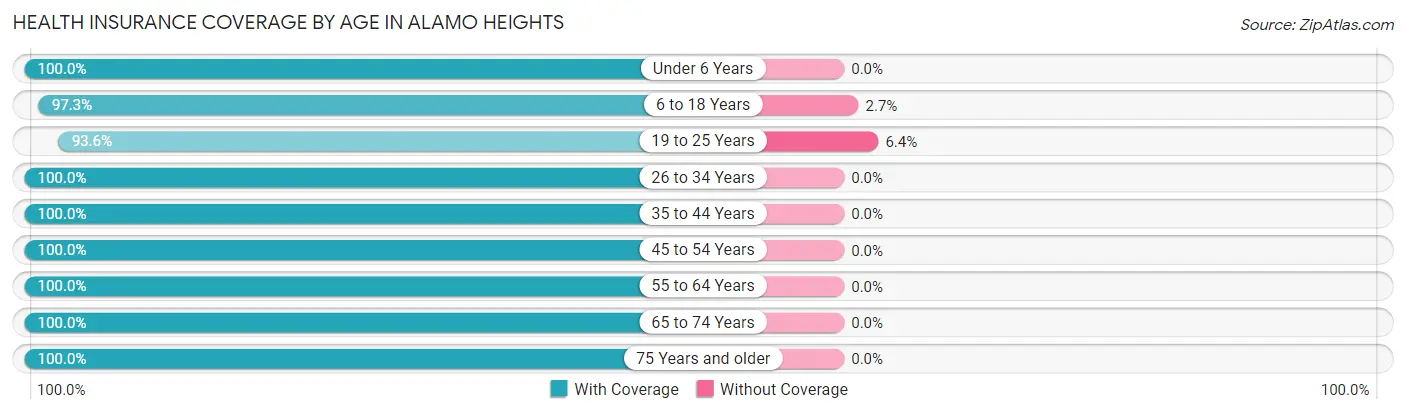
| Age Bracket | With Coverage | Without Coverage |
| Under 6 Years | 346 (100.0%) | 0 (0.0%) |
| 6 to 18 Years | 1,392 (97.3%) | 38 (2.7%) |
| 19 to 25 Years | 500 (93.6%) | 34 (6.4%) |
| 26 to 34 Years | 838 (100.0%) | 0 (0.0%) |
| 35 to 44 Years | 1,057 (100.0%) | 0 (0.0%) |
| 45 to 54 Years | 862 (100.0%) | 0 (0.0%) |
| 55 to 64 Years | 1,046 (100.0%) | 0 (0.0%) |
| 65 to 74 Years | 619 (100.0%) | 0 (0.0%) |
| 75 Years and older | 548 (100.0%) | 0 (0.0%) |
| Total | 7,208 (99.0%) | 72 (1.0%) |
Health Insurance Coverage by Citizenship Status in Alamo Heights
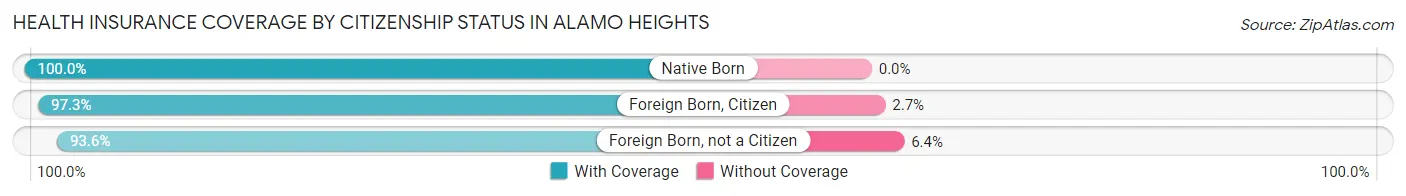
| Citizenship Status | With Coverage | Without Coverage |
| Native Born | 346 (100.0%) | 0 (0.0%) |
| Foreign Born, Citizen | 1,392 (97.3%) | 38 (2.7%) |
| Foreign Born, not a Citizen | 500 (93.6%) | 34 (6.4%) |
Health Insurance Coverage by Household Income in Alamo Heights
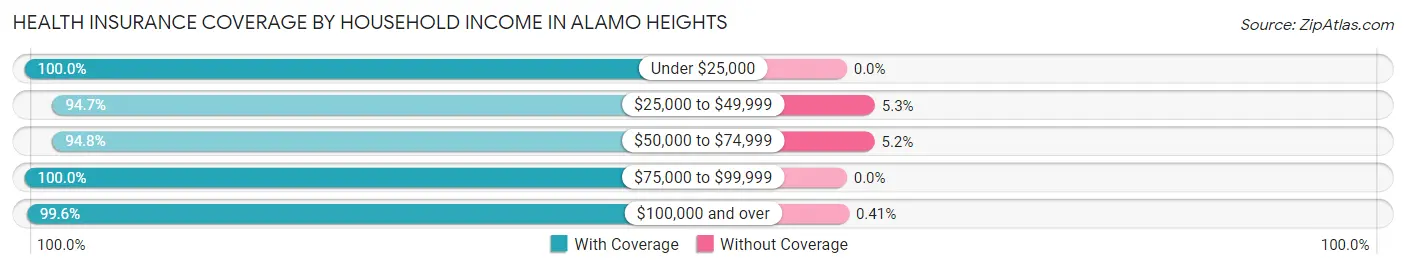
| Household Income | With Coverage | Without Coverage |
| Under $25,000 | 178 (100.0%) | 0 (0.0%) |
| $25,000 to $49,999 | 270 (94.7%) | 15 (5.3%) |
| $50,000 to $74,999 | 620 (94.8%) | 34 (5.2%) |
| $75,000 to $99,999 | 584 (100.0%) | 0 (0.0%) |
| $100,000 and over | 5,532 (99.6%) | 23 (0.4%) |
Public vs Private Health Insurance Coverage by Age in Alamo Heights
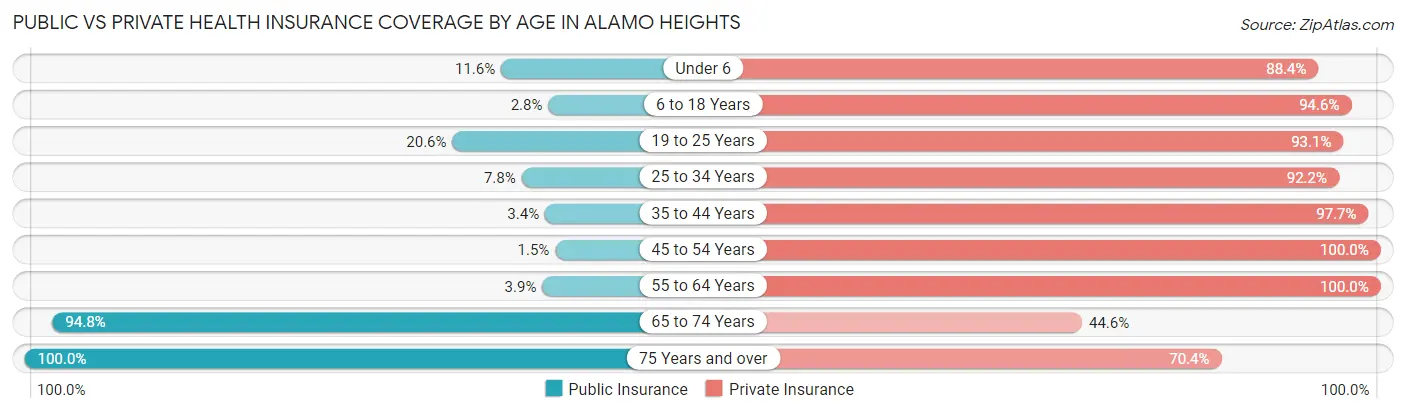
| Age Bracket | Public Insurance | Private Insurance |
| Under 6 | 40 (11.6%) | 306 (88.4%) |
| 6 to 18 Years | 40 (2.8%) | 1,352 (94.6%) |
| 19 to 25 Years | 110 (20.6%) | 497 (93.1%) |
| 25 to 34 Years | 65 (7.8%) | 773 (92.2%) |
| 35 to 44 Years | 36 (3.4%) | 1,033 (97.7%) |
| 45 to 54 Years | 13 (1.5%) | 862 (100.0%) |
| 55 to 64 Years | 41 (3.9%) | 1,046 (100.0%) |
| 65 to 74 Years | 587 (94.8%) | 276 (44.6%) |
| 75 Years and over | 548 (100.0%) | 386 (70.4%) |
| Total | 1,480 (20.3%) | 6,531 (89.7%) |
Disability Status by Sex by Age in Alamo Heights
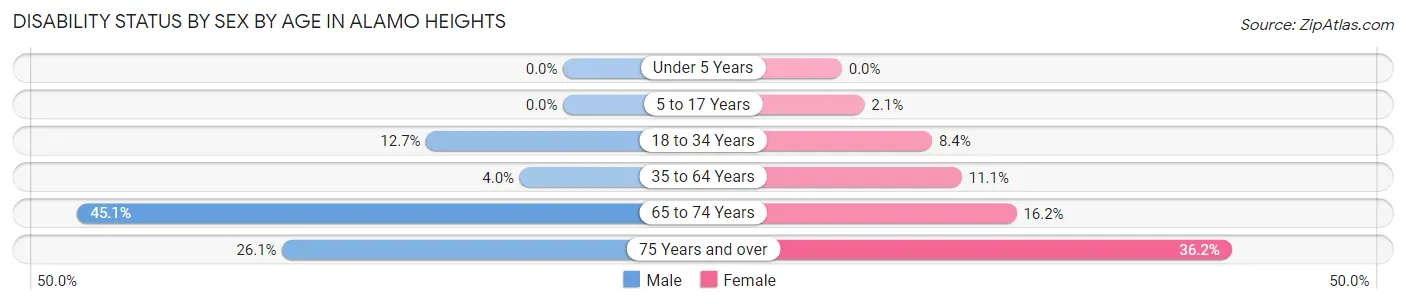
| Age Bracket | Male | Female |
| Under 5 Years | 0 (0.0%) | 0 (0.0%) |
| 5 to 17 Years | 0 (0.0%) | 16 (2.1%) |
| 18 to 34 Years | 107 (12.7%) | 54 (8.4%) |
| 35 to 64 Years | 54 (4.0%) | 181 (11.1%) |
| 65 to 74 Years | 165 (45.1%) | 41 (16.2%) |
| 75 Years and over | 91 (26.1%) | 72 (36.2%) |
Disability Class by Sex by Age in Alamo Heights
Disability Class: Hearing Difficulty
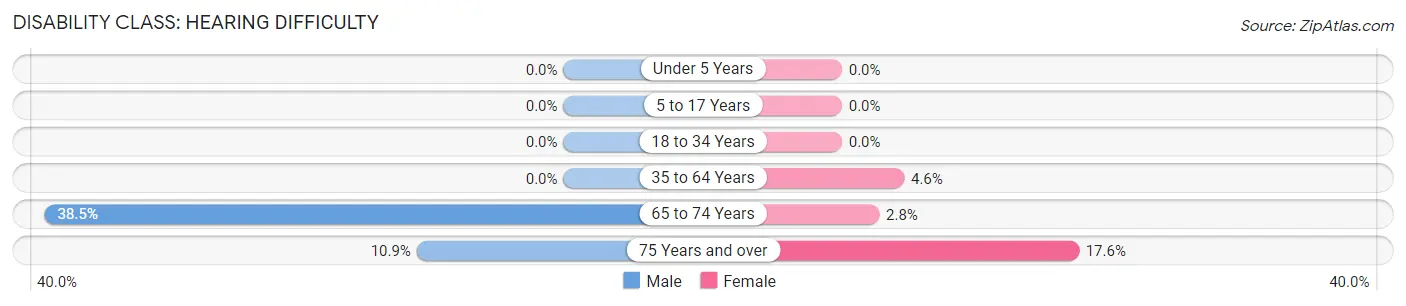
| Age Bracket | Male | Female |
| Under 5 Years | 0 (0.0%) | 0 (0.0%) |
| 5 to 17 Years | 0 (0.0%) | 0 (0.0%) |
| 18 to 34 Years | 0 (0.0%) | 0 (0.0%) |
| 35 to 64 Years | 0 (0.0%) | 75 (4.6%) |
| 65 to 74 Years | 141 (38.5%) | 7 (2.8%) |
| 75 Years and over | 38 (10.9%) | 35 (17.6%) |
Disability Class: Vision Difficulty
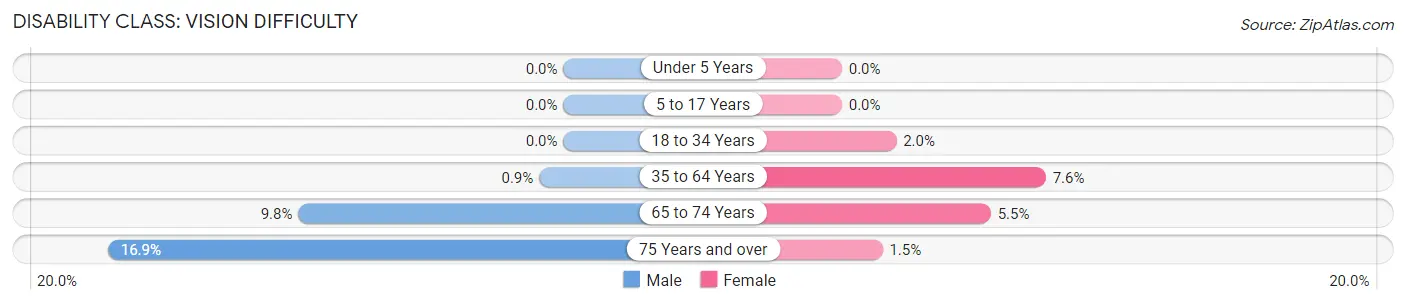
| Age Bracket | Male | Female |
| Under 5 Years | 0 (0.0%) | 0 (0.0%) |
| 5 to 17 Years | 0 (0.0%) | 0 (0.0%) |
| 18 to 34 Years | 0 (0.0%) | 13 (2.0%) |
| 35 to 64 Years | 12 (0.9%) | 123 (7.6%) |
| 65 to 74 Years | 36 (9.8%) | 14 (5.5%) |
| 75 Years and over | 59 (16.9%) | 3 (1.5%) |
Disability Class: Cognitive Difficulty
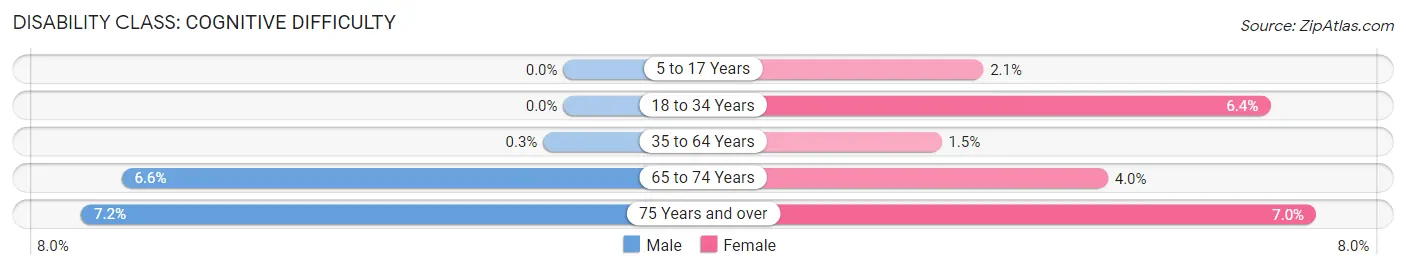
| Age Bracket | Male | Female |
| 5 to 17 Years | 0 (0.0%) | 16 (2.1%) |
| 18 to 34 Years | 0 (0.0%) | 41 (6.4%) |
| 35 to 64 Years | 4 (0.3%) | 24 (1.5%) |
| 65 to 74 Years | 24 (6.6%) | 10 (4.0%) |
| 75 Years and over | 25 (7.2%) | 14 (7.0%) |
Disability Class: Ambulatory Difficulty
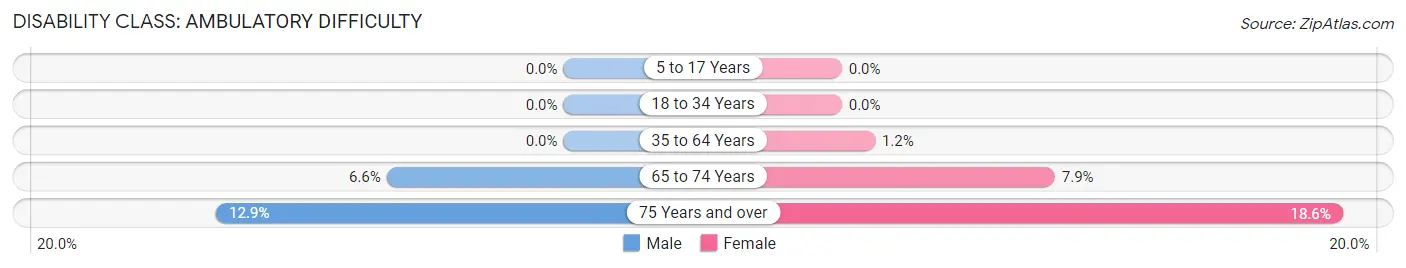
| Age Bracket | Male | Female |
| 5 to 17 Years | 0 (0.0%) | 0 (0.0%) |
| 18 to 34 Years | 0 (0.0%) | 0 (0.0%) |
| 35 to 64 Years | 0 (0.0%) | 20 (1.2%) |
| 65 to 74 Years | 24 (6.6%) | 20 (7.9%) |
| 75 Years and over | 45 (12.9%) | 37 (18.6%) |
Disability Class: Self-Care Difficulty
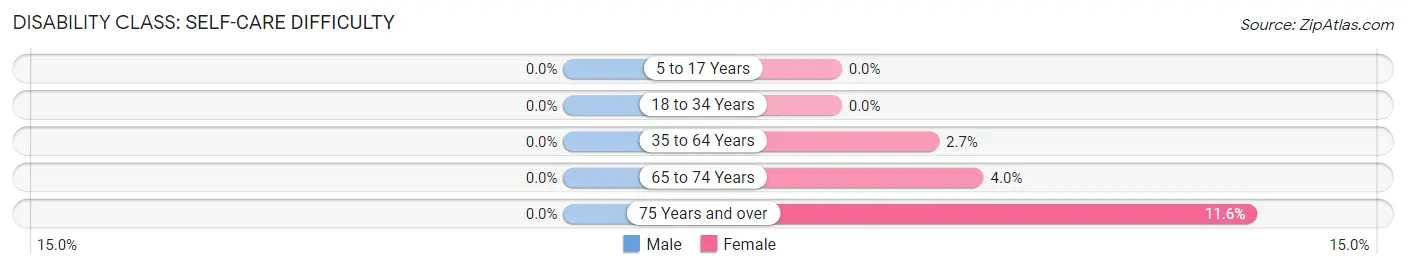
| Age Bracket | Male | Female |
| 5 to 17 Years | 0 (0.0%) | 0 (0.0%) |
| 18 to 34 Years | 0 (0.0%) | 0 (0.0%) |
| 35 to 64 Years | 0 (0.0%) | 44 (2.7%) |
| 65 to 74 Years | 0 (0.0%) | 10 (4.0%) |
| 75 Years and over | 0 (0.0%) | 23 (11.6%) |
Technology Access in Alamo Heights
Computing Device Access in Alamo Heights
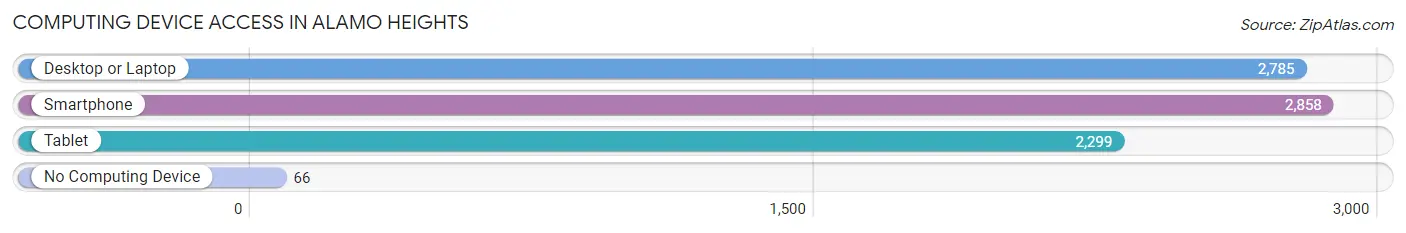
| Device Type | # Households | % Households |
| Desktop or Laptop | 2,785 | 91.7% |
| Smartphone | 2,858 | 94.1% |
| Tablet | 2,299 | 75.7% |
| No Computing Device | 66 | 2.2% |
| Total | 3,037 | 100.0% |
Internet Access in Alamo Heights
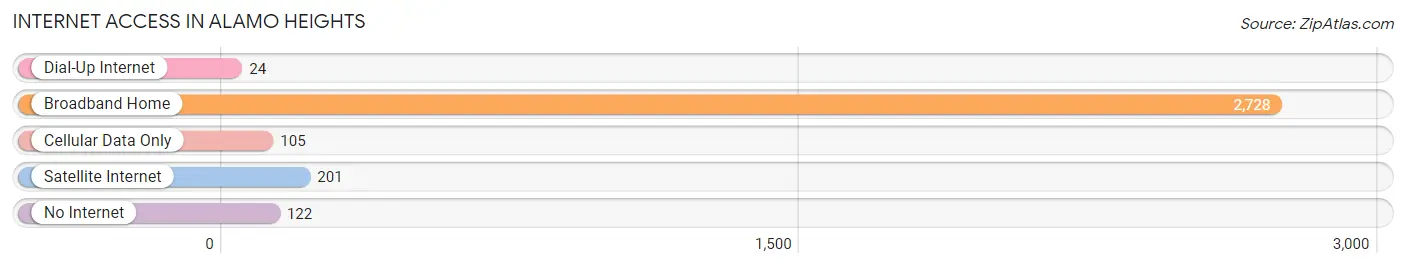
| Internet Type | # Households | % Households |
| Dial-Up Internet | 24 | 0.8% |
| Broadband Home | 2,728 | 89.8% |
| Cellular Data Only | 105 | 3.5% |
| Satellite Internet | 201 | 6.6% |
| No Internet | 122 | 4.0% |
| Total | 3,037 | 100.0% |
Alamo Heights Summary
Alamo Heights is a city located in Bexar County, Texas, United States. It is an enclave of San Antonio and is part of the San Antonio Metropolitan Statistical Area. The city had a population of 7,031 as of the 2010 census.
History
Alamo Heights was founded in 1922 by a group of investors who purchased the land from the Dickson-Trueman family. The city was named after the Alamo, which is located in nearby San Antonio. The city was incorporated in 1924 and has since grown to become one of the most affluent suburbs of San Antonio.
Geography
Alamo Heights is located at 29°29′N 98°30′W (29.48, -98.50). It is bordered by the cities of San Antonio, Terrell Hills, Olmos Park, and Windcrest. The city has a total area of 2.2 square miles, all of which is land.
Economy
Alamo Heights is home to a variety of businesses, including retail stores, restaurants, and professional services. The city is also home to several corporate headquarters, including Valero Energy Corporation, USAA, and H-E-B Grocery.
Demographics
As of the 2010 census, there were 7,031 people, 2,845 households, and 1,945 families residing in the city. The population density was 3,179.3 people per square mile. The racial makeup of the city was 87.2% White, 4.3% African American, 0.3% Native American, 4.2% Asian, 0.1% Pacific Islander, 2.2% from other races, and 1.7% from two or more races. Hispanic or Latino of any race were 8.7% of the population.
The median income for a household in the city was $90,945, and the median income for a family was $106,945. Males had a median income of $76,945 versus $50,945 for females. The per capita income for the city was $45,945. About 2.2% of families and 3.2% of the population were below the poverty line, including 3.7% of those under age 18 and 2.2% of those age 65 or over.
Conclusion
Alamo Heights is a city located in Bexar County, Texas, United States. It is an affluent suburb of San Antonio and is part of the San Antonio Metropolitan Statistical Area. The city had a population of 7,031 as of the 2010 census. Alamo Heights was founded in 1922 and has since grown to become one of the most affluent suburbs of San Antonio. The city is home to a variety of businesses, including retail stores, restaurants, and professional services. The city is also home to several corporate headquarters, including Valero Energy Corporation, USAA, and H-E-B Grocery. As of the 2010 census, the population of Alamo Heights was 87.2% White, 4.3% African American, 0.3% Native American, 4.2% Asian, 0.1% Pacific Islander, 2.2% from other races, and 1.7% from two or more races. The median income for a household in the city was $90,945, and the median income for a family was $106,945.
Common Questions
What is Per Capita Income in Alamo Heights?
Per Capita income in Alamo Heights is $105,887.
What is the Median Family Income in Alamo Heights?
Median Family Income in Alamo Heights is $234,839.
What is the Median Household income in Alamo Heights?
Median Household Income in Alamo Heights is $149,332.
What is Income or Wage Gap in Alamo Heights?
Income or Wage Gap in Alamo Heights is 36.6%.
Women in Alamo Heights earn 63.4 cents for every dollar earned by a man.
What is Inequality or Gini Index in Alamo Heights?
Inequality or Gini Index in Alamo Heights is 0.55.
What is the Total Population of Alamo Heights?
Total Population of Alamo Heights is 7,417.
What is the Total Male Population of Alamo Heights?
Total Male Population of Alamo Heights is 3,697.
What is the Total Female Population of Alamo Heights?
Total Female Population of Alamo Heights is 3,720.
What is the Ratio of Males per 100 Females in Alamo Heights?
There are 99.38 Males per 100 Females in Alamo Heights.
What is the Ratio of Females per 100 Males in Alamo Heights?
There are 100.62 Females per 100 Males in Alamo Heights.
What is the Median Population Age in Alamo Heights?
Median Population Age in Alamo Heights is 40.7 Years.
What is the Average Family Size in Alamo Heights
Average Family Size in Alamo Heights is 3.1 People.
What is the Average Household Size in Alamo Heights
Average Household Size in Alamo Heights is 2.4 People.
How Large is the Labor Force in Alamo Heights?
There are 4,140 People in the Labor Forcein in Alamo Heights.
What is the Percentage of People in the Labor Force in Alamo Heights?
69.6% of People are in the Labor Force in Alamo Heights.
What is the Unemployment Rate in Alamo Heights?
Unemployment Rate in Alamo Heights is 1.1%.