Zip Codes with the Highest Percentage of Population Employed in Architecture & Engineering in Wichita Falls, TX
RELATED REPORTS & OPTIONS
Architecture & Engineering
Wichita Falls
Compare Zip Codes
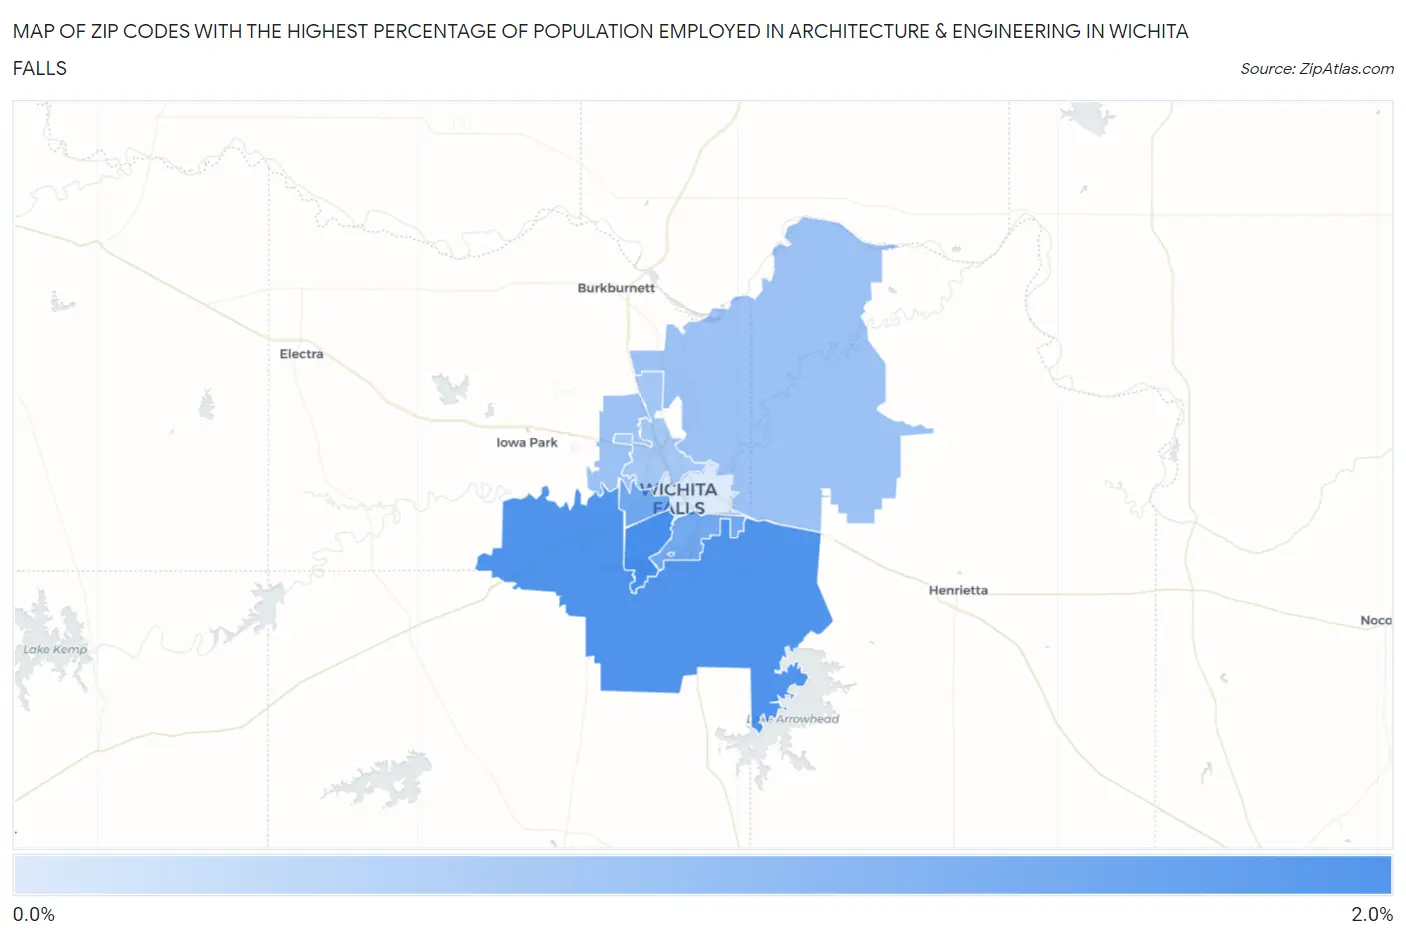
Map of Zip Codes with the Highest Percentage of Population Employed in Architecture & Engineering in Wichita Falls
0.060%
1.5%
Zip Codes with the Highest Percentage of Population Employed in Architecture & Engineering in Wichita Falls, TX
| Zip Code | % Employed | vs State | vs National | |
| 1. | 76308 | 1.5% | 2.2%(-0.719)#705 | 2.1%(-0.646)#12,860 |
| 2. | 76310 | 1.4% | 2.2%(-0.800)#736 | 2.1%(-0.727)#13,416 |
| 3. | 76309 | 1.1% | 2.2%(-1.13)#849 | 2.1%(-1.06)#15,929 |
| 4. | 76302 | 1.1% | 2.2%(-1.14)#860 | 2.1%(-1.07)#16,042 |
| 5. | 76305 | 0.70% | 2.2%(-1.52)#1,039 | 2.1%(-1.45)#18,910 |
| 6. | 76306 | 0.60% | 2.2%(-1.62)#1,087 | 2.1%(-1.55)#19,599 |
| 7. | 76301 | 0.060% | 2.2%(-2.16)#1,291 | 2.1%(-2.09)#22,447 |
1
Common Questions
What are the Top 5 Zip Codes with the Highest Percentage of Population Employed in Architecture & Engineering in Wichita Falls, TX?
Top 5 Zip Codes with the Highest Percentage of Population Employed in Architecture & Engineering in Wichita Falls, TX are:
What zip code has the Highest Percentage of Population Employed in Architecture & Engineering in Wichita Falls, TX?
76308 has the Highest Percentage of Population Employed in Architecture & Engineering in Wichita Falls, TX with 1.5%.
What is the Percentage of Population Employed in Architecture & Engineering in Wichita Falls, TX?
Percentage of Population Employed in Architecture & Engineering in Wichita Falls is 0.98%.
What is the Percentage of Population Employed in Architecture & Engineering in Texas?
Percentage of Population Employed in Architecture & Engineering in Texas is 2.2%.
What is the Percentage of Population Employed in Architecture & Engineering in the United States?
Percentage of Population Employed in Architecture & Engineering in the United States is 2.1%.