Coyote Acres, TX Map & Demographics
Coyote Acres Map
Coyote Acres Overview
$35,820
PER CAPITA INCOME
$90,972
AVG FAMILY INCOME
$90,509
AVG HOUSEHOLD INCOME
82.5%
WAGE / INCOME GAP [ % ]
17.5¢/ $1
WAGE / INCOME GAP [ $ ]
0.49
INEQUALITY / GINI INDEX
678
TOTAL POPULATION
377
MALE POPULATION
301
FEMALE POPULATION
125.25
MALES / 100 FEMALES
79.84
FEMALES / 100 MALES
34.3
MEDIAN AGE
5.3
AVG FAMILY SIZE
5.0
AVG HOUSEHOLD SIZE
284
LABOR FORCE [ PEOPLE ]
63.8%
PERCENT IN LABOR FORCE
10.6%
UNEMPLOYMENT RATE
Income in Coyote Acres
Income Overview in Coyote Acres
Per Capita Income in Coyote Acres is $35,820, while median incomes of families and households are $90,972 and $90,509 respectively.
| Characteristic | Number | Measure |
| Per Capita Income | 678 | $35,820 |
| Median Family Income | 127 | $90,972 |
| Mean Family Income | 127 | $158,039 |
| Median Household Income | 137 | $90,509 |
| Mean Household Income | 137 | $148,433 |
| Income Deficit | 127 | $0 |
| Wage / Income Gap (%) | 678 | 82.53% |
| Wage / Income Gap ($) | 678 | 17.47¢ per $1 |
| Gini / Inequality Index | 678 | 0.49 |
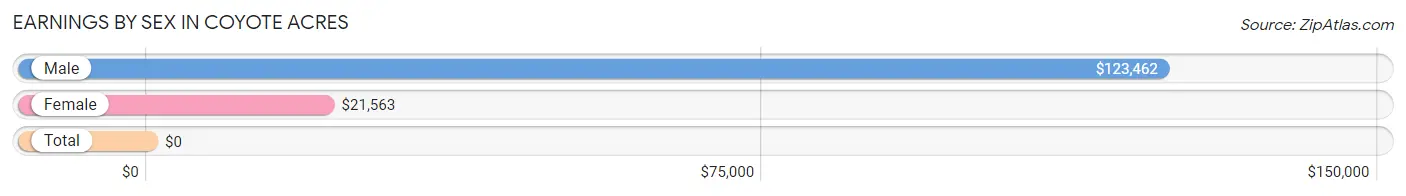
Earnings by Sex in Coyote Acres
| Sex | Number | Average Earnings |
| Male | 108 (36.9%) | $123,462 |
| Female | 185 (63.1%) | $21,563 |
| Total | 293 (100.0%) | $0 |
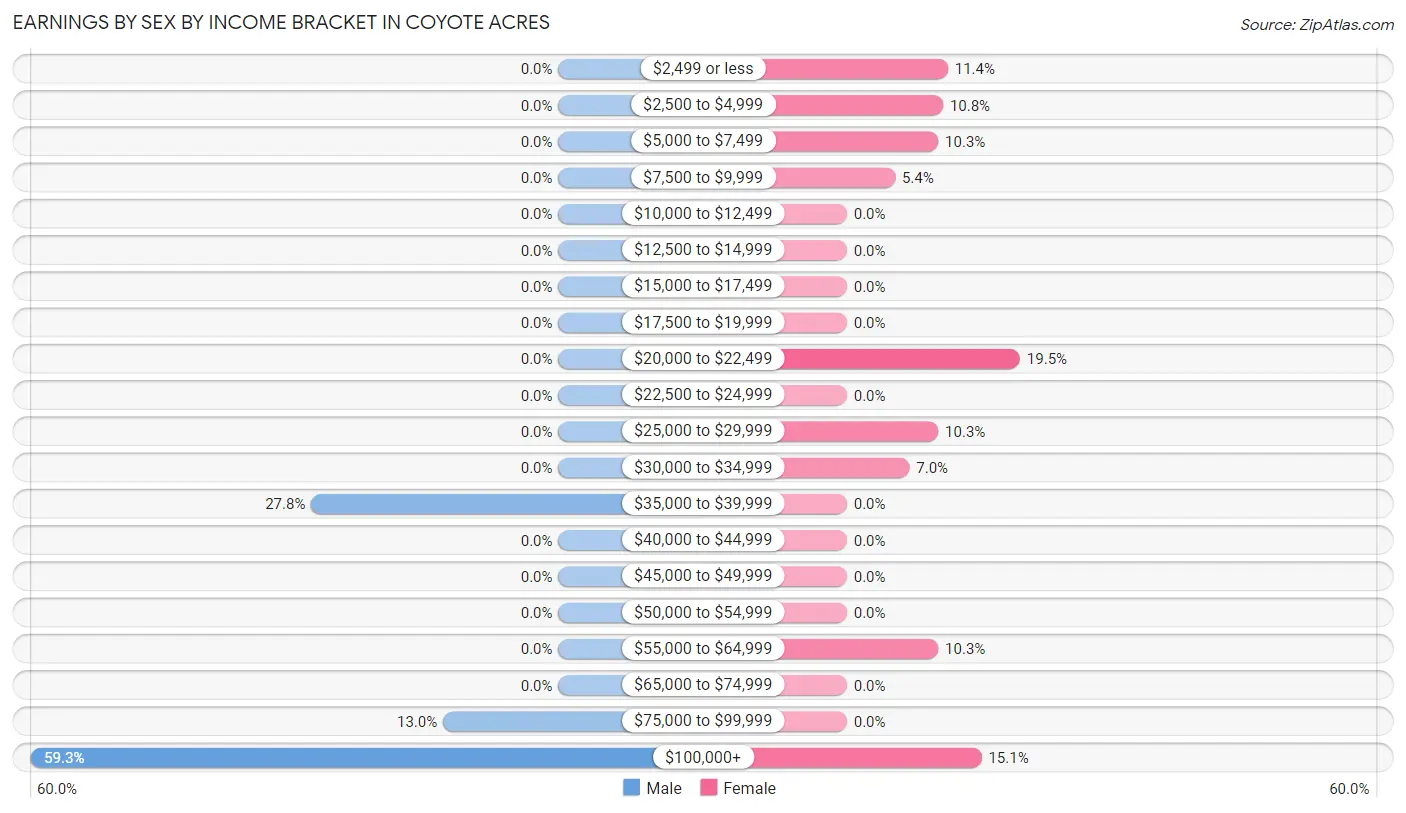
Earnings by Sex by Income Bracket in Coyote Acres
The most common earnings brackets in Coyote Acres are $100,000+ for men (64 | 59.3%) and $20,000 to $22,499 for women (36 | 19.5%).
| Income | Male | Female |
| $2,499 or less | 0 (0.0%) | 21 (11.4%) |
| $2,500 to $4,999 | 0 (0.0%) | 20 (10.8%) |
| $5,000 to $7,499 | 0 (0.0%) | 19 (10.3%) |
| $7,500 to $9,999 | 0 (0.0%) | 10 (5.4%) |
| $10,000 to $12,499 | 0 (0.0%) | 0 (0.0%) |
| $12,500 to $14,999 | 0 (0.0%) | 0 (0.0%) |
| $15,000 to $17,499 | 0 (0.0%) | 0 (0.0%) |
| $17,500 to $19,999 | 0 (0.0%) | 0 (0.0%) |
| $20,000 to $22,499 | 0 (0.0%) | 36 (19.5%) |
| $22,500 to $24,999 | 0 (0.0%) | 0 (0.0%) |
| $25,000 to $29,999 | 0 (0.0%) | 19 (10.3%) |
| $30,000 to $34,999 | 0 (0.0%) | 13 (7.0%) |
| $35,000 to $39,999 | 30 (27.8%) | 0 (0.0%) |
| $40,000 to $44,999 | 0 (0.0%) | 0 (0.0%) |
| $45,000 to $49,999 | 0 (0.0%) | 0 (0.0%) |
| $50,000 to $54,999 | 0 (0.0%) | 0 (0.0%) |
| $55,000 to $64,999 | 0 (0.0%) | 19 (10.3%) |
| $65,000 to $74,999 | 0 (0.0%) | 0 (0.0%) |
| $75,000 to $99,999 | 14 (13.0%) | 0 (0.0%) |
| $100,000+ | 64 (59.3%) | 28 (15.1%) |
| Total | 108 (100.0%) | 185 (100.0%) |
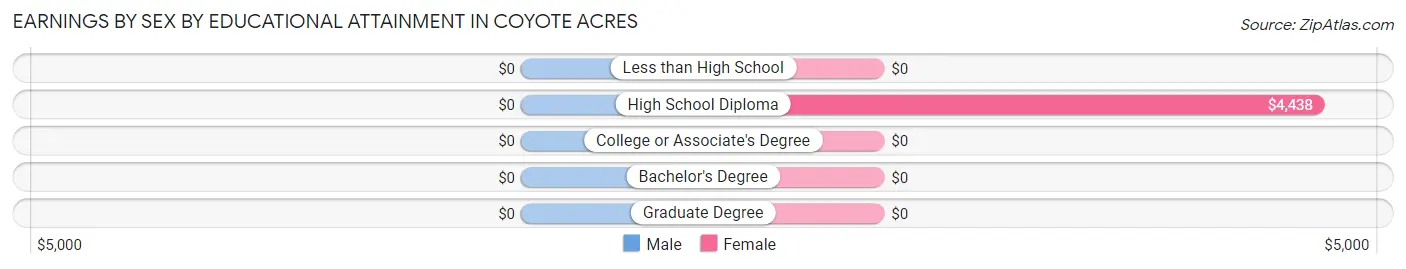
Earnings by Sex by Educational Attainment in Coyote Acres
| Educational Attainment | Male Income | Female Income |
| Less than High School | - | - |
| High School Diploma | - | - |
| College or Associate's Degree | - | - |
| Bachelor's Degree | - | - |
| Graduate Degree | - | - |
| Total | $123,462 | $0 |
Family Income in Coyote Acres
Family Income Brackets in Coyote Acres
According to the Coyote Acres family income data, there are 51 families falling into the $75,000 to $99,999 income range, which is the most common income bracket and makes up 40.2% of all families.
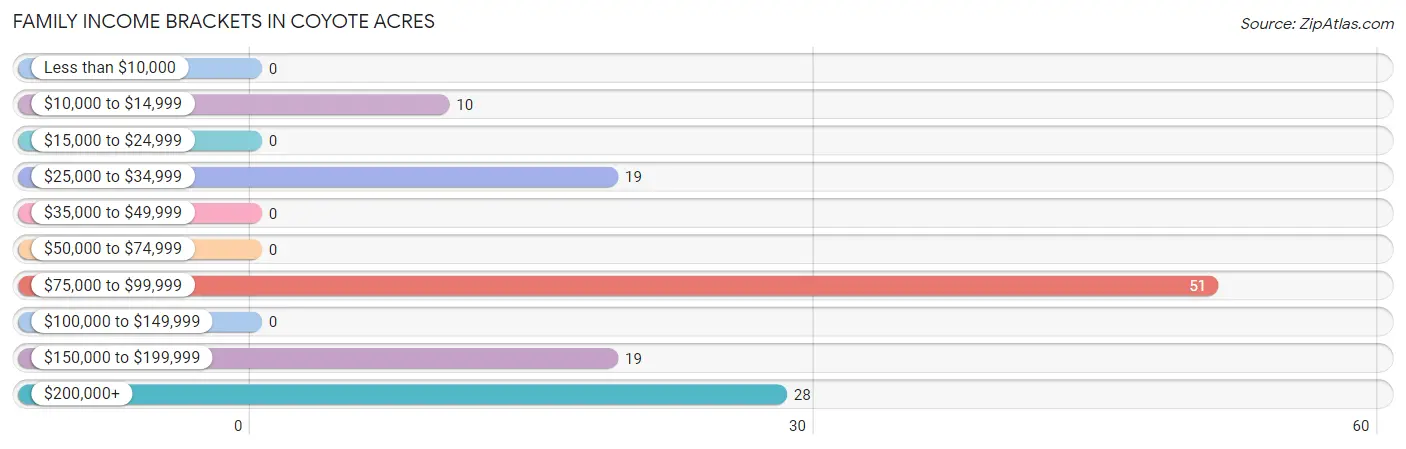
| Income Bracket | # Families | % Families |
| Less than $10,000 | 0 | 0.0% |
| $10,000 to $14,999 | 10 | 7.9% |
| $15,000 to $24,999 | 0 | 0.0% |
| $25,000 to $34,999 | 19 | 15.0% |
| $35,000 to $49,999 | 0 | 0.0% |
| $50,000 to $74,999 | 0 | 0.0% |
| $75,000 to $99,999 | 51 | 40.2% |
| $100,000 to $149,999 | 0 | 0.0% |
| $150,000 to $199,999 | 19 | 15.0% |
| $200,000+ | 28 | 22.0% |
Family Income by Famaliy Size in Coyote Acres
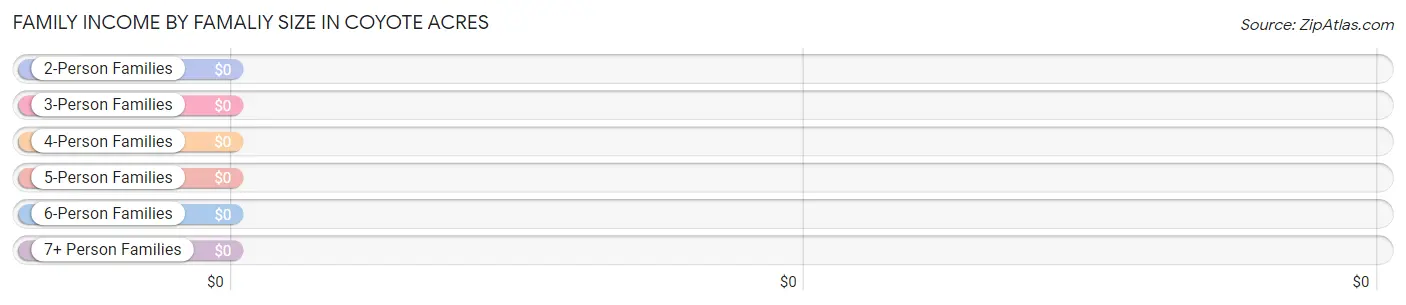
| Income Bracket | # Families | Median Income |
| 2-Person Families | 43 (33.9%) | $0 |
| 3-Person Families | 28 (22.1%) | $0 |
| 4-Person Families | 0 (0.0%) | $0 |
| 5-Person Families | 19 (15.0%) | $0 |
| 6-Person Families | 24 (18.9%) | $0 |
| 7+ Person Families | 13 (10.2%) | $0 |
| Total | 127 (100.0%) | $90,972 |
Family Income by Number of Earners in Coyote Acres
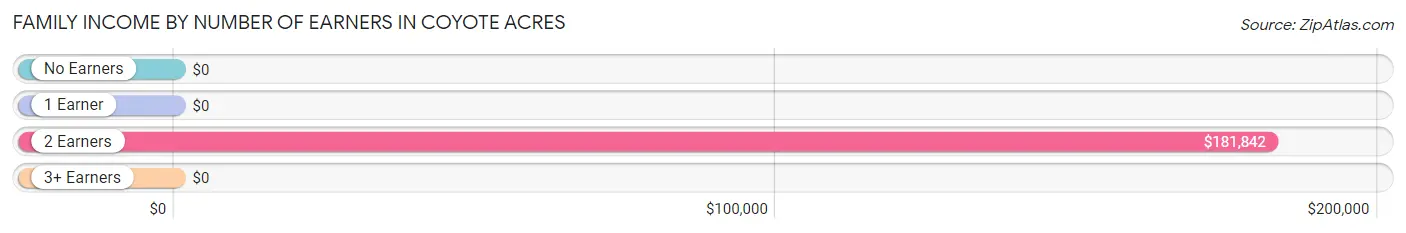
| Number of Earners | # Families | Median Income |
| No Earners | 10 (7.9%) | $0 |
| 1 Earner | 38 (29.9%) | $0 |
| 2 Earners | 66 (52.0%) | $181,842 |
| 3+ Earners | 13 (10.2%) | $0 |
| Total | 127 (100.0%) | $90,972 |
Household Income in Coyote Acres
Household Income Brackets in Coyote Acres
With 51 households falling in the category, the $75,000 to $99,999 income range is the most frequent in Coyote Acres, accounting for 37.2% of all households.
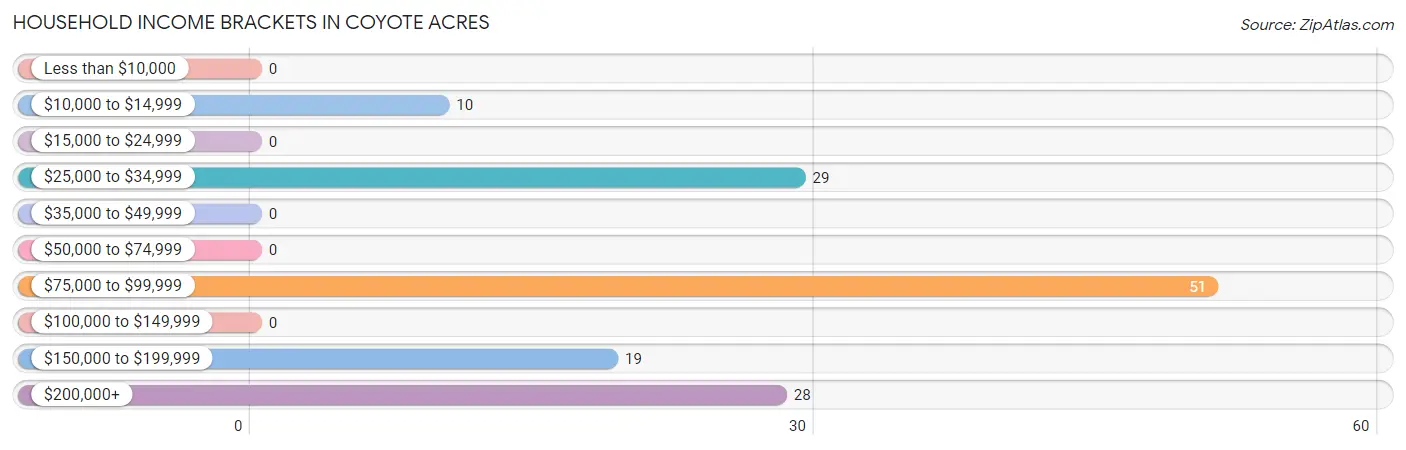
| Income Bracket | # Households | % Households |
| Less than $10,000 | 0 | 0.0% |
| $10,000 to $14,999 | 10 | 7.3% |
| $15,000 to $24,999 | 0 | 0.0% |
| $25,000 to $34,999 | 29 | 21.2% |
| $35,000 to $49,999 | 0 | 0.0% |
| $50,000 to $74,999 | 0 | 0.0% |
| $75,000 to $99,999 | 51 | 37.2% |
| $100,000 to $149,999 | 0 | 0.0% |
| $150,000 to $199,999 | 19 | 13.9% |
| $200,000+ | 28 | 20.4% |
Household Income by Householder Age in Coyote Acres
The median household income in Coyote Acres is $90,509, with the highest median household income of $76,146 found in the 45 to 64 years age bracket for the primary householder. A total of 80 households (58.4%) fall into this category.
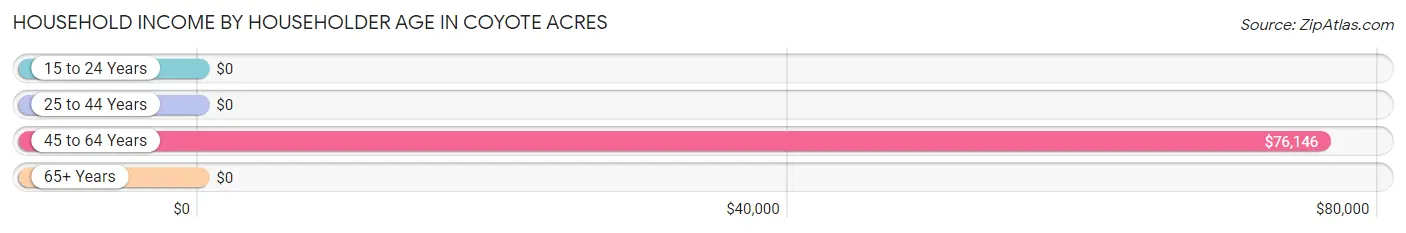
| Income Bracket | # Households | Median Income |
| 15 to 24 Years | 0 (0.0%) | $0 |
| 25 to 44 Years | 47 (34.3%) | $0 |
| 45 to 64 Years | 80 (58.4%) | $76,146 |
| 65+ Years | 10 (7.3%) | $0 |
| Total | 137 (100.0%) | $90,509 |
Poverty in Coyote Acres
Income Below Poverty by Sex and Age in Coyote Acres
With 2.6% poverty level for males and 3.0% for females among the residents of Coyote Acres, 55 to 64 year old males and 65 to 74 year old females are the most vulnerable to poverty, with 10 males (41.7%) and 9 females (47.4%) in their respective age groups living below the poverty level.
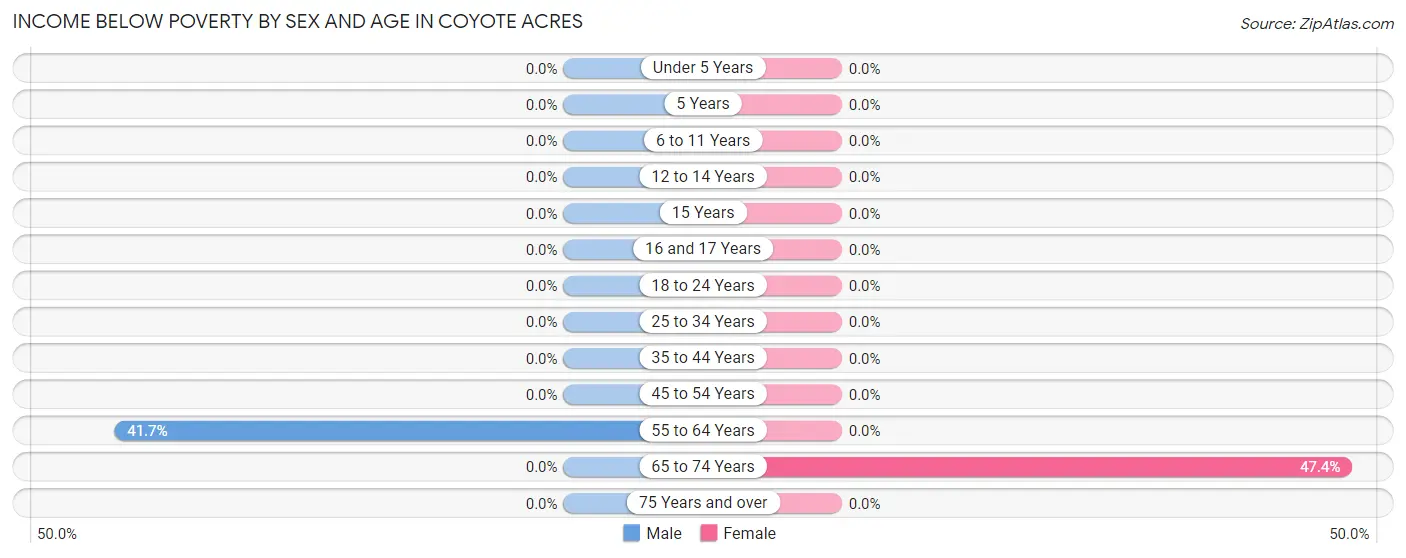
| Age Bracket | Male | Female |
| Under 5 Years | 0 (0.0%) | 0 (0.0%) |
| 5 Years | 0 (0.0%) | 0 (0.0%) |
| 6 to 11 Years | 0 (0.0%) | 0 (0.0%) |
| 12 to 14 Years | 0 (0.0%) | 0 (0.0%) |
| 15 Years | 0 (0.0%) | 0 (0.0%) |
| 16 and 17 Years | 0 (0.0%) | 0 (0.0%) |
| 18 to 24 Years | 0 (0.0%) | 0 (0.0%) |
| 25 to 34 Years | 0 (0.0%) | 0 (0.0%) |
| 35 to 44 Years | 0 (0.0%) | 0 (0.0%) |
| 45 to 54 Years | 0 (0.0%) | 0 (0.0%) |
| 55 to 64 Years | 10 (41.7%) | 0 (0.0%) |
| 65 to 74 Years | 0 (0.0%) | 9 (47.4%) |
| 75 Years and over | 0 (0.0%) | 0 (0.0%) |
| Total | 10 (2.6%) | 9 (3.0%) |
Income Above Poverty by Sex and Age in Coyote Acres
According to the poverty statistics in Coyote Acres, males aged under 5 years and females aged 6 to 11 years are the age groups that are most secure financially, with 100.0% of males and 100.0% of females in these age groups living above the poverty line.
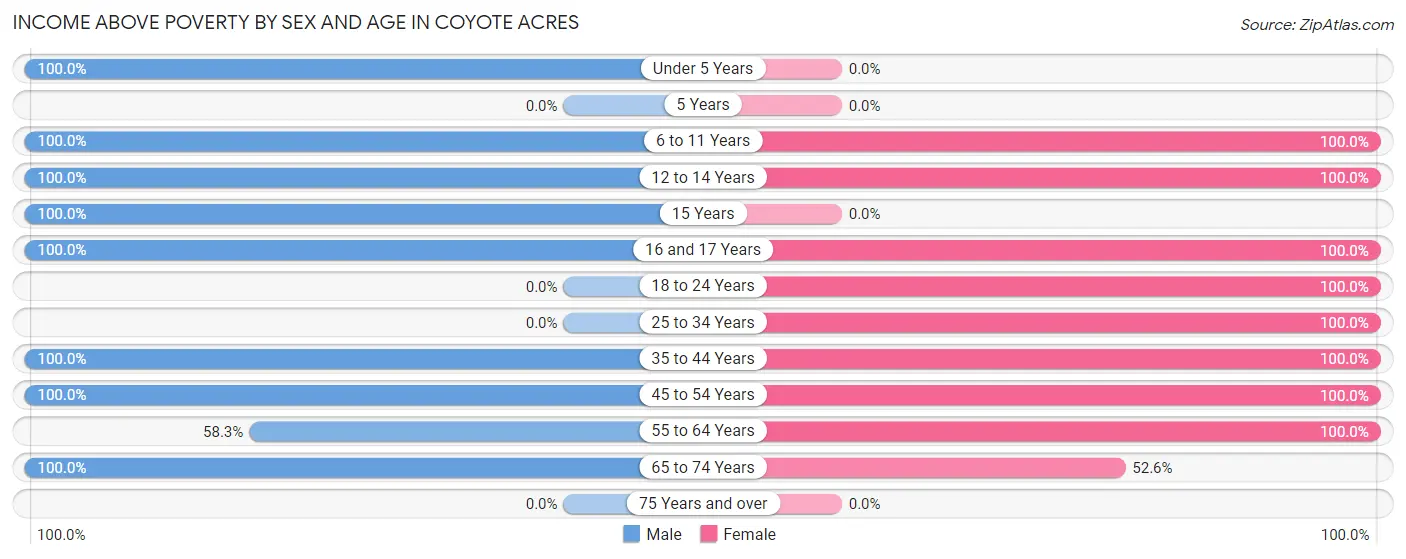
| Age Bracket | Male | Female |
| Under 5 Years | 36 (100.0%) | 0 (0.0%) |
| 5 Years | 0 (0.0%) | 0 (0.0%) |
| 6 to 11 Years | 21 (100.0%) | 16 (100.0%) |
| 12 to 14 Years | 81 (100.0%) | 22 (100.0%) |
| 15 Years | 57 (100.0%) | 0 (0.0%) |
| 16 and 17 Years | 23 (100.0%) | 21 (100.0%) |
| 18 to 24 Years | 0 (0.0%) | 36 (100.0%) |
| 25 to 34 Years | 0 (0.0%) | 40 (100.0%) |
| 35 to 44 Years | 64 (100.0%) | 67 (100.0%) |
| 45 to 54 Years | 30 (100.0%) | 19 (100.0%) |
| 55 to 64 Years | 14 (58.3%) | 61 (100.0%) |
| 65 to 74 Years | 41 (100.0%) | 10 (52.6%) |
| 75 Years and over | 0 (0.0%) | 0 (0.0%) |
| Total | 367 (97.4%) | 292 (97.0%) |
Income Below Poverty Among Married-Couple Families in Coyote Acres
The poverty statistics for married-couple families in Coyote Acres show that 9.3% or 10 of the total 108 families live below the poverty line. Families with no children have the highest poverty rate of 41.7%, comprising of 10 families. On the other hand, families with 1 or 2 children have the lowest poverty rate of 0.0%, which includes 0 families.
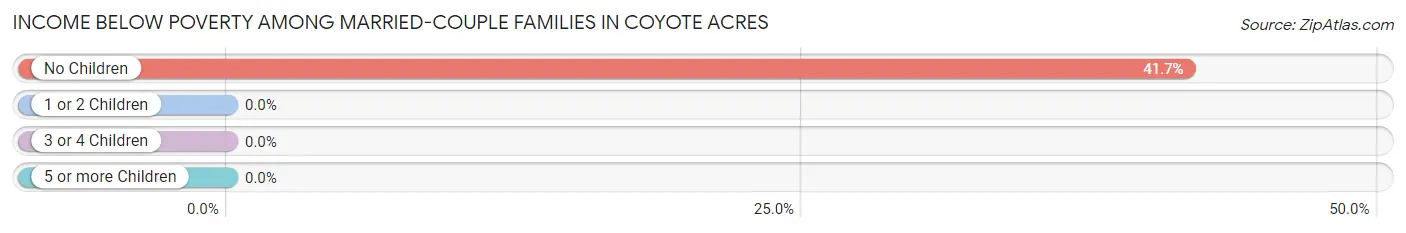
| Children | Above Poverty | Below Poverty |
| No Children | 14 (58.3%) | 10 (41.7%) |
| 1 or 2 Children | 28 (100.0%) | 0 (0.0%) |
| 3 or 4 Children | 56 (100.0%) | 0 (0.0%) |
| 5 or more Children | 0 (0.0%) | 0 (0.0%) |
| Total | 98 (90.7%) | 10 (9.3%) |
Income Below Poverty Among Single-Parent Households in Coyote Acres
| Children | Single Father | Single Mother |
| No Children | 0 (0.0%) | 0 (0.0%) |
| 1 or 2 Children | 0 (0.0%) | 0 (0.0%) |
| 3 or 4 Children | 0 (0.0%) | 0 (0.0%) |
| 5 or more Children | 0 (0.0%) | 0 (0.0%) |
| Total | 0 (0.0%) | 0 (0.0%) |
Income Below Poverty Among Married-Couple vs Single-Parent Households in Coyote Acres
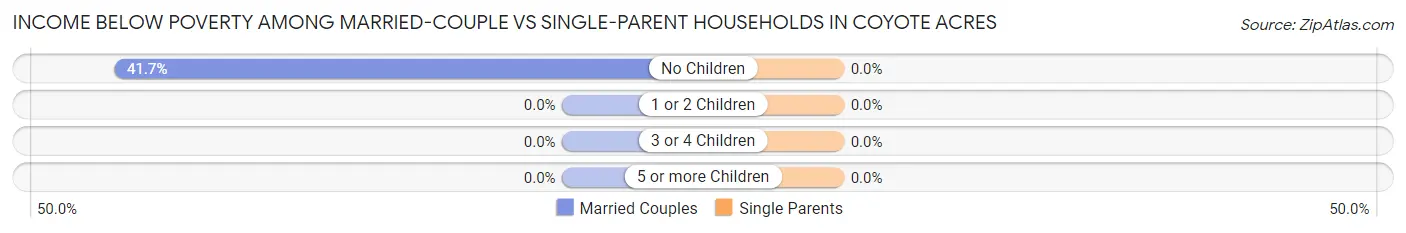
| Children | Married-Couple Families | Single-Parent Households |
| No Children | 10 (41.7%) | 0 (0.0%) |
| 1 or 2 Children | 0 (0.0%) | 0 (0.0%) |
| 3 or 4 Children | 0 (0.0%) | 0 (0.0%) |
| 5 or more Children | 0 (0.0%) | 0 (0.0%) |
| Total | 10 (9.3%) | 0 (0.0%) |
Race in Coyote Acres
The most populous races in Coyote Acres are Hispanic or Latino (659 | 97.2%), Two or more Races (378 | 55.7%), and White / Caucasian (252 | 37.2%).
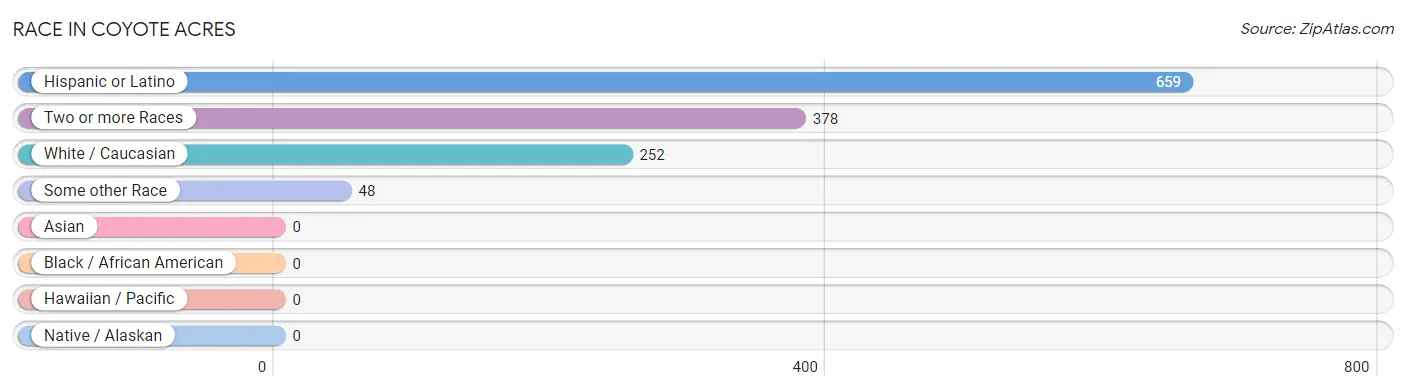
| Race | # Population | % Population |
| Asian | 0 | 0.0% |
| Black / African American | 0 | 0.0% |
| Hawaiian / Pacific | 0 | 0.0% |
| Hispanic or Latino | 659 | 97.2% |
| Native / Alaskan | 0 | 0.0% |
| White / Caucasian | 252 | 37.2% |
| Two or more Races | 378 | 55.7% |
| Some other Race | 48 | 7.1% |
| Total | 678 | 100.0% |
Ancestry in Coyote Acres
The most populous ancestries reported in Coyote Acres are Mexican (465 | 68.6%), and American (19 | 2.8%), together accounting for 71.4% of all Coyote Acres residents.
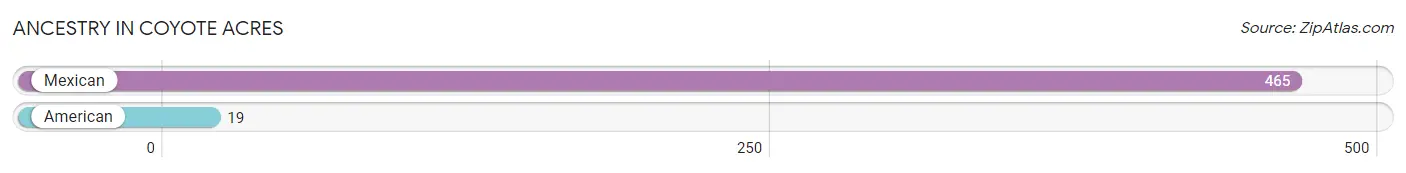
| Ancestry | # Population | % Population |
| American | 19 | 2.8% |
| Mexican | 465 | 68.6% | View All 2 Rows |
Immigrants in Coyote Acres

| Immigration Origin | # Population | % Population | View All 0 Rows |
Sex and Age in Coyote Acres
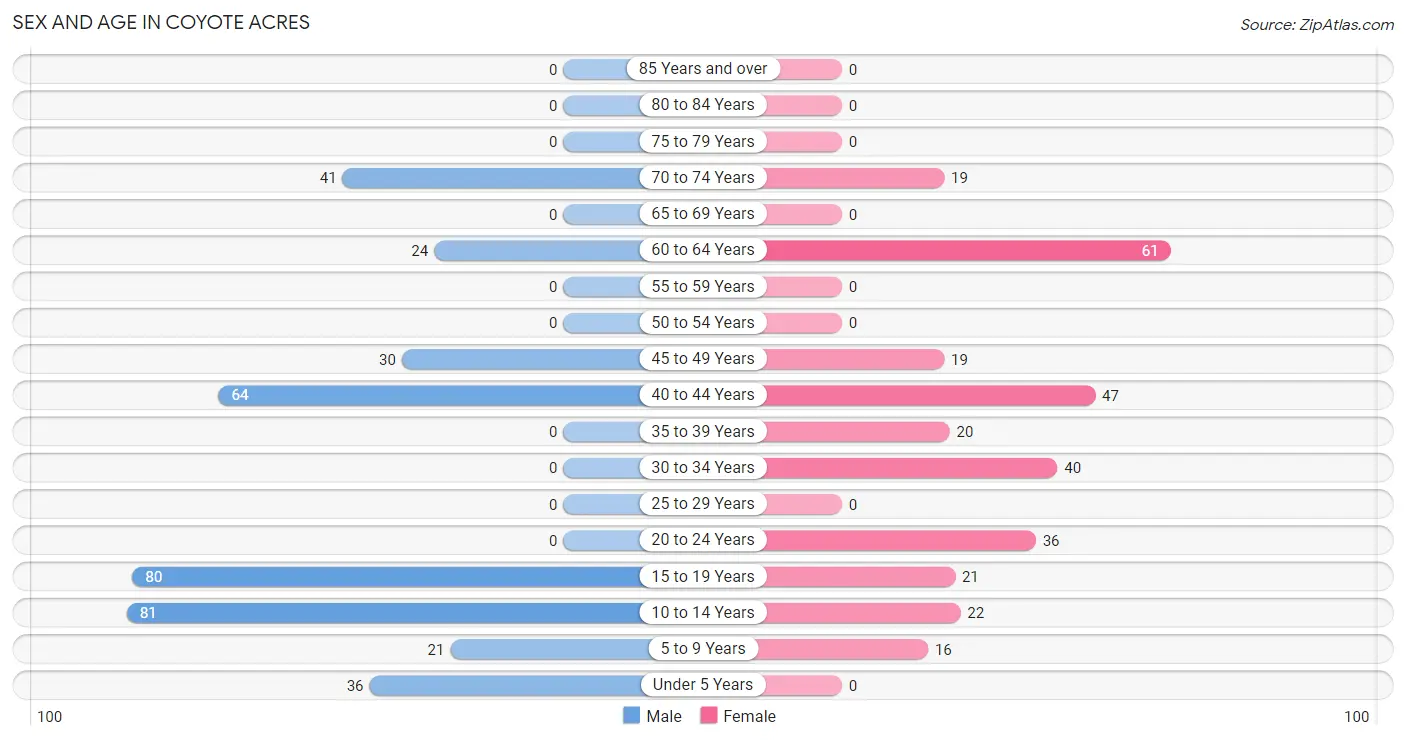
Sex and Age in Coyote Acres
The most populous age groups in Coyote Acres are 10 to 14 Years (81 | 21.5%) for men and 60 to 64 Years (61 | 20.3%) for women.
| Age Bracket | Male | Female |
| Under 5 Years | 36 (9.6%) | 0 (0.0%) |
| 5 to 9 Years | 21 (5.6%) | 16 (5.3%) |
| 10 to 14 Years | 81 (21.5%) | 22 (7.3%) |
| 15 to 19 Years | 80 (21.2%) | 21 (7.0%) |
| 20 to 24 Years | 0 (0.0%) | 36 (12.0%) |
| 25 to 29 Years | 0 (0.0%) | 0 (0.0%) |
| 30 to 34 Years | 0 (0.0%) | 40 (13.3%) |
| 35 to 39 Years | 0 (0.0%) | 20 (6.6%) |
| 40 to 44 Years | 64 (17.0%) | 47 (15.6%) |
| 45 to 49 Years | 30 (8.0%) | 19 (6.3%) |
| 50 to 54 Years | 0 (0.0%) | 0 (0.0%) |
| 55 to 59 Years | 0 (0.0%) | 0 (0.0%) |
| 60 to 64 Years | 24 (6.4%) | 61 (20.3%) |
| 65 to 69 Years | 0 (0.0%) | 0 (0.0%) |
| 70 to 74 Years | 41 (10.9%) | 19 (6.3%) |
| 75 to 79 Years | 0 (0.0%) | 0 (0.0%) |
| 80 to 84 Years | 0 (0.0%) | 0 (0.0%) |
| 85 Years and over | 0 (0.0%) | 0 (0.0%) |
| Total | 377 (100.0%) | 301 (100.0%) |
Families and Households in Coyote Acres
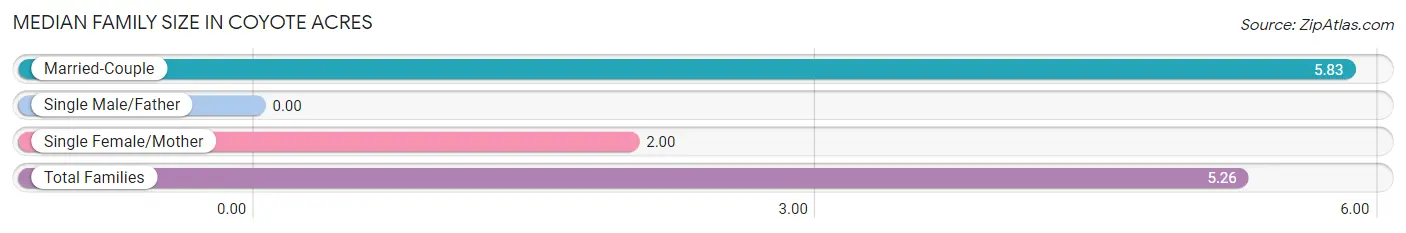
Median Family Size in Coyote Acres
| Family Type | # Families | Family Size |
| Married-Couple | 108 (85.0%) | 5.83 |
| Single Male/Father | 0 (0.0%) | - |
| Single Female/Mother | 19 (15.0%) | 2.00 |
| Total Families | 127 (100.0%) | 5.26 |
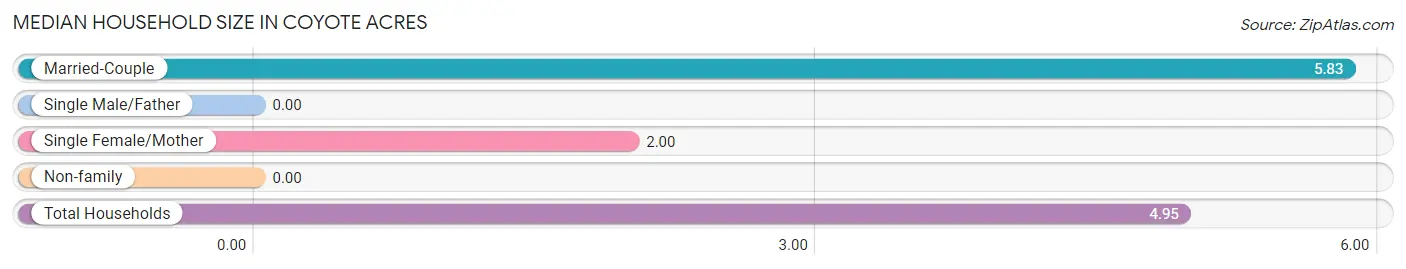
Median Household Size in Coyote Acres
| Household Type | # Households | Household Size |
| Married-Couple | 108 (78.8%) | 5.83 |
| Single Male/Father | 0 (0.0%) | - |
| Single Female/Mother | 19 (13.9%) | 2.00 |
| Non-family | 10 (7.3%) | - |
| Total Households | 137 (100.0%) | 4.95 |
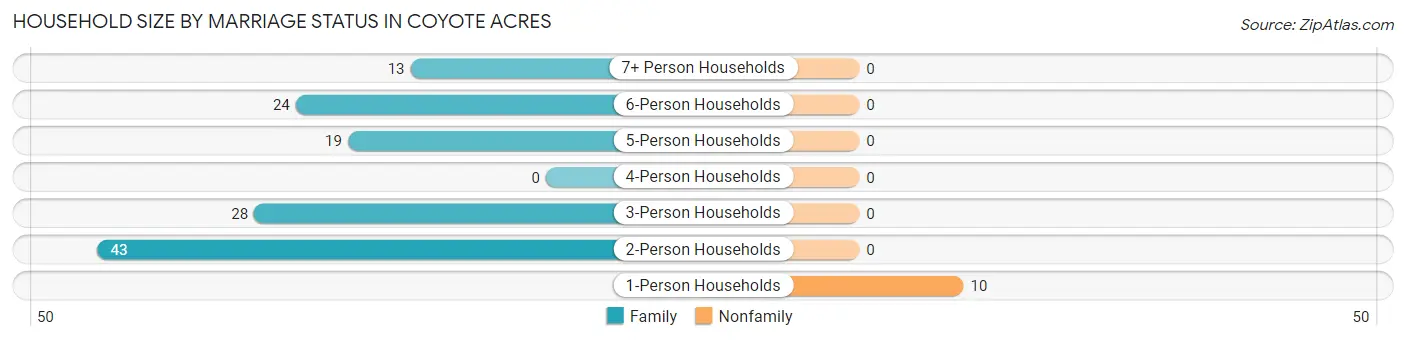
Household Size by Marriage Status in Coyote Acres
Out of a total of 137 households in Coyote Acres, 127 (92.7%) are family households, while 10 (7.3%) are nonfamily households. The most numerous type of family households are 2-person households, comprising 43, and the most common type of nonfamily households are 1-person households, comprising 10.
| Household Size | Family Households | Nonfamily Households |
| 1-Person Households | - | 10 (7.3%) |
| 2-Person Households | 43 (31.4%) | 0 (0.0%) |
| 3-Person Households | 28 (20.4%) | 0 (0.0%) |
| 4-Person Households | 0 (0.0%) | 0 (0.0%) |
| 5-Person Households | 19 (13.9%) | 0 (0.0%) |
| 6-Person Households | 24 (17.5%) | 0 (0.0%) |
| 7+ Person Households | 13 (9.5%) | 0 (0.0%) |
| Total | 127 (92.7%) | 10 (7.3%) |
Female Fertility in Coyote Acres
Fertility by Age in Coyote Acres
Average fertility rate in Coyote Acres is 301.0 births per 1,000 women. Women in the age bracket of 20 to 34 years have the highest fertility rate with 724.0 births per 1,000 women. Women in the age bracket of 20 to 34 years acount for 100.0% of all women with births.
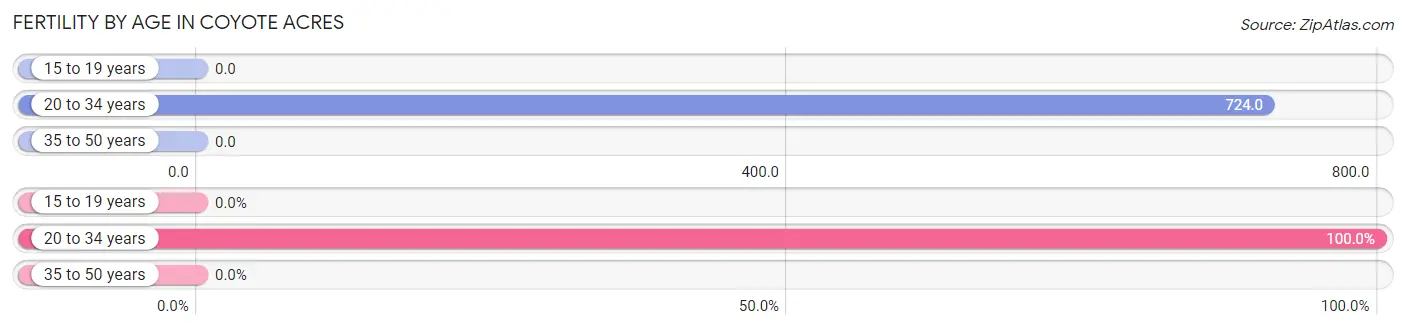
| Age Bracket | Women with Births | Births / 1,000 Women |
| 15 to 19 years | 0 (0.0%) | 0.0 |
| 20 to 34 years | 55 (100.0%) | 724.0 |
| 35 to 50 years | 0 (0.0%) | 0.0 |
| Total | 55 (100.0%) | 301.0 |
Fertility by Age by Marriage Status in Coyote Acres
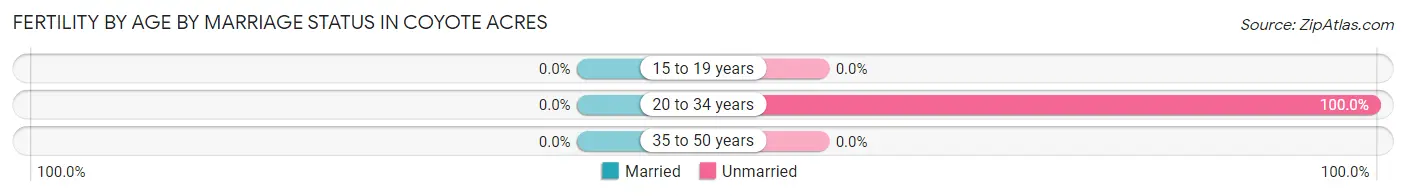
| Age Bracket | Married | Unmarried |
| 15 to 19 years | 0 (0.0%) | 0 (0.0%) |
| 20 to 34 years | 0 (0.0%) | 55 (100.0%) |
| 35 to 50 years | 0 (0.0%) | 0 (0.0%) |
| Total | 0 (0.0%) | 55 (100.0%) |
Fertility by Education in Coyote Acres
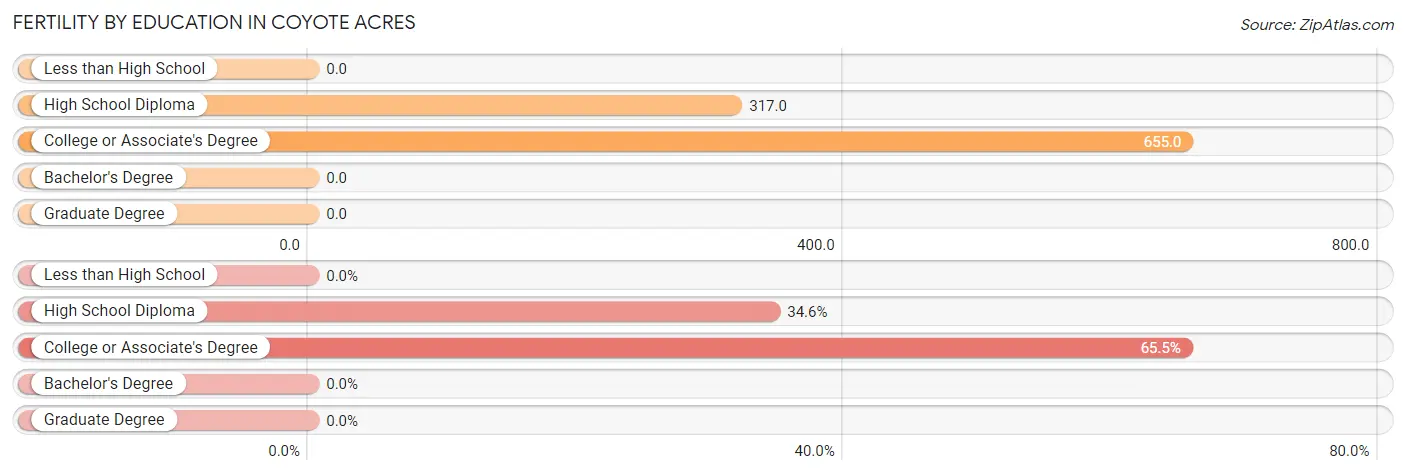
| Educational Attainment | Women with Births | Births / 1,000 Women |
| Less than High School | 0 (0.0%) | 0.0 |
| High School Diploma | 19 (34.5%) | 317.0 |
| College or Associate's Degree | 36 (65.4%) | 655.0 |
| Bachelor's Degree | 0 (0.0%) | 0.0 |
| Graduate Degree | 0 (0.0%) | 0.0 |
| Total | 55 (100.0%) | 301.0 |
Fertility by Education by Marriage Status in Coyote Acres
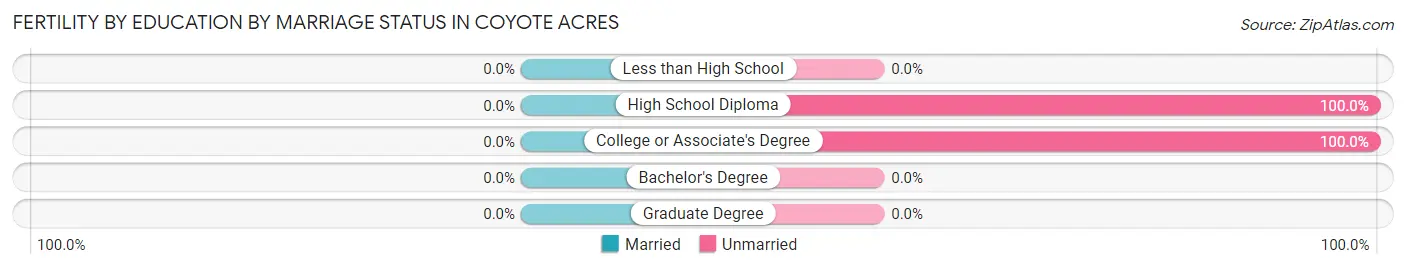
| Educational Attainment | Married | Unmarried |
| Less than High School | 0 (0.0%) | 0 (0.0%) |
| High School Diploma | 0 (0.0%) | 19 (100.0%) |
| College or Associate's Degree | 0 (0.0%) | 36 (100.0%) |
| Bachelor's Degree | 0 (0.0%) | 0 (0.0%) |
| Graduate Degree | 0 (0.0%) | 0 (0.0%) |
| Total | 0 (0.0%) | 55 (100.0%) |
Employment Characteristics in Coyote Acres
Employment by Class of Employer in Coyote Acres
Among the 254 employed individuals in Coyote Acres, private company employees (143 | 56.3%), state government employees (38 | 15.0%), and not-for-profit organizations (28 | 11.0%) make up the most common classes of employment.
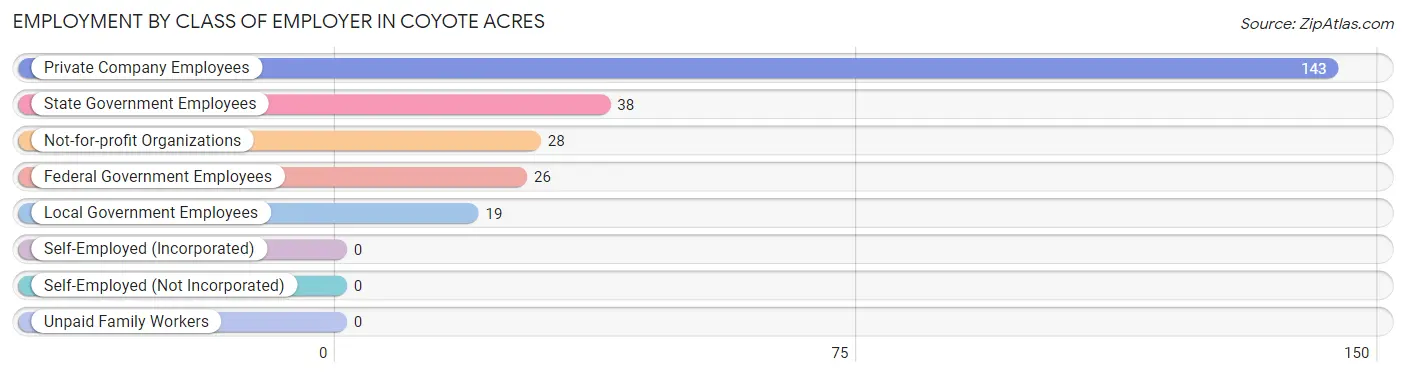
| Employer Class | # Employees | % Employees |
| Private Company Employees | 143 | 56.3% |
| Self-Employed (Incorporated) | 0 | 0.0% |
| Self-Employed (Not Incorporated) | 0 | 0.0% |
| Not-for-profit Organizations | 28 | 11.0% |
| Local Government Employees | 19 | 7.5% |
| State Government Employees | 38 | 15.0% |
| Federal Government Employees | 26 | 10.2% |
| Unpaid Family Workers | 0 | 0.0% |
| Total | 254 | 100.0% |
Employment Status by Age in Coyote Acres
According to the labor force statistics for Coyote Acres, out of the total population over 16 years of age (445), 63.8% or 284 individuals are in the labor force, with 10.6% or 30 of them unemployed. The age group with the highest labor force participation rate is 20 to 24 years, with 100.0% or 36 individuals in the labor force. Within the labor force, the 60 to 64 years age range has the highest percentage of unemployed individuals, with 27.0% or 10 of them being unemployed.
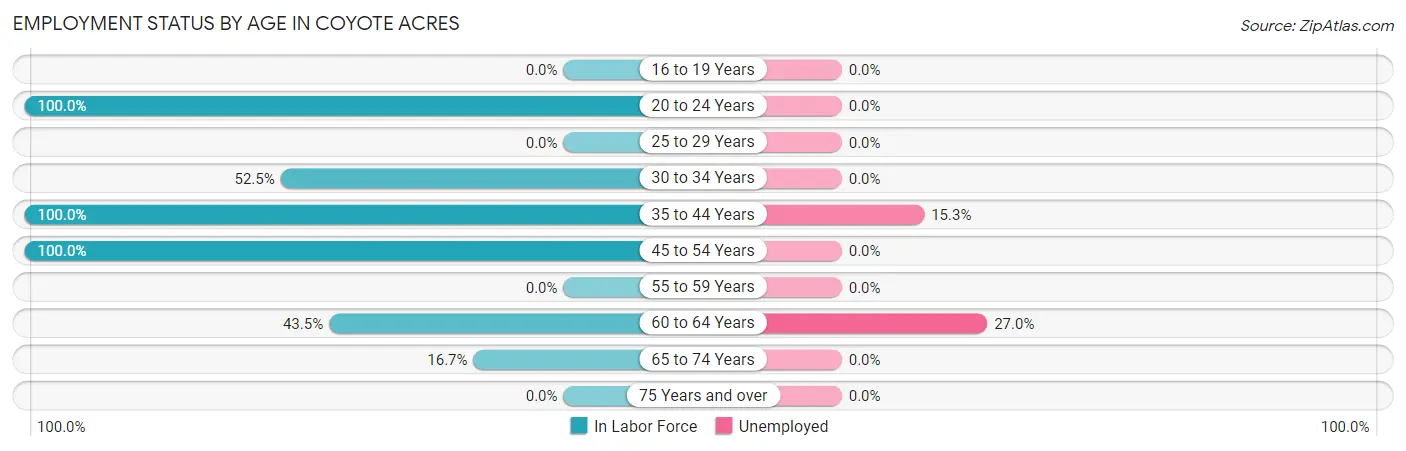
| Age Bracket | In Labor Force | Unemployed |
| 16 to 19 Years | 0 (0.0%) | 0 (0.0%) |
| 20 to 24 Years | 36 (100.0%) | 0 (0.0%) |
| 25 to 29 Years | 0 (0.0%) | 0 (0.0%) |
| 30 to 34 Years | 21 (52.5%) | 0 (0.0%) |
| 35 to 44 Years | 131 (100.0%) | 20 (15.3%) |
| 45 to 54 Years | 49 (100.0%) | 0 (0.0%) |
| 55 to 59 Years | 0 (0.0%) | 0 (0.0%) |
| 60 to 64 Years | 37 (43.5%) | 10 (27.0%) |
| 65 to 74 Years | 10 (16.7%) | 0 (0.0%) |
| 75 Years and over | 0 (0.0%) | 0 (0.0%) |
| Total | 284 (63.8%) | 30 (10.6%) |
Employment Status by Educational Attainment in Coyote Acres
According to labor force statistics for Coyote Acres, 78.0% of individuals (238) out of the total population between 25 and 64 years of age (305) are in the labor force, with 12.6% or 30 of them being unemployed. The group with the highest labor force participation rate are those with the educational attainment of bachelor's degree or higher, with 100.0% or 66 individuals in the labor force. Within the labor force, individuals with high school diploma education have the highest percentage of unemployment, with 46.9% or 30 of them being unemployed.
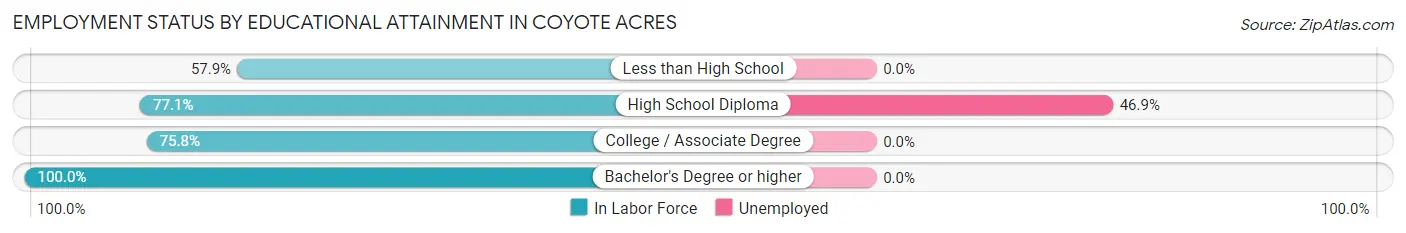
| Educational Attainment | In Labor Force | Unemployed |
| Less than High School | 33 (57.9%) | 0 (0.0%) |
| High School Diploma | 64 (77.1%) | 39 (46.9%) |
| College / Associate Degree | 75 (75.8%) | 0 (0.0%) |
| Bachelor's Degree or higher | 66 (100.0%) | 0 (0.0%) |
| Total | 238 (78.0%) | 38 (12.6%) |
Employment Occupations by Sex in Coyote Acres
Management, Business, Science and Arts Occupations
The most common Management, Business, Science and Arts occupations in Coyote Acres are Business & Financial (54 | 21.3%), Computers, Engineering & Science (38 | 15.0%), Architecture & Engineering (38 | 15.0%), Community & Social Service (19 | 7.5%), and Education Instruction & Library (19 | 7.5%).
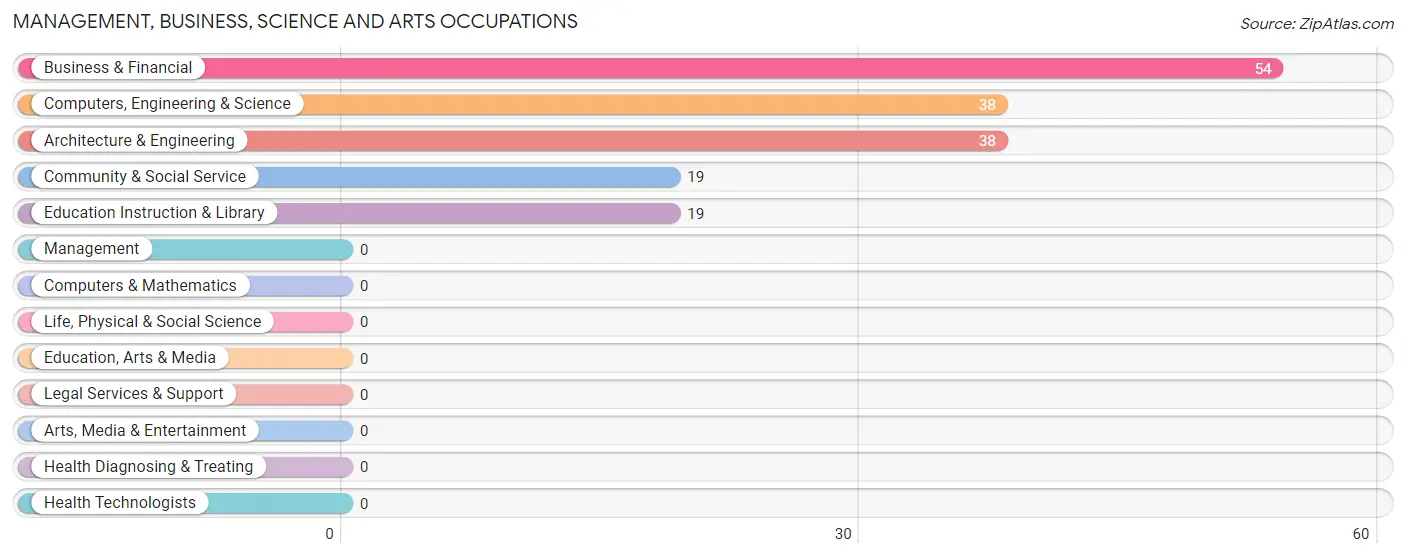
Management, Business, Science and Arts Occupations by Sex
Within the Management, Business, Science and Arts occupations in Coyote Acres, the most male-oriented occupations are Computers, Engineering & Science (100.0%), Architecture & Engineering (100.0%), and Business & Financial (48.1%), while the most female-oriented occupations are Community & Social Service (100.0%), Education Instruction & Library (100.0%), and Business & Financial (51.8%).
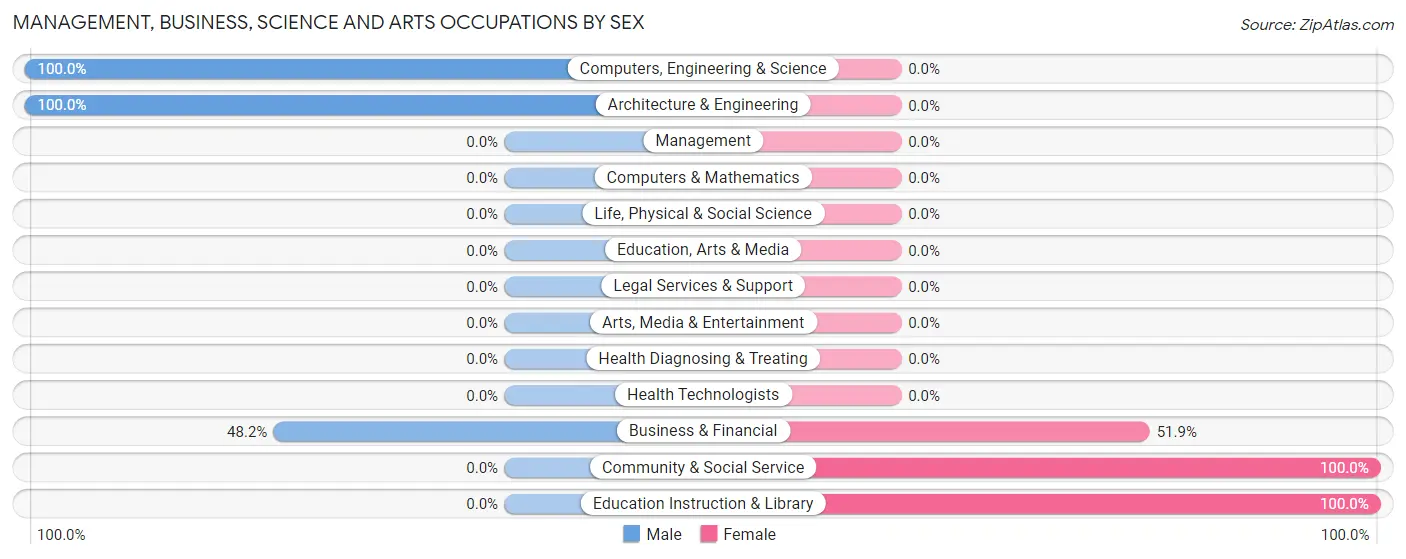
| Occupation | Male | Female |
| Management | 0 (0.0%) | 0 (0.0%) |
| Business & Financial | 26 (48.1%) | 28 (51.8%) |
| Computers, Engineering & Science | 38 (100.0%) | 0 (0.0%) |
| Computers & Mathematics | 0 (0.0%) | 0 (0.0%) |
| Architecture & Engineering | 38 (100.0%) | 0 (0.0%) |
| Life, Physical & Social Science | 0 (0.0%) | 0 (0.0%) |
| Community & Social Service | 0 (0.0%) | 19 (100.0%) |
| Education, Arts & Media | 0 (0.0%) | 0 (0.0%) |
| Legal Services & Support | 0 (0.0%) | 0 (0.0%) |
| Education Instruction & Library | 0 (0.0%) | 19 (100.0%) |
| Arts, Media & Entertainment | 0 (0.0%) | 0 (0.0%) |
| Health Diagnosing & Treating | 0 (0.0%) | 0 (0.0%) |
| Health Technologists | 0 (0.0%) | 0 (0.0%) |
| Total (Category) | 64 (57.7%) | 47 (42.3%) |
| Total (Overall) | 108 (42.5%) | 146 (57.5%) |
Services Occupations
The most common Services occupations in Coyote Acres are Healthcare Support (31 | 12.2%), and Food Preparation & Serving (19 | 7.5%).
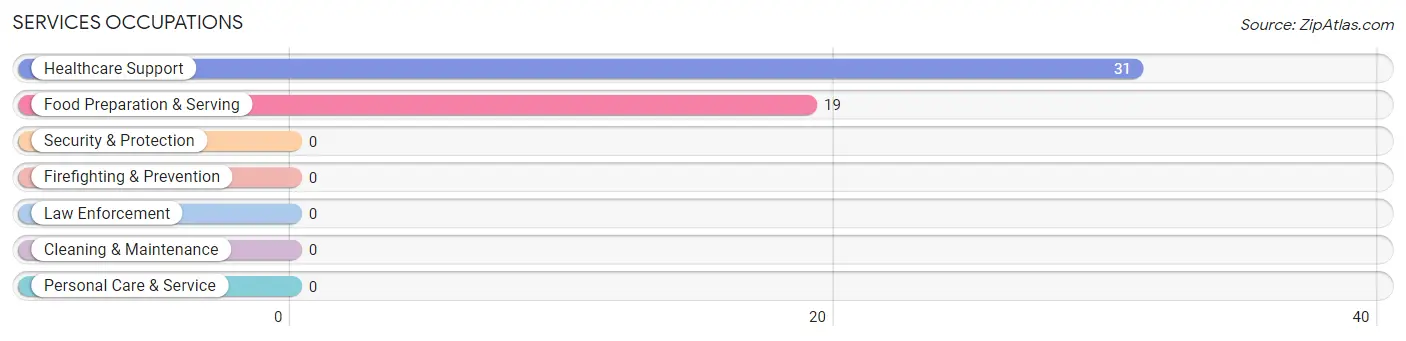
Services Occupations by Sex
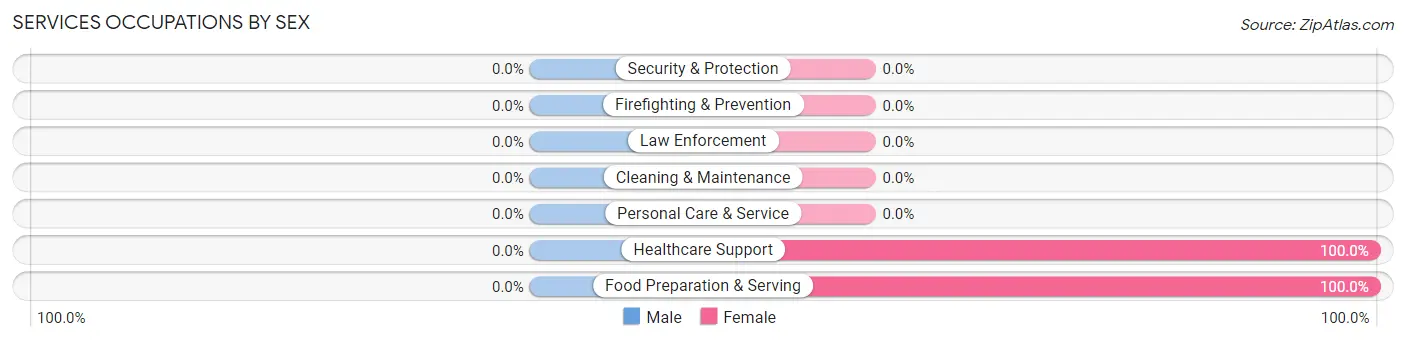
| Occupation | Male | Female |
| Healthcare Support | 0 (0.0%) | 31 (100.0%) |
| Security & Protection | 0 (0.0%) | 0 (0.0%) |
| Firefighting & Prevention | 0 (0.0%) | 0 (0.0%) |
| Law Enforcement | 0 (0.0%) | 0 (0.0%) |
| Food Preparation & Serving | 0 (0.0%) | 19 (100.0%) |
| Cleaning & Maintenance | 0 (0.0%) | 0 (0.0%) |
| Personal Care & Service | 0 (0.0%) | 0 (0.0%) |
| Total (Category) | 0 (0.0%) | 50 (100.0%) |
| Total (Overall) | 108 (42.5%) | 146 (57.5%) |
Sales and Office Occupations
The most common Sales and Office occupations in Coyote Acres are , and Sales & Related (36 | 14.2%).
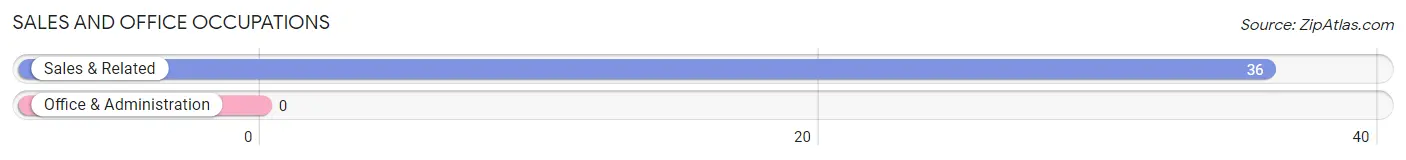
Sales and Office Occupations by Sex
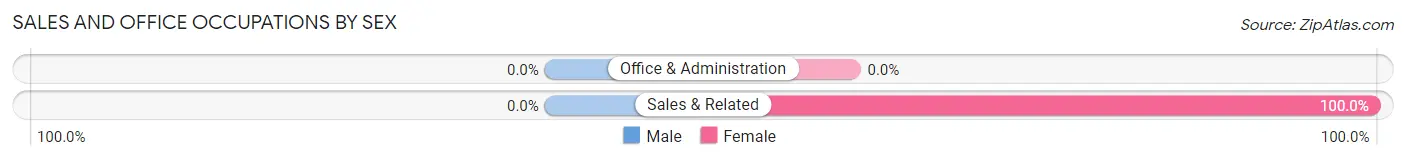
| Occupation | Male | Female |
| Sales & Related | 0 (0.0%) | 36 (100.0%) |
| Office & Administration | 0 (0.0%) | 0 (0.0%) |
| Total (Category) | 0 (0.0%) | 36 (100.0%) |
| Total (Overall) | 108 (42.5%) | 146 (57.5%) |
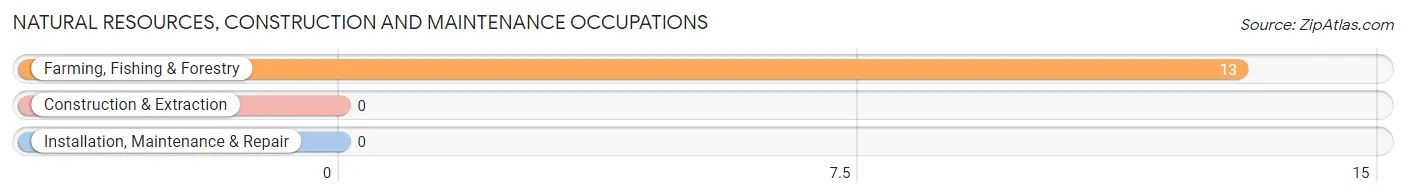
Natural Resources, Construction and Maintenance Occupations
The most common Natural Resources, Construction and Maintenance occupations in Coyote Acres are , and Farming, Fishing & Forestry (13 | 5.1%).
Natural Resources, Construction and Maintenance Occupations by Sex
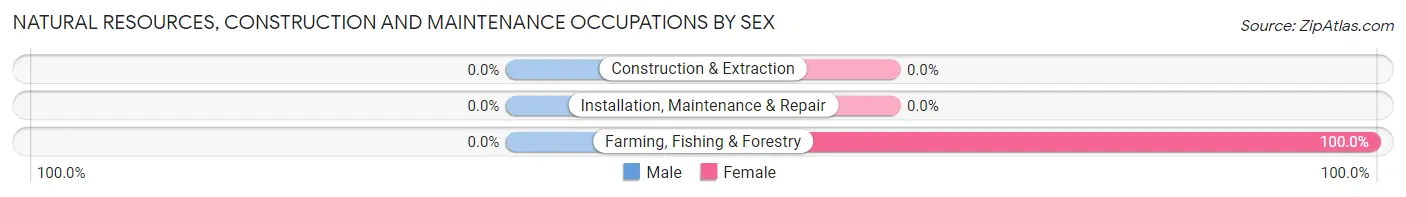
| Occupation | Male | Female |
| Farming, Fishing & Forestry | 0 (0.0%) | 13 (100.0%) |
| Construction & Extraction | 0 (0.0%) | 0 (0.0%) |
| Installation, Maintenance & Repair | 0 (0.0%) | 0 (0.0%) |
| Total (Category) | 0 (0.0%) | 13 (100.0%) |
| Total (Overall) | 108 (42.5%) | 146 (57.5%) |
Production, Transportation and Moving Occupations
The most common Production, Transportation and Moving occupations in Coyote Acres are Material Moving (30 | 11.8%), and Production (14 | 5.5%).
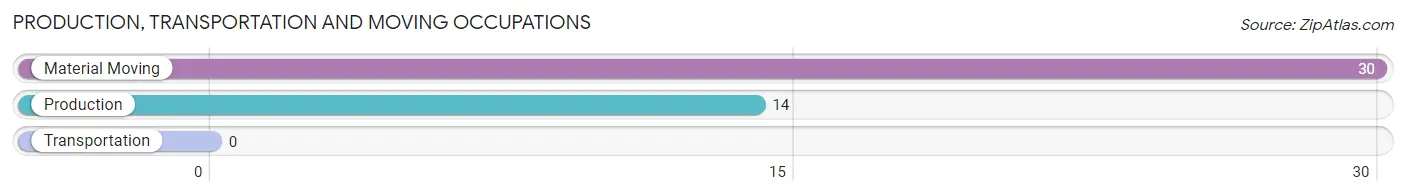
Production, Transportation and Moving Occupations by Sex
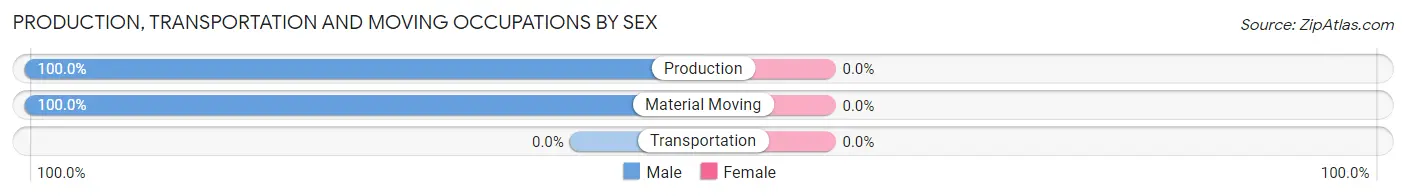
| Occupation | Male | Female |
| Production | 14 (100.0%) | 0 (0.0%) |
| Transportation | 0 (0.0%) | 0 (0.0%) |
| Material Moving | 30 (100.0%) | 0 (0.0%) |
| Total (Category) | 44 (100.0%) | 0 (0.0%) |
| Total (Overall) | 108 (42.5%) | 146 (57.5%) |
Employment Industries by Sex in Coyote Acres
Employment Industries in Coyote Acres
The major employment industries in Coyote Acres include Retail Trade (66 | 26.0%), Health Care & Social Assistance (64 | 25.2%), Public Administration (38 | 15.0%), Professional & Scientific (21 | 8.3%), and Educational Services (19 | 7.5%).
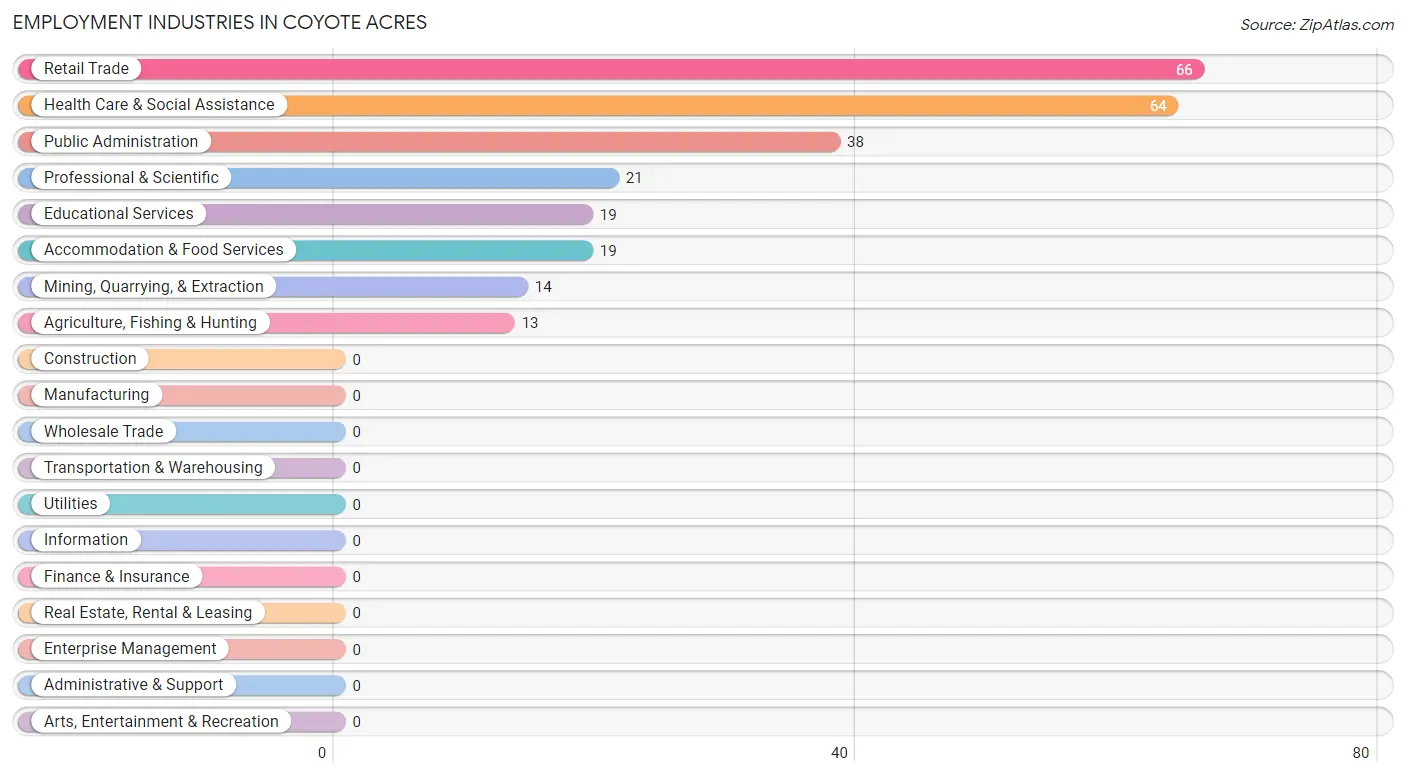
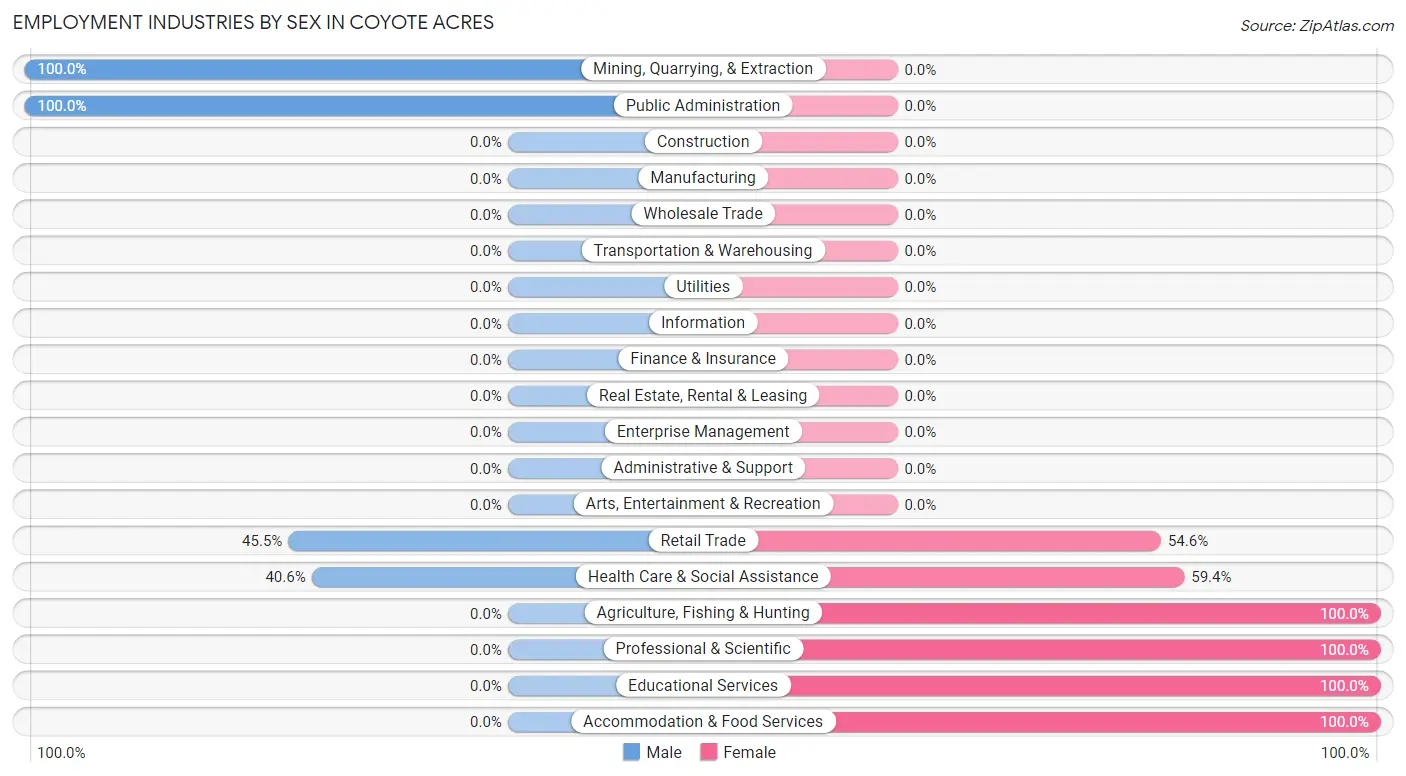
Employment Industries by Sex in Coyote Acres
The Coyote Acres industries that see more men than women are Mining, Quarrying, & Extraction (100.0%), Public Administration (100.0%), and Retail Trade (45.5%), whereas the industries that tend to have a higher number of women are Agriculture, Fishing & Hunting (100.0%), Professional & Scientific (100.0%), and Educational Services (100.0%).
| Industry | Male | Female |
| Agriculture, Fishing & Hunting | 0 (0.0%) | 13 (100.0%) |
| Mining, Quarrying, & Extraction | 14 (100.0%) | 0 (0.0%) |
| Construction | 0 (0.0%) | 0 (0.0%) |
| Manufacturing | 0 (0.0%) | 0 (0.0%) |
| Wholesale Trade | 0 (0.0%) | 0 (0.0%) |
| Retail Trade | 30 (45.5%) | 36 (54.5%) |
| Transportation & Warehousing | 0 (0.0%) | 0 (0.0%) |
| Utilities | 0 (0.0%) | 0 (0.0%) |
| Information | 0 (0.0%) | 0 (0.0%) |
| Finance & Insurance | 0 (0.0%) | 0 (0.0%) |
| Real Estate, Rental & Leasing | 0 (0.0%) | 0 (0.0%) |
| Professional & Scientific | 0 (0.0%) | 21 (100.0%) |
| Enterprise Management | 0 (0.0%) | 0 (0.0%) |
| Administrative & Support | 0 (0.0%) | 0 (0.0%) |
| Educational Services | 0 (0.0%) | 19 (100.0%) |
| Health Care & Social Assistance | 26 (40.6%) | 38 (59.4%) |
| Arts, Entertainment & Recreation | 0 (0.0%) | 0 (0.0%) |
| Accommodation & Food Services | 0 (0.0%) | 19 (100.0%) |
| Public Administration | 38 (100.0%) | 0 (0.0%) |
| Total | 108 (42.5%) | 146 (57.5%) |
Education in Coyote Acres
School Enrollment in Coyote Acres
The most common levels of schooling among the 241 students in Coyote Acres are middle school (103 | 42.7%), high school (101 | 41.9%), and elementary school (37 | 15.3%).
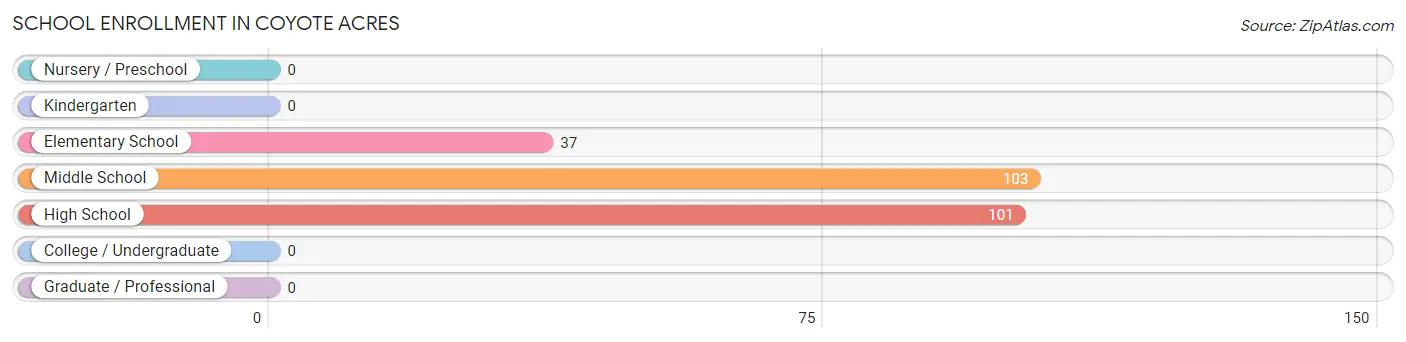
| School Level | # Students | % Students |
| Nursery / Preschool | 0 | 0.0% |
| Kindergarten | 0 | 0.0% |
| Elementary School | 37 | 15.3% |
| Middle School | 103 | 42.7% |
| High School | 101 | 41.9% |
| College / Undergraduate | 0 | 0.0% |
| Graduate / Professional | 0 | 0.0% |
| Total | 241 | 100.0% |
School Enrollment by Age by Funding Source in Coyote Acres
Out of a total of 241 students who are enrolled in schools in Coyote Acres, 42 (17.4%) attend a private institution, while the remaining 199 (82.6%) are enrolled in public schools. The age group of 10 to 14 year olds has the highest likelihood of being enrolled in private schools, with 42 (40.8% in the age bracket) enrolled. Conversely, the age group of 5 to 9 year old has the lowest likelihood of being enrolled in a private school, with 37 (100.0% in the age bracket) attending a public institution.
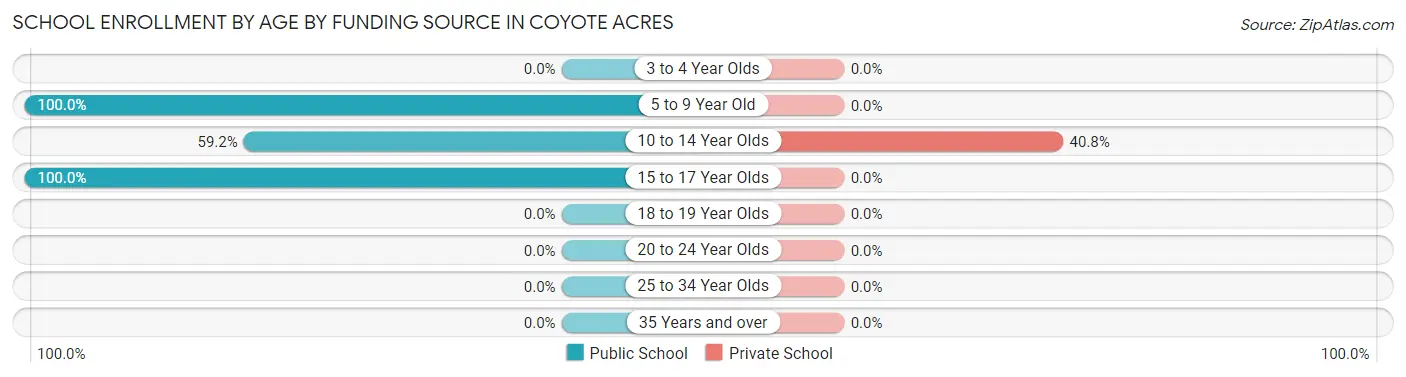
| Age Bracket | Public School | Private School |
| 3 to 4 Year Olds | 0 (0.0%) | 0 (0.0%) |
| 5 to 9 Year Old | 37 (100.0%) | 0 (0.0%) |
| 10 to 14 Year Olds | 61 (59.2%) | 42 (40.8%) |
| 15 to 17 Year Olds | 101 (100.0%) | 0 (0.0%) |
| 18 to 19 Year Olds | 0 (0.0%) | 0 (0.0%) |
| 20 to 24 Year Olds | 0 (0.0%) | 0 (0.0%) |
| 25 to 34 Year Olds | 0 (0.0%) | 0 (0.0%) |
| 35 Years and over | 0 (0.0%) | 0 (0.0%) |
| Total | 199 (82.6%) | 42 (17.4%) |
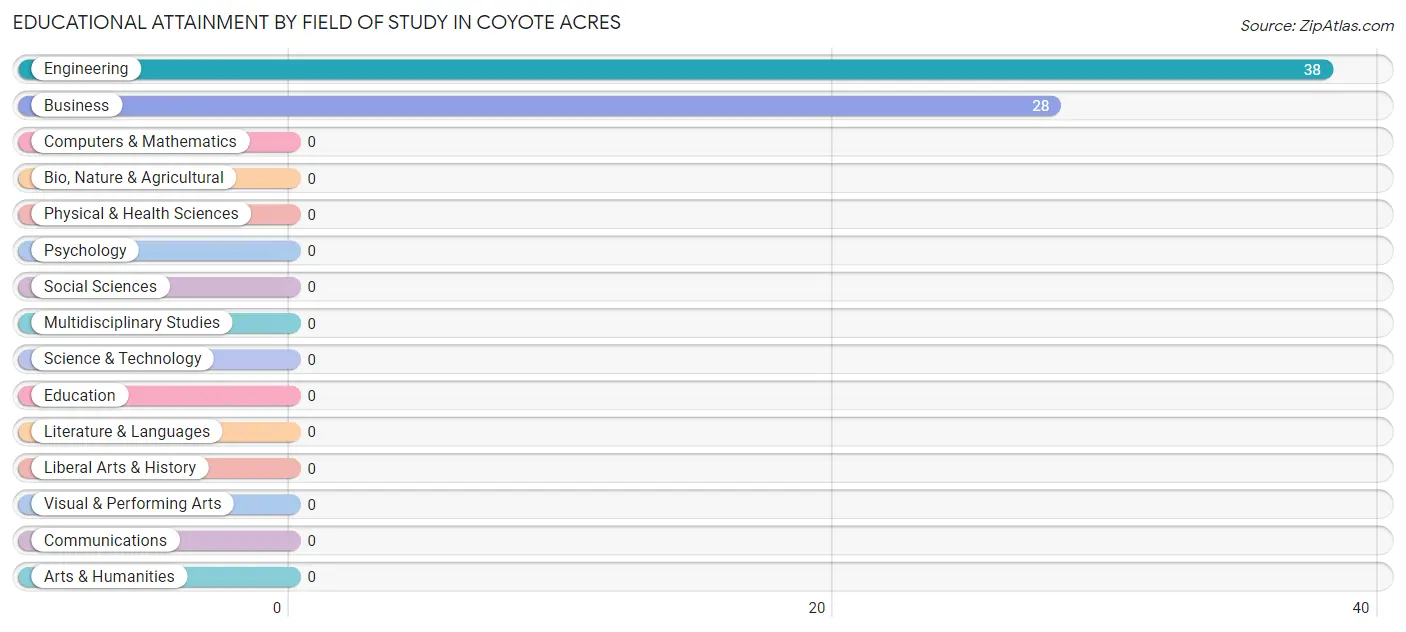
Educational Attainment by Field of Study in Coyote Acres
Engineering (38 | 57.6%), and business (28 | 42.4%) are the most common fields of study among 66 individuals in Coyote Acres who have obtained a bachelor's degree or higher.
| Field of Study | # Graduates | % Graduates |
| Computers & Mathematics | 0 | 0.0% |
| Bio, Nature & Agricultural | 0 | 0.0% |
| Physical & Health Sciences | 0 | 0.0% |
| Psychology | 0 | 0.0% |
| Social Sciences | 0 | 0.0% |
| Engineering | 38 | 57.6% |
| Multidisciplinary Studies | 0 | 0.0% |
| Science & Technology | 0 | 0.0% |
| Business | 28 | 42.4% |
| Education | 0 | 0.0% |
| Literature & Languages | 0 | 0.0% |
| Liberal Arts & History | 0 | 0.0% |
| Visual & Performing Arts | 0 | 0.0% |
| Communications | 0 | 0.0% |
| Arts & Humanities | 0 | 0.0% |
| Total | 66 | 100.0% |
Transportation & Commute in Coyote Acres
Vehicle Availability by Sex in Coyote Acres
The most prevalent vehicle ownership categories in Coyote Acres are males with 2 vehicles (40, accounting for 37.0%) and females with 2 vehicles (19, making up 27.4%).
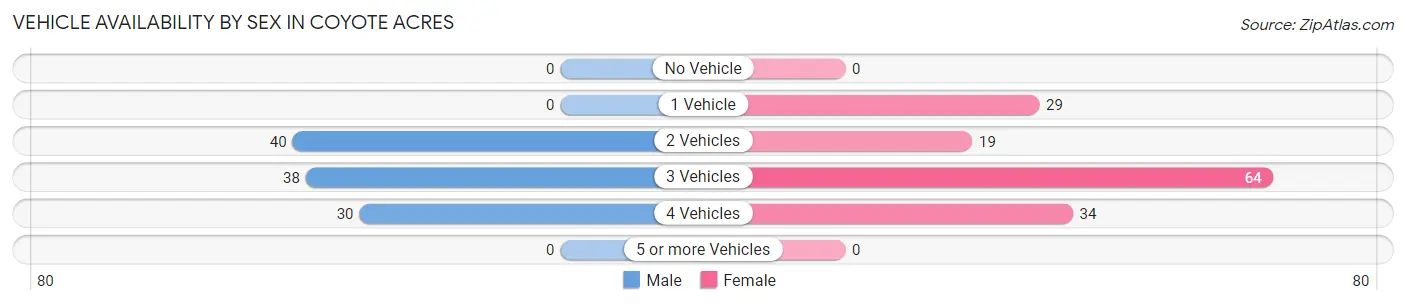
| Vehicles Available | Male | Female |
| No Vehicle | 0 (0.0%) | 0 (0.0%) |
| 1 Vehicle | 0 (0.0%) | 29 (19.9%) |
| 2 Vehicles | 40 (37.0%) | 19 (13.0%) |
| 3 Vehicles | 38 (35.2%) | 64 (43.8%) |
| 4 Vehicles | 30 (27.8%) | 34 (23.3%) |
| 5 or more Vehicles | 0 (0.0%) | 0 (0.0%) |
| Total | 108 (100.0%) | 146 (100.0%) |
Commute Time in Coyote Acres
The most frequently occuring commute durations in Coyote Acres are 15 to 19 minutes (60 commuters, 27.8%), 60 to 89 minutes (56 commuters, 25.9%), and 10 to 14 minutes (36 commuters, 16.7%).
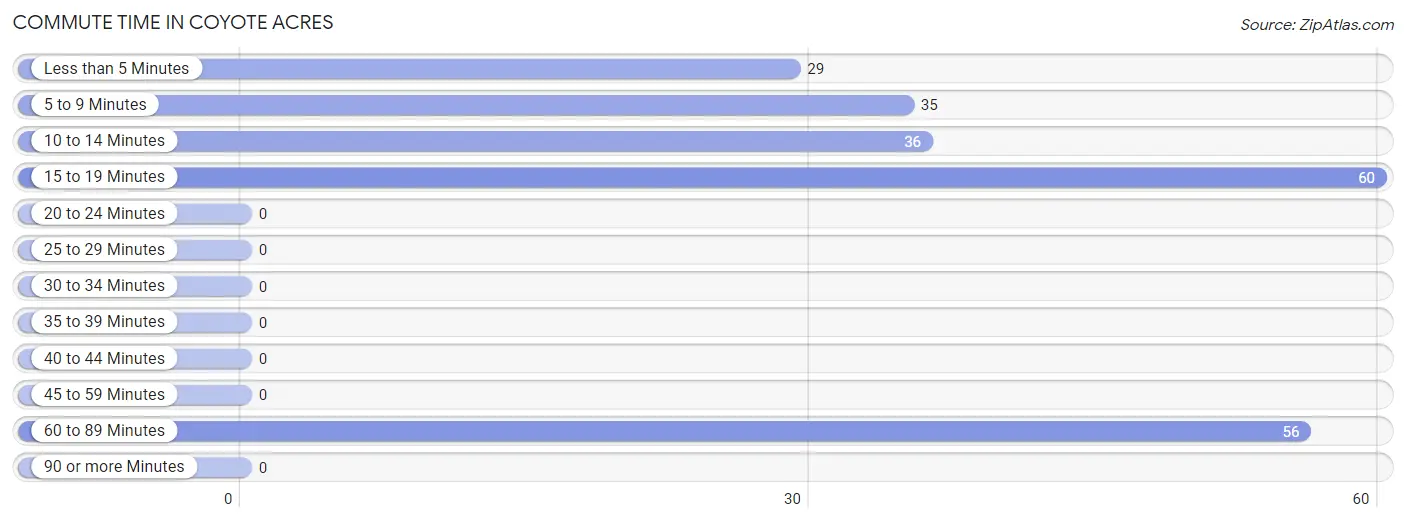
| Commute Time | # Commuters | % Commuters |
| Less than 5 Minutes | 29 | 13.4% |
| 5 to 9 Minutes | 35 | 16.2% |
| 10 to 14 Minutes | 36 | 16.7% |
| 15 to 19 Minutes | 60 | 27.8% |
| 20 to 24 Minutes | 0 | 0.0% |
| 25 to 29 Minutes | 0 | 0.0% |
| 30 to 34 Minutes | 0 | 0.0% |
| 35 to 39 Minutes | 0 | 0.0% |
| 40 to 44 Minutes | 0 | 0.0% |
| 45 to 59 Minutes | 0 | 0.0% |
| 60 to 89 Minutes | 56 | 25.9% |
| 90 or more Minutes | 0 | 0.0% |
Commute Time by Sex in Coyote Acres
The most common commute times in Coyote Acres are 60 to 89 minutes (56 commuters, 80.0%) for males and 15 to 19 minutes (60 commuters, 41.1%) for females.
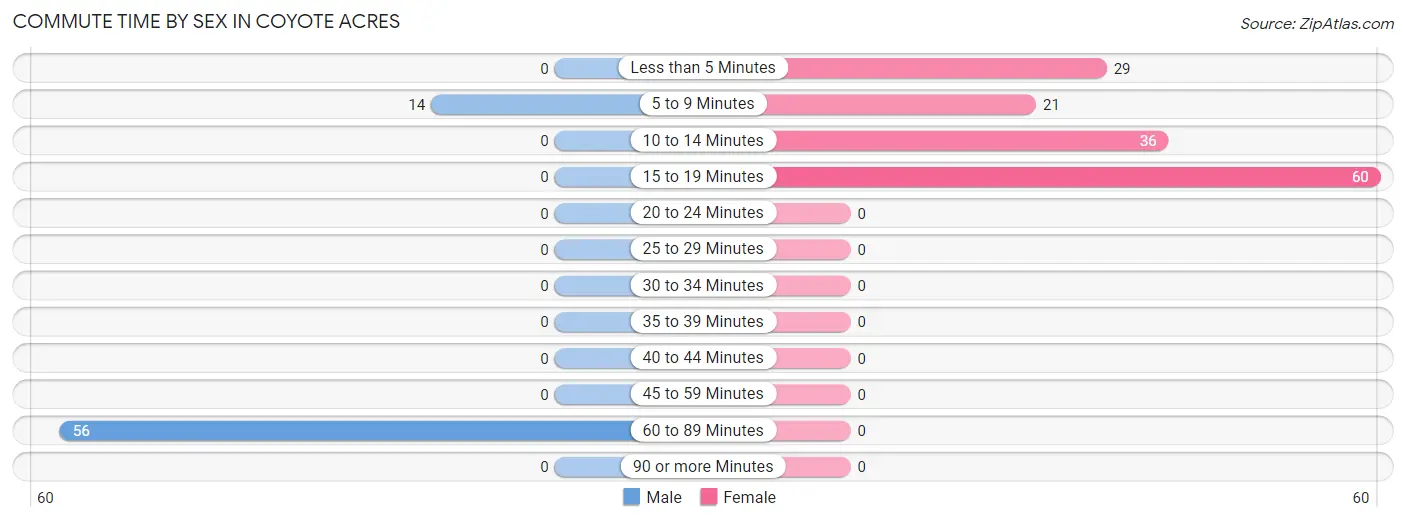
| Commute Time | Male | Female |
| Less than 5 Minutes | 0 (0.0%) | 29 (19.9%) |
| 5 to 9 Minutes | 14 (20.0%) | 21 (14.4%) |
| 10 to 14 Minutes | 0 (0.0%) | 36 (24.7%) |
| 15 to 19 Minutes | 0 (0.0%) | 60 (41.1%) |
| 20 to 24 Minutes | 0 (0.0%) | 0 (0.0%) |
| 25 to 29 Minutes | 0 (0.0%) | 0 (0.0%) |
| 30 to 34 Minutes | 0 (0.0%) | 0 (0.0%) |
| 35 to 39 Minutes | 0 (0.0%) | 0 (0.0%) |
| 40 to 44 Minutes | 0 (0.0%) | 0 (0.0%) |
| 45 to 59 Minutes | 0 (0.0%) | 0 (0.0%) |
| 60 to 89 Minutes | 56 (80.0%) | 0 (0.0%) |
| 90 or more Minutes | 0 (0.0%) | 0 (0.0%) |
Time of Departure to Work by Sex in Coyote Acres
The most frequent times of departure to work in Coyote Acres are 6:30 AM to 6:59 AM (56, 80.0%) for males and 7:30 AM to 7:59 AM (49, 33.6%) for females.
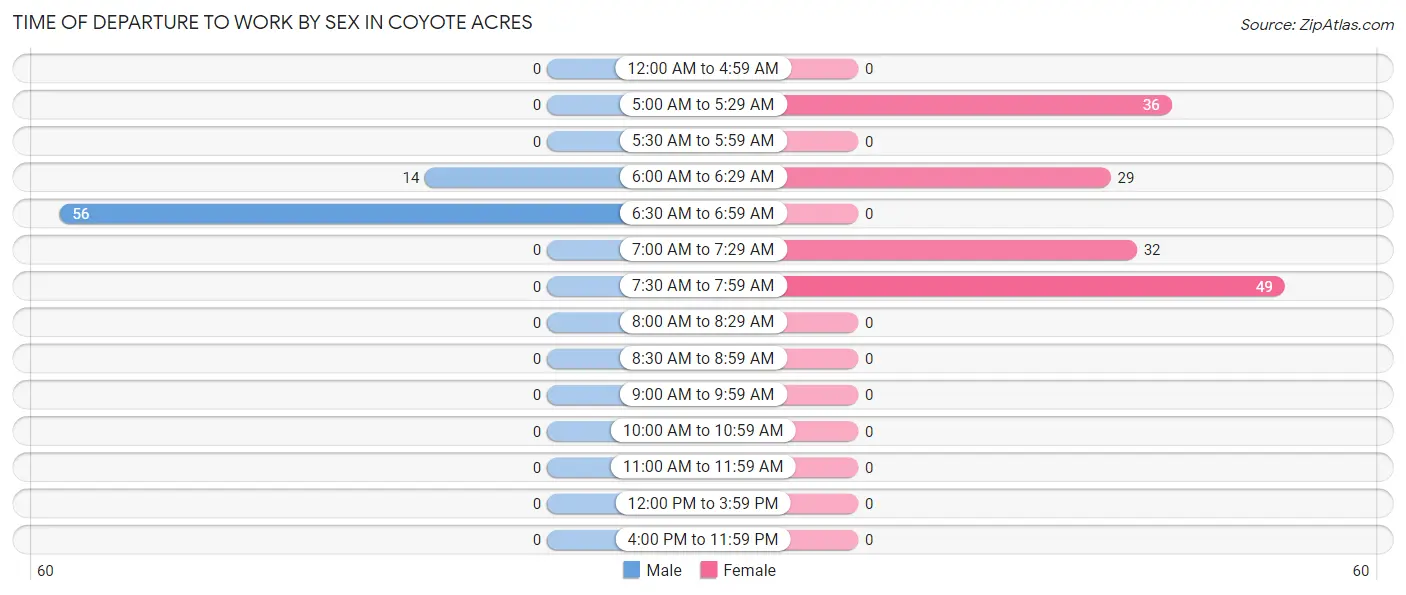
| Time of Departure | Male | Female |
| 12:00 AM to 4:59 AM | 0 (0.0%) | 0 (0.0%) |
| 5:00 AM to 5:29 AM | 0 (0.0%) | 36 (24.7%) |
| 5:30 AM to 5:59 AM | 0 (0.0%) | 0 (0.0%) |
| 6:00 AM to 6:29 AM | 14 (20.0%) | 29 (19.9%) |
| 6:30 AM to 6:59 AM | 56 (80.0%) | 0 (0.0%) |
| 7:00 AM to 7:29 AM | 0 (0.0%) | 32 (21.9%) |
| 7:30 AM to 7:59 AM | 0 (0.0%) | 49 (33.6%) |
| 8:00 AM to 8:29 AM | 0 (0.0%) | 0 (0.0%) |
| 8:30 AM to 8:59 AM | 0 (0.0%) | 0 (0.0%) |
| 9:00 AM to 9:59 AM | 0 (0.0%) | 0 (0.0%) |
| 10:00 AM to 10:59 AM | 0 (0.0%) | 0 (0.0%) |
| 11:00 AM to 11:59 AM | 0 (0.0%) | 0 (0.0%) |
| 12:00 PM to 3:59 PM | 0 (0.0%) | 0 (0.0%) |
| 4:00 PM to 11:59 PM | 0 (0.0%) | 0 (0.0%) |
| Total | 70 (100.0%) | 146 (100.0%) |
Housing Occupancy in Coyote Acres
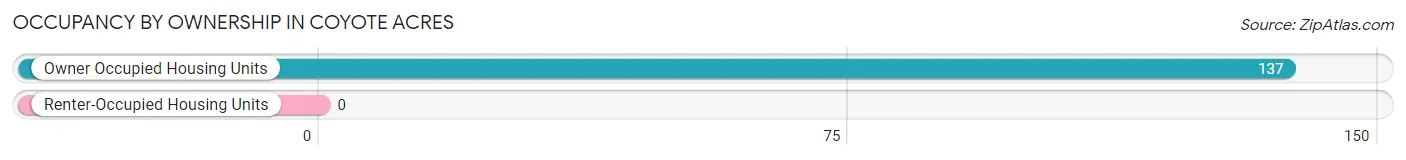
Occupancy by Ownership in Coyote Acres
Of the total 137 dwellings in Coyote Acres, owner-occupied units account for 137 (100.0%), while renter-occupied units make up 0 (0.0%).
| Occupancy | # Housing Units | % Housing Units |
| Owner Occupied Housing Units | 137 | 100.0% |
| Renter-Occupied Housing Units | 0 | 0.0% |
| Total Occupied Housing Units | 137 | 100.0% |
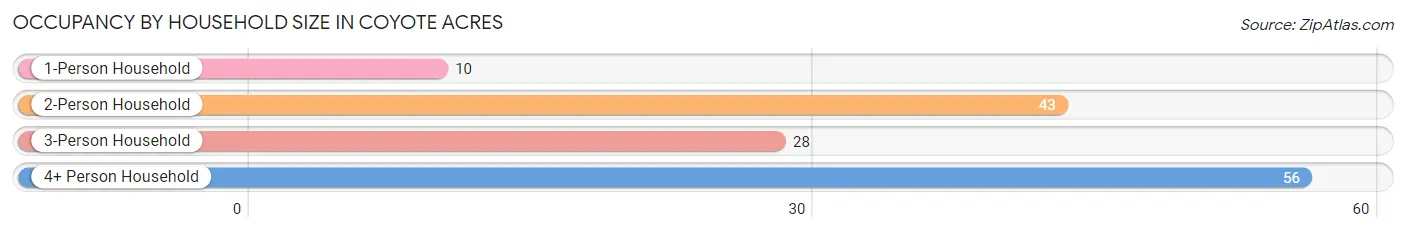
Occupancy by Household Size in Coyote Acres
| Household Size | # Housing Units | % Housing Units |
| 1-Person Household | 10 | 7.3% |
| 2-Person Household | 43 | 31.4% |
| 3-Person Household | 28 | 20.4% |
| 4+ Person Household | 56 | 40.9% |
| Total Housing Units | 137 | 100.0% |
Occupancy by Ownership by Household Size in Coyote Acres
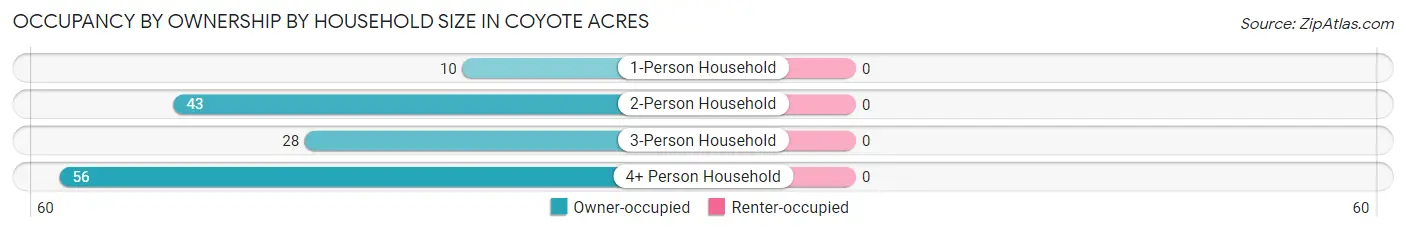
| Household Size | Owner-occupied | Renter-occupied |
| 1-Person Household | 10 (100.0%) | 0 (0.0%) |
| 2-Person Household | 43 (100.0%) | 0 (0.0%) |
| 3-Person Household | 28 (100.0%) | 0 (0.0%) |
| 4+ Person Household | 56 (100.0%) | 0 (0.0%) |
| Total Housing Units | 137 (100.0%) | 0 (0.0%) |
Occupancy by Educational Attainment in Coyote Acres
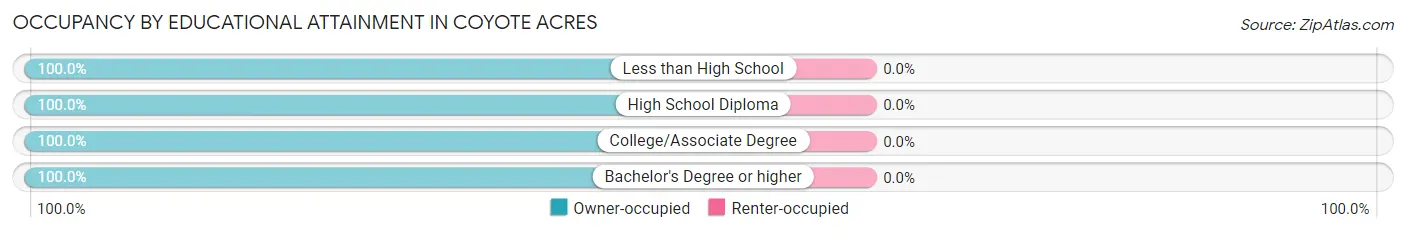
| Household Size | Owner-occupied | Renter-occupied |
| Less than High School | 43 (100.0%) | 0 (0.0%) |
| High School Diploma | 23 (100.0%) | 0 (0.0%) |
| College/Associate Degree | 43 (100.0%) | 0 (0.0%) |
| Bachelor's Degree or higher | 28 (100.0%) | 0 (0.0%) |
Occupancy by Age of Householder in Coyote Acres
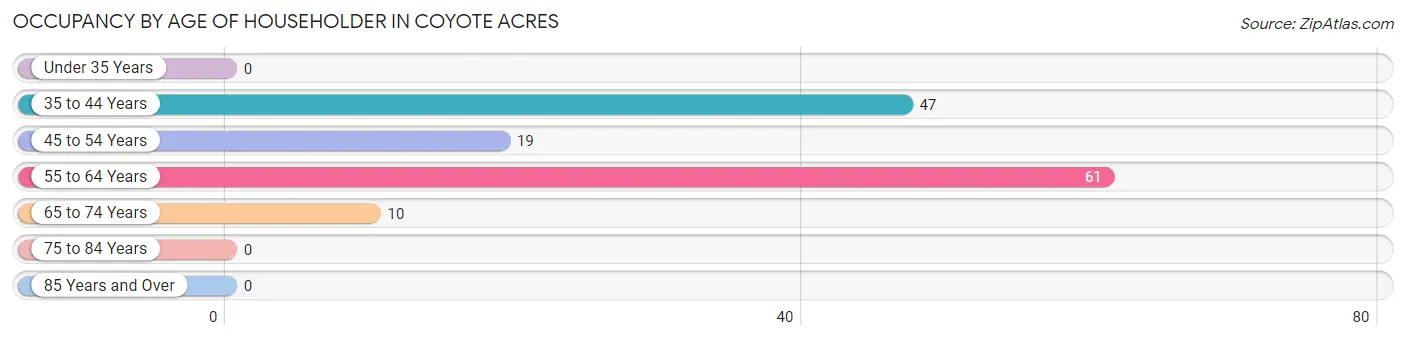
| Age Bracket | # Households | % Households |
| Under 35 Years | 0 | 0.0% |
| 35 to 44 Years | 47 | 34.3% |
| 45 to 54 Years | 19 | 13.9% |
| 55 to 64 Years | 61 | 44.5% |
| 65 to 74 Years | 10 | 7.3% |
| 75 to 84 Years | 0 | 0.0% |
| 85 Years and Over | 0 | 0.0% |
| Total | 137 | 100.0% |
Housing Finances in Coyote Acres
Median Income by Occupancy in Coyote Acres
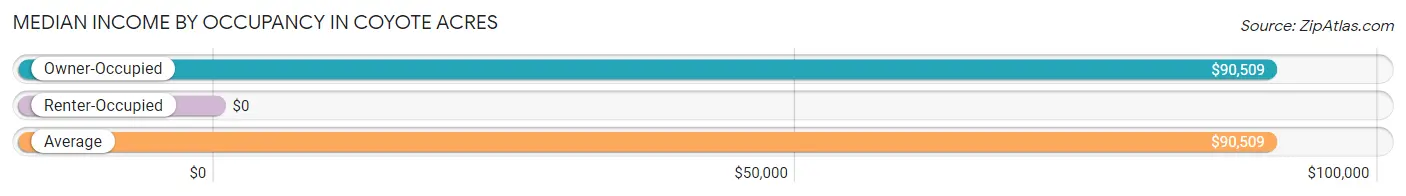
| Occupancy Type | # Households | Median Income |
| Owner-Occupied | 137 (100.0%) | $90,509 |
| Renter-Occupied | 0 (0.0%) | $0 |
| Average | 137 (100.0%) | $90,509 |
Occupancy by Householder Income Bracket in Coyote Acres
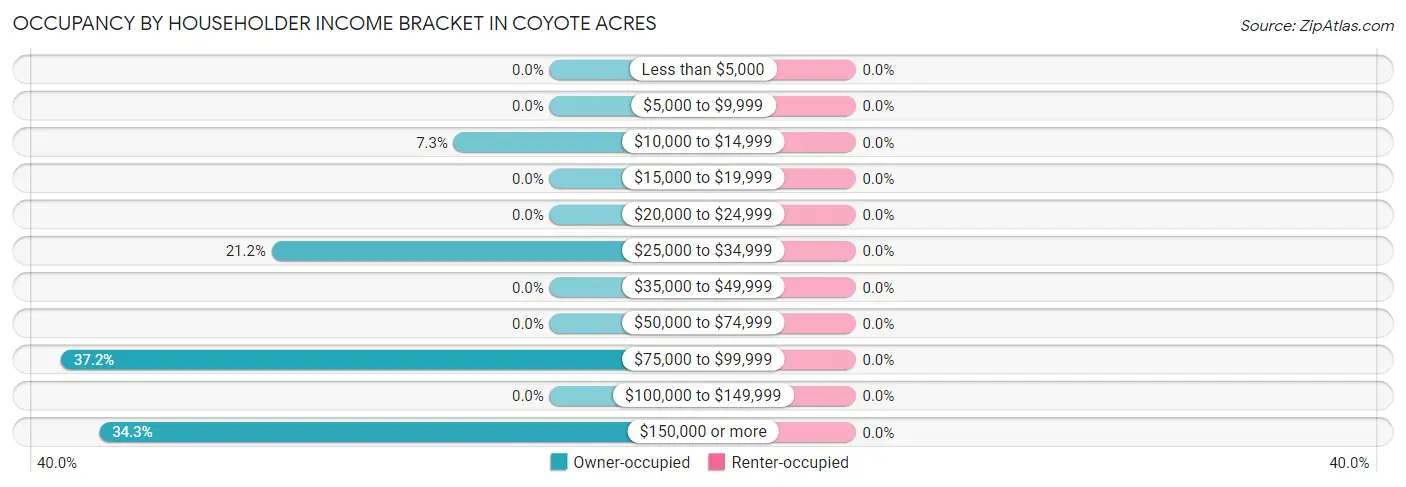
| Income Bracket | Owner-occupied | Renter-occupied |
| Less than $5,000 | 0 (0.0%) | 0 (0.0%) |
| $5,000 to $9,999 | 0 (0.0%) | 0 (0.0%) |
| $10,000 to $14,999 | 10 (7.3%) | 0 (0.0%) |
| $15,000 to $19,999 | 0 (0.0%) | 0 (0.0%) |
| $20,000 to $24,999 | 0 (0.0%) | 0 (0.0%) |
| $25,000 to $34,999 | 29 (21.2%) | 0 (0.0%) |
| $35,000 to $49,999 | 0 (0.0%) | 0 (0.0%) |
| $50,000 to $74,999 | 0 (0.0%) | 0 (0.0%) |
| $75,000 to $99,999 | 51 (37.2%) | 0 (0.0%) |
| $100,000 to $149,999 | 0 (0.0%) | 0 (0.0%) |
| $150,000 or more | 47 (34.3%) | 0 (0.0%) |
| Total | 137 (100.0%) | 0 (0.0%) |
Monthly Housing Cost Tiers in Coyote Acres
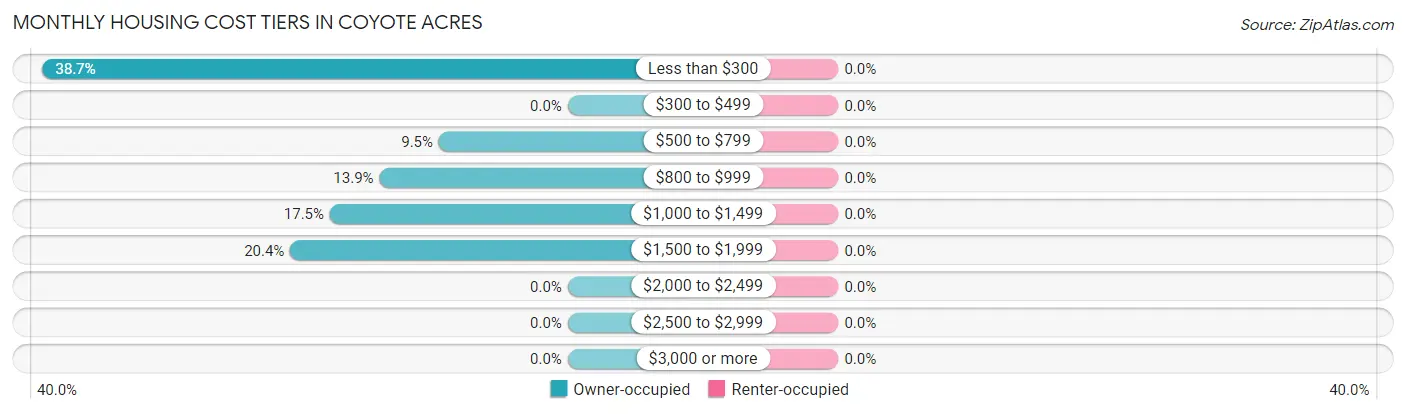
| Monthly Cost | Owner-occupied | Renter-occupied |
| Less than $300 | 53 (38.7%) | 0 (0.0%) |
| $300 to $499 | 0 (0.0%) | 0 (0.0%) |
| $500 to $799 | 13 (9.5%) | 0 (0.0%) |
| $800 to $999 | 19 (13.9%) | 0 (0.0%) |
| $1,000 to $1,499 | 24 (17.5%) | 0 (0.0%) |
| $1,500 to $1,999 | 28 (20.4%) | 0 (0.0%) |
| $2,000 to $2,499 | 0 (0.0%) | 0 (0.0%) |
| $2,500 to $2,999 | 0 (0.0%) | 0 (0.0%) |
| $3,000 or more | 0 (0.0%) | 0 (0.0%) |
| Total | 137 (100.0%) | 0 (0.0%) |
Physical Housing Characteristics in Coyote Acres
Housing Structures in Coyote Acres
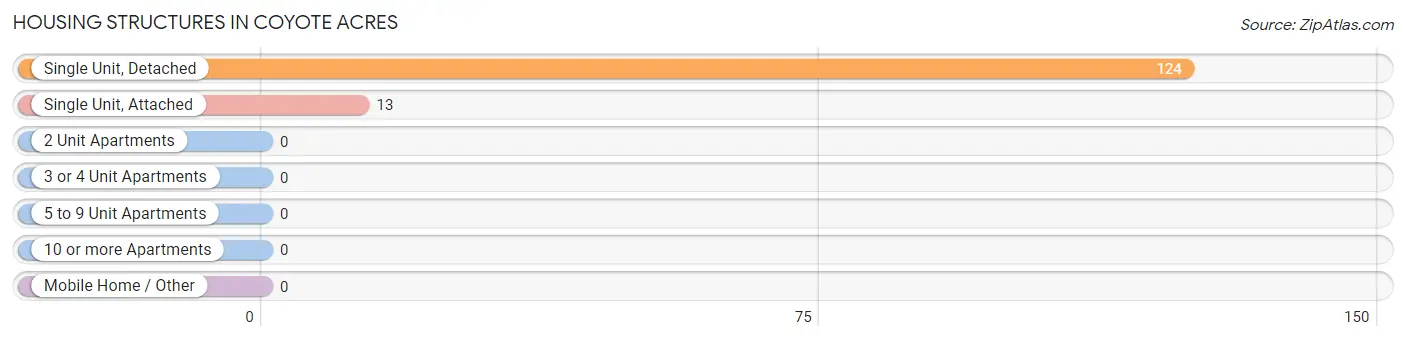
| Structure Type | # Housing Units | % Housing Units |
| Single Unit, Detached | 124 | 90.5% |
| Single Unit, Attached | 13 | 9.5% |
| 2 Unit Apartments | 0 | 0.0% |
| 3 or 4 Unit Apartments | 0 | 0.0% |
| 5 to 9 Unit Apartments | 0 | 0.0% |
| 10 or more Apartments | 0 | 0.0% |
| Mobile Home / Other | 0 | 0.0% |
| Total | 137 | 100.0% |
Housing Structures by Occupancy in Coyote Acres
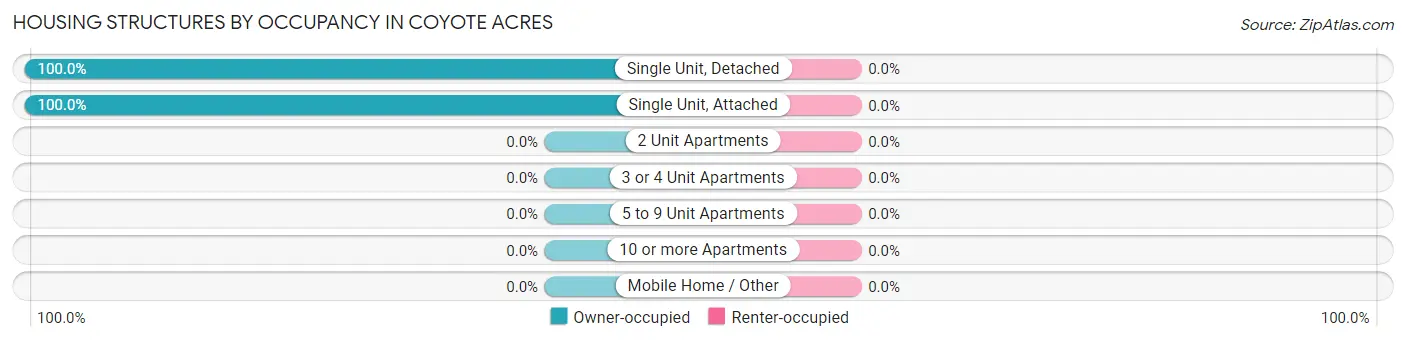
| Structure Type | Owner-occupied | Renter-occupied |
| Single Unit, Detached | 124 (100.0%) | 0 (0.0%) |
| Single Unit, Attached | 13 (100.0%) | 0 (0.0%) |
| 2 Unit Apartments | 0 (0.0%) | 0 (0.0%) |
| 3 or 4 Unit Apartments | 0 (0.0%) | 0 (0.0%) |
| 5 to 9 Unit Apartments | 0 (0.0%) | 0 (0.0%) |
| 10 or more Apartments | 0 (0.0%) | 0 (0.0%) |
| Mobile Home / Other | 0 (0.0%) | 0 (0.0%) |
| Total | 137 (100.0%) | 0 (0.0%) |
Housing Structures by Number of Rooms in Coyote Acres
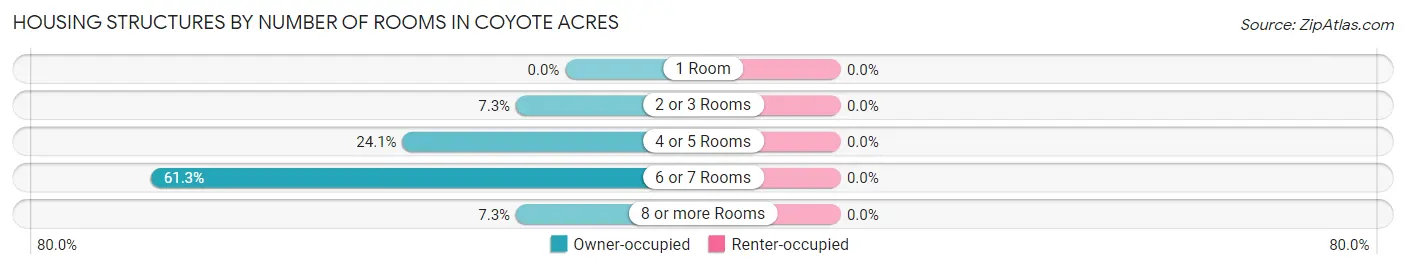
| Number of Rooms | Owner-occupied | Renter-occupied |
| 1 Room | 0 (0.0%) | 0 (0.0%) |
| 2 or 3 Rooms | 10 (7.3%) | 0 (0.0%) |
| 4 or 5 Rooms | 33 (24.1%) | 0 (0.0%) |
| 6 or 7 Rooms | 84 (61.3%) | 0 (0.0%) |
| 8 or more Rooms | 10 (7.3%) | 0 (0.0%) |
| Total | 137 (100.0%) | 0 (0.0%) |
Housing Structure by Heating Type in Coyote Acres
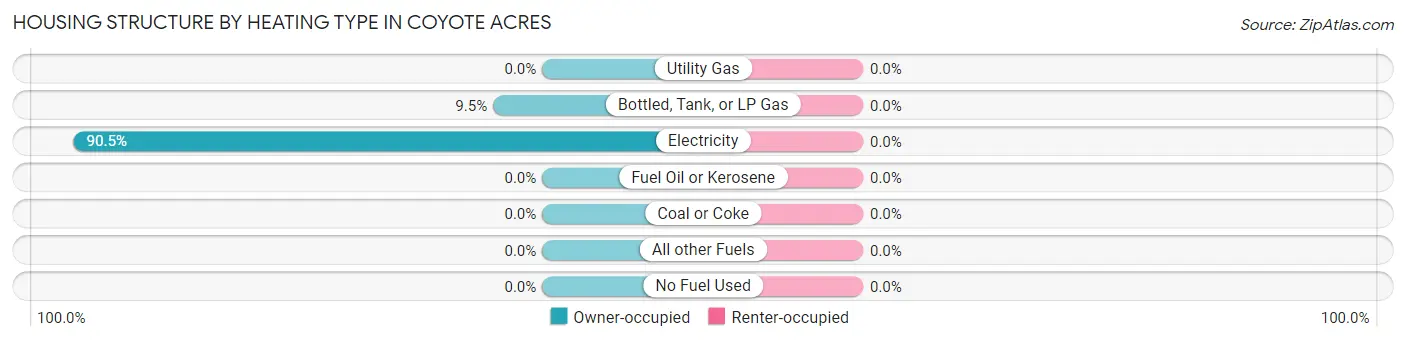
| Heating Type | Owner-occupied | Renter-occupied |
| Utility Gas | 0 (0.0%) | 0 (0.0%) |
| Bottled, Tank, or LP Gas | 13 (9.5%) | 0 (0.0%) |
| Electricity | 124 (90.5%) | 0 (0.0%) |
| Fuel Oil or Kerosene | 0 (0.0%) | 0 (0.0%) |
| Coal or Coke | 0 (0.0%) | 0 (0.0%) |
| All other Fuels | 0 (0.0%) | 0 (0.0%) |
| No Fuel Used | 0 (0.0%) | 0 (0.0%) |
| Total | 137 (100.0%) | 0 (0.0%) |
Household Vehicle Usage in Coyote Acres
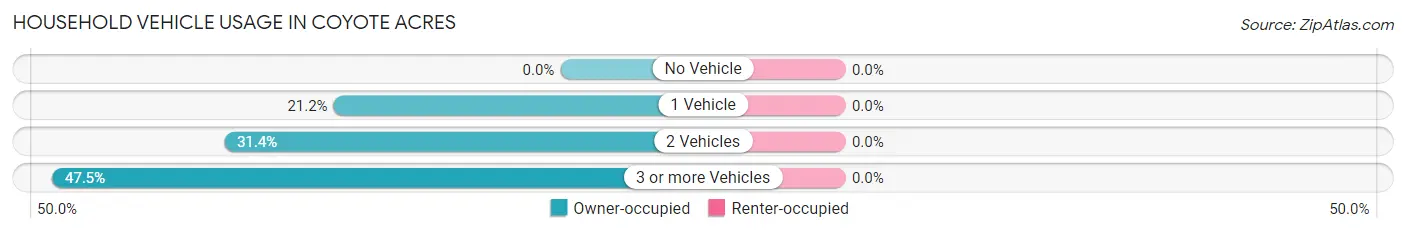
| Vehicles per Household | Owner-occupied | Renter-occupied |
| No Vehicle | 0 (0.0%) | 0 (0.0%) |
| 1 Vehicle | 29 (21.2%) | 0 (0.0%) |
| 2 Vehicles | 43 (31.4%) | 0 (0.0%) |
| 3 or more Vehicles | 65 (47.4%) | 0 (0.0%) |
| Total | 137 (100.0%) | 0 (0.0%) |
Real Estate & Mortgages in Coyote Acres
Real Estate and Mortgage Overview in Coyote Acres
| Characteristic | Without Mortgage | With Mortgage |
| Housing Units | 85 | 52 |
| Median Property Value | - | - |
| Median Household Income | - | - |
| Monthly Housing Costs | - | - |
| Real Estate Taxes | $626 | $0 |
Property Value by Mortgage Status in Coyote Acres
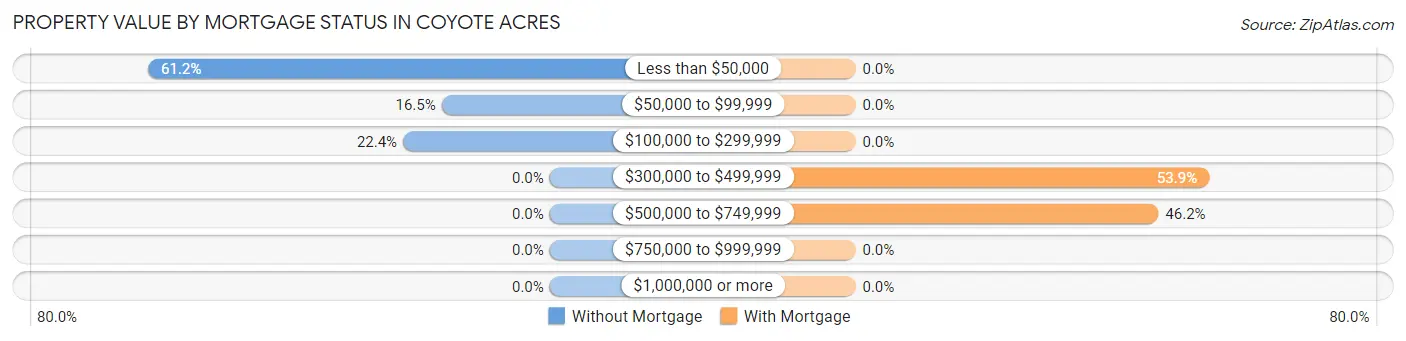
| Property Value | Without Mortgage | With Mortgage |
| Less than $50,000 | 52 (61.2%) | 0 (0.0%) |
| $50,000 to $99,999 | 14 (16.5%) | 0 (0.0%) |
| $100,000 to $299,999 | 19 (22.4%) | 0 (0.0%) |
| $300,000 to $499,999 | 0 (0.0%) | 28 (53.8%) |
| $500,000 to $749,999 | 0 (0.0%) | 24 (46.2%) |
| $750,000 to $999,999 | 0 (0.0%) | 0 (0.0%) |
| $1,000,000 or more | 0 (0.0%) | 0 (0.0%) |
| Total | 85 (100.0%) | 52 (100.0%) |
Household Income by Mortgage Status in Coyote Acres
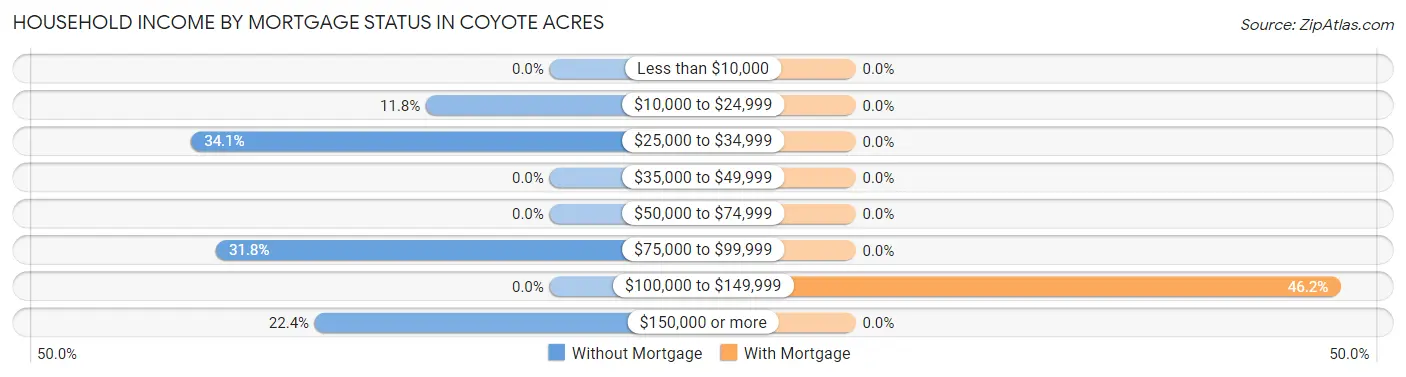
| Household Income | Without Mortgage | With Mortgage |
| Less than $10,000 | 0 (0.0%) | 0 (0.0%) |
| $10,000 to $24,999 | 10 (11.8%) | 0 (0.0%) |
| $25,000 to $34,999 | 29 (34.1%) | 0 (0.0%) |
| $35,000 to $49,999 | 0 (0.0%) | 0 (0.0%) |
| $50,000 to $74,999 | 0 (0.0%) | 0 (0.0%) |
| $75,000 to $99,999 | 27 (31.8%) | 0 (0.0%) |
| $100,000 to $149,999 | 0 (0.0%) | 24 (46.2%) |
| $150,000 or more | 19 (22.4%) | 0 (0.0%) |
| Total | 85 (100.0%) | 52 (100.0%) |
Property Value to Household Income Ratio in Coyote Acres
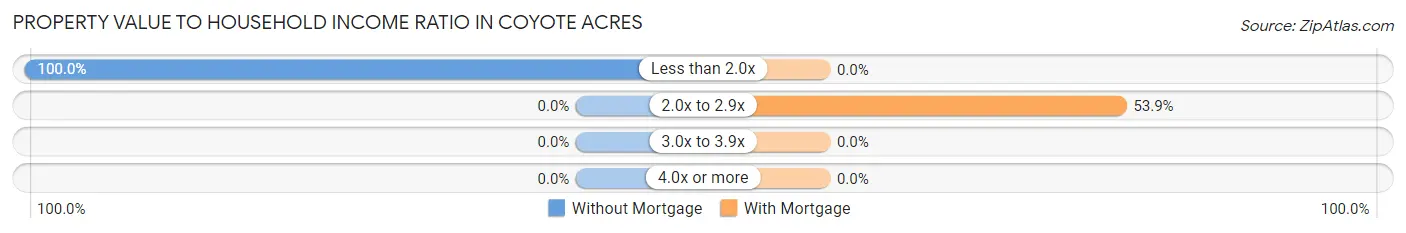
| Value-to-Income Ratio | Without Mortgage | With Mortgage |
| Less than 2.0x | 85 (100.0%) | 0 (0.0%) |
| 2.0x to 2.9x | 0 (0.0%) | 28 (53.8%) |
| 3.0x to 3.9x | 0 (0.0%) | 0 (0.0%) |
| 4.0x or more | 0 (0.0%) | 0 (0.0%) |
| Total | 85 (100.0%) | 52 (100.0%) |
Real Estate Taxes by Mortgage Status in Coyote Acres
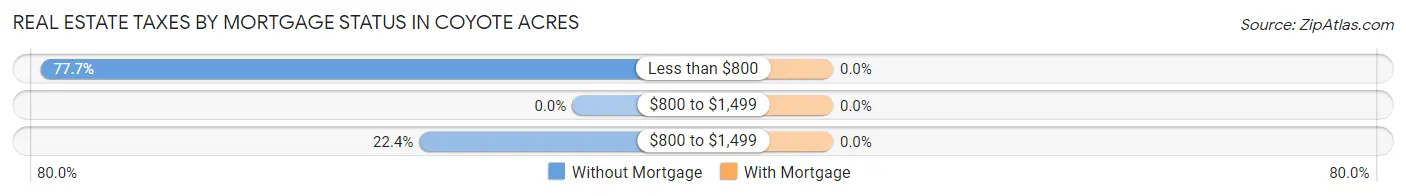
| Property Taxes | Without Mortgage | With Mortgage |
| Less than $800 | 66 (77.6%) | 0 (0.0%) |
| $800 to $1,499 | 0 (0.0%) | 0 (0.0%) |
| $800 to $1,499 | 19 (22.4%) | 0 (0.0%) |
| Total | 85 (100.0%) | 52 (100.0%) |
Health & Disability in Coyote Acres
Health Insurance Coverage by Age in Coyote Acres
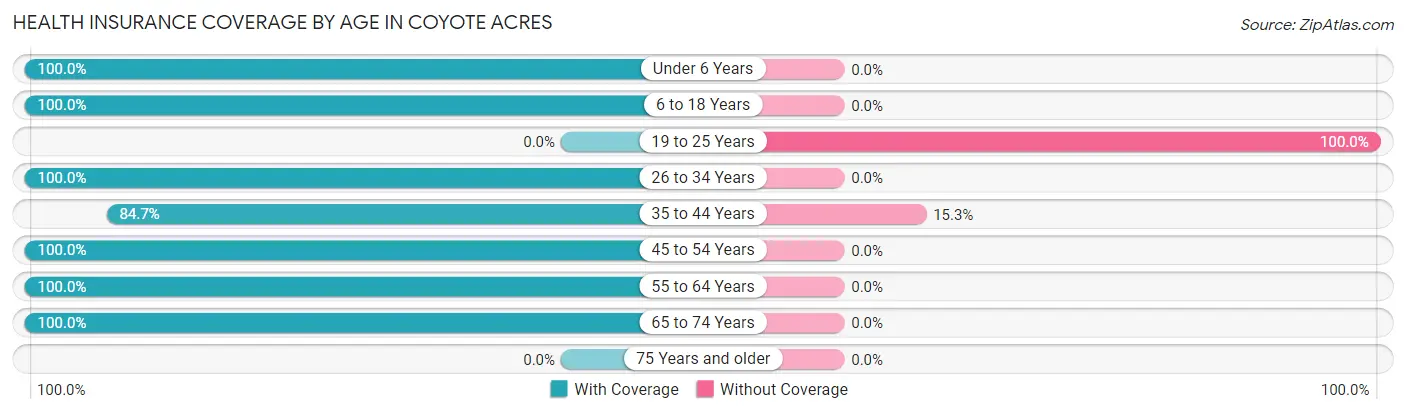
| Age Bracket | With Coverage | Without Coverage |
| Under 6 Years | 36 (100.0%) | 0 (0.0%) |
| 6 to 18 Years | 241 (100.0%) | 0 (0.0%) |
| 19 to 25 Years | 0 (0.0%) | 36 (100.0%) |
| 26 to 34 Years | 40 (100.0%) | 0 (0.0%) |
| 35 to 44 Years | 111 (84.7%) | 20 (15.3%) |
| 45 to 54 Years | 49 (100.0%) | 0 (0.0%) |
| 55 to 64 Years | 85 (100.0%) | 0 (0.0%) |
| 65 to 74 Years | 60 (100.0%) | 0 (0.0%) |
| 75 Years and older | 0 (0.0%) | 0 (0.0%) |
| Total | 622 (91.7%) | 56 (8.3%) |
Health Insurance Coverage by Citizenship Status in Coyote Acres
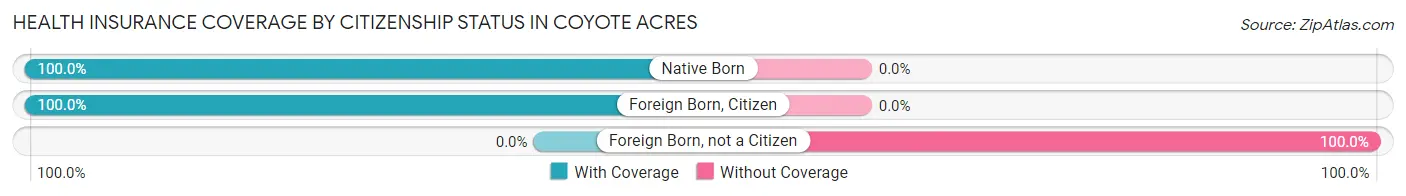
| Citizenship Status | With Coverage | Without Coverage |
| Native Born | 36 (100.0%) | 0 (0.0%) |
| Foreign Born, Citizen | 241 (100.0%) | 0 (0.0%) |
| Foreign Born, not a Citizen | 0 (0.0%) | 36 (100.0%) |
Health Insurance Coverage by Household Income in Coyote Acres
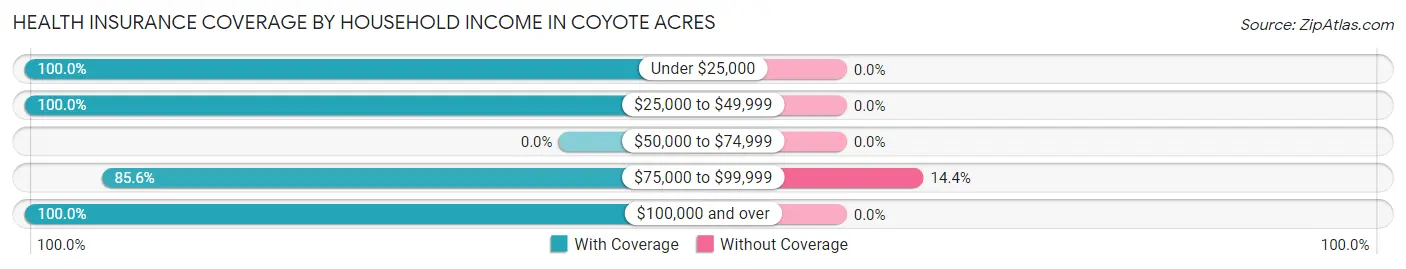
| Household Income | With Coverage | Without Coverage |
| Under $25,000 | 19 (100.0%) | 0 (0.0%) |
| $25,000 to $49,999 | 48 (100.0%) | 0 (0.0%) |
| $50,000 to $74,999 | 0 (0.0%) | 0 (0.0%) |
| $75,000 to $99,999 | 333 (85.6%) | 56 (14.4%) |
| $100,000 and over | 222 (100.0%) | 0 (0.0%) |
Public vs Private Health Insurance Coverage by Age in Coyote Acres
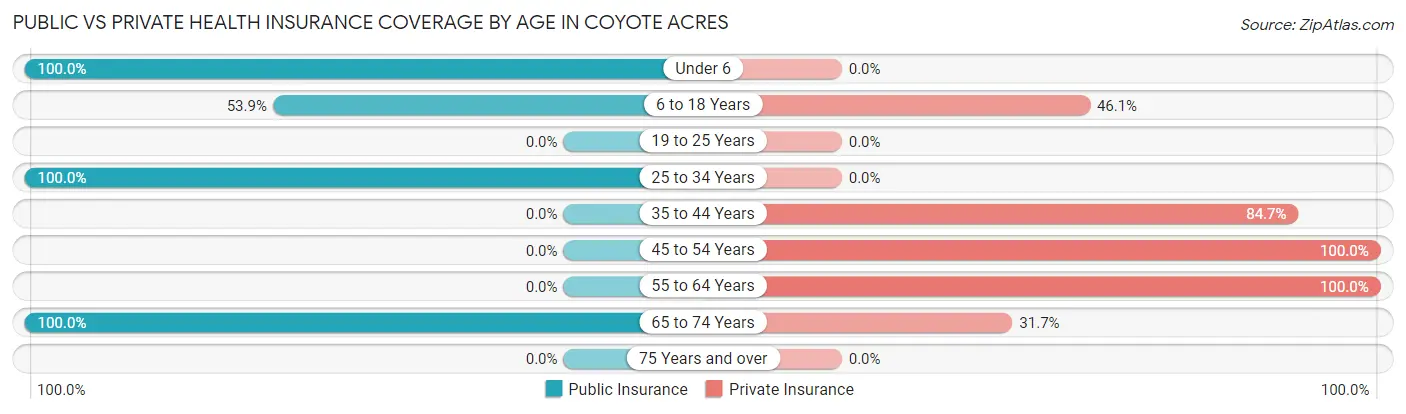
| Age Bracket | Public Insurance | Private Insurance |
| Under 6 | 36 (100.0%) | 0 (0.0%) |
| 6 to 18 Years | 130 (53.9%) | 111 (46.1%) |
| 19 to 25 Years | 0 (0.0%) | 0 (0.0%) |
| 25 to 34 Years | 40 (100.0%) | 0 (0.0%) |
| 35 to 44 Years | 0 (0.0%) | 111 (84.7%) |
| 45 to 54 Years | 0 (0.0%) | 49 (100.0%) |
| 55 to 64 Years | 0 (0.0%) | 85 (100.0%) |
| 65 to 74 Years | 60 (100.0%) | 19 (31.7%) |
| 75 Years and over | 0 (0.0%) | 0 (0.0%) |
| Total | 266 (39.2%) | 375 (55.3%) |
Disability Status by Sex by Age in Coyote Acres
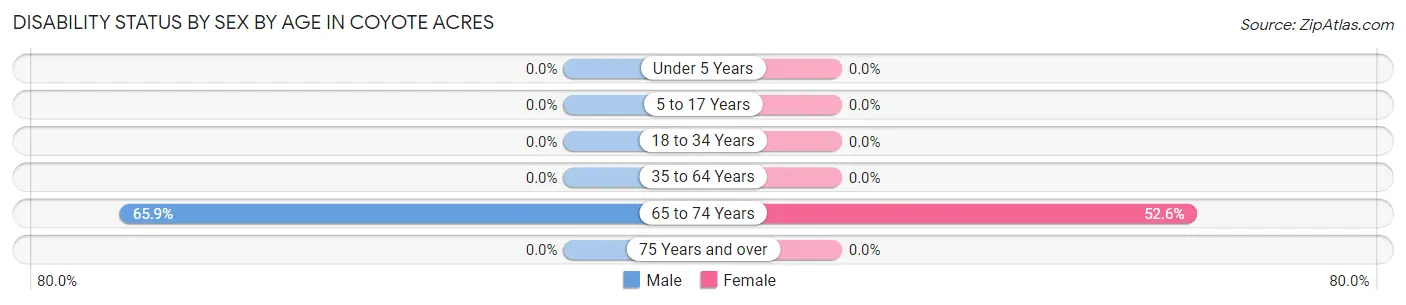
| Age Bracket | Male | Female |
| Under 5 Years | 0 (0.0%) | 0 (0.0%) |
| 5 to 17 Years | 0 (0.0%) | 0 (0.0%) |
| 18 to 34 Years | 0 (0.0%) | 0 (0.0%) |
| 35 to 64 Years | 0 (0.0%) | 0 (0.0%) |
| 65 to 74 Years | 27 (65.8%) | 10 (52.6%) |
| 75 Years and over | 0 (0.0%) | 0 (0.0%) |
Disability Class by Sex by Age in Coyote Acres
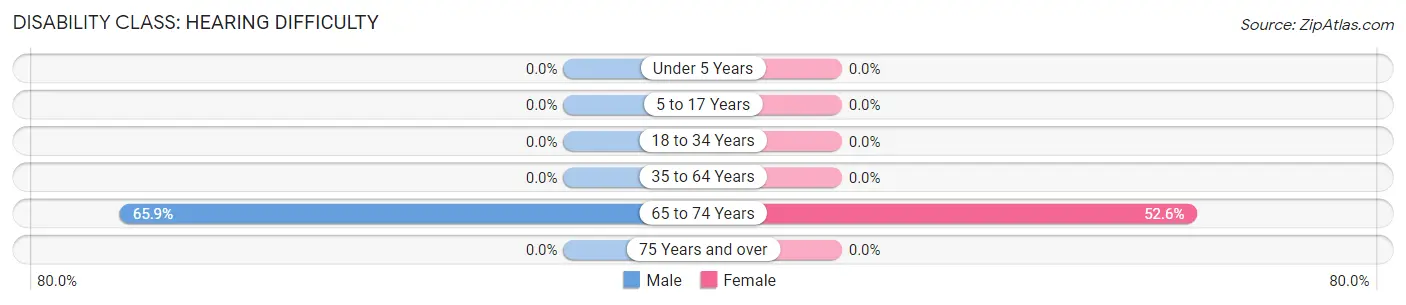
Disability Class: Hearing Difficulty
| Age Bracket | Male | Female |
| Under 5 Years | 0 (0.0%) | 0 (0.0%) |
| 5 to 17 Years | 0 (0.0%) | 0 (0.0%) |
| 18 to 34 Years | 0 (0.0%) | 0 (0.0%) |
| 35 to 64 Years | 0 (0.0%) | 0 (0.0%) |
| 65 to 74 Years | 27 (65.8%) | 10 (52.6%) |
| 75 Years and over | 0 (0.0%) | 0 (0.0%) |
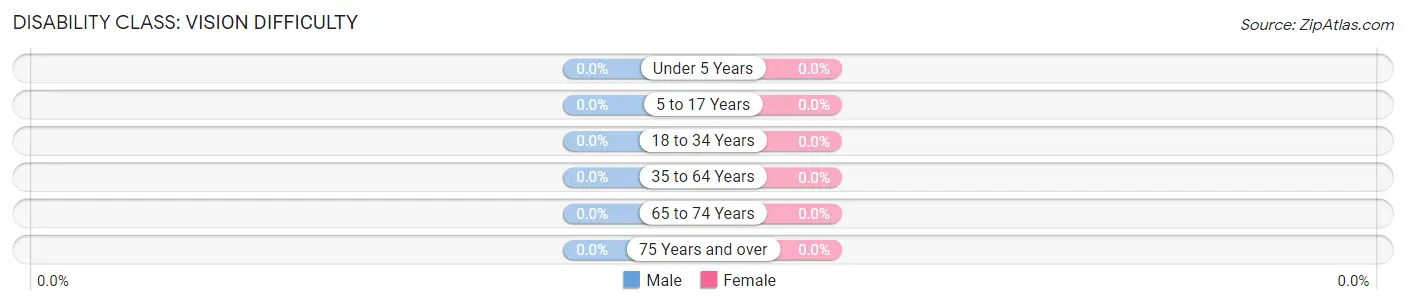
Disability Class: Vision Difficulty
| Age Bracket | Male | Female |
| Under 5 Years | 0 (0.0%) | 0 (0.0%) |
| 5 to 17 Years | 0 (0.0%) | 0 (0.0%) |
| 18 to 34 Years | 0 (0.0%) | 0 (0.0%) |
| 35 to 64 Years | 0 (0.0%) | 0 (0.0%) |
| 65 to 74 Years | 0 (0.0%) | 0 (0.0%) |
| 75 Years and over | 0 (0.0%) | 0 (0.0%) |
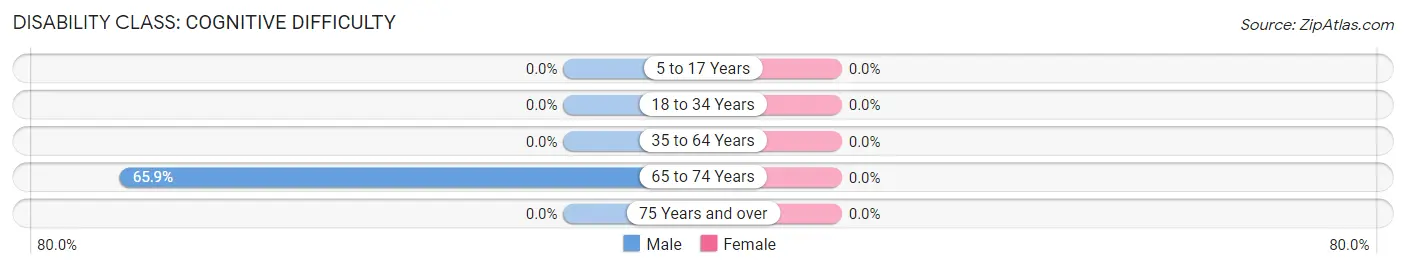
Disability Class: Cognitive Difficulty
| Age Bracket | Male | Female |
| 5 to 17 Years | 0 (0.0%) | 0 (0.0%) |
| 18 to 34 Years | 0 (0.0%) | 0 (0.0%) |
| 35 to 64 Years | 0 (0.0%) | 0 (0.0%) |
| 65 to 74 Years | 27 (65.8%) | 0 (0.0%) |
| 75 Years and over | 0 (0.0%) | 0 (0.0%) |
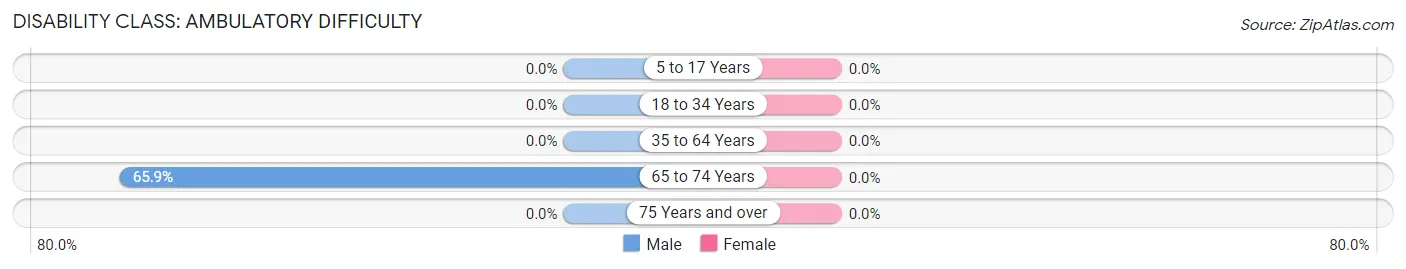
Disability Class: Ambulatory Difficulty
| Age Bracket | Male | Female |
| 5 to 17 Years | 0 (0.0%) | 0 (0.0%) |
| 18 to 34 Years | 0 (0.0%) | 0 (0.0%) |
| 35 to 64 Years | 0 (0.0%) | 0 (0.0%) |
| 65 to 74 Years | 27 (65.8%) | 0 (0.0%) |
| 75 Years and over | 0 (0.0%) | 0 (0.0%) |
Disability Class: Self-Care Difficulty
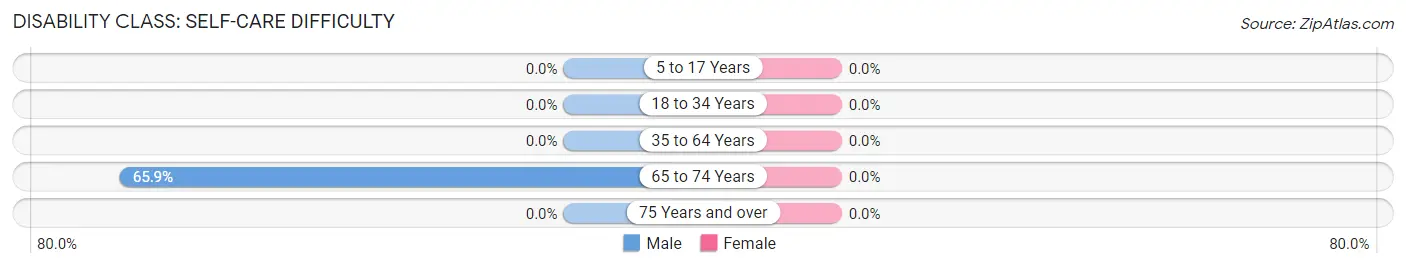
| Age Bracket | Male | Female |
| 5 to 17 Years | 0 (0.0%) | 0 (0.0%) |
| 18 to 34 Years | 0 (0.0%) | 0 (0.0%) |
| 35 to 64 Years | 0 (0.0%) | 0 (0.0%) |
| 65 to 74 Years | 27 (65.8%) | 0 (0.0%) |
| 75 Years and over | 0 (0.0%) | 0 (0.0%) |
Technology Access in Coyote Acres
Computing Device Access in Coyote Acres
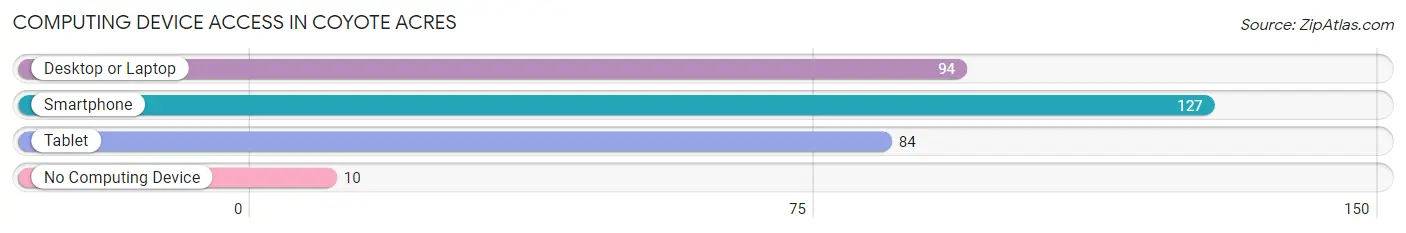
| Device Type | # Households | % Households |
| Desktop or Laptop | 94 | 68.6% |
| Smartphone | 127 | 92.7% |
| Tablet | 84 | 61.3% |
| No Computing Device | 10 | 7.3% |
| Total | 137 | 100.0% |
Internet Access in Coyote Acres
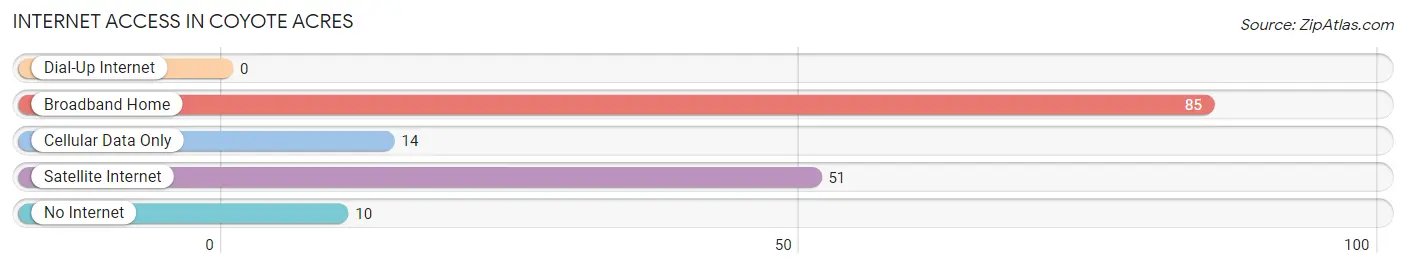
| Internet Type | # Households | % Households |
| Dial-Up Internet | 0 | 0.0% |
| Broadband Home | 85 | 62.0% |
| Cellular Data Only | 14 | 10.2% |
| Satellite Internet | 51 | 37.2% |
| No Internet | 10 | 7.3% |
| Total | 137 | 100.0% |
Coyote Acres Summary
Coyote Acres, Texas is a small unincorporated community located in the western part of the state, in the county of Brewster. It is situated in the Chihuahuan Desert, near the Rio Grande River, and is surrounded by the Big Bend National Park. The area is known for its rugged terrain and stunning views of the surrounding mountains.
History
The area that is now Coyote Acres was first settled by Native Americans, who lived in the area for centuries before the arrival of Europeans. The first Europeans to settle in the area were Spanish missionaries, who established a mission in the area in the late 1700s. The mission was abandoned in the early 1800s, and the area was largely uninhabited until the late 1800s, when ranchers began to move into the area.
The first permanent settlement in the area was established in the late 1800s, when a group of ranchers and farmers moved into the area and established the town of Coyote Acres. The town was named after the coyotes that were common in the area. The town grew slowly, and by the early 1900s, it had a population of around 200 people.
Geography
Coyote Acres is located in the western part of Texas, in the county of Brewster. It is situated in the Chihuahuan Desert, near the Rio Grande River, and is surrounded by the Big Bend National Park. The area is known for its rugged terrain and stunning views of the surrounding mountains. The town is located at an elevation of 2,400 feet, and the average temperature in the area is around 70 degrees Fahrenheit.
Economy
The economy of Coyote Acres is largely based on agriculture and ranching. The area is known for its cattle and sheep ranching, as well as its production of cotton, wheat, and other crops. The town also has a small tourism industry, as it is located near the Big Bend National Park.
Demographics
As of the 2010 census, the population of Coyote Acres was 1,072. The population is largely Hispanic, with around 90% of the population identifying as Hispanic or Latino. The median household income in the area is around $30,000, and the median age is around 40 years old. The town is largely rural, with around 95% of the population living in rural areas.
Conclusion
Coyote Acres, Texas is a small unincorporated community located in the western part of the state, in the county of Brewster. It is situated in the Chihuahuan Desert, near the Rio Grande River, and is surrounded by the Big Bend National Park. The area is known for its rugged terrain and stunning views of the surrounding mountains. The economy of Coyote Acres is largely based on agriculture and ranching, and the population is largely Hispanic. The town is largely rural, with around 95% of the population living in rural areas.
Common Questions
What is Per Capita Income in Coyote Acres?
Per Capita income in Coyote Acres is $35,820.
What is the Median Family Income in Coyote Acres?
Median Family Income in Coyote Acres is $90,972.
What is the Median Household income in Coyote Acres?
Median Household Income in Coyote Acres is $90,509.
What is Income or Wage Gap in Coyote Acres?
Income or Wage Gap in Coyote Acres is 82.5%.
Women in Coyote Acres earn 17.5 cents for every dollar earned by a man.
What is Inequality or Gini Index in Coyote Acres?
Inequality or Gini Index in Coyote Acres is 0.49.
What is the Total Population of Coyote Acres?
Total Population of Coyote Acres is 678.
What is the Total Male Population of Coyote Acres?
Total Male Population of Coyote Acres is 377.
What is the Total Female Population of Coyote Acres?
Total Female Population of Coyote Acres is 301.
What is the Ratio of Males per 100 Females in Coyote Acres?
There are 125.25 Males per 100 Females in Coyote Acres.
What is the Ratio of Females per 100 Males in Coyote Acres?
There are 79.84 Females per 100 Males in Coyote Acres.
What is the Median Population Age in Coyote Acres?
Median Population Age in Coyote Acres is 34.3 Years.
What is the Average Family Size in Coyote Acres
Average Family Size in Coyote Acres is 5.3 People.
What is the Average Household Size in Coyote Acres
Average Household Size in Coyote Acres is 5.0 People.
How Large is the Labor Force in Coyote Acres?
There are 284 People in the Labor Forcein in Coyote Acres.
What is the Percentage of People in the Labor Force in Coyote Acres?
63.8% of People are in the Labor Force in Coyote Acres.
What is the Unemployment Rate in Coyote Acres?
Unemployment Rate in Coyote Acres is 10.6%.